4.1. Determination of the Range of Superficial Gas Velocity
The fluidization starts when the pressure drop across the bed is equal to the weight of the bed divided by its cross-section area (
Pwb). Before fluidization, in the fixed primary condition, the bed pressure drop (Δ
Pb) linearly increases when increasing the superficial gas velocity (
). According to theory [
11], when Δ
Pb approaches
Pwb, it begins to saturate, that is, there is no change in Δ
Pb when increasing gas velocity. However, when inter-particle adhesive forces are dominant, actual practices [
11] show that the pressure drop balances
Pwb at a theoretical level of
, but that inter-particle forces prevent the particle bed from fluidization albeit the gas velocity is increased above
. Then, there is a peak in the bed pressure drop, which is observed due to the extra pressure required to overcome these forces. This behaviour can also happen due to a pre-compaction of the bed, or due to wall effects for a small bed diameter.
The
is defined as the intersection point of linearly extrapolating the fixed bed line (in Δ
Pb vs.
curve) and the fully fluidized state line. By considering the well-known Ergun equation [
34] for the pressure drop of a gas stream across a packed bed and assuming negligible cohesive force between particles, the pressure drop at
should be equal to the weight per cross section area of the particle bed. By substituting this equation and after some simplifications, Wen and Yu [
35] indicated that the Reynolds number at minimum fluidization condition (
) is given for a wide range of particle Reynolds numbers (0.001 < Re < 4000) as:
Then,
can easily be given by
Grace [
36] proposes 27.2 instead of 33.7 suggested by Wen and Yu (Equation (3)) to improve the results for fine particles. His equation is then
Another helpful empirical equation for calculating
was proposed by Leva [
37] as
where
is the dynamic gas viscosity. Note that all these equations were obtained based on experimental observations for particles with
> 20 µm.
For smaller particles, by considering the van der Waals cohesive force between particles, Xu and Zhu [
38] offered a new equation for Group C-particles as
where
is the void fraction in minimum fluidization condition and
is particle sphericity. In addition,
and
represent the gravitational and cohesive effects, respectively. Considering mechanical vibration as a fluidization aid, they offered the following equation for estimating
as
In addition,
and
can be calculated as
where
is the settled bed height (initial bed height). When the initial bed height is not measured, it can be estimated by
where
is the bed cross section area and
is the total mass of the particle bed.
Using Equations (3), (5) and (6) for fine particles, the minimum fluidization velocities are calculated as 0.128, 0.159 and 0.157 cm/s, respectively. Using Equation (7), is predicted as 0.01185 cm/s for ultra-fine particles. However, since the in Equation (10) is obtained by considering mechanical vibration—a feature that is not used in the present study, the value of calculated with Equation (7) is expected to be much smaller than the real for a bed consisting of ultra-fine powders without any fluidization aid.
It should be noted here that any meaningful quantification of
is practically impossible for ultra-fine cohesive powders (as already clear from previous studies [
1,
2]). In fact, due to the formation, destruction and re-formation of cracks and channels, measurements of the bed pressure drop for ultra-fine cohesive powders are non-reproducible, showing highly unsteady features. The bed structure of this kind of material can become suddenly disrupted at some characteristic velocity. After disruption, a superficial gas velocity that matches the maximum bed pressure drop is observed. Hereafter, the corresponding velocity is called after-disruption velocity,
. The point where the process reaches the after-disruption condition is also called the peak point, since it corresponds with the maximum of
. In Reference [
2], the use of this velocity
instead of
is suggested for comparison between different fluidization processes.
When increasing the superficial gas velocity, it is expected that the smaller particles start to elutriate before the coarse particles. At the same time, at higher superficial gas velocity, it is expected that notable aggregation occurs between ultra-fine cohesive powders. The ratio of the effective size of these agglomerates to the size of the single particles increases with decreasing size of the single particles. The density and the effective mean size of the formed clusters (agglomerates) are such that
for the mixture will be far higher than
for a single particle class. This explains why a bed of ultra-fine particles remains unfluidized at gas velocities that are several times the
corresponding to mean diameter of the individual particle. Turki and Fatah [
39] reported that, for nanoparticles, this can be up to 3 × 10
6 times the gas velocity for fluidizing the single particles. The measurements of the portion of elutriated particles from the bed in this study show that the range of the minimum fluidization velocity ratio for ultra-fine (micron size) powders is not so large.
The measured superficial gas velocities for starting partial fluidization combined with the measurement of particle size distribution and weight of material remaining in the column after fluidization, show that the loss of particles due to elutriation and their exit from the fluidization column is negligible even up to about 1200 times the calculated of single particles. This is due to the formation of agglomerates at higher velocities and dominant cohesive forces. Nevertheless, by increasing superficial gas velocity to achieve ultra-fine fluidization, the elutriation losses generally increase. Considering all these issues together, the velocity range for all fluidizations lies between 0–15 cm/s. The superficial gas velocity is increased from zero to the maximum velocity in 35 equal steps for all the fluidization loading processes and is decreased in 18 steps for all unloading processes.
4.2. Fluidization of Fine and Ultra-Fine Particles Separately
The experimental tests start with the results of fluidization tests for fine and ultra-fine particles separately, before investigating the effect of the presence of some specified percentage of ultra-fine powders on fluidization of a fine-particle bed.
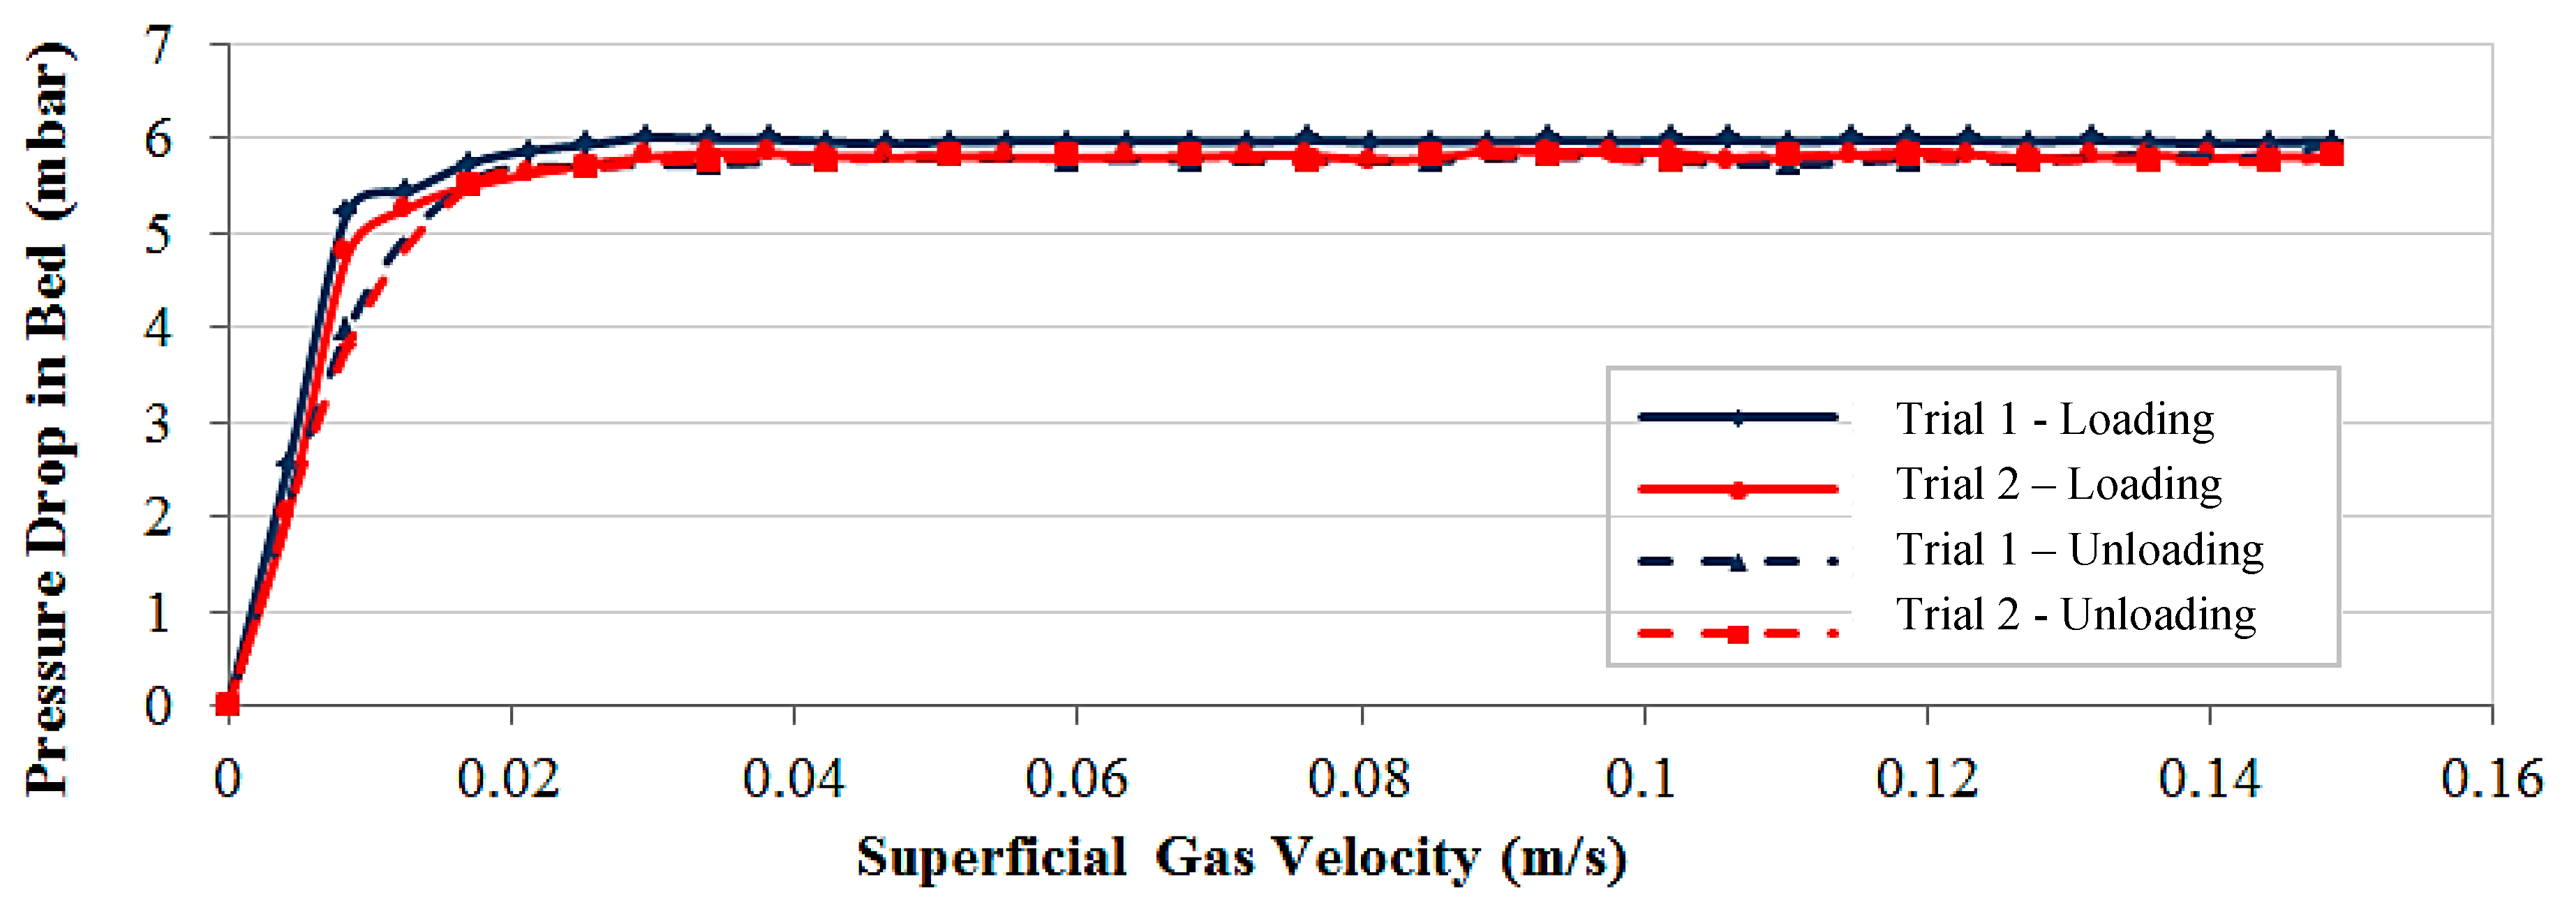
Figure 4 and
Figure 5 show the fluidization curve, that is, the variation of bed pressure drop (
) when increasing superficial gas velocity (
), for two independent fluidization tests for CALCIT MVT 100 (fine material) and CALCIT MX 10 (ultra-fine material), respectively. For each superficial gas velocity, ample time (up to 5 min) is considered to ensure that the bed pressure drops have reached stable values before recording is started. In fact, for fine particles, steady-state conditions are really obtained. However, for ultra-fine powder, the fluctuations in the bed pressure drop can remain relatively high. Here, the pressure drops presented in this work are the mean value, averaged over the last minute of the recording for each superficial gas velocity (it means, if the ample time is 5 min for each record, the averaging has been done during the fifth minute, not for whole five minutes).
4.2.1. Fine Particle Bed Fluidization
a. Loading: The fine (Group A) particles fluidization at
shows an almost homogeneous non-bubbling fluidization followed by bubbling fluidization as gas velocity increases. Before
, in the fixed bed state, the pressure drop increases linearly when increasing the superficial gas velocity. According to Ergun’s equation [
34], the gas pressure drop during the passage of a fluid through a porous medium (fixed bed) is calculated as
In the fixed bed zone, the superficial gas velocities are very low. Therefore, the first term on the right side of the Ergun Equation (viscous term), which corresponds to the Blake-Kozeny equation for laminar flow is much larger than the second term (kinetic term), which corresponds to the Burke-Plummer equation for turbulent flow. Consequently, the variation of bed pressure drop with gas velocity is almost linear.
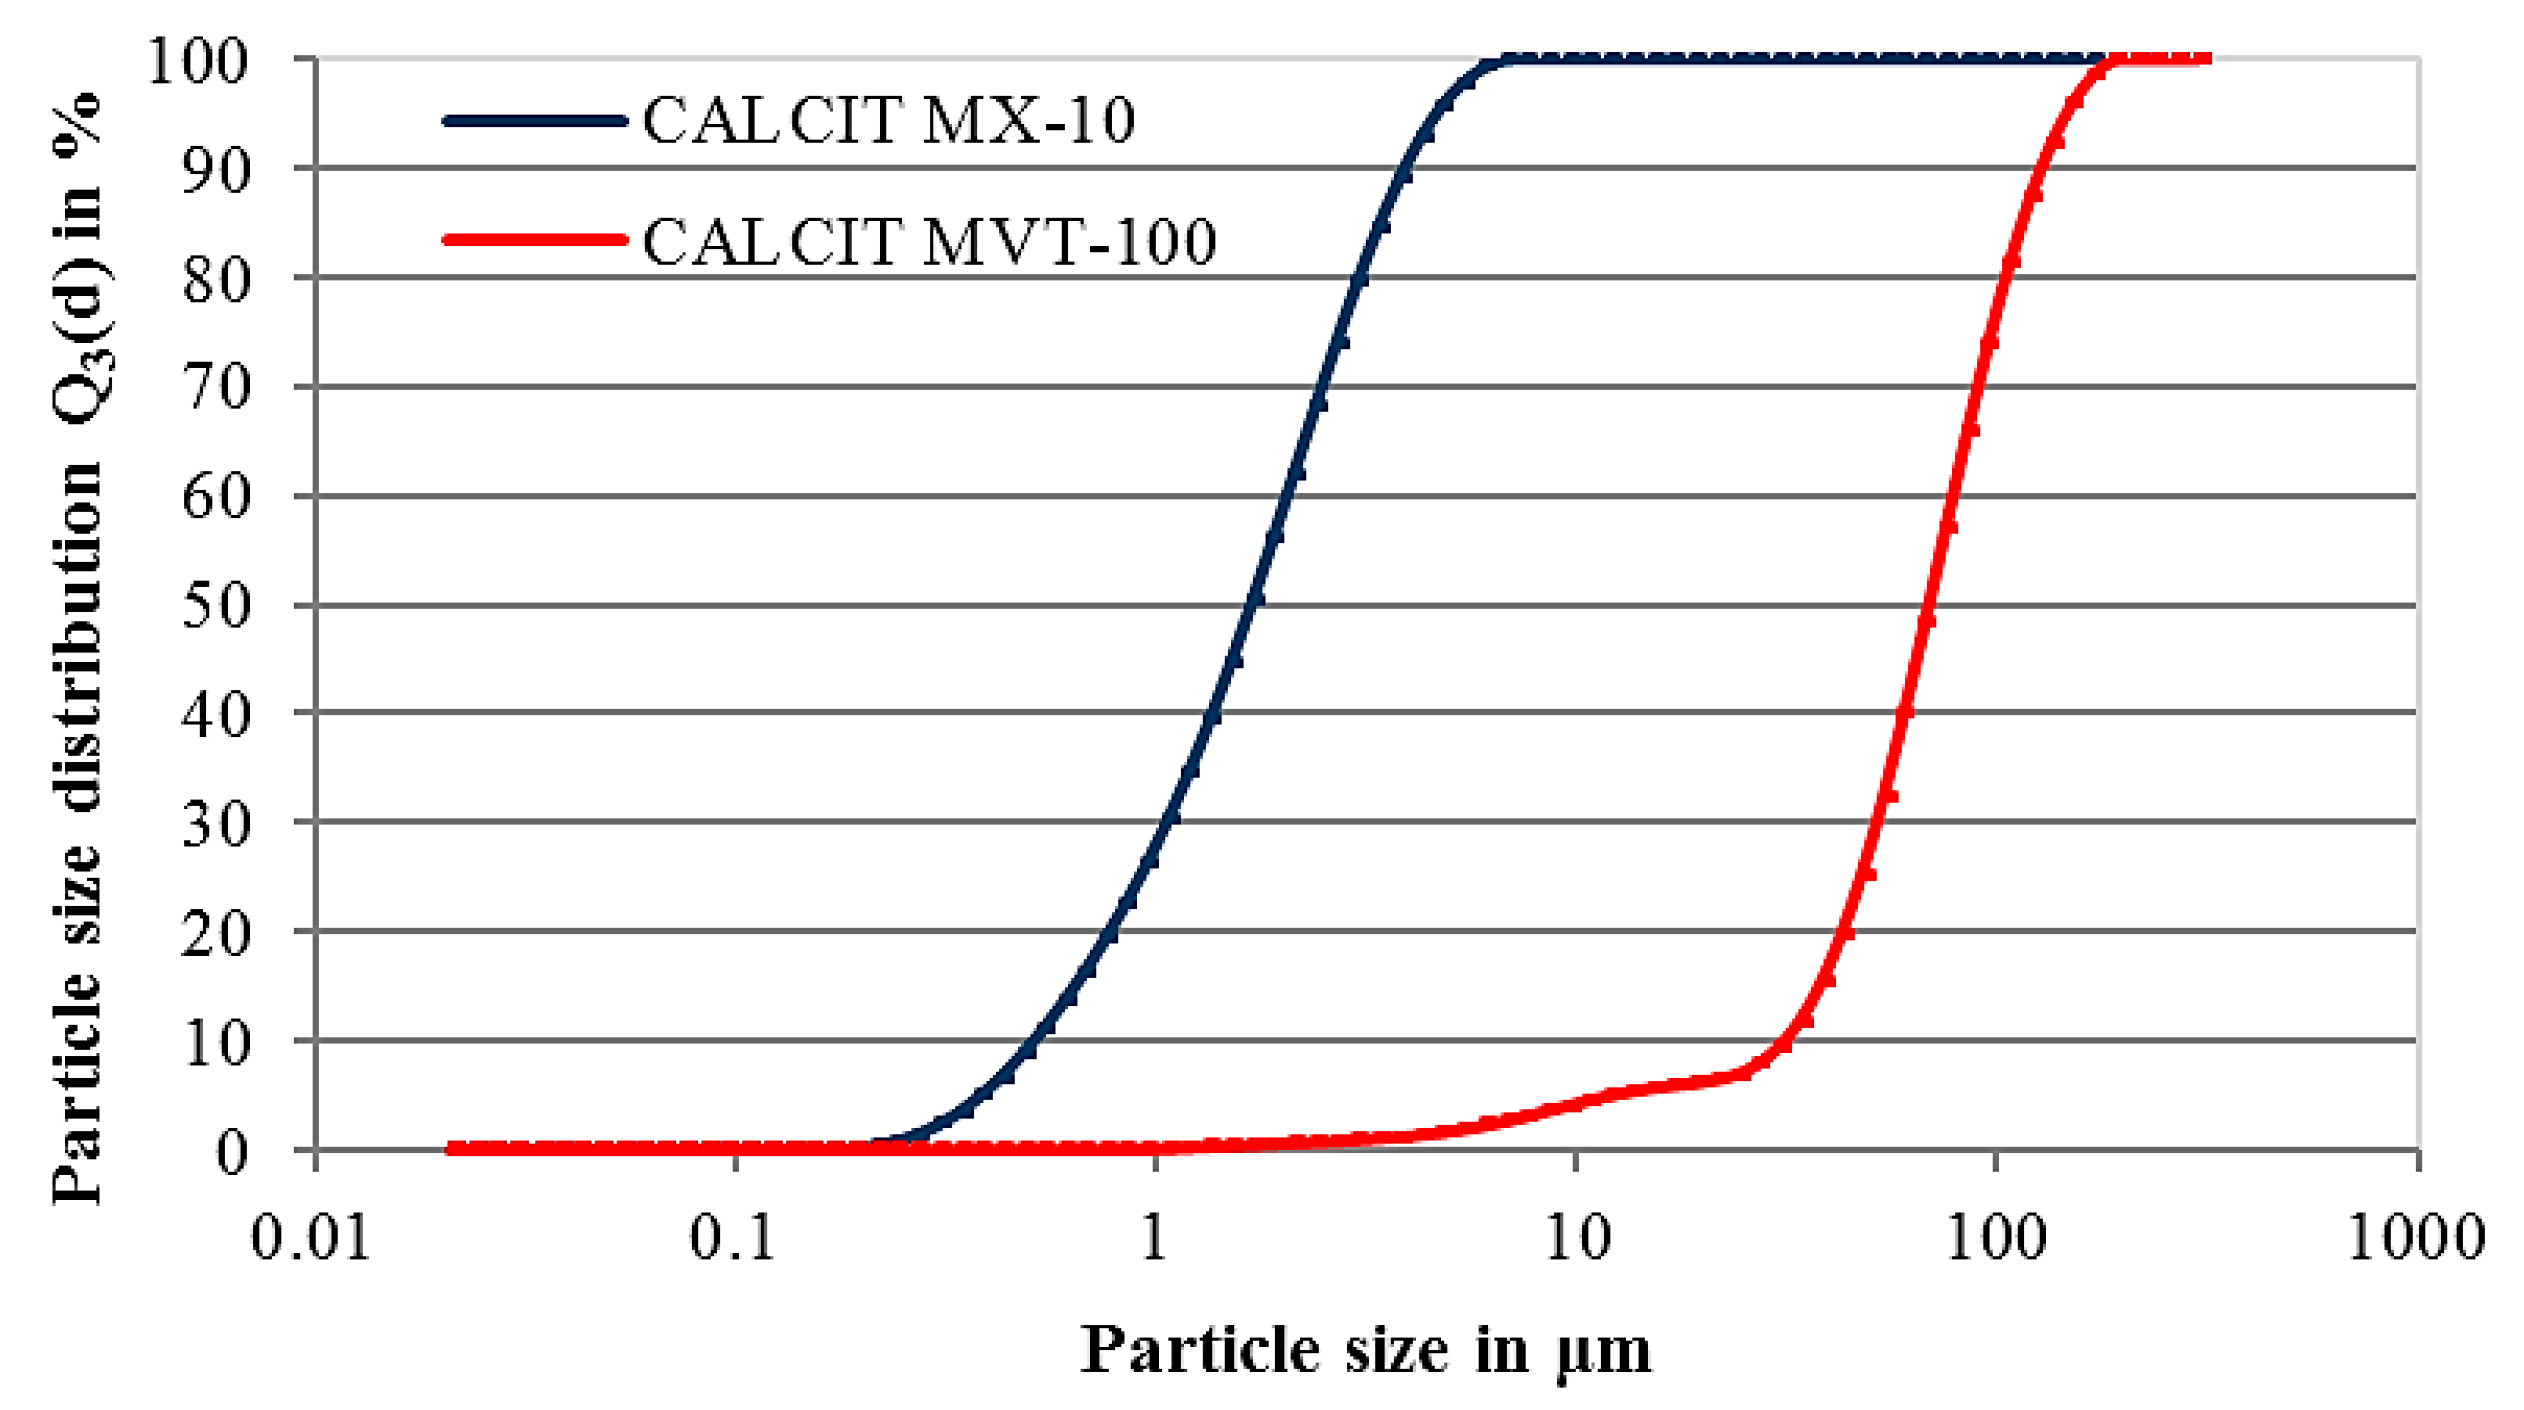
The fluidization curve smoothly saturates at the fully fluidized state (
Figure 4). This is because the fine material used in this study has a wide particle size distribution (PSD), from 1 µm to about 200 µm (
Figure 1). Wide size distribution of particles has different effects on the fluidization behaviour, such as smaller void sizes [
40], a greater air retention capacity [
41], enhanced fluidity, increased segregation and partial mixing [
42]. A wide PSD also reduces the bubble size in bubbling fluidization mode [
43]. Fluidization starts as an increase in bed height. The expansion of the bed before starting bubble formation is a result of the nucleation of micro-cavities in the bed. The size range of these cavities is between one and ten particle diameters. For this condition (bubble-free), by increasing the gas velocity, the number of cavities does not change, but their size starts to increase [
3]. The cohesive force between particles fixes the cavities’ walls and disconnection of weakly-bonded particles is the reason for developing cavity growth. After that, when increasing gas velocity, bubbling occurs. It should be recalled here that Archimedes number for the used fine material is about 5.315 and the bed height to diameter ratio is
< 1. Thus, when increasing gas velocity, only bubbling happens and there is no slugging behaviour [
32]. However, the dissipation of energy during the bubbling condition is very low and it does not lead to important changes in the bed pressure drop. Therefore, after starting fluidization, the pressure drop is almost constant.
b. Unloading:Figure 4 also shows that the fluidization loading and unloading curves follow one another closely; only a slight hysteresis effect is evident. In fact, for this kind of material, weak cohesive forces between particles result in decreasing extra-energy for overcoming such forces in fluidization loading. Small hysteresis effects in this material are due to collisions between particles, some irreversible deformations [
44] and limited segregation effects [
45].
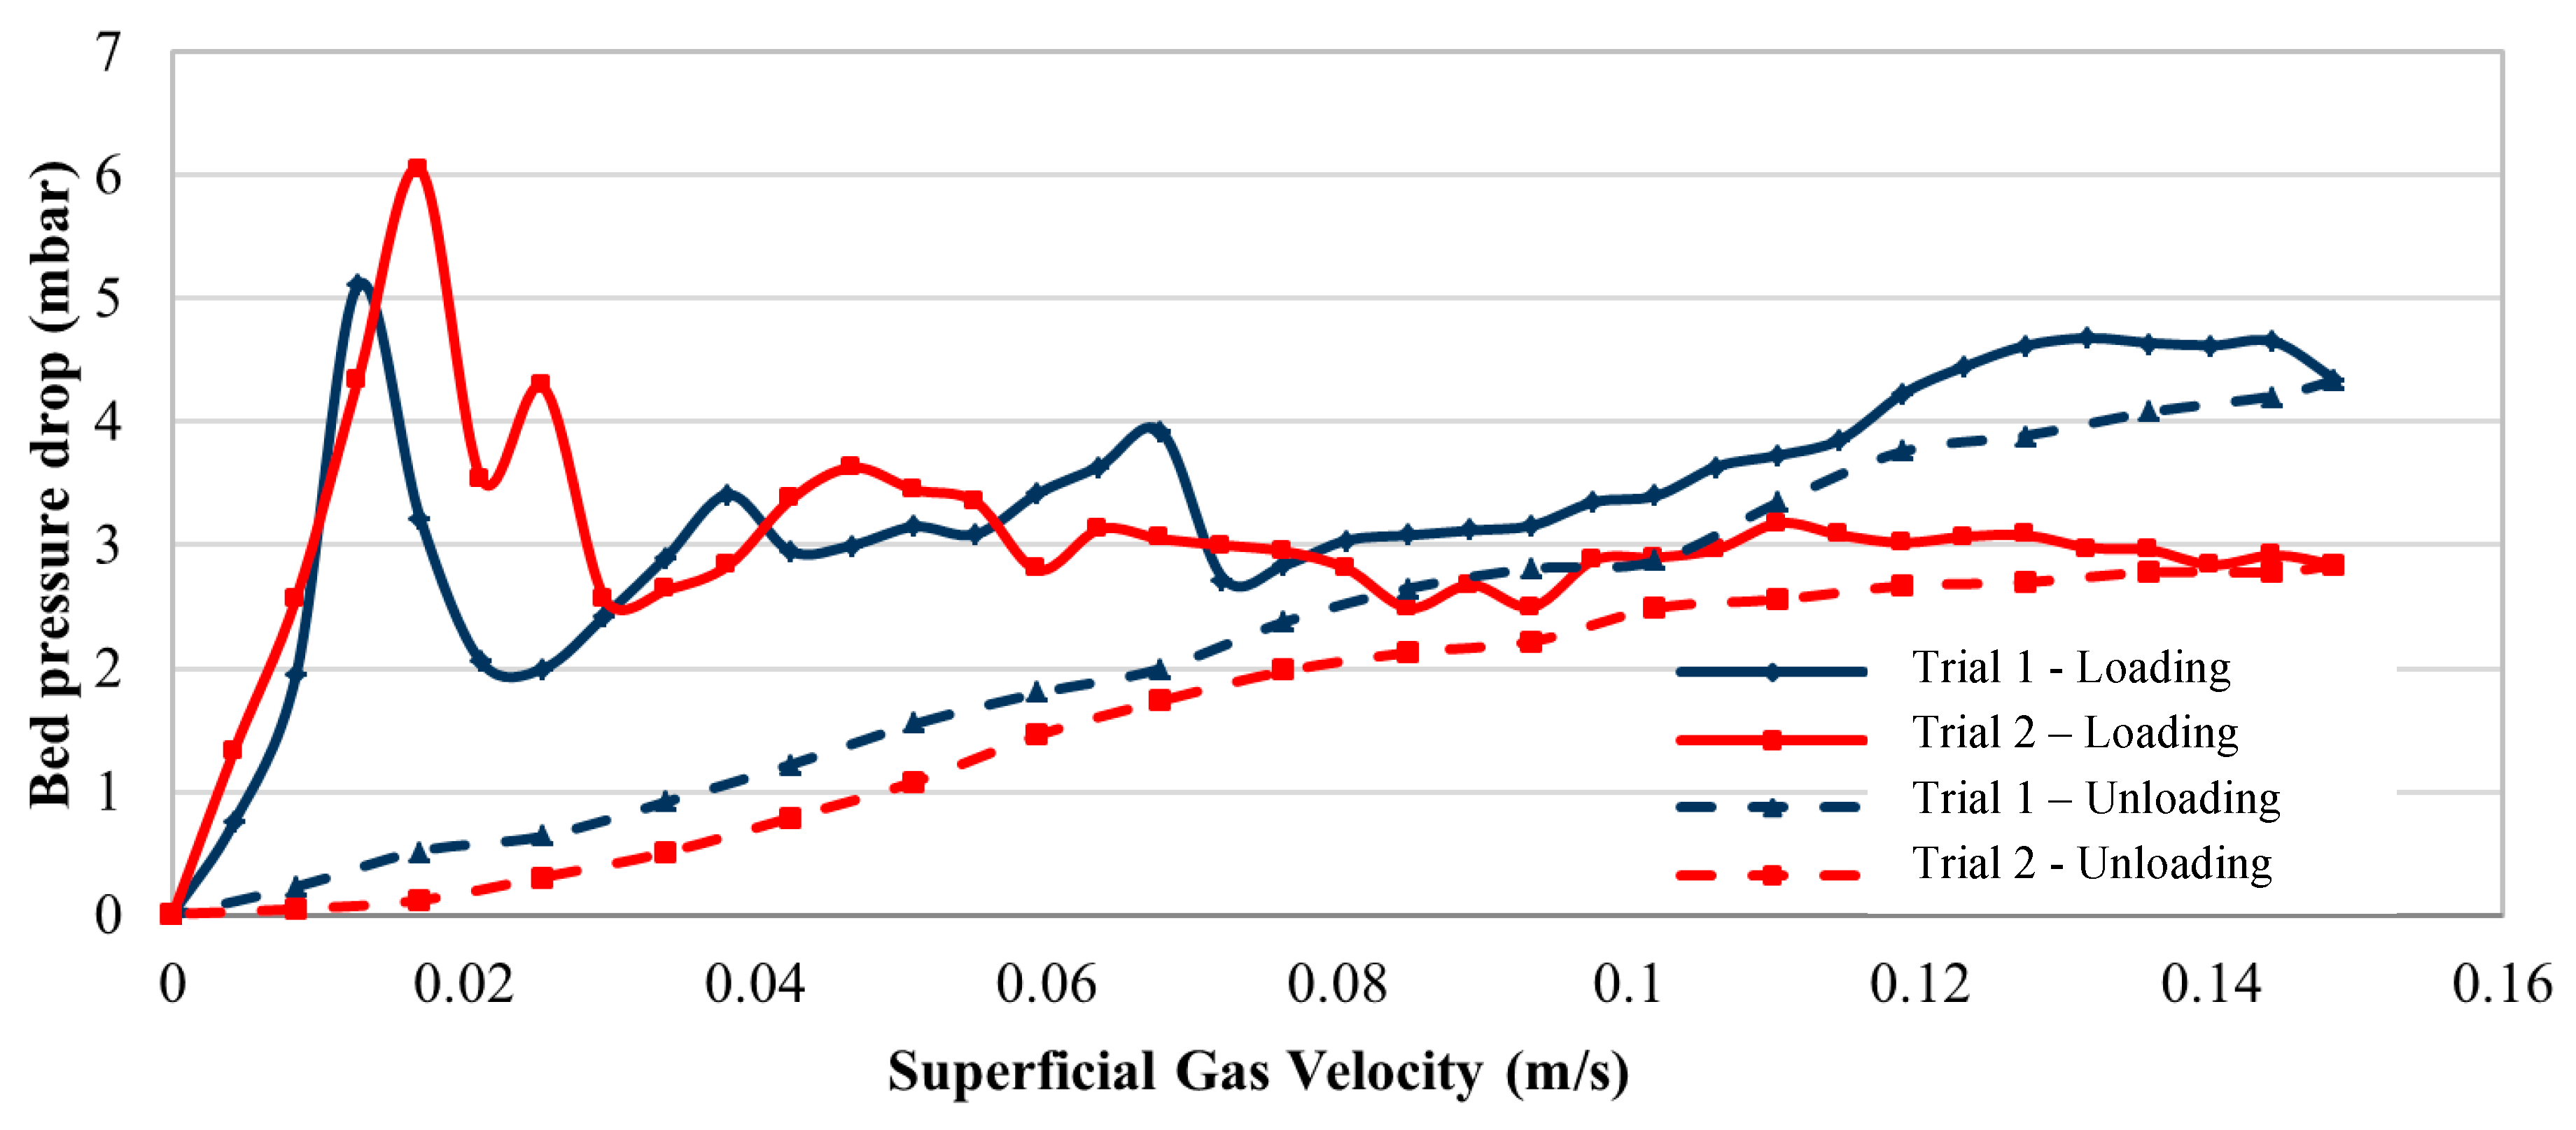
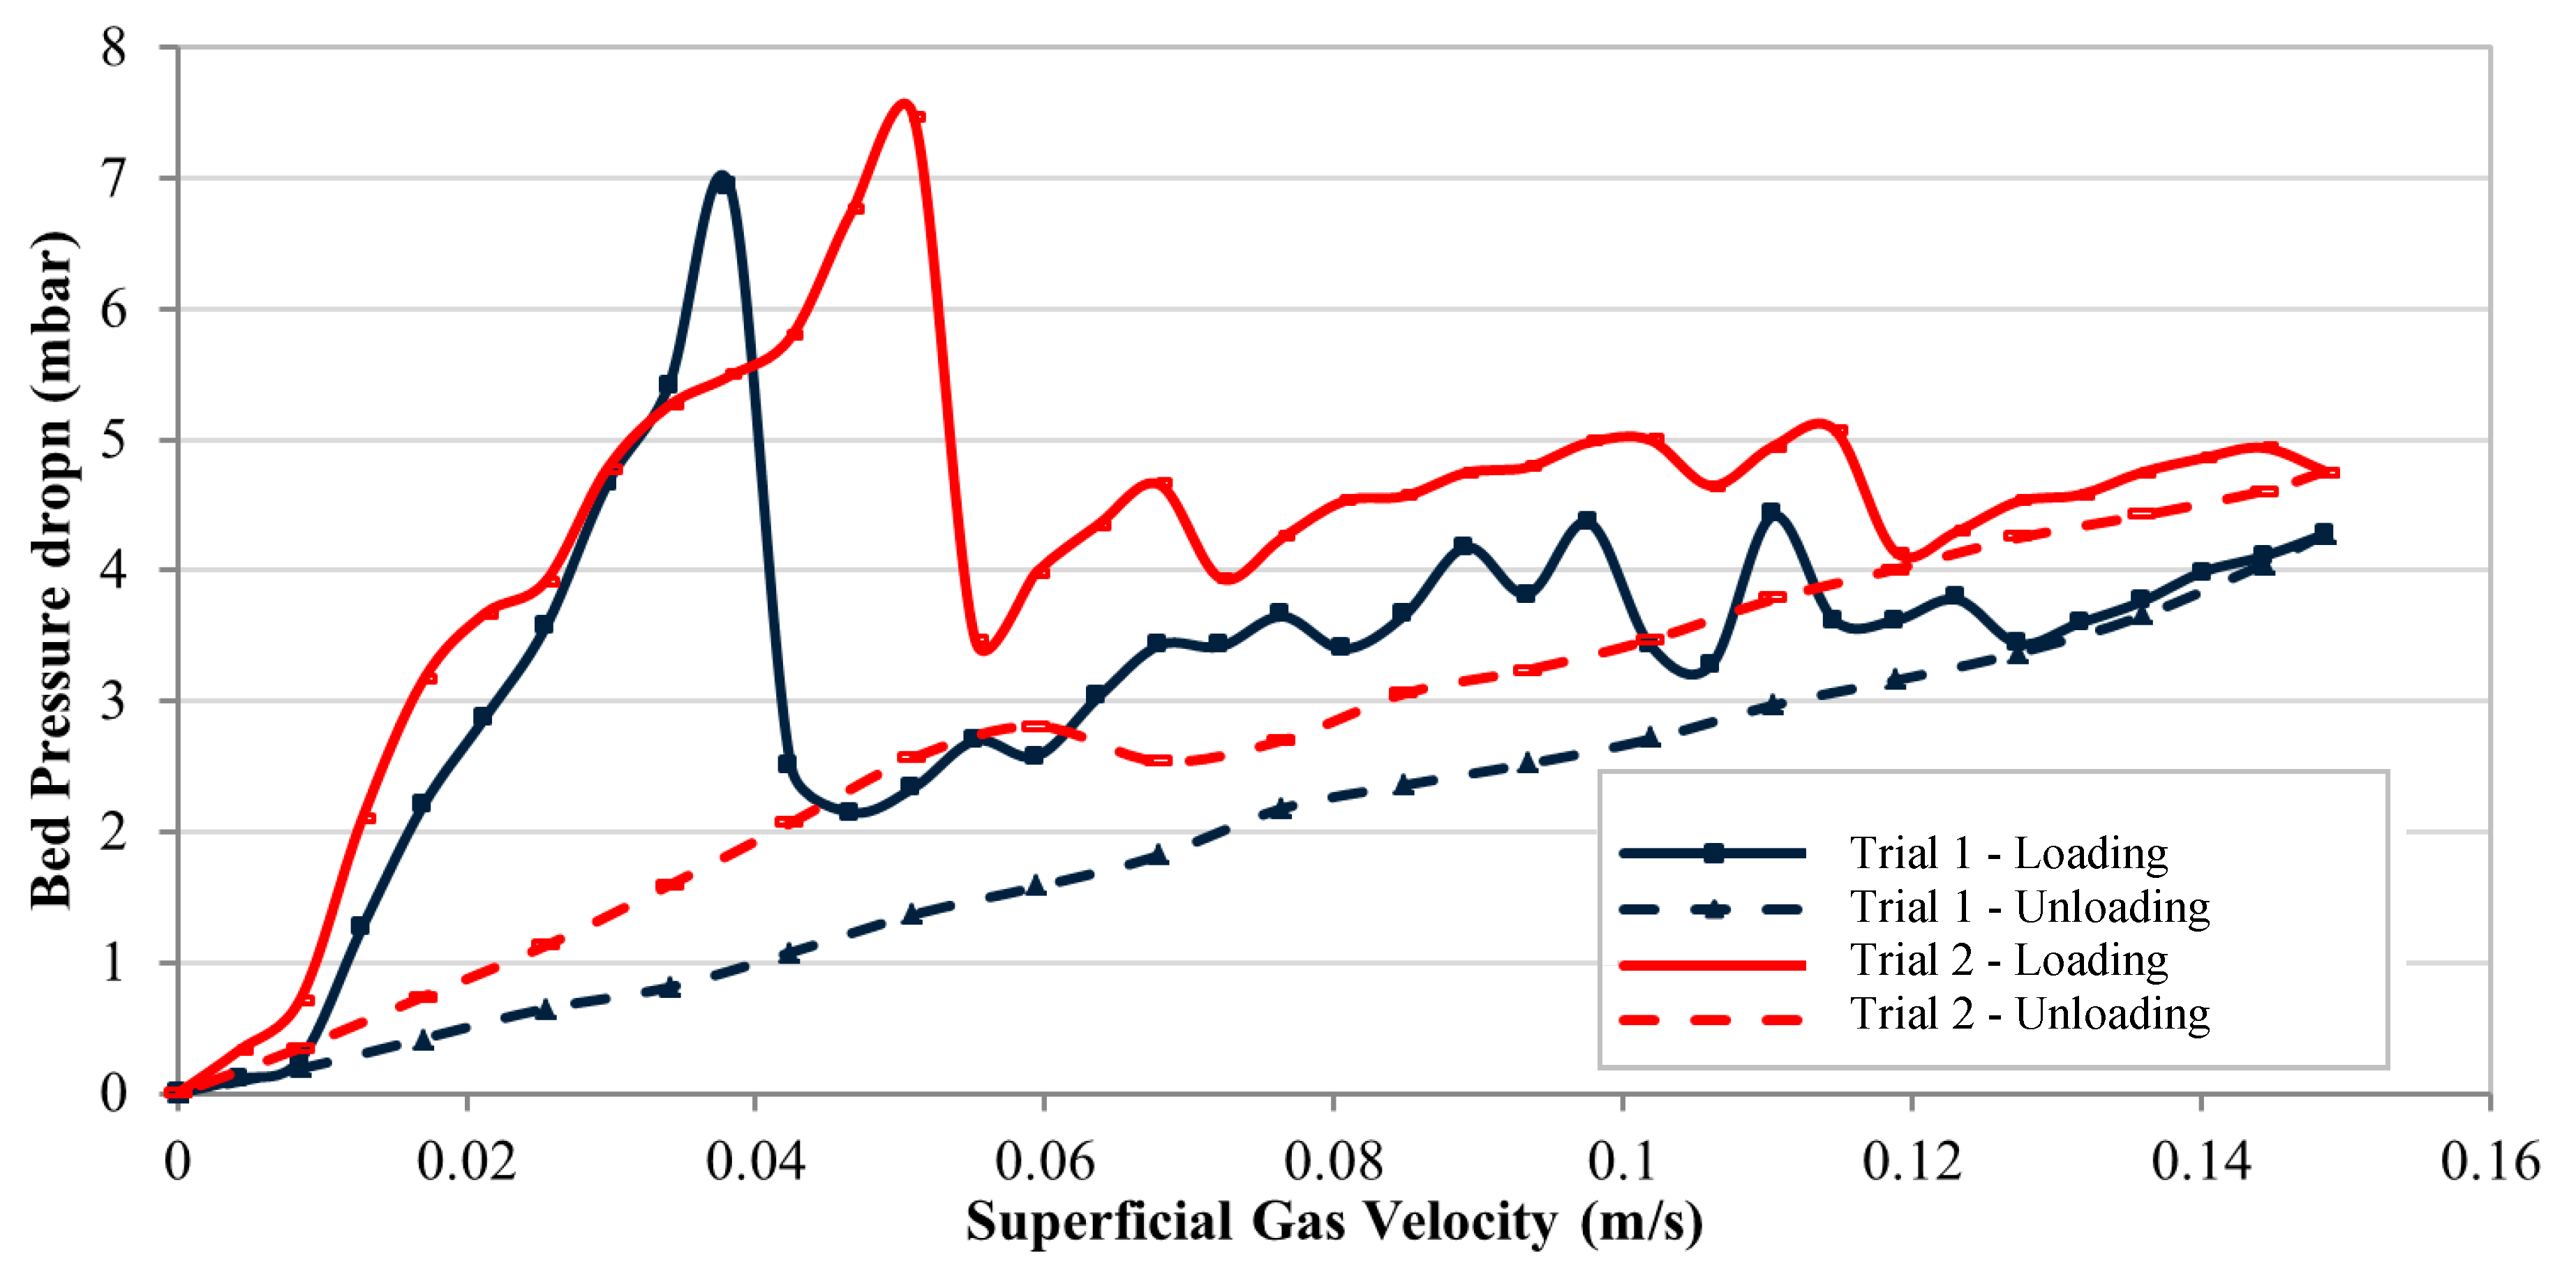
4.2.2. Ultra-Fine Powder Bed Fluidization
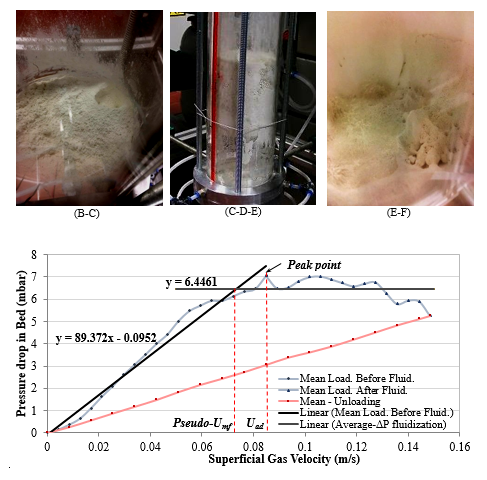
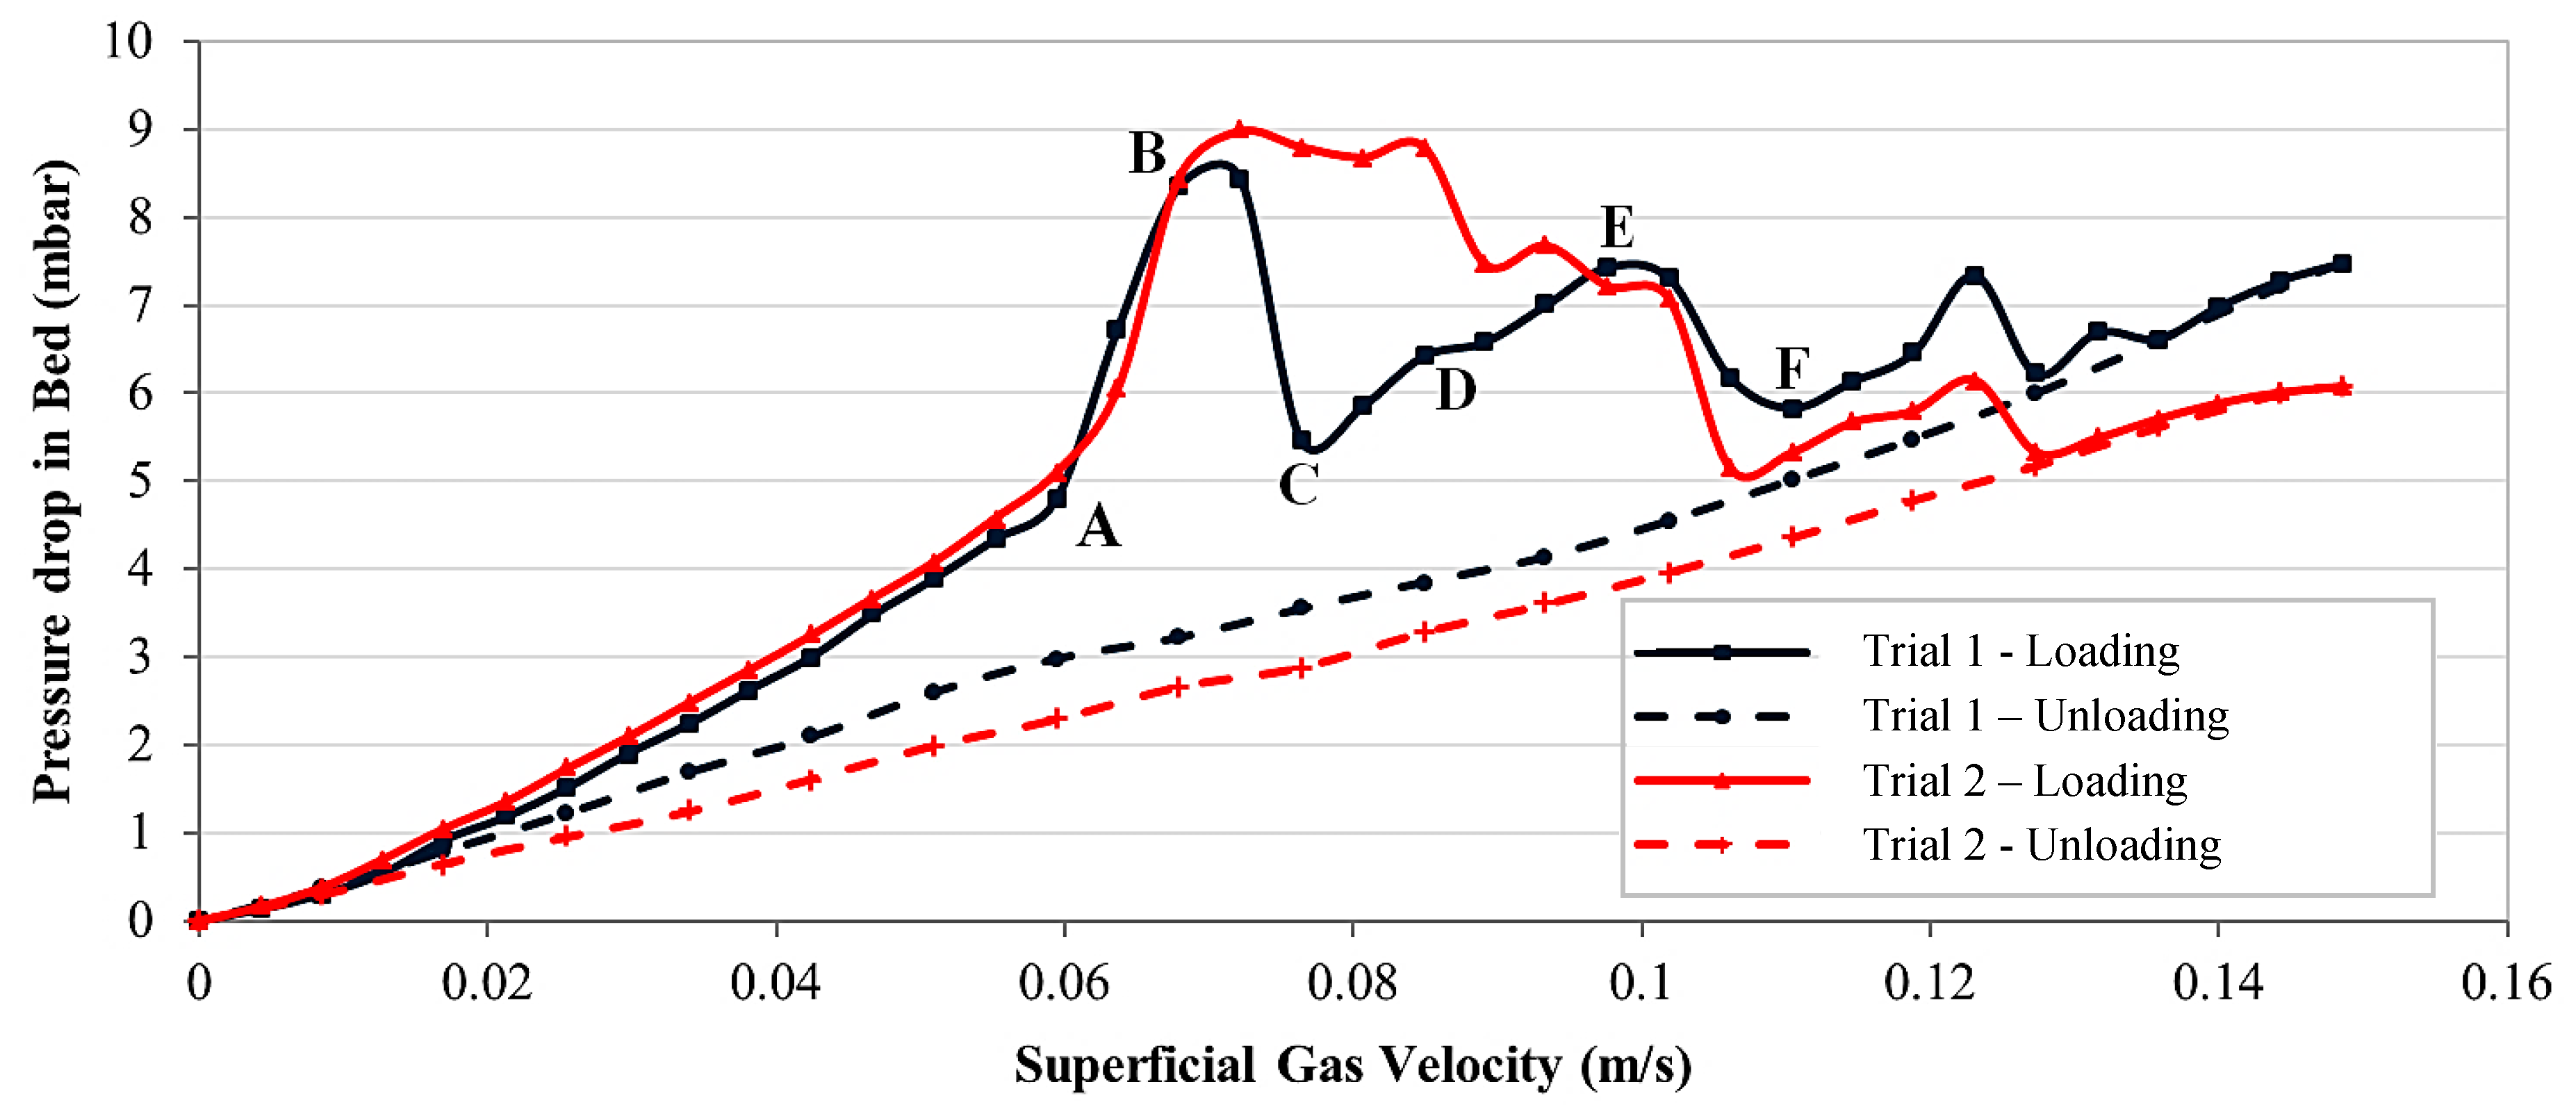
a. Loading: For fluidization of ultra-fine cohesive powder, it is clear from
Figure 5, that there are strong fluctuations in the bed pressure drop when looking at the loading curves. This figure shows two independent fluidization tests for the same ultra-fine powder. For a fixed bed condition, by increasing the gas velocity, the pressure drop also increases. However, there is not any change in the bed height. Again, a linear trend is observed between the rising bed pressure drops and increasing gas velocity. Focusing on the first trial fluidization curve (dark blue), the general behaviour of the loading curve of ultra-fine cohesive powders can be discussed qualitatively. As a complementary source of information,
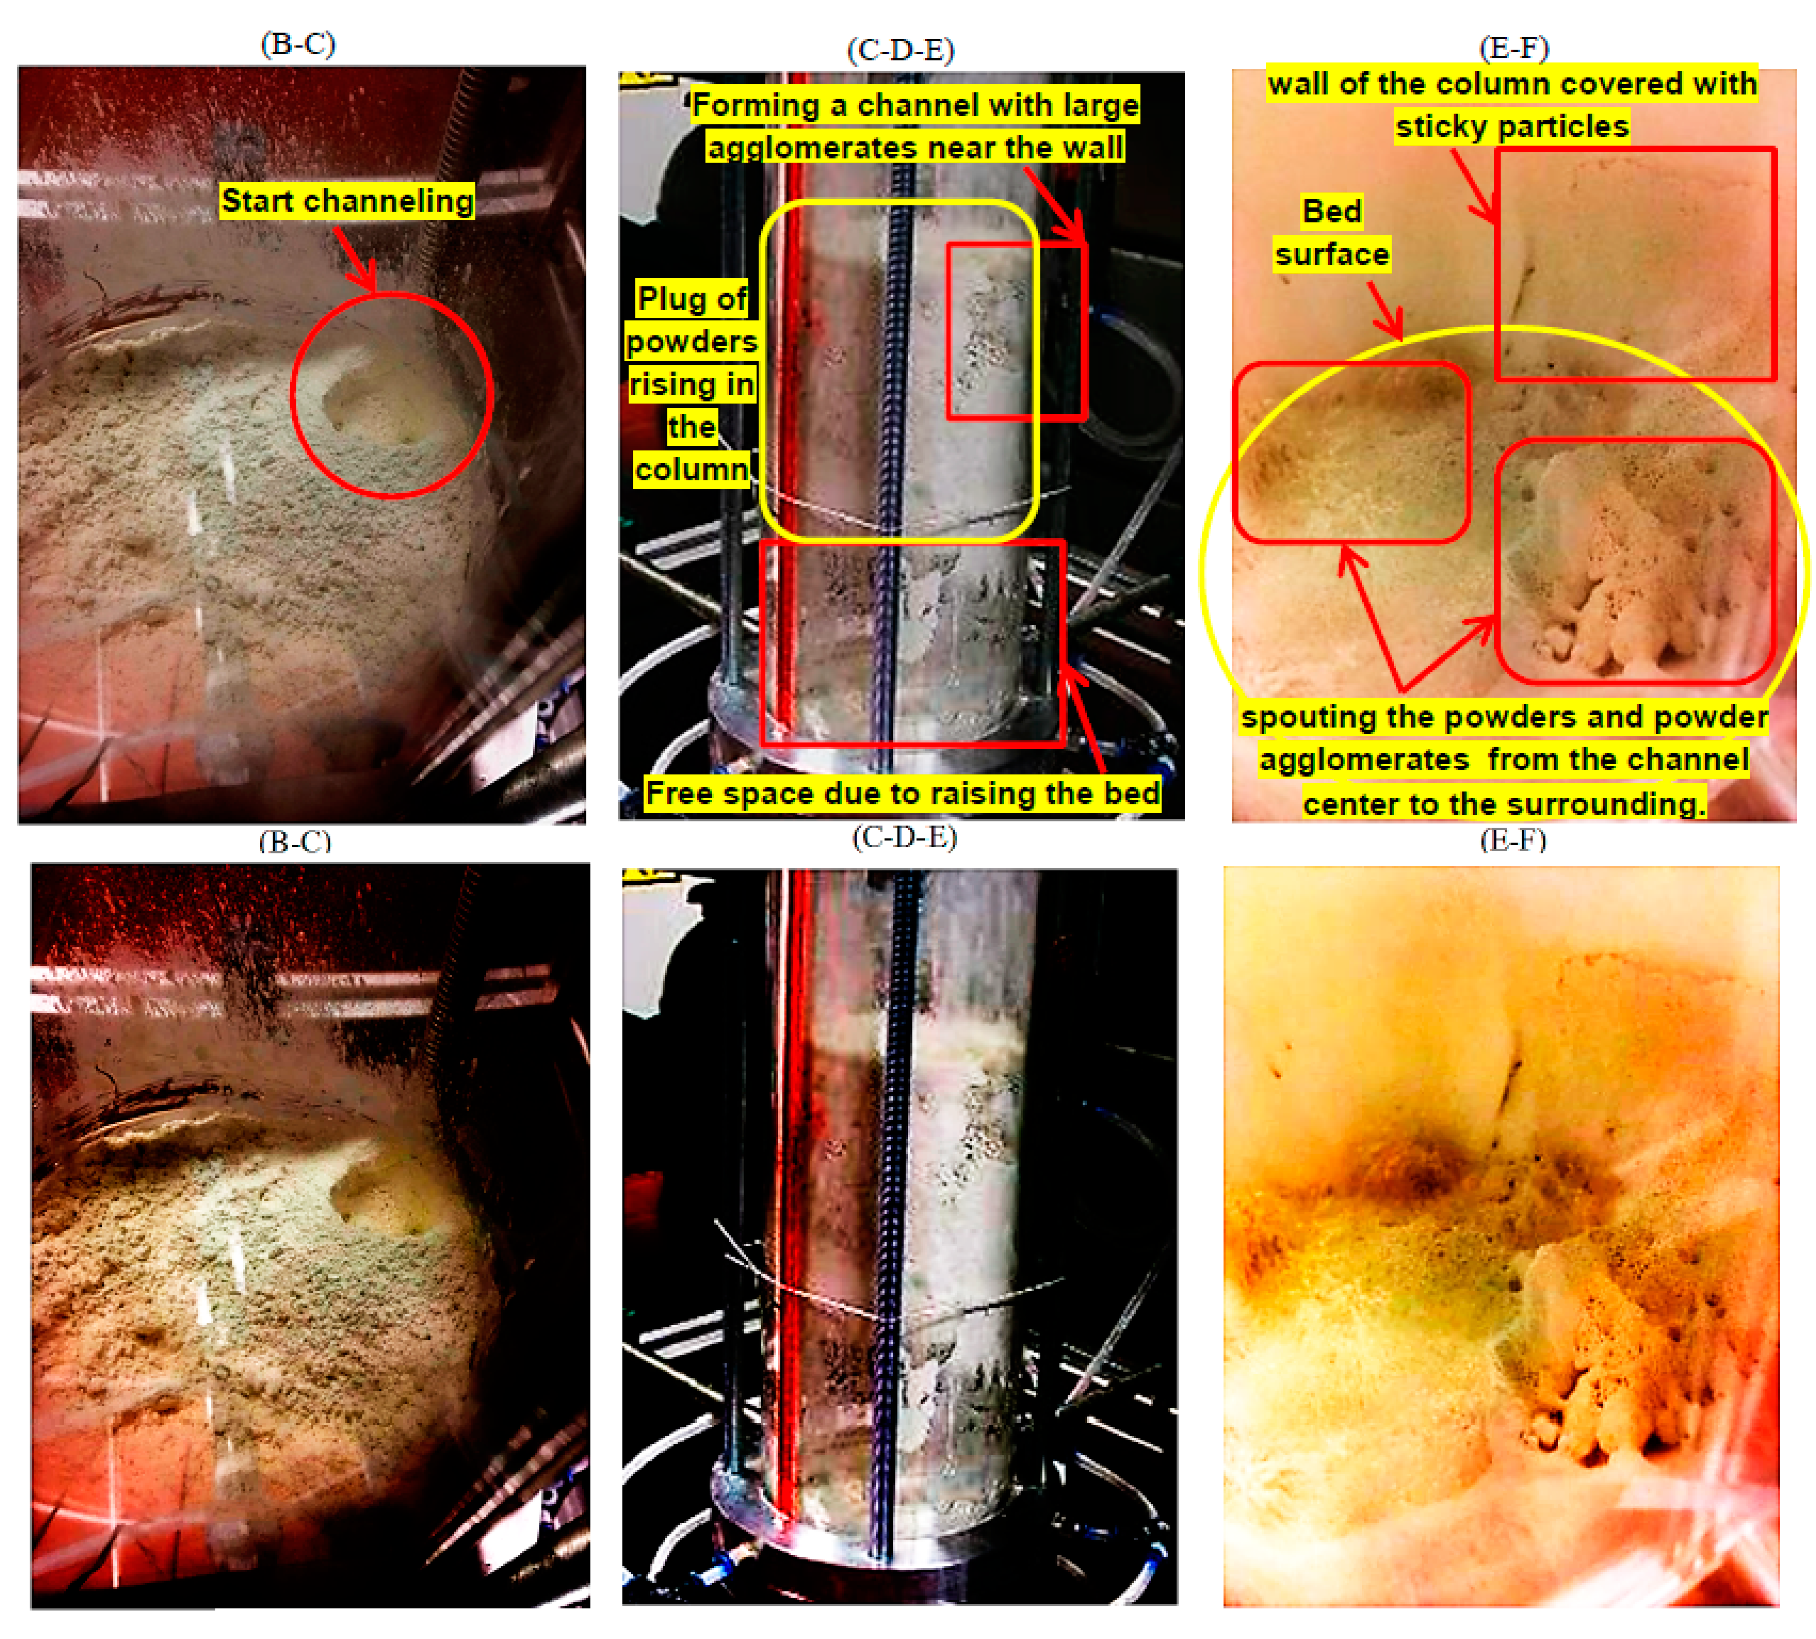
Figure 6 also shows pictures corresponding to three different behaviours of ultra-fine particle fluidization during the first fluidization test as shown in
Figure 5.
By increasing the gas velocity, some horizontal or sloping cracks first begin to form. At point A, the formed cracks have been broken down and, due to this phenomenon, the slope of the changes in the bed pressure drop increases when increasing the superficial gas velocity. This behaviour continues up to point B. At this point, at which enough kinetic energy becomes available in the gas, the available voids between cohesive powders and their adjacent cracks connect and build vertical channels. This leads to a finite expansion of the bed, but without formation of a real bubble. Then, some small bubbles (unlike the bubbling behaviour seen in fluidization of Group A-particles) form.
Due to the motions of these small bubbles, the cracks formed near the wall disappear. The moving bubbles re-shape the cracks until they take the form of vertical channels. After starting of channelling, the pressure drop decreases suddenly to point C. In fact, because of channels, the gas stream now has a shortcut to pass the powder bed and needs a lower pressure drop to cross the porous medium.
Increasing the superficial gas velocity further, the available gas in the cracks and adjoining voids escapes the bed and the cracks break and fall down. The ratio at which the available gas in micro-voids can leave a vertical channel will control the rate of collapse [
1]. After the channels collapse, the pressure drop again increases. The collapsed bed forms a network of adhered powders and a large horizontal crack is formed near the bottom of the bed. When further increasing the gas velocity, due to retention of air under the upper part of the powder bed, this upper part starts to rise in the column as a slug flow, as long as the flow rate of the air entering into this gap is higher than the flow of air passing through the upper part of the powder bed. The formation of some small channels in the upraised part of the bed after point D is the reason of increasing pressure drop with a different slope (lower) up to point E. Increasing further the gas velocity, a large channel is activated, causing the collapse of the raised part of the bed at point F. Finally, the fluidization continues in the channelling regime.
This first trial fluidization curve (the dark blue one) reveals all essential features of fluidization for Geldart’s Group C-powders. However, as revealed by a second independent test (red curve), not all features will be systematically observed. For the second fluidization test, the fluctuations in the pressure drop are due to activation and collapse of cracks or channels, but the rising bed, as seen in the previous test between points C and E, was not observed.
Figure 6 shows three photos taken during the first test and illustrating the key features of ultra-fine fluidization at macro-scale.
Figure 6 shows that there are a lot of random phenomena during fluidization of ultra-fine particles, such as formation and disruption of cracks and channels, agglomeration, slug flow, spouting behaviour of channels, the sticking of powder to the column walls, movements of active channels and of fluidized and de-fluidized zones when increasing or decreasing the superficial gas velocity. All these features are a direct function of the exact initial conditions of the bed before starting fluidization; though the bed properties are statistically identical for all tests, the exact local distribution of the particles at initial time varies from realization to realization and also depends on the previous state of the bed (the condition of the bed for each level of gas velocity) during fluidization loading and unloading (history effect). Therefore, the behaviour of ultra-fine fluidization is different for each independent test even when using the same material, as shown in
Figure 5.
b. Unloading: The unloading curves of ultra-fine powder fluidization show a substantially different (almost linear) behaviour compared to the loading curves (
Figure 5). The pressure drop measurements during unloading lie entirely below the loading. Based on Darcy’s law, the total volumetric flow rate of the fluid passing through a porous medium formed by particles,
, can be represented using the height and cross-section area of the powder bed as:
where
is the hydraulic gradient,
(m) is the pressure drop across the bed,
(m) is the height of the bed,
is the total cross-sectional area of the bed and
is a constant depending on the physical properties of the particle bed and fluid (permeability). Then, the mean velocity of the fluid (
) is defined as:
where
is the bed pressure drop.
Considering that the slope of the
-
graph is inversely proportional to permeability,
(refer to Equation (14)), the linear behaviour of the unloading curve shows a constant permeability in the powder bed during unloading. It means that for ultra-fine material, although permeability of the bed during loading changes several times due to competing phenomena taking place at this stage (as discussed before), the unloading process is much simpler and permeability is almost constant (
Figure 5).
On the other side, the permeability of the fine particle bed increases in the loading process with almost the same rate as it decreases during the unloading process, as mentioned in connection with
Figure 4.
It is worth noting that for the ultra-fine material, observations never show a fully fluidized bed; a partially-fluidized bed is systematically seen, involving cracking, channelling, plugging (slugging), collapsing and agglomeration of the powders. Similar observations are also reported by Wang et al. [
2]. This shows that the fluidization behaviour of the ultra-fine material is not stable and is very sensitive to the initial conditions and history of the bed before starting (initial arrangement of particles) and during fluidization tests. Therefore, a considerable effort has been spent to ensure identical initial conditions (in a statistical sense) for all fluidization tests.
4.2.3. Using Agglomeration Number to Evaluate the Fluidization Behaviour of Cohesive Particles
One criterion for describing the fluidization behaviour of cohesive powders involves the interaction of formed agglomerates with peripheral adhered powders. When the size of particles is reduced down to the micrometre range, particles try to build agglomerates to reduce their surface energy. Zhou and Li [
24] defined the particle agglomeration number (Ae) as a criterion that indicates whether particles fluidize or not:
where
comes from the ratio of
.
is the cohesive force between agglomerates and their peripheral adhered powders and
is the gravity of the peripheral adhered spherical powders. In addition, Zhou and Li [
24] estimated the agglomerates density (
) as 1.15 times that of the packed bed density; they concluded that the cohesive particles can be fully fluidized if
≤ 40,000. Using the particle properties in this study,
is much larger than 40,000 for the ultra-fine material in the range of gas velocities considered here (0–15 cm/s).
The critical value of 40,000 would be obtained for a huge gas velocity of 2700 cm/s, at which all particles (agglomerates) would be pneumatically transported out of the fluidization column. Thus, increasing the gas velocity to such a high value is impossible. The fact that the criterion of Zhou and Li [
24] is not valid here shows that the ultra-fine material is a very cohesive powder and it has not full fluidization. Therefore, if the fluidization of such ultra-fine materials is necessary for an industrial process, some kind of fluidization aids, as discussed in the introduction section, is required to reduce the agglomeration number.
For our fine particles, is smaller than 40,000, even at low gas velocities, explaining easy and full fluidization of fine particles in the experiments.
4.3. Fluidization of Binary Mixtures, as a Combination of Fine and Ultra-Fine Particles
The first point of investigating the binary mixtures is to find the suitable weight percentages of ultra-fine materials in the mixtures. For this purpose, a series of initial tests were carried out with increasing the proportion of ultra-fine particles in the mixtures by 5% in each step and checking the fluidization behaviour. These experiments showed that increasing the portion of ultra-fine particles to more than 20% by mass results in partial fluidization (cracking, channelling or slug flow). For all blends containing more than 20% of ultra-fine particles, the mixture could not be fluidized completely. For a mixture with 20% of ultra-fine powders, the full fluidization happens first at high gas velocities, leading to elutriation loss. Below 20% of ultra-fines, the behaviour of the mixture changes due to the presence of ultra-fine material. However, reaching fluidization is still possible by increasing the gas velocity; a higher percentage of ultra-fine powders requires a higher superficial gas velocity for fluidization.
These observations can also be explained by looking again at the particle agglomeration number,
. For a mixture of two material (binary mixture),
can be calculated by [
24]:
where
is the intensity of cohesiveness for the binary mixture (as measured in the shear cell for each mixture) and
is the Sauter mean value of particle diameters in the mixture, which is given by
where
is the mean particle size and
is the weight fraction of the sample particle
in the mixture.
The values of
according to Equation (16) reveal that a mixture containing 20% of ultra-fines is expected to be fluidized for superficial gas velocities higher than 39.5 cm/s (i.e., this gas velocity corresponds to
< 40,000 [
24]).
Therefore, in this study, only portions (mass-weighted ratio) of ultra-fine particles above the critical value (20%) are considered in what follows. Finally, three percentages of ultra-fine powders (30%, 50% and 68% of the total weight of the mixture) in the mixtures will be employed. Following [
24], for the lowest percentage of ultra-fine powders (30%), the velocity where
< 40,000 would be 115 cm/s, which is already much larger than the acceptable velocity for avoiding elutriation loss.
Table 3 shows the properties of all mixtures used in the experiments. The values of
,
and
are measured by the same shear cell test device used for the measurements in
Table 2. The parameter
is calculated according to Equation (17). Considering the relative density of solid and gas as well as the value of
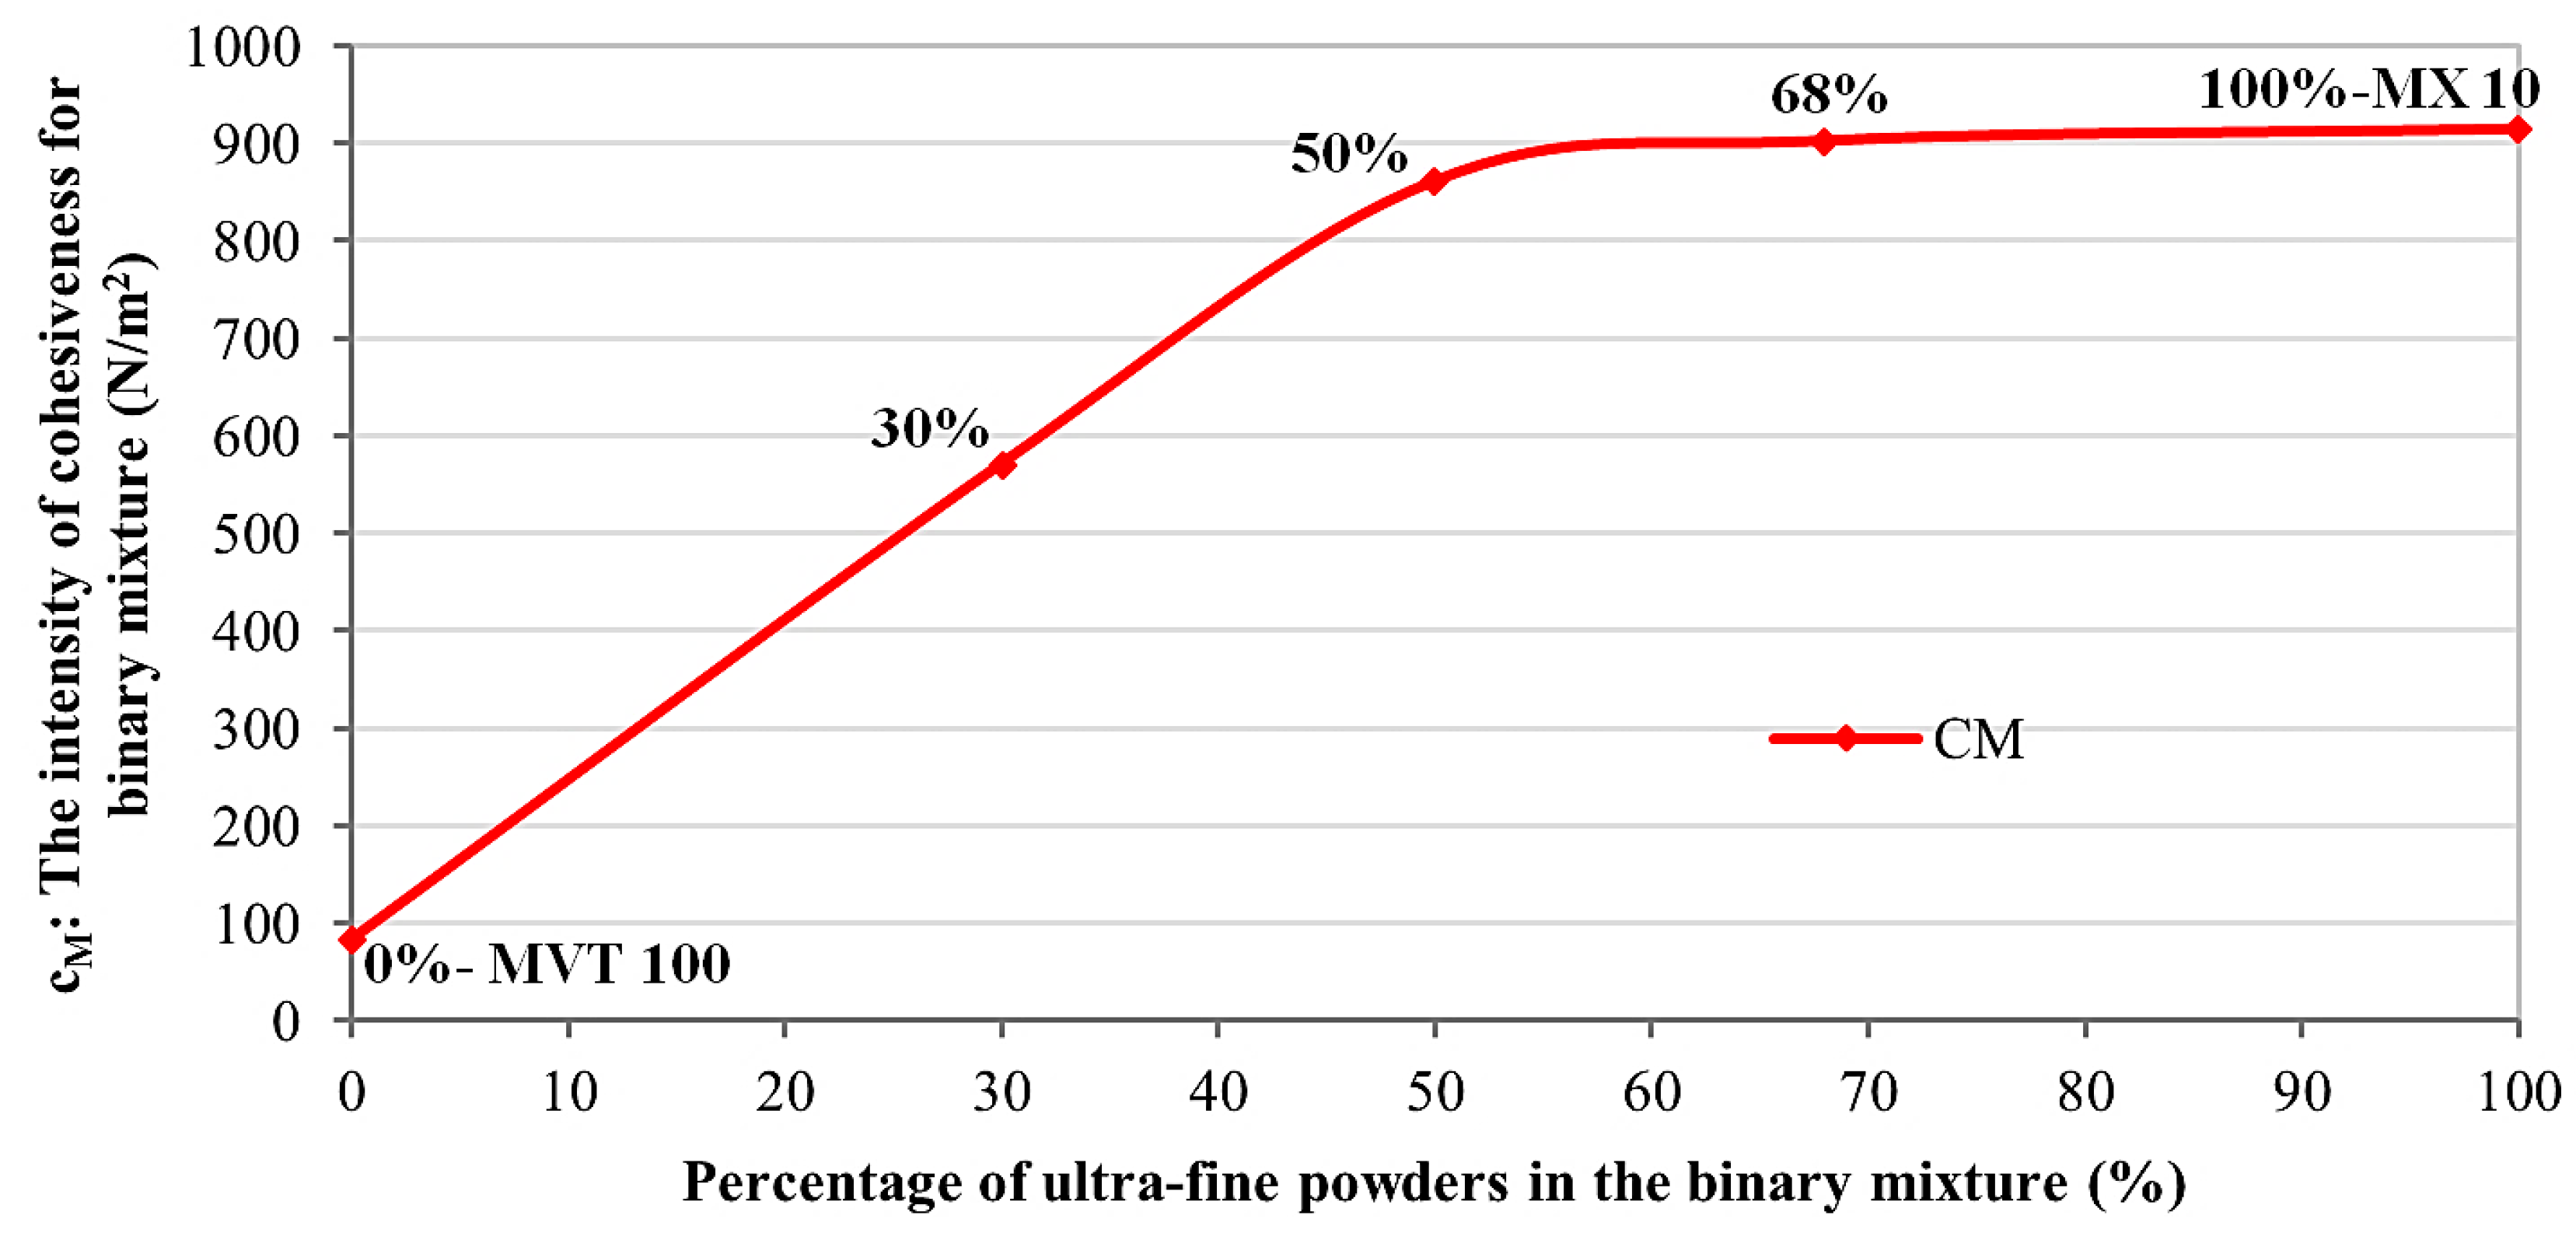
, all mixtures belong to the very cohesive Geldart’s Group C. However, increasing the ultra-fines in the mixture decreases flowability and increases the intensity of cohesiveness. For a higher percentage of ultra-fines, saturation is observed:
for compositions containing 50% and 68% of ultra-fine particles is only 6% and 2% smaller than pure ultra-fine powder, respectively.
Figure 7 shows the increase of
when increasing the ultra-fine powders in the binary mixtures. This graph includes pure fine and ultra-fine particles as two mixtures containing 0% and 100% of ultra-fine powder, respectively.
In addition,
Figure 8 shows the cumulative distribution function and probability density function of the particle size for a binary mixture of 50% ultra-fine and 50% fine particles, illustrating the typical distribution of particle size in such binary mixtures.
Figure 9,
Figure 10 and
Figure 11 show two independent repetitions of the fluidization tests (
-
graphs) for the three different mixtures of fine and ultra-fine particles, with weight percentage combination (fine%–ultra-fine%) of 70%–30%, 50%–50% and 32%–68%, respectively.
These figures show that the fluidization curves of loading and unloading are qualitatively similar to the fluidization curve for ultra-fine cohesive powders discussed previously; strong fluctuations in bed pressure drop are observed during loading, with an almost linear behaviour during the unloading stage. These figures show that the presence of ultra-fine cohesive powders can change entirely the fluidization behaviour of the fine particle bed. It is again clear that the fluidization tests for all these mixtures are not reproducible. Changes between two different repetitions of fluidization tests with the same material (as observed in
Figure 9,
Figure 10 and
Figure 11) are due to differences in the initial conditions, to the past history of the particles regarding applied forces and to the stochastic formation and collapsing of cracks and channels. These factors will change the fluidization curve in each test repetition (history-dependent).
4.4. Using the Mean Value of Bed Pressure Drop as a Criterion for Comparing Non-Reproducible Fluidization Processes
In this study, several independent fluidization tests were performed for the three combinations of fine and ultra-fine particles. Considering that each test takes about eight working hours (including discharging the previous material, cleaning, preparation, charging the new material, loading to fluidization and unloading), the number of tests for each mixture was restricted by time: ten tests have been carried out for each combination of materials. Given that () is different for each repetition of the measurements, the mean value of bed pressure drop at each superficial gas velocity for all repetitions of the same process will be used for the further discussion.
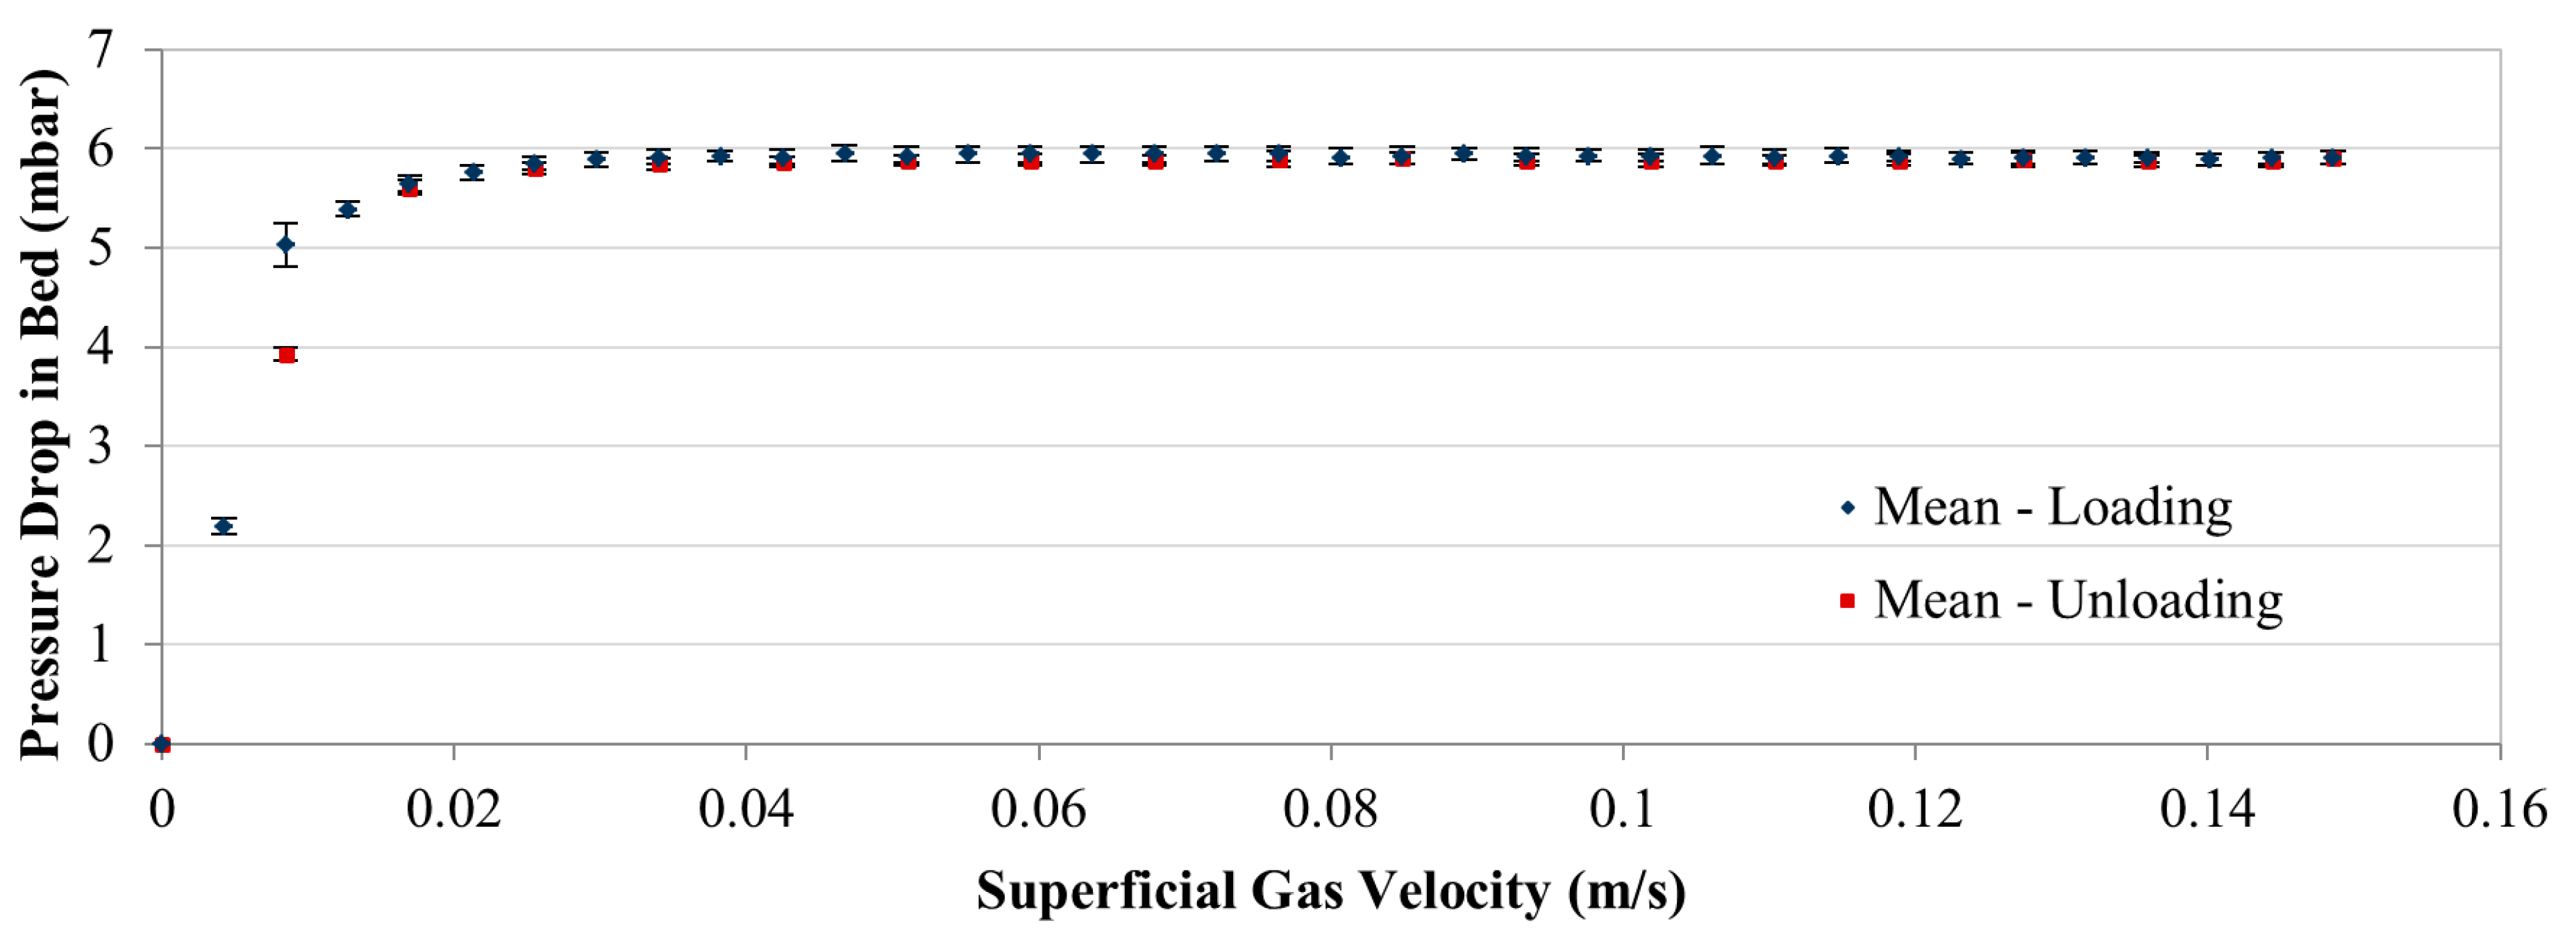
For a better understanding of the averaging process,
Figure 12 and
Figure 13 show the mean values (symbols) and the standard deviations (indicated graphically by vertical error bars, although they are not errors) of the measured bed pressure drop of fine and ultra-fine materials for each gas velocity and for all repetitions, respectively. It is clear, that the fluidization of fine particles (
Figure 12) is stable, with a negligible effect of initial conditions; the only noticeable variation appears at the fluidization point but is still very small. On the other hand, although all experiments correspond to the same initial conditions in a statistical sense, as discussed previously, for ultra-fine powders (
Figure 13), very large variations in the bed pressure drop are observed for most superficial gas velocities.
Using the mean value of , it becomes possible to check and compare the overall fluidization behaviour for each mixture. For this reason, for each superficial gas velocity, only the mean value of the bed pressure drops calculated from the experimental results of all repetitions will be presented and discussed in what follows.
Again, the investigation starts with the mean value of the experimental results for the fluidization of fine and ultra-fine cohesive materials (
Figure 14 and
Figure 15), separately.
In the case of fine particles (
Figure 14), the process is stable, as discussed previously. Only negligible fluctuations are observed concerning
and the system shows a fully fluidized bed behaviour.
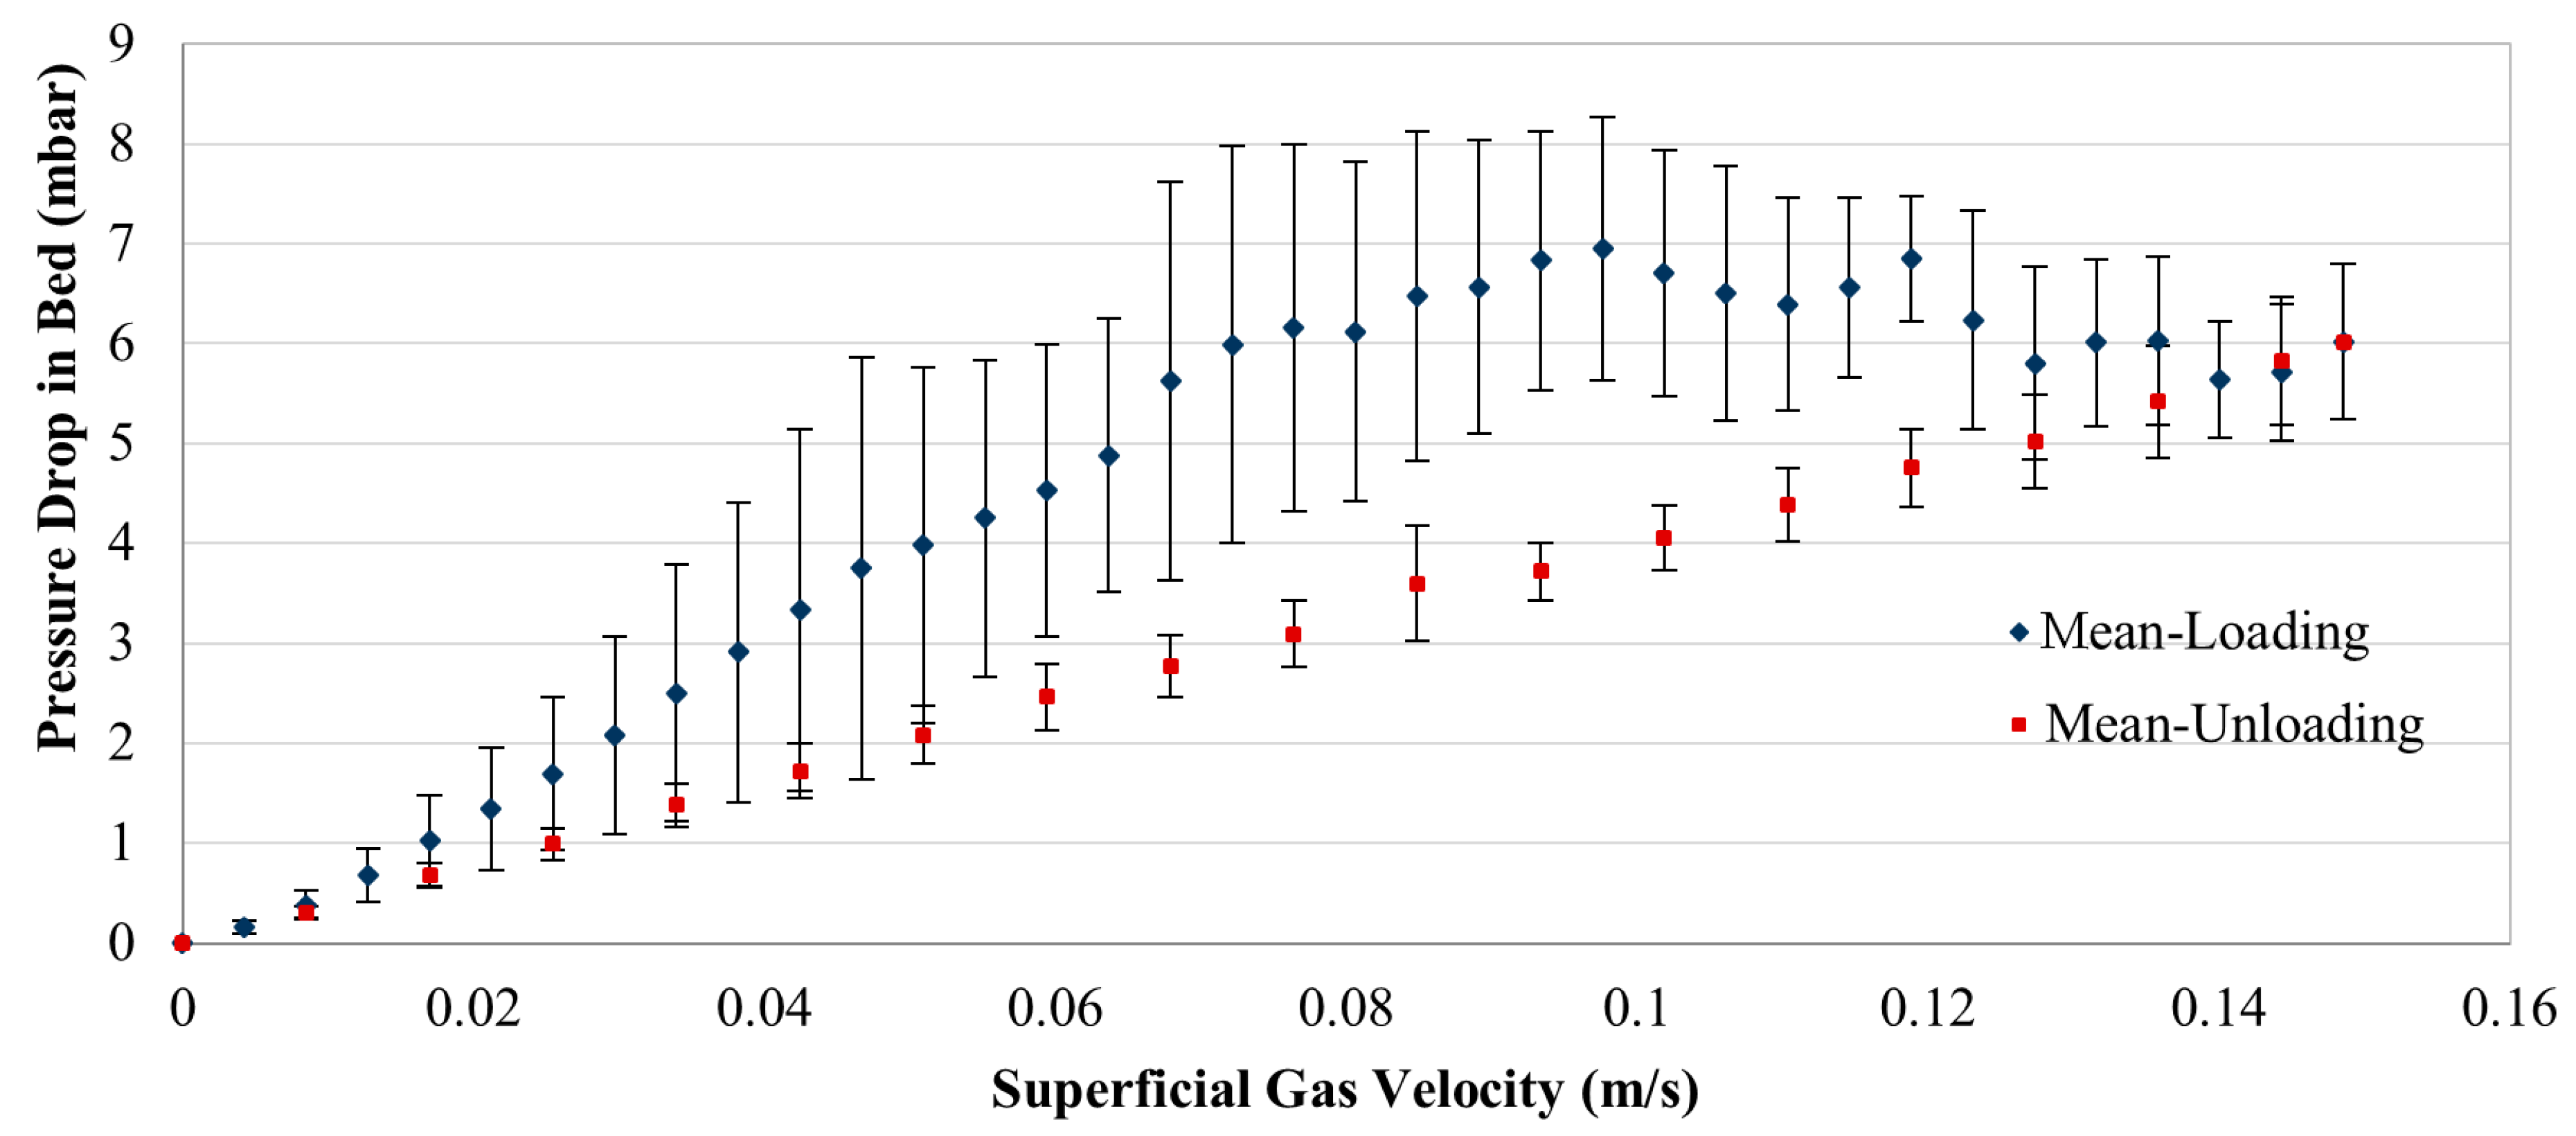
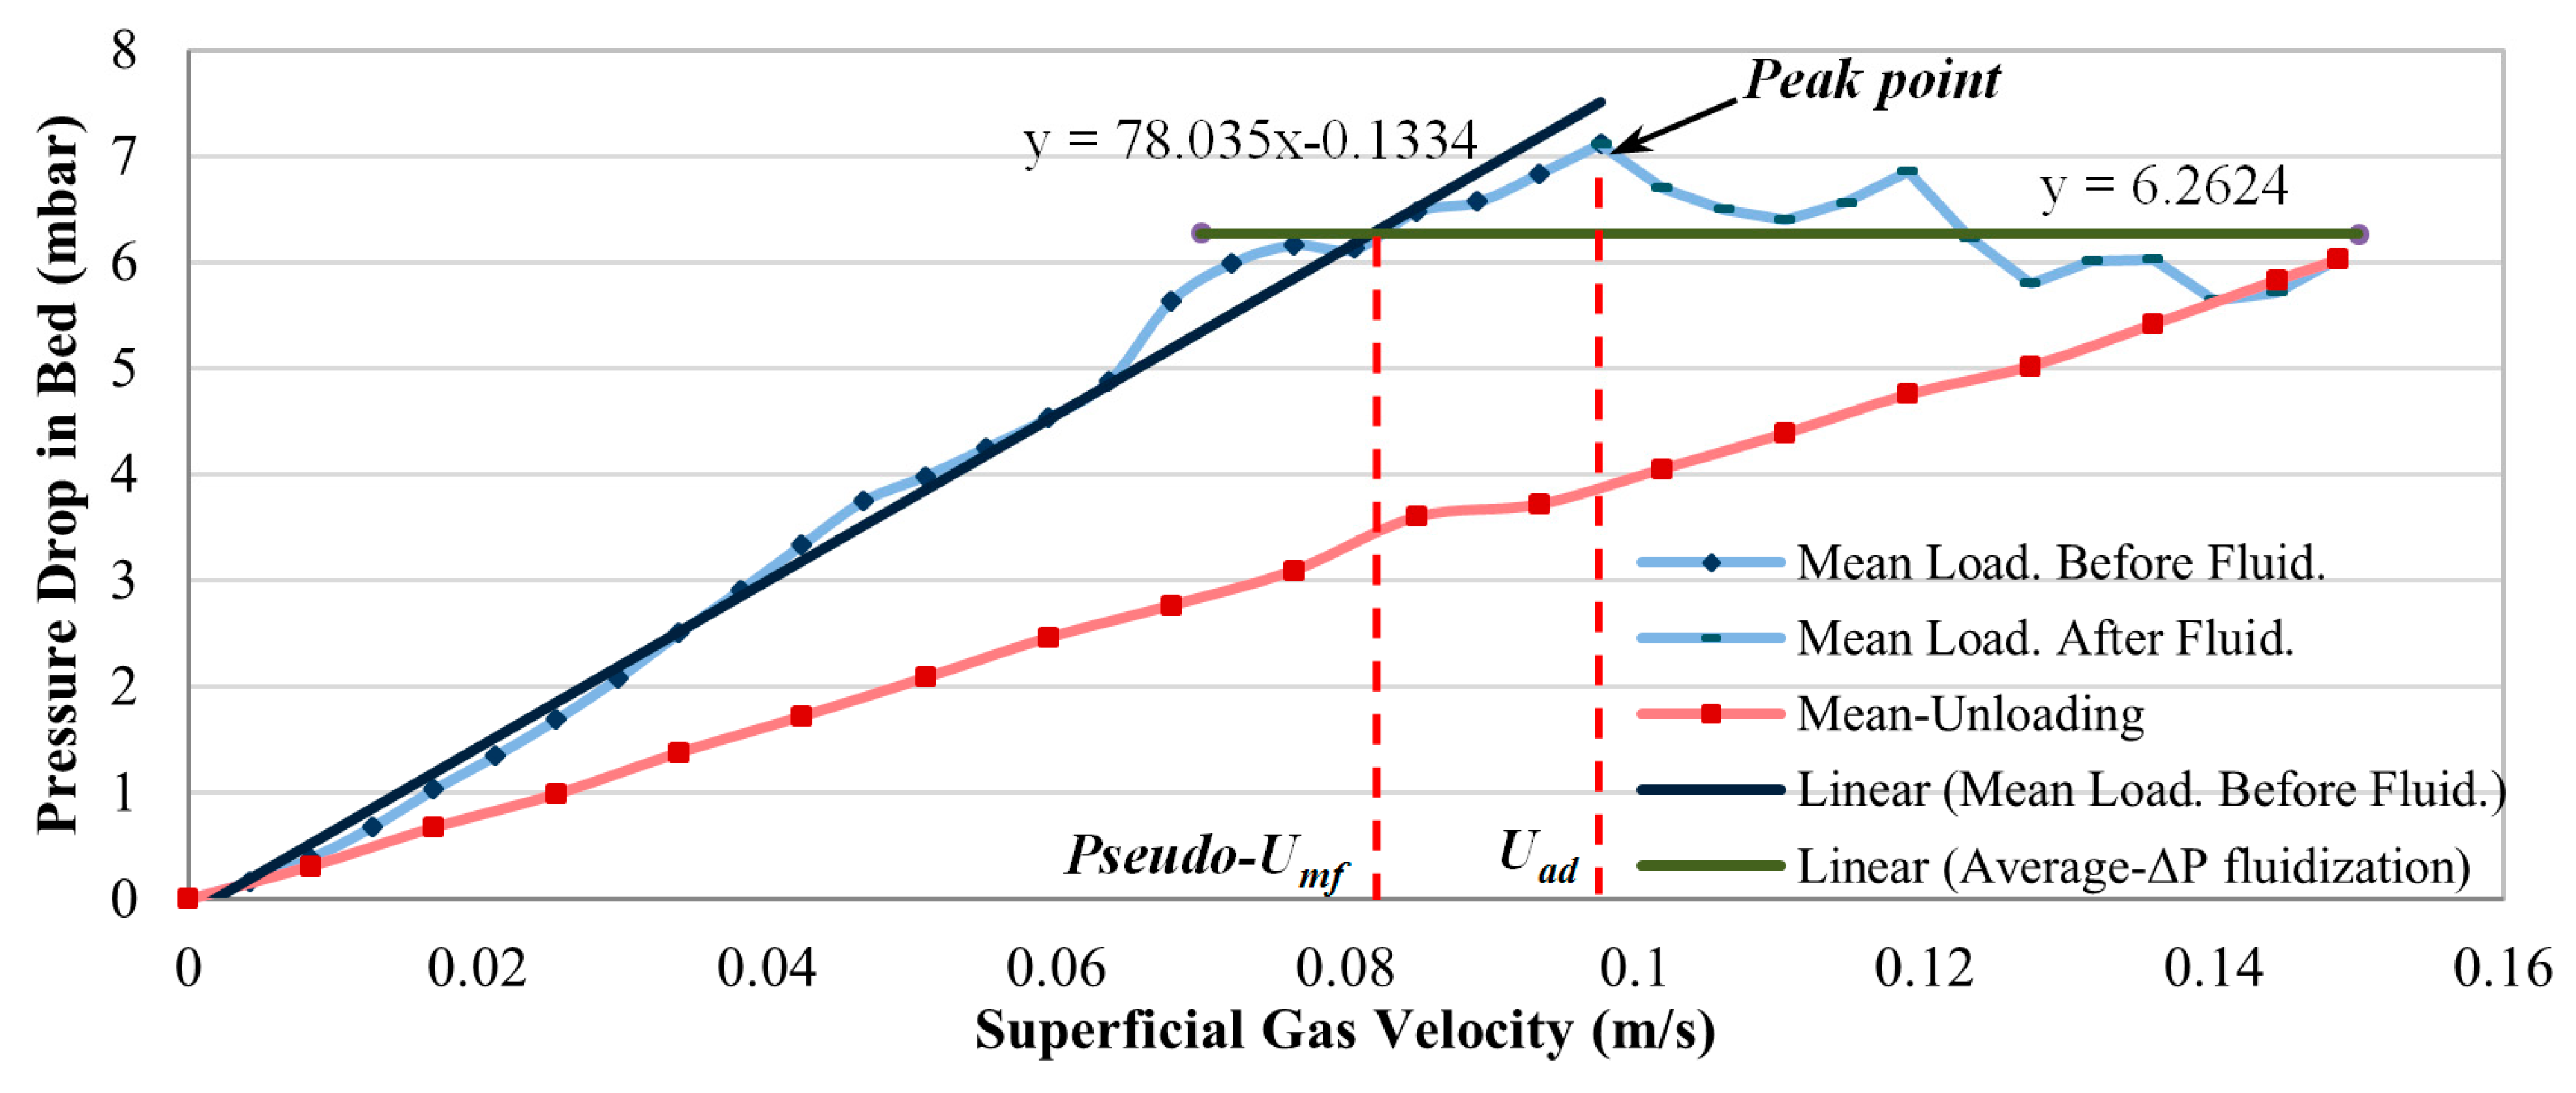
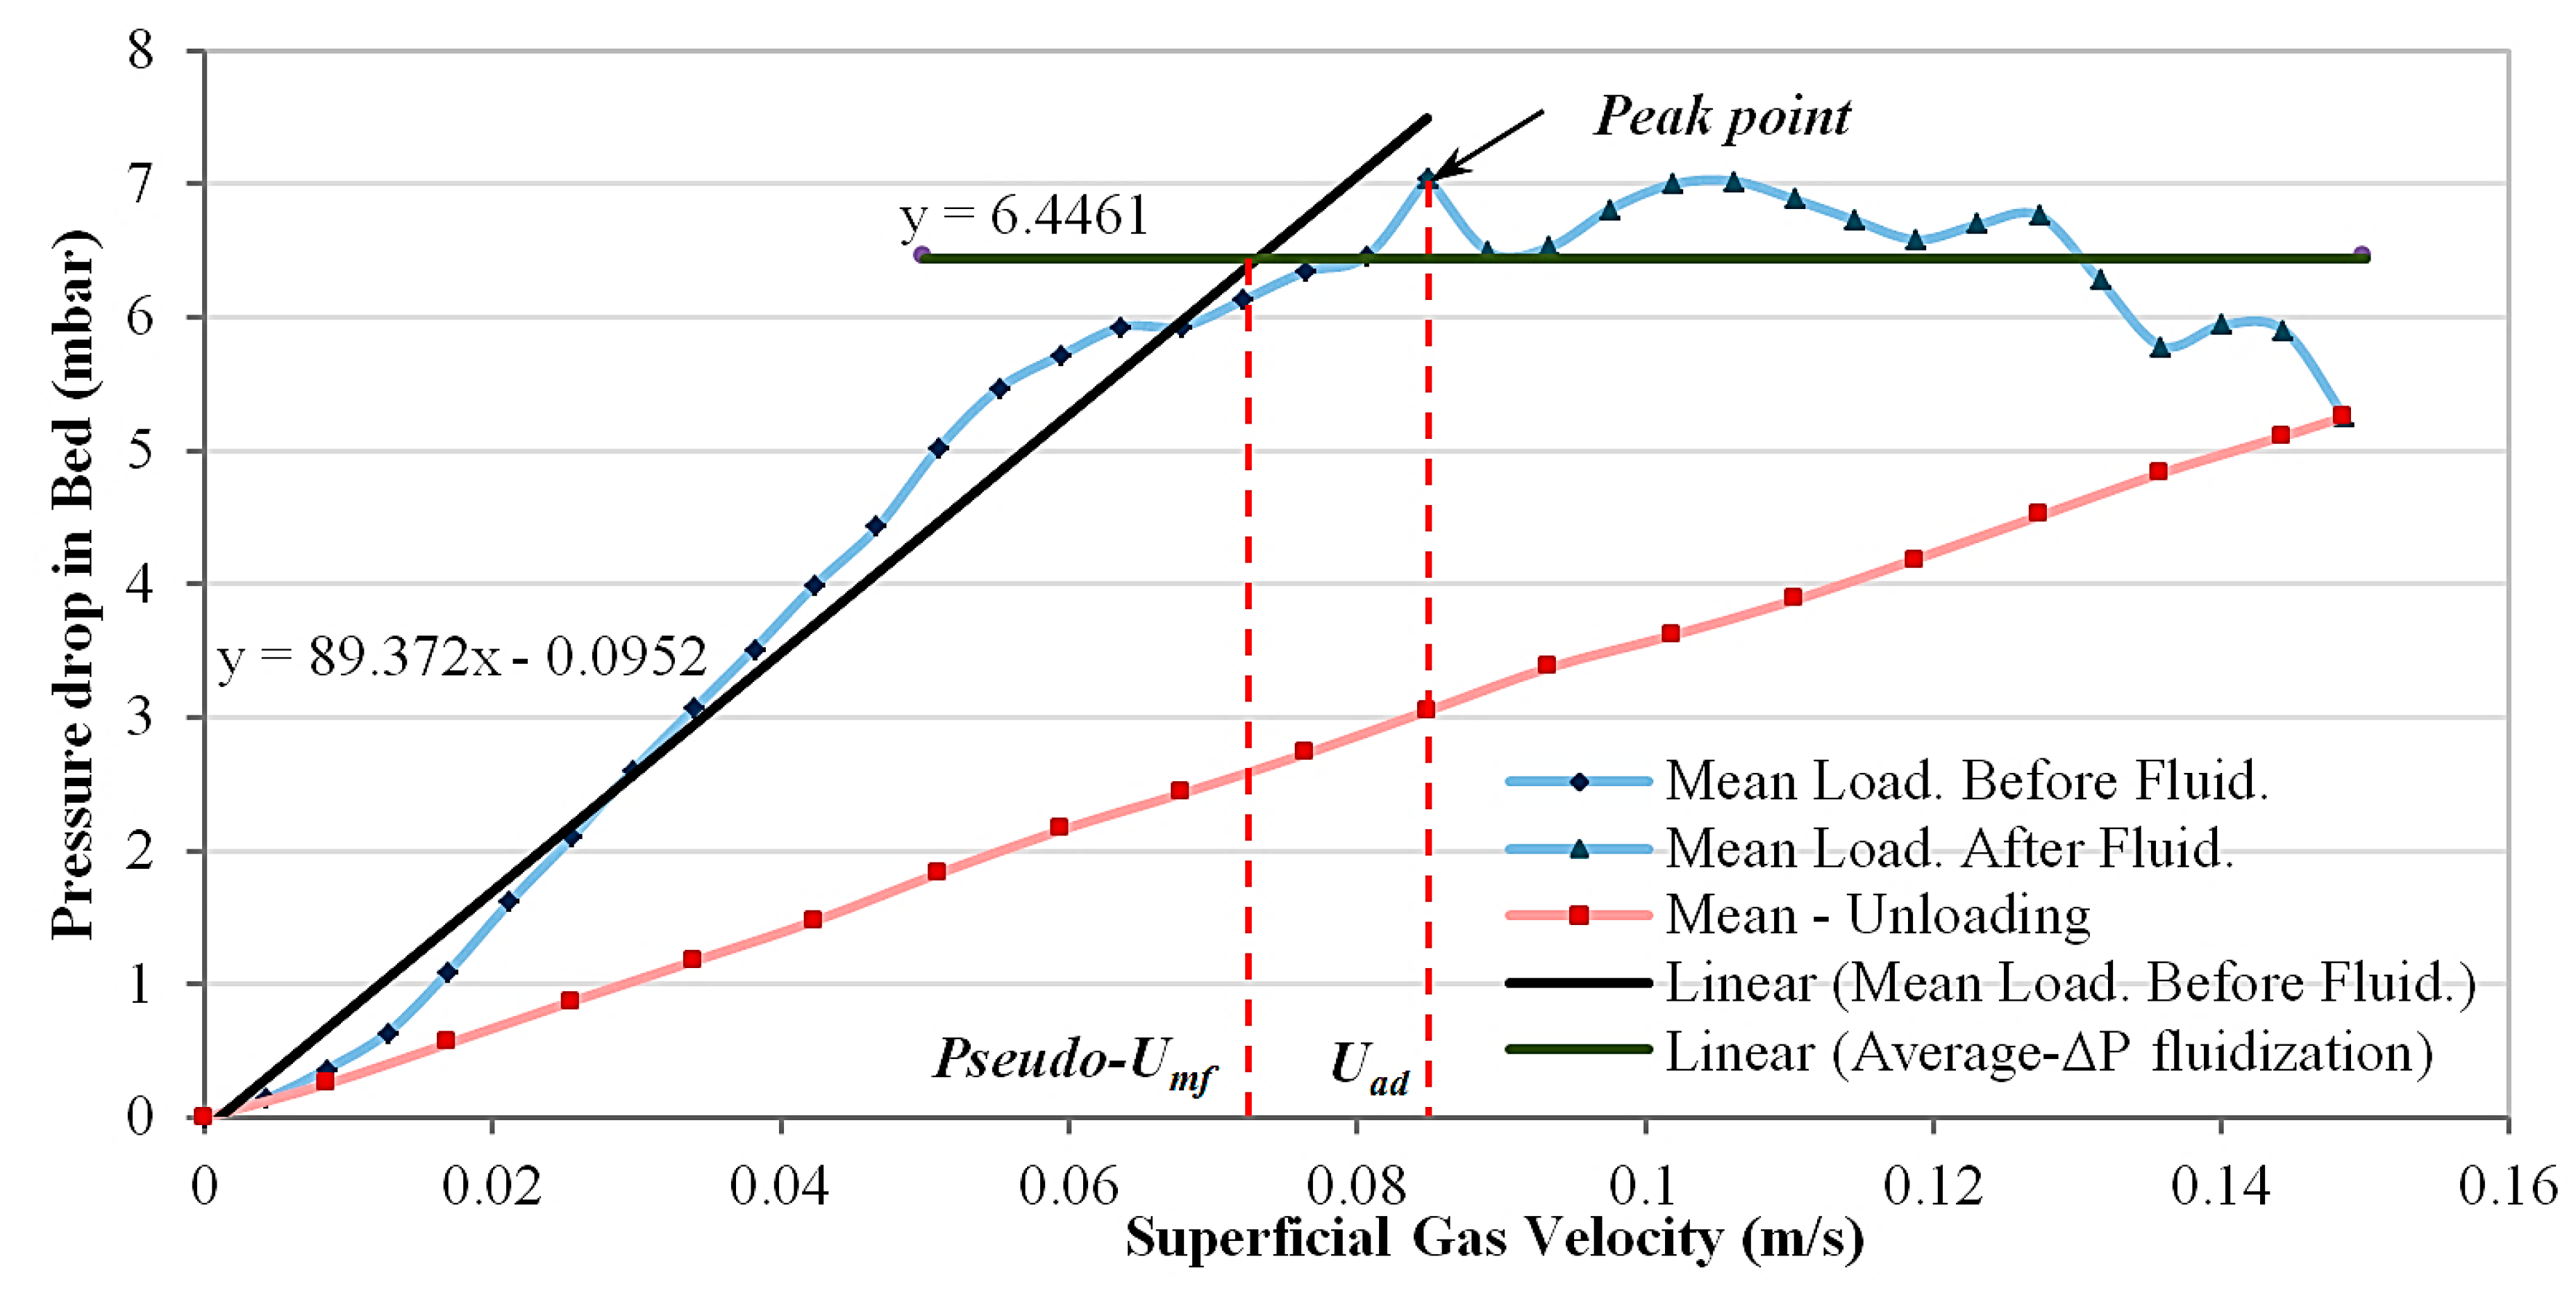
On the other hand, the results of
Figure 15 show that the fluidization of ultra-fine particles is not a fully fluidized behaviour and that considerable pressure drop fluctuations occur during the loading stage. According to the previous definition, the superficial gas velocity corresponding to the peak point is called the after-disruption velocity (
).
Figure 15 indicates that for ultra-fine material,
= 9.76 cm/s and the peak of bed pressure drop is 7.11 mbar. An accurate definition of
is impossible here, since the fluidization tests are not reproducible. However, using the mean value curve, a pseudo-
can be extracted from
Figure 15, based on the intersection of the extrapolated line of fixed bed condition and the mean-value line of the fluctuations of the bed pressure drop in the partial fluidization condition. This method leads to a pseudo-
of 8.19 cm/s for this case.
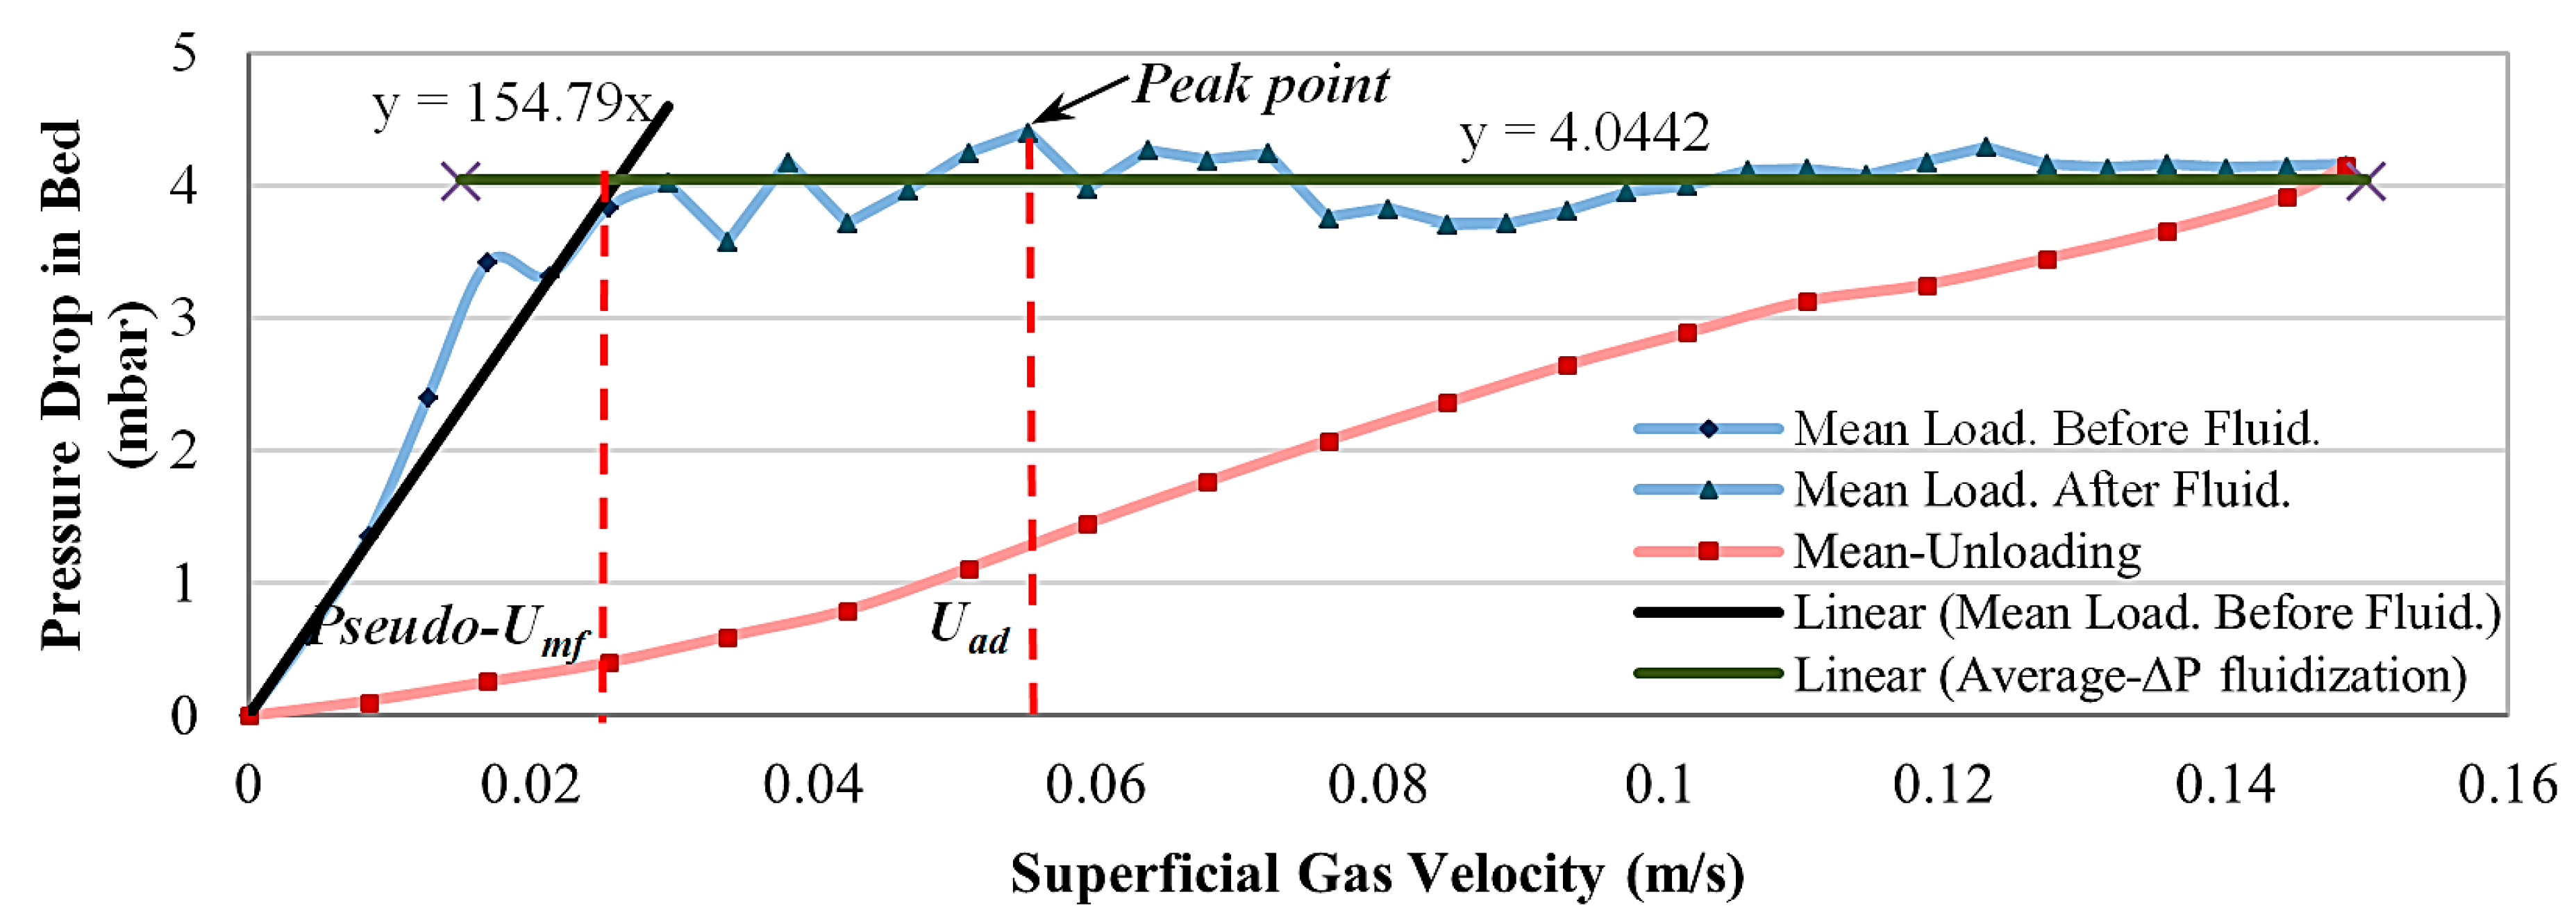
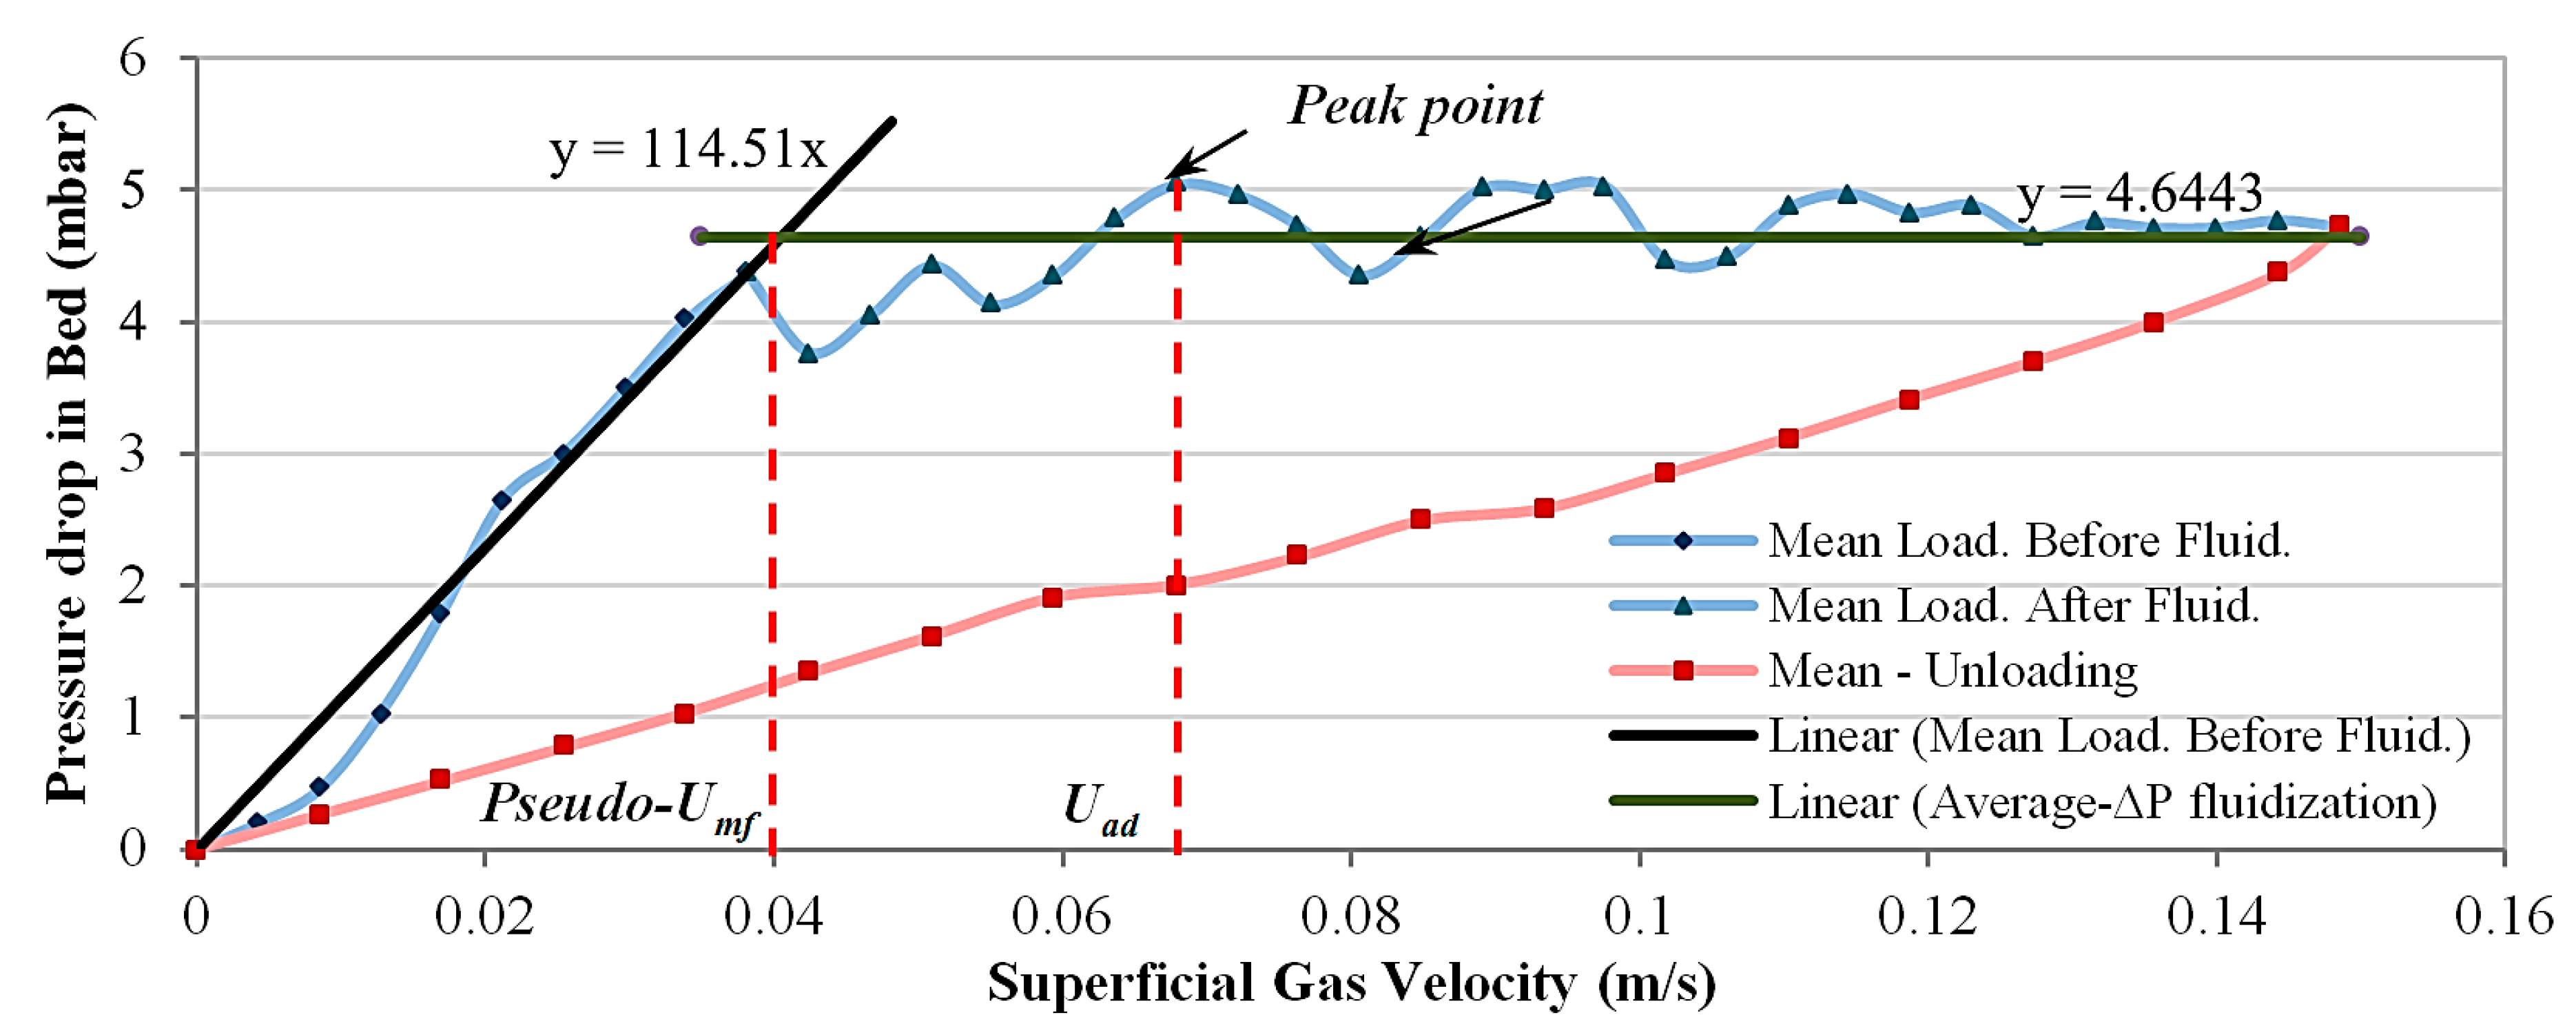
The previous conditions correspond to the two extremum conditions of only fine or only ultra-fine particles. For different combinations of the primary materials,
Figure 16,
Figure 17 and
Figure 18 depict the behaviour of the mean bed pressure drop averaged over all realizations.
The figures also show the peak point (corresponding to the maximum of ), the after-disruption velocity related to this point and the fitting lines used for estimating pseudo- velocities. Comparing the average curves in the loading stage, it appears that by increasing the ultra-fine material in the mixture, the peak value of increases (4.407, 5.04 and 7.05 mbar for 30%, 50% and 68% of the ultra-fine material in the total weight of the mixtures, respectively). The superficial gas velocities corresponding to these peak points () also increase when increasing the percentage of ultra-fine powders in the mixture (they are 5.5, 6.79 and 8.49 cm/s, respectively). In addition, the results show that by increasing the percentage of ultra-fine powder in the mixtures, the obtained pseudo- velocities also increased (2.6, 4.06 and 7.32 cm/s for 30%, 50% and 68% of ultra-fine material in the mixtures, respectively). Generally speaking, increasing the percentage of ultra-fine materials in the mixture causes a delay in the onset of partial fluidization (it appears first at higher superficial gas velocities), an increase in the bed pressure drop, as well as a delay in reaching the peak point.
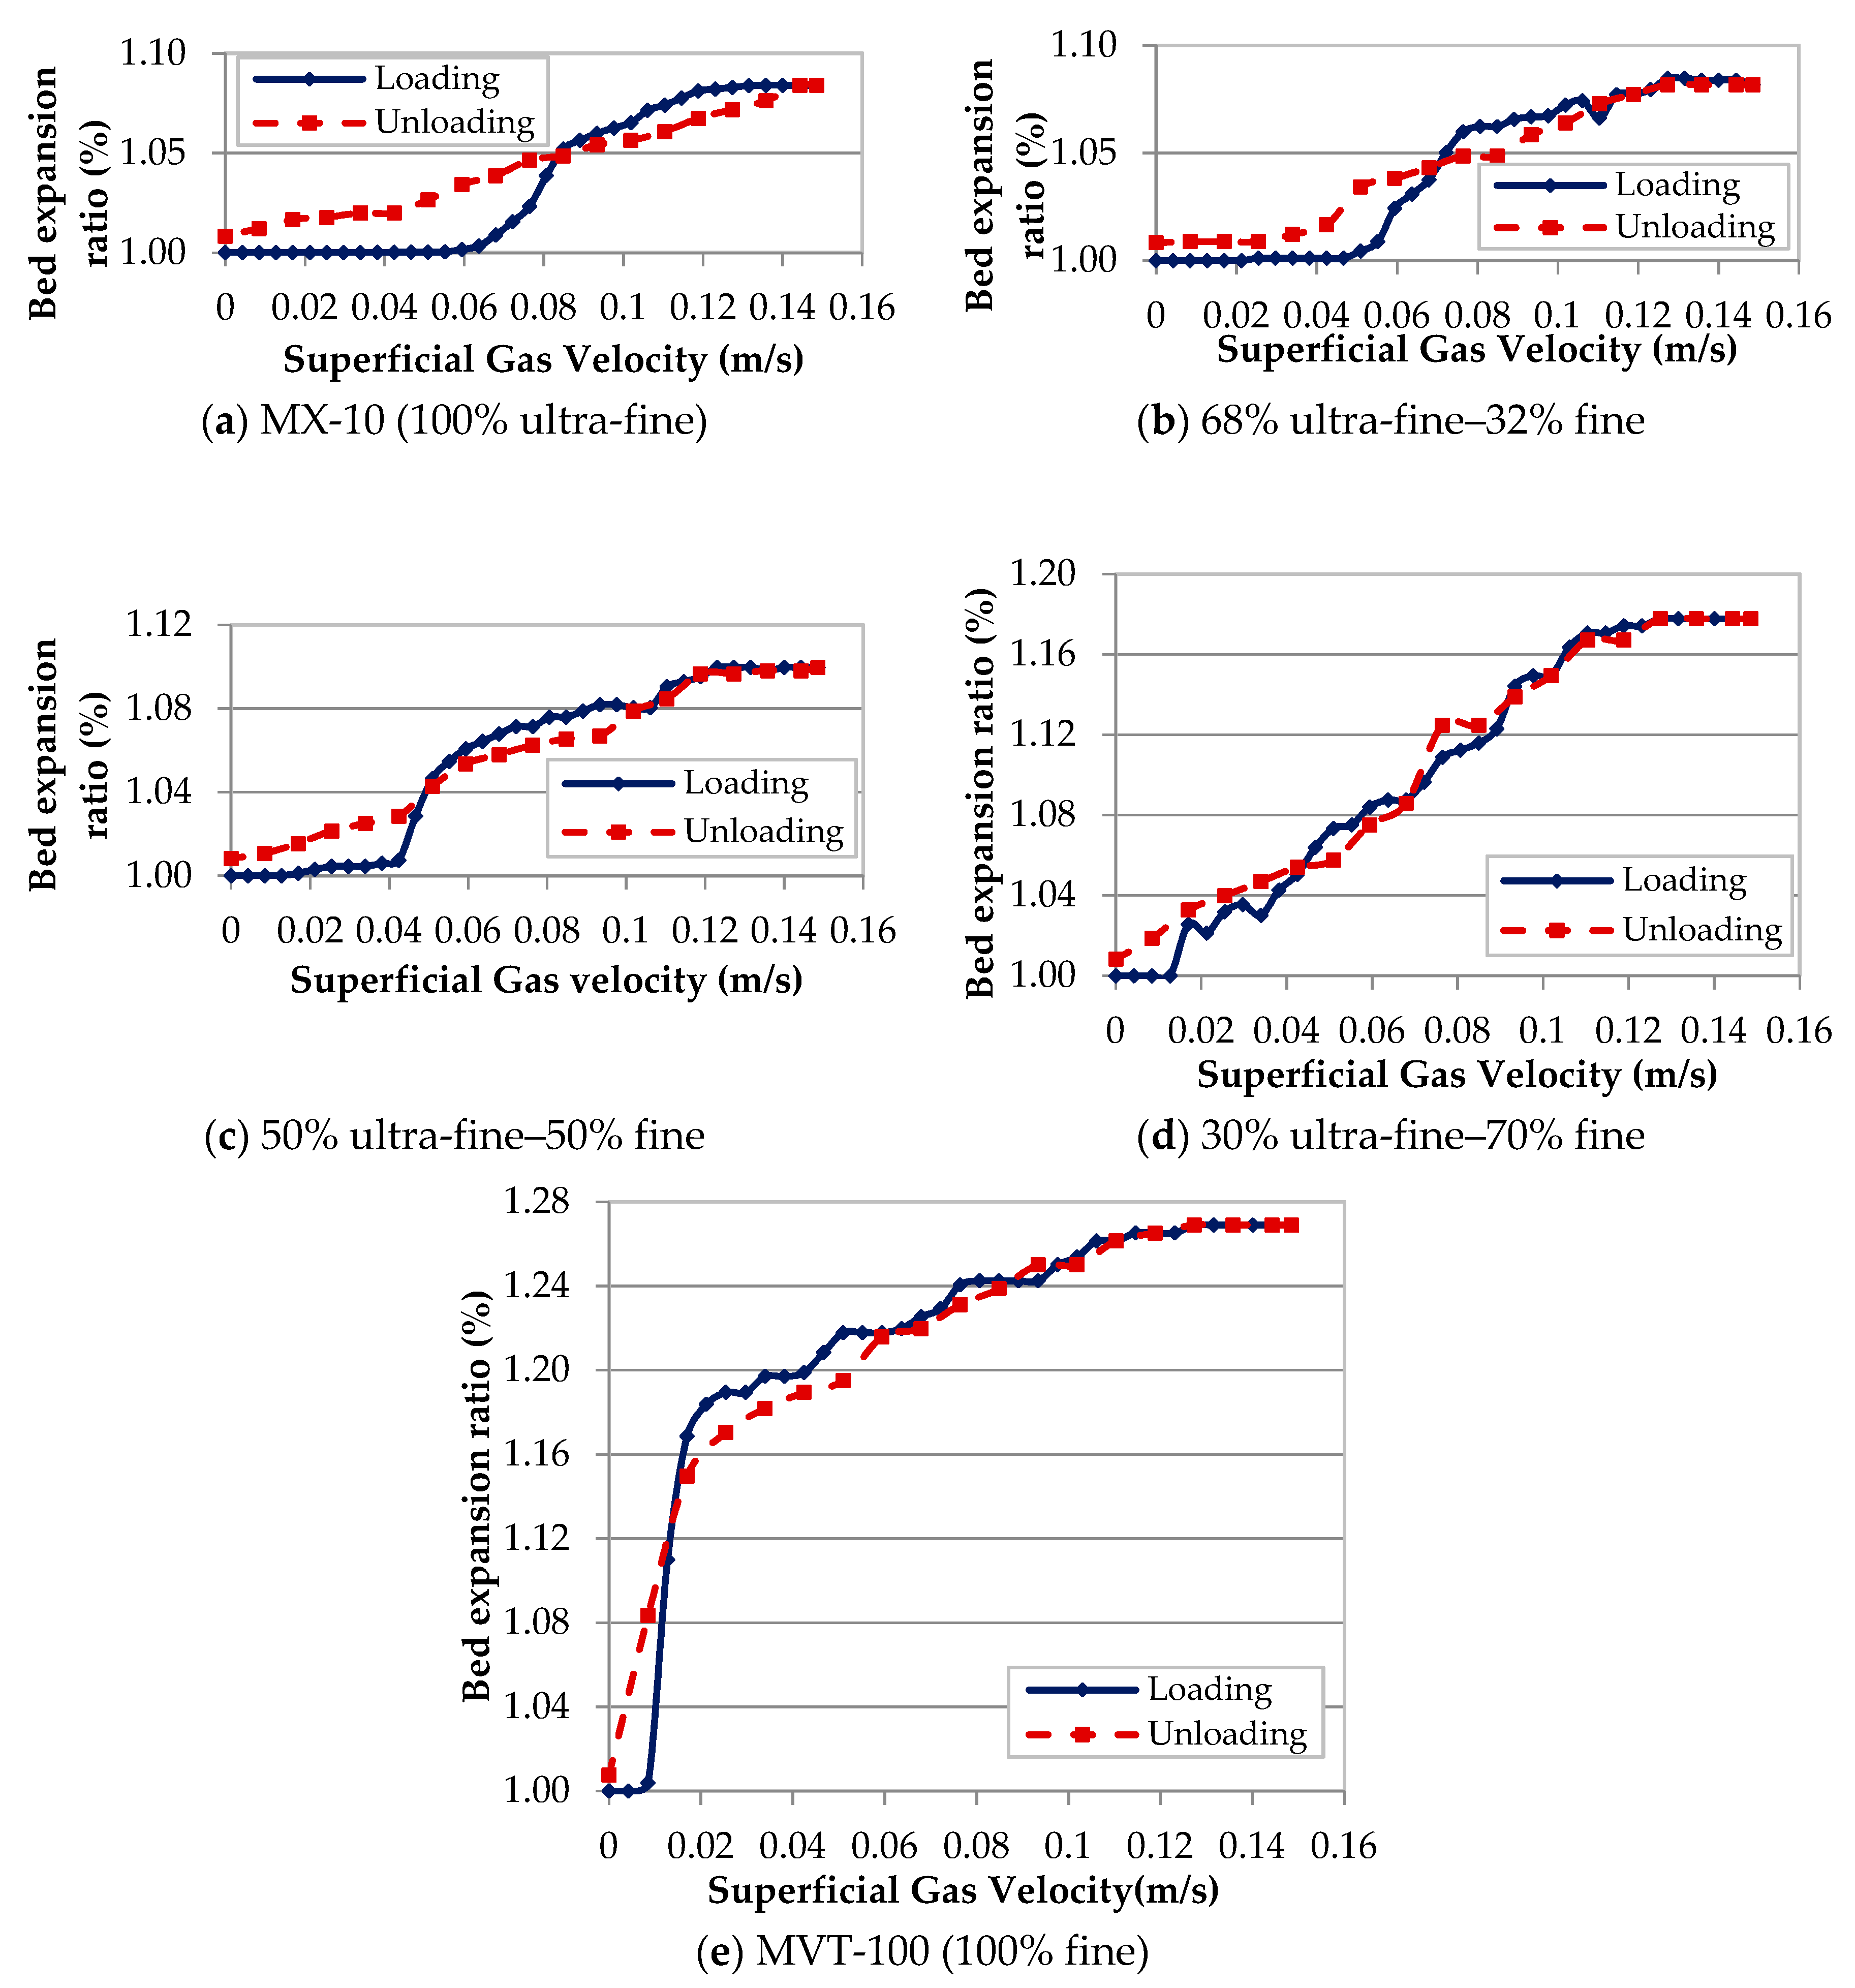
4.4.1. Bed Expansion Ratio
To understand better the behaviour of different mixtures of materials during fluidization,
Figure 19 shows the bed expansion ratio (%) of the bed when increasing the superficial gas velocity. This figure shows that at the beginning of the unloading stage (right part of the figures), the height of the bed during loading conditions is always higher or equal than during unloading for a given value of the superficial gas velocity. During fluidization, due to the spouting particles from the channels, the height of the central part of the channel decreases and the height of its peripheral part increases. In addition, the location of the channels also changes when changing the superficial gas velocity. As a consequence, a non-level surface is observed. For this reason, an average height calculated over the whole surface (see
Section 3 for the methodology) has been used as height in
Figure 19.
At lower superficial gas velocities (left part of the figures), the bed height for unloading is higher than for loading. It is noted that the loading and unloading curves cross each other at a velocity near the calculated pseudo-
for all mixtures. In addition, by increasing the percentage of ultra-fine particles in the mixture, the bed expansion ratio (%) decreases and the total expansion of the bed after unloading increases.
Table 4 shows the values for the bed expansion ratio (%) and the total expansion of the bed for better comparison.
4.4.2. Aggregation States of Cohesive Powders
For describing the observed behaviour, the fluidization of ultra-fine cohesive powders is studied first. Cohesive powders usually show three different states of aggregation, that is, individual particles (agglomerate-free), natural agglomerates, as well as fluidized agglomerates [
2]. Due to the relative motion between ultra-fine particles, they form quasi-spherical agglomerates when kept in a container or during transfer to the fluidization column, which are named natural agglomerates. This kind of agglomerates is lightweight and breakable. Also, they have a relatively narrow size distribution.
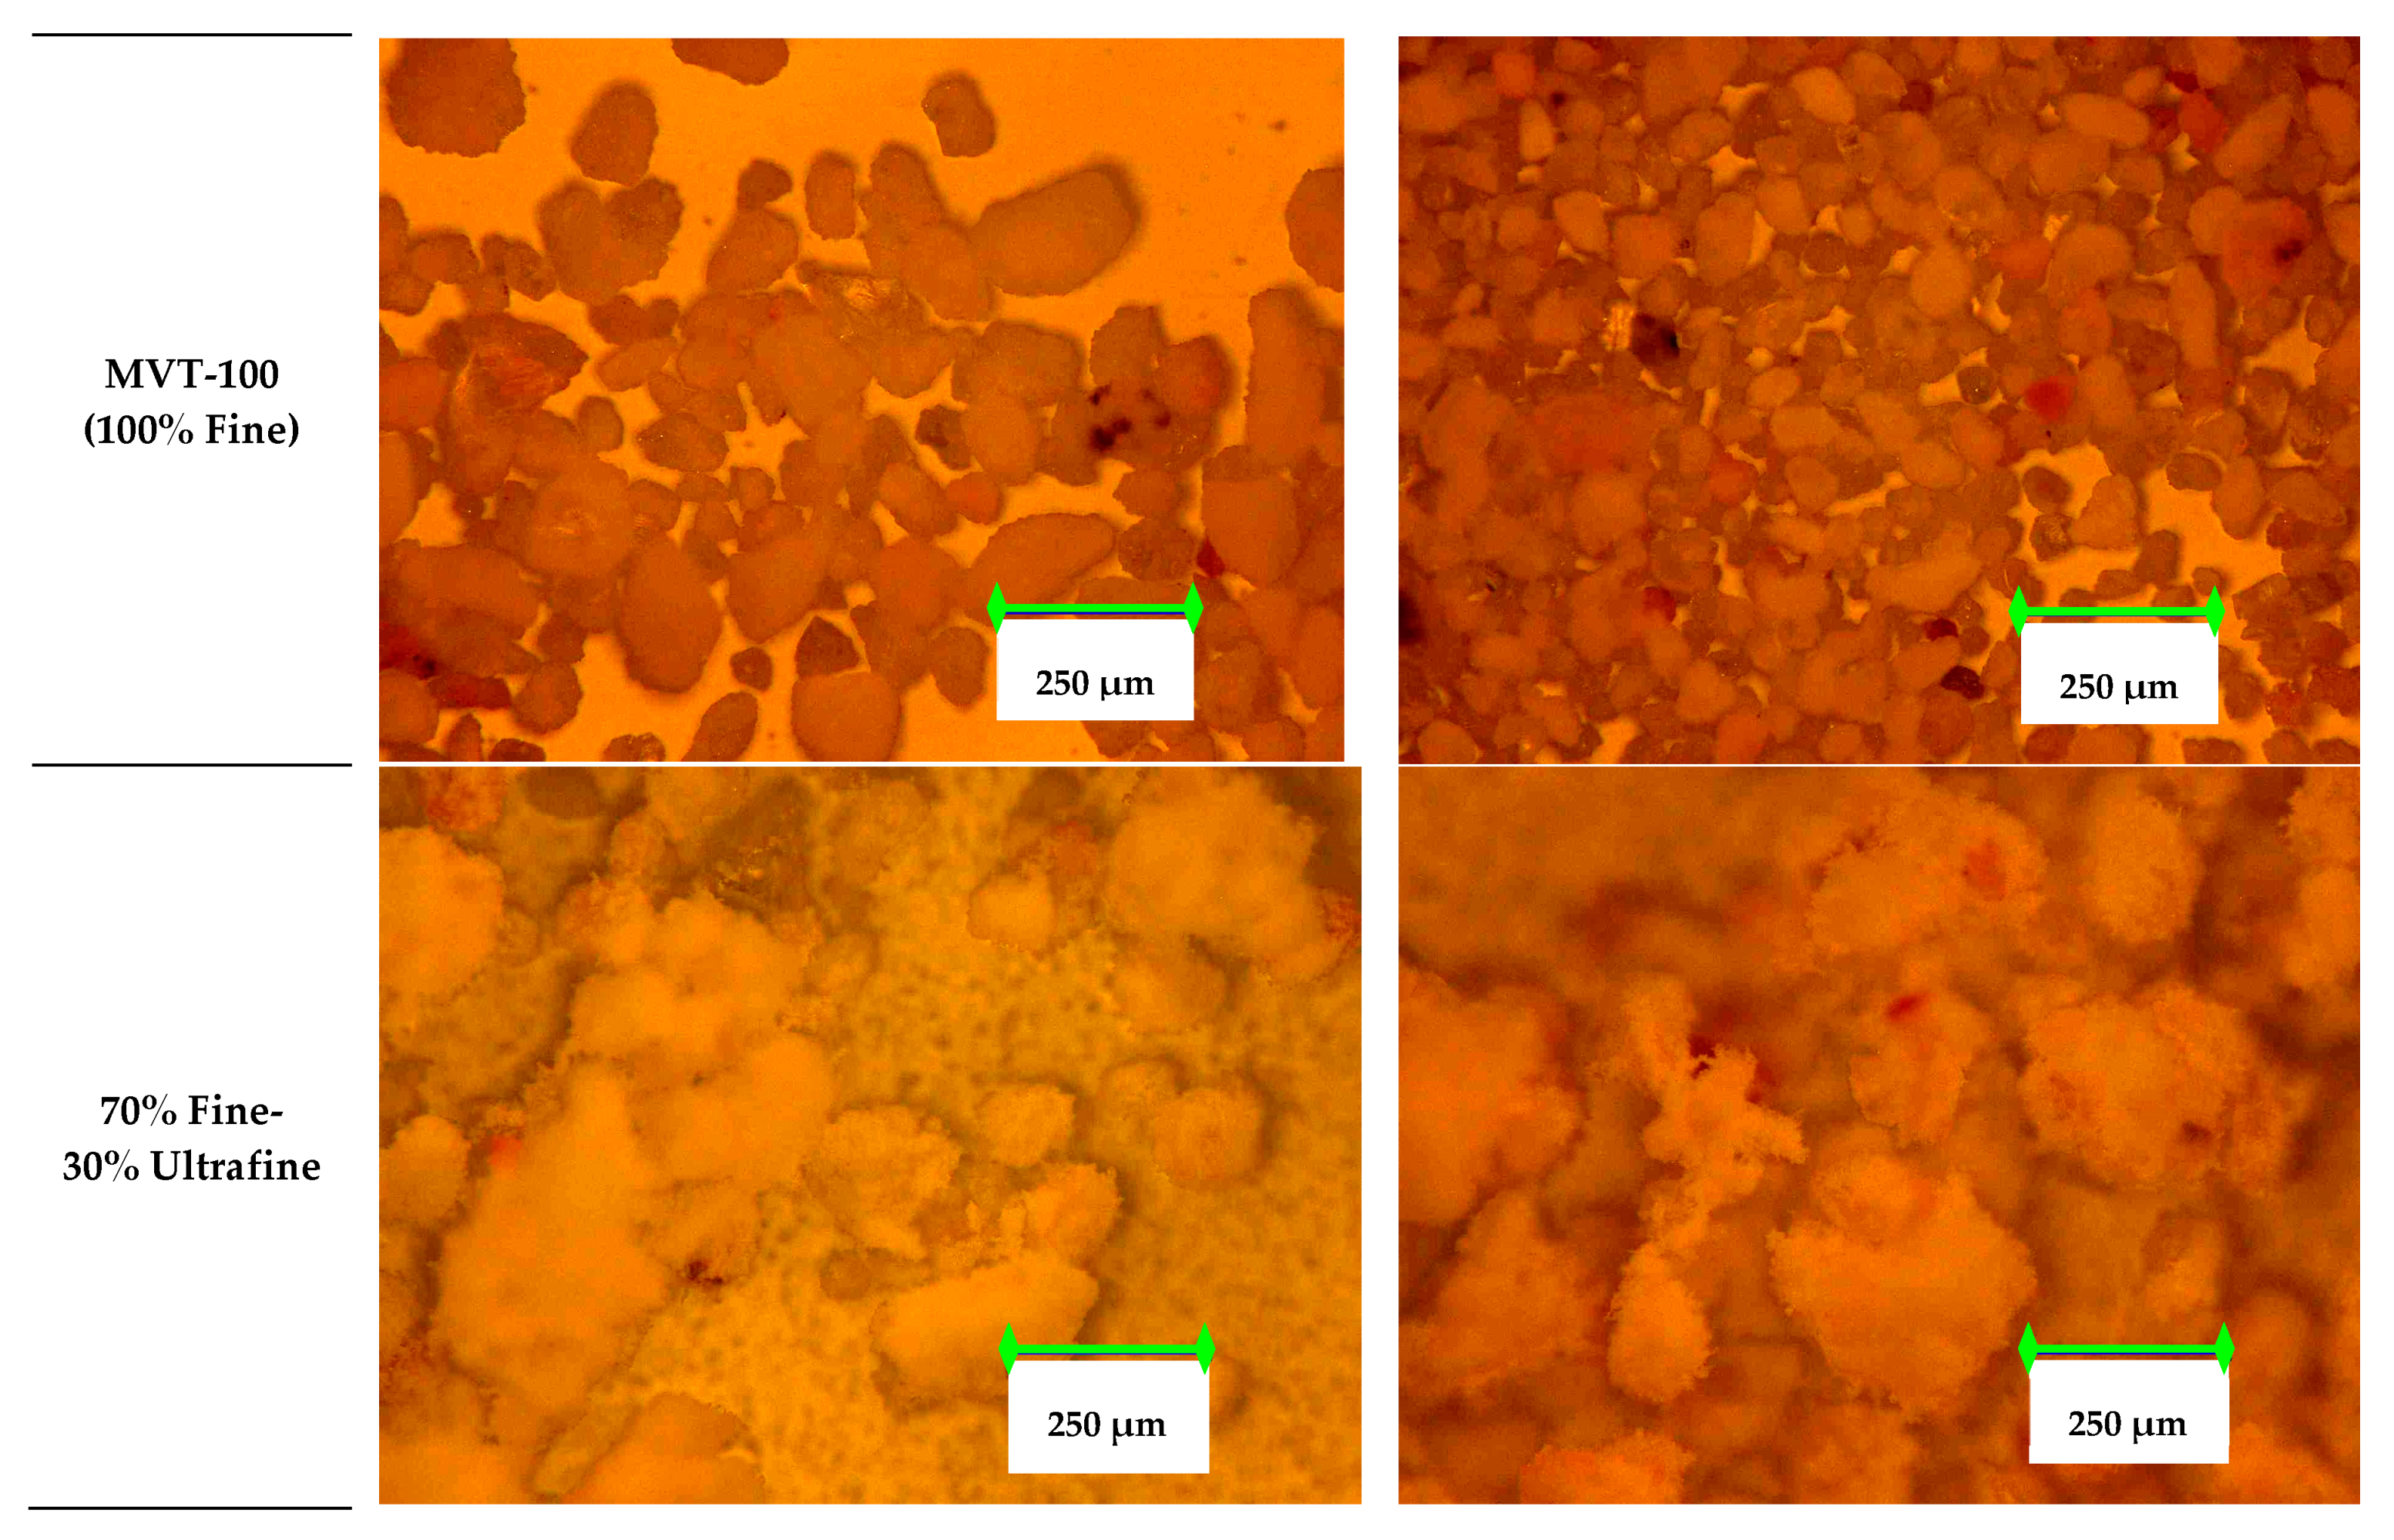
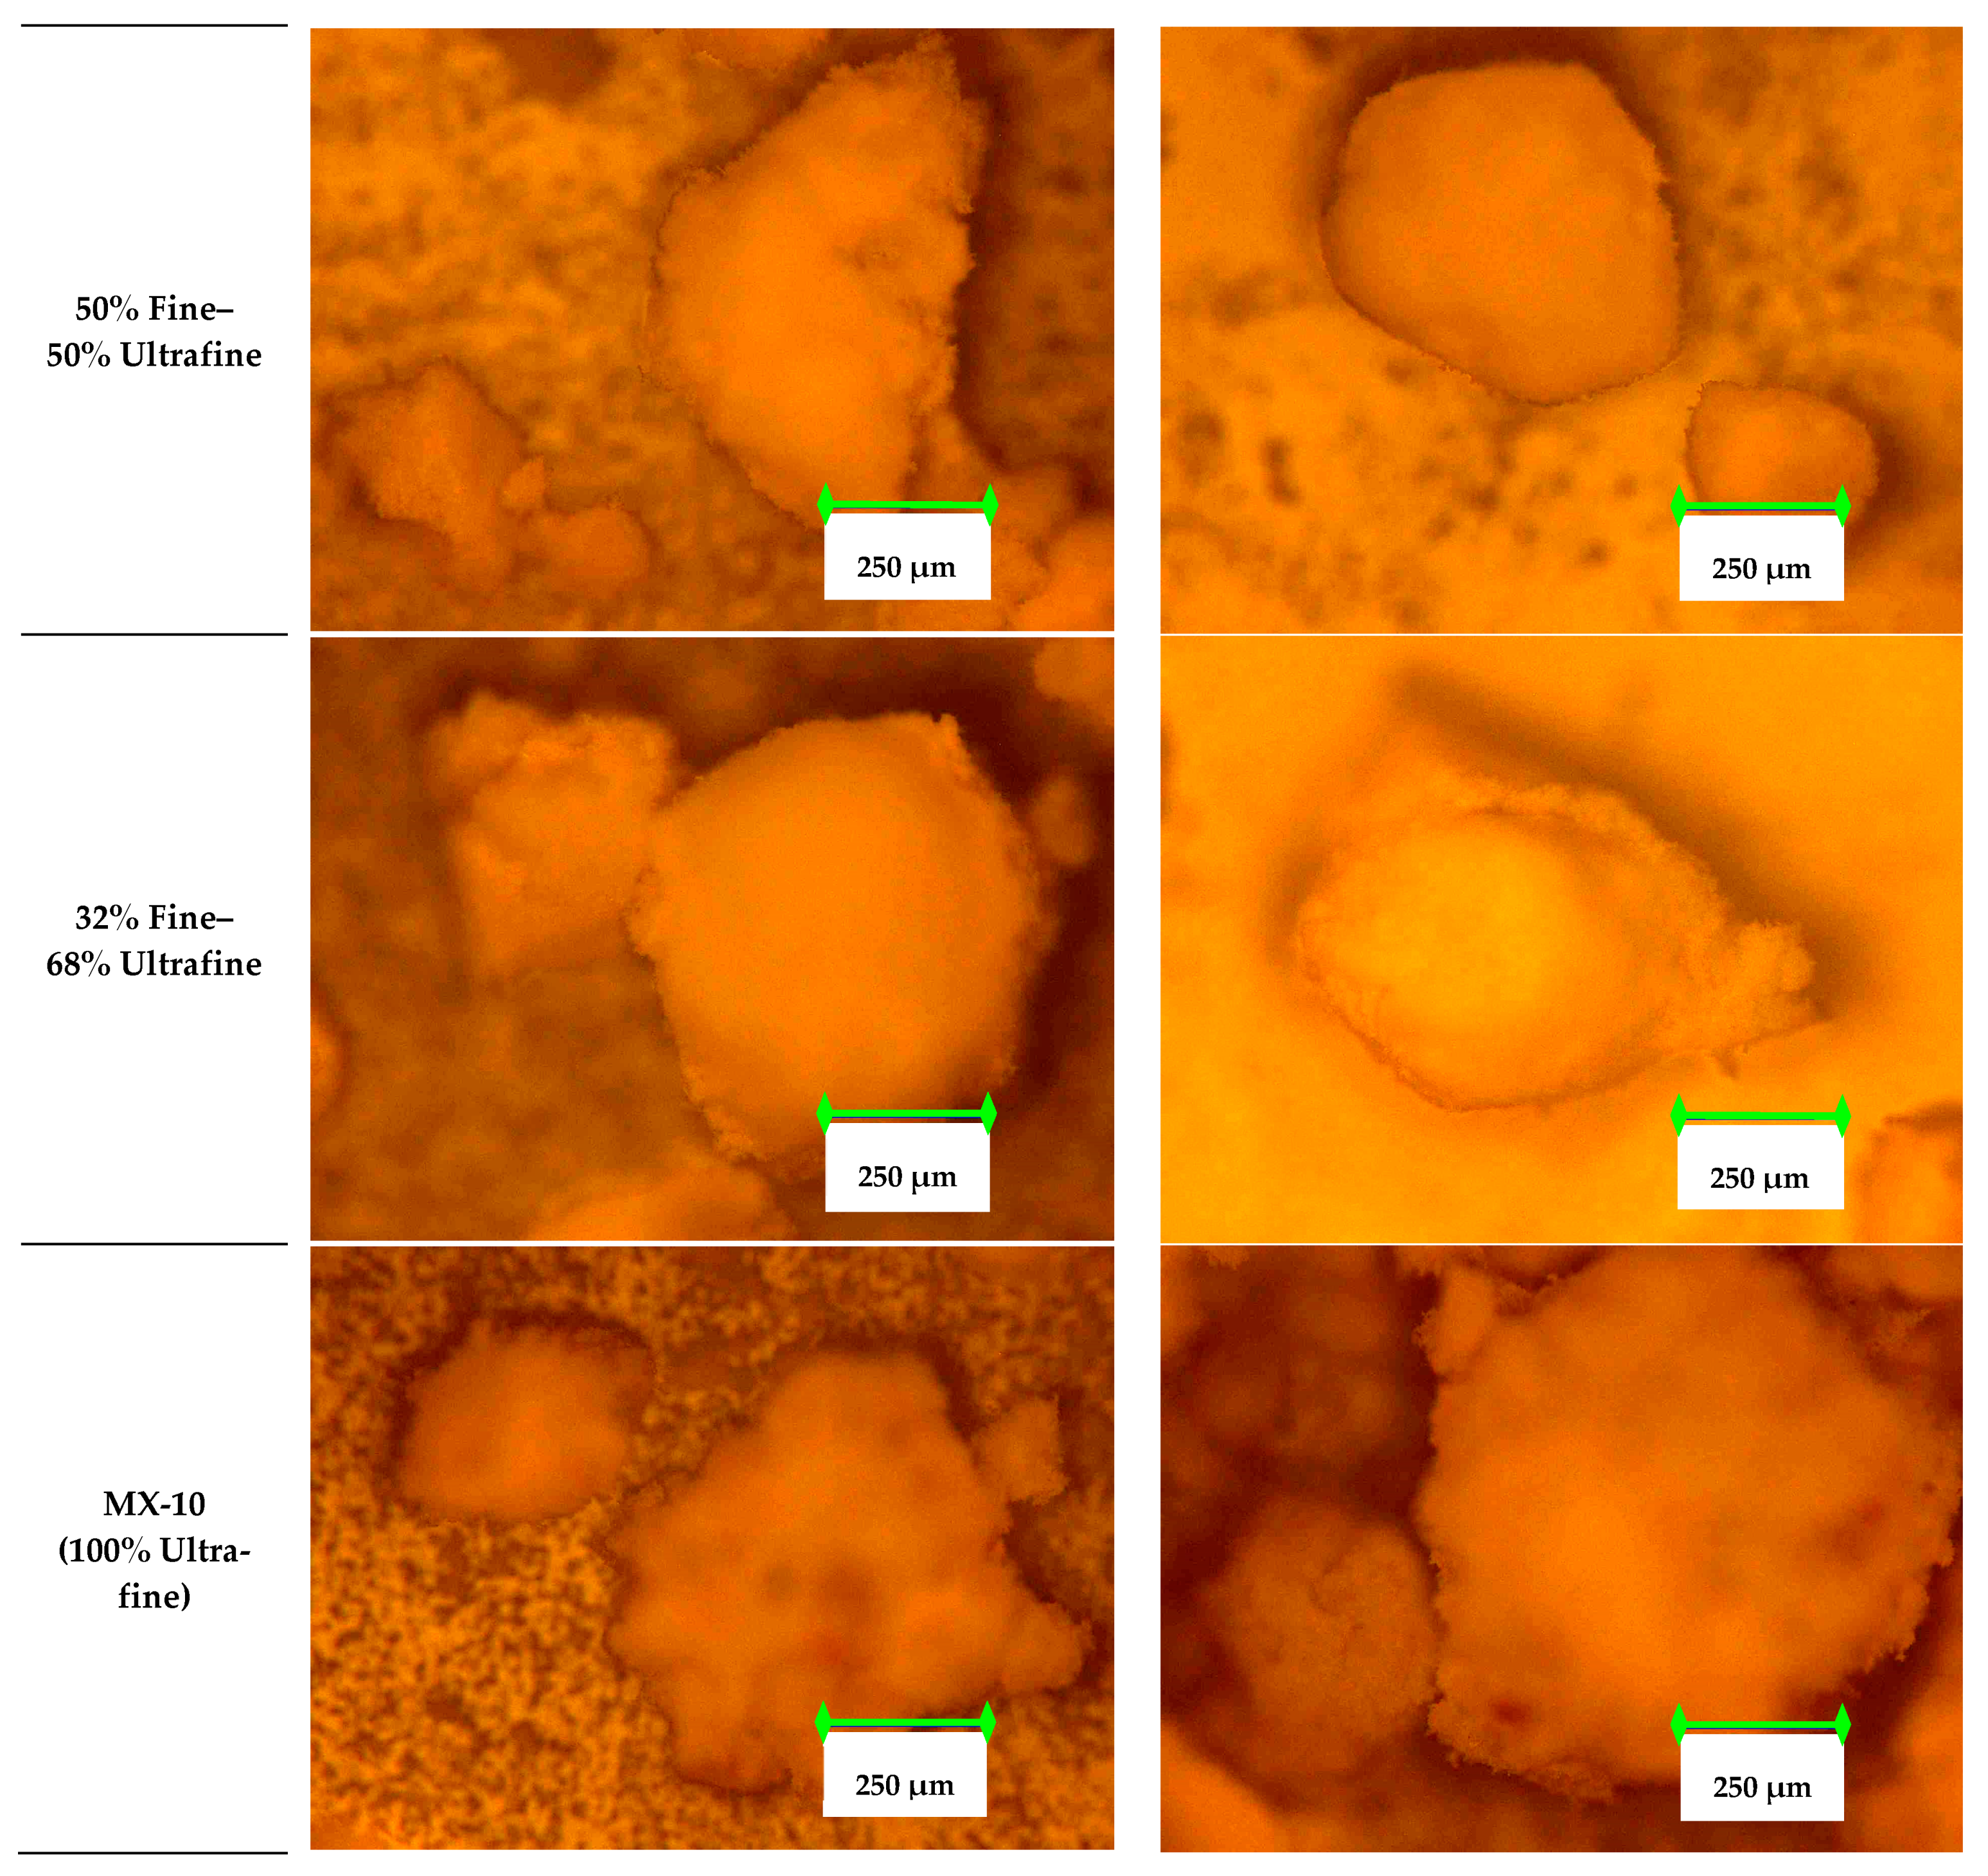
Figure 20 shows the natural agglomerates of fine, ultra-fine and different mixtures of these two materials. The shape, size and structure of the formed natural agglomerates of each mixture have been captured by a KEYENCE digital microscope system VH-Z250R (real zoom lens from 250
to 2500
).
These pictures taken from the microscope show that for fine particles, almost all of the particles are single particles with different shapes and sizes according to the size distribution of this material. The natural agglomerates of the mixture of 70% of fine and 30% of ultra-fine particles show some small agglomerates, mostly with fine particles in the core. This means that the ultra-fine powders stick to the surface of fine particles and form agglomerates. By increasing further the percentage of ultra-fine powders to 50, 68 and 100 percent, thus increasing the value of cohesiveness, the size of natural agglomerates increases. The pictures also show that the sphericity of the agglomerates is increased when increasing the ultra-fine particles in the mixture.
After starting fluidization, in a competition between the transport of agglomerates by the gas flow and the cohesive forces between them, they become restructured regarding the number of constituent particles. They can be disintegrated into smaller agglomerates or even single particles. This new configuration of agglomerates is called fluidized agglomerates. Due to considerable cohesive forces between the agglomerate and peripheral adhered particles, some larger agglomerates may be created. When increasing the size of agglomerates due to high cohesive force between particles, more kinetic energy (superficial gas velocity) and larger forces (bed pressure drop) are needed to reach the disruption point and start fluidization (even partial). Therefore, due to the high intensity of cohesiveness, the maximum bed pressure drop (peak point) during fluidization process is expected to move toward a higher superficial gas velocity for pure ultra-fine powders, as confirmed by the present measurements.
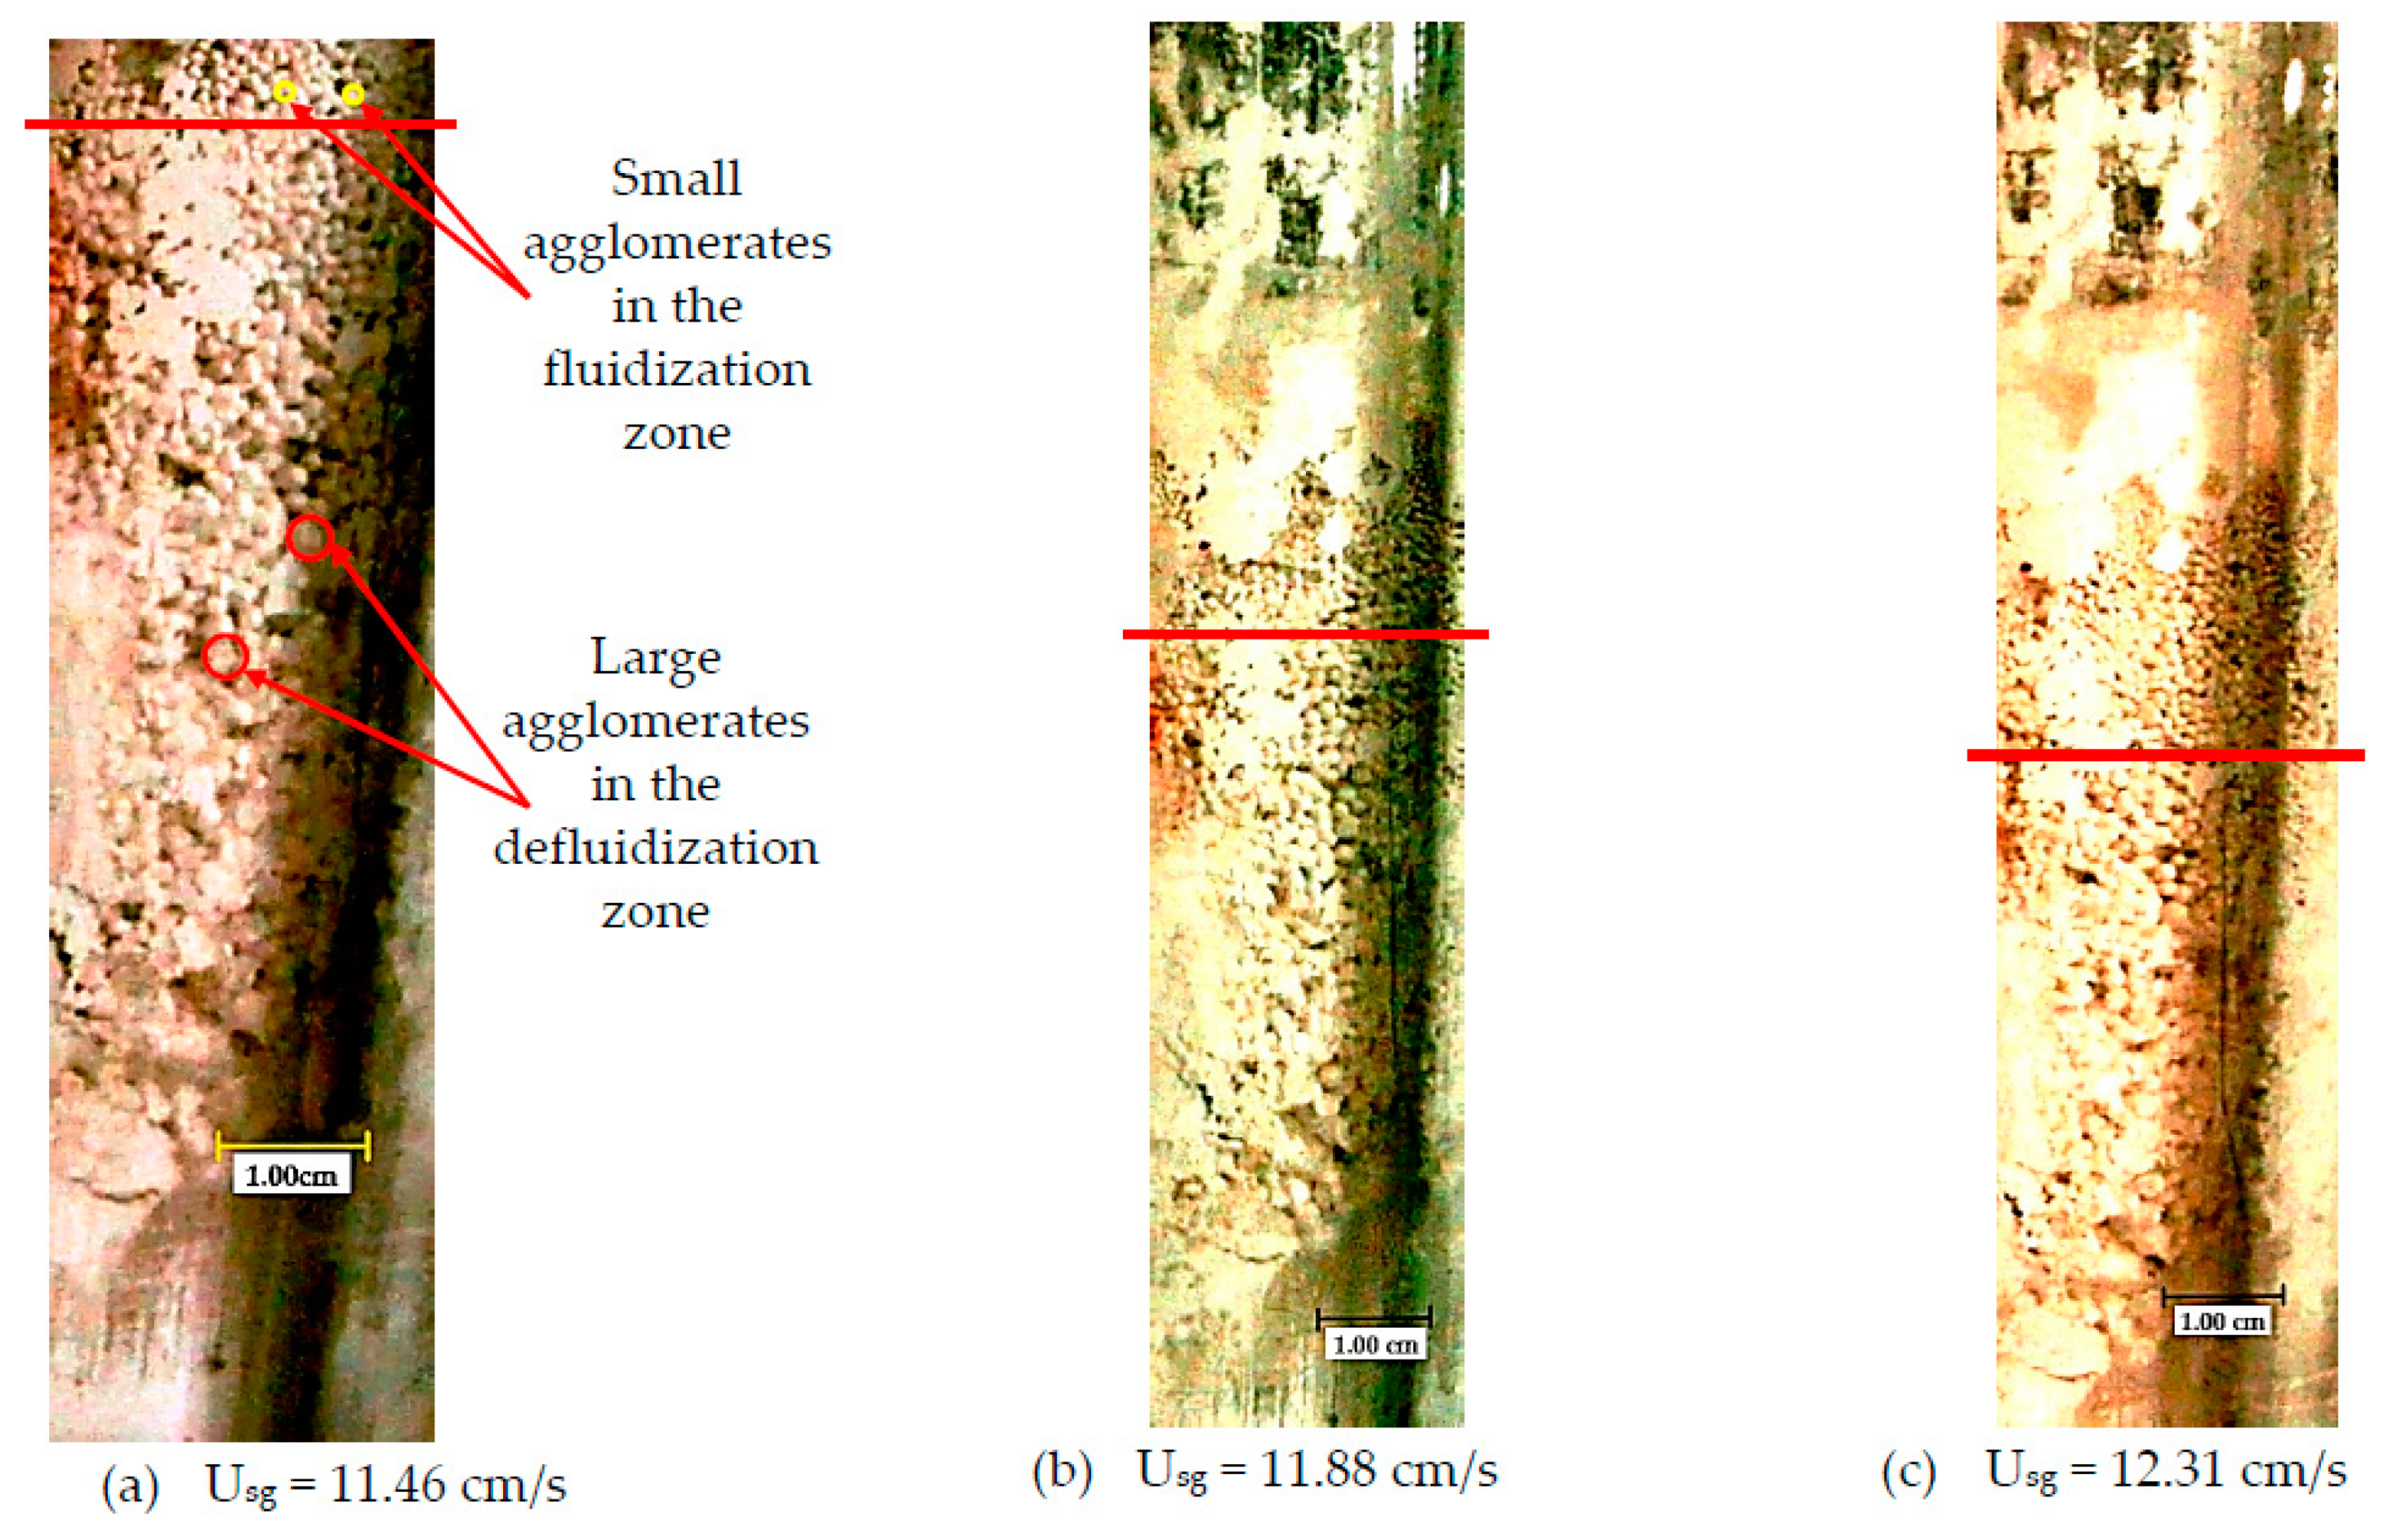
Figure 21 shows the fluidized agglomerates formed in the ultra-fine powder fluidized bed for three different superficial gas velocities. Due to the sticking of the ultra-fine particles to the walls leading to the build-up of an opaque layer, a detailed optical analysis is not possible in general. However, these images reveal the general morphology of semi-spherical fluidized agglomerates. Considering the size distribution of the powders for this material (<10 μm), all of the observed semi-spherical objects in this figure are the formed agglomerates during the fluidization process. The size of agglomerates varies from almost 3 mm at the bottom of the de-fluidized region to dozens of micrometres for the spouting agglomerates in the channel opening. The fluidized and de-fluidized zones are separated by red lines in each picture.
4.4.3. Effect of Mixing Fine and Ultra-Fine Materials on the Agglomerates
Mixing fine particles with ultra-fine powders improves the fluidization behaviour of ultra-fine powders for two reasons. First, the smaller fine particles can form new agglomerates; that is, ultra-fine particles stick to the surface of fine particles to form some stable agglomerates. Baeyens et al. [
46] reported that the ultra-fine powders adhere to larger particles, rather than they agglomerate with each other. Second, crushing and breaking of the formed agglomerates occurs due to friction or collisions; this is particularly frequent in the presence of larger fine particles [
25] and changes the size distribution. Agglomerates containing fine particles are not necessarily bigger but can reach a far higher weight than those containing only ultra-fine powders. Therefore, they can get more kinetic energy and more easily disintegrate by collision or friction. Thus, the size of these agglomerates becomes smaller. After each collision, depending on agglomerate density, on the relative collision velocity, on the distance between agglomerates or particles, some new agglomerates are created. This process increases the variety of agglomerate sizes (leading to a wide size distribution for the formed agglomerates) and their structure becomes denser (as discussed before).
Shear cell tests already showed that the intensity of cohesiveness decreases when increasing the portion of fine particles (see
Table 3). Thus, by increasing the percentage of fine particles in the mixture, the fluidization behaviour in such a mixture (partial fluidization) is further improved, so that the disruption point is reached at a lower superficial gas velocity and lower bed pressure drop. In parallel, by increasing the percentage of fine particles in the mixture, the probability of the breakage of agglomerates increases in two ways. First, forming some new agglomerates with fine particles in the core; these have more weight and more kinetic energy than the agglomerates formed during collisions by ultra-fine particles only. The second way is the existence of some larger fine particles (up to 200 µm) in the bed. The larger fine particles have a bulk density near to the particle density. Then, they have more weight and more kinetic energy than any agglomerates formed by finer particles.
A wide size distribution results in the smaller void sizes [
40] and the enhanced fluidity [
42]. This wide distribution increases the chance of filling the available voids between larger particles (agglomerates) by finer ones. Therefore, the size of micro-voids is decreased, hindering the growth of cracks between particle layers. In addition, decreasing the intensity of cohesiveness decreases the ability to form arches between particles [
47], resulting in a denser mixture.
According to Geldart et al. [
1], a strong intensity of cohesiveness leads to an increase in the number and size of micro-voids, as also described by Massimilla and Donsi [
3]. Numerous horizontal and sloping cracks or channels form; then, the bed expands without true bubble formation. Conversely, decreasing the intensity of cohesiveness when increasing the number of fine particles decreases the size and number of micro-voids, limiting the growth of cracks and increasing the probability of small bubble formation. In fact, by decreasing the inter-particle forces, the small bubbles form, grow and disrupt the dense structure of the bed. Rising bubbles in the bed are the main reason for conversion of horizontal or sloping cracks to vertical channels. Thus, the formed cracks in the bed are converted much easier to vertical channels, leading to a further improvement in fluidization behaviour. In fact, this conversion increases the particles-air contact and forms the agglomerates.
For all mixtures, the observed fluidization is partial fluidization and the air flow does not fluidize the whole particle bed. Therefore, it is not necessary for the air to move the entire bed and overcome its weight. This fact can explain the decrease in the level of bed pressure drop at the peak point for mixtures containing a higher portion of fine particles, to lower values than the Pwb of the bed.
On the other hand, the wide range of the size of agglomerates, as well as reduced cohesion level in the compositions containing more fine particles, lead to a denser structure (similar to the structure of fine particles only). Then, the bed resistance increases against the gas flow. In other words, by increasing the portion of fine particles in the mixture, the bed pressure drop corresponding to each superficial gas velocity increases (packed bed condition). Therefore, the slope of the versus graph increases in the packed bed section of the loading curve.
However, for the case with 68% ultra-fines, increasing the portion of ultra-fine powders leads to increasing the inter-particle forces (
Table 3 shows only 2% difference in the intensity of cohesiveness between this mixture and ultra-fine material only). This can explain the increase in the peak of bed pressure drop. The mixture containing 68% of ultra-fines has properties very close to pure ultra-fine powders; thus, it is conceivable that it mimics ultra-fine fluidization behaviour. For this mixture, due to increasing inter-particle forces as well as forming agglomerates with a more uniform size distribution, the mixture has a lower bulk density and higher porosity (proved by the bed initial height for the same weight of material). Therefore, in the packed bed condition, due to the lower bulk density and higher permeability, the bed pressure drop for each specified gas velocity is lower than for the two other mixtures; the slope of the loading curve is reduced. However, this mixture needs a higher bed pressure drop for disrupting and overcoming the inter-particle forces.
To estimate the size of the formed agglomerates in each part of the fluidization tests of different mixtures of materials, the Ergun equation (Equation (12)) along with Wen & Yu equation (Equation (3)) can be used to calculate the mean value of agglomerates’ size. Considering the Ergun equation for the linear part (packed bed condition) of the fluidization curve, the mean value of agglomerate size in the three conditions (1. the initial phase of loading (near-zero velocity), 2. at slightly higher gas velocities in the fixed bed condition of loading, as well as 3. near to rest (near-zero velocity) state in the unloading condition), can be calculated as:
In addition, using the Wen & Yu equation, the agglomerate sizes can also be estimated at the fluidization point. Substituting the needed parameters in this equation, the mean value of agglomerates size can be obtained from
In these equations, the calculated pseudo- is used as . For the low-velocity condition, these equations predict slightly larger agglomerates for mixtures containing a higher portion of fine particles (it increases from 91 to 100 μm). On the contrary, at the minimum fluidization velocity point and due to increasing kinetic energy (increasing gas velocities), the mean value of agglomerates’ size is decreased (from 274 to 154 μm) when increasing the portion of fine particles, as already discussed previously.
After starting channelling, the small channels grow to a bigger one when increasing further the gas velocity and two distinct regions are established; that is, fixed and fluidized (active channel) zones. When the gas velocity increases further, these zones alternate in an unsteady manner during the experiment. In some cases, this is accompanied by moving and bursting of bubbles.
Figure 16,
Figure 17 and
Figure 18 also show that increasing the ultra-fine material in the mixture increases the hysteresis effect between loading and unloading curves. The hysteresis can be the result of the following three factors:
- (a)
the need for a greater force to overcome the cohesion forces between the particles,
- (b)
increase in the irreversible deformation of particulate materials in the fluidization process and
- (c)
energy dissipation during collisions or friction between particles or agglomerates.
According to Tomas [
48]: “Obviously, the finer the particles the “softer” are the contacts and the more cohesive is the powder.” It means that for ultra-fine particles, due to a high level of cohesive inter-particle forces and even without direct contact, there are some plastic, irreversible deformations for the particles close to each other. In the fluidization process, due to the kinetic energy provided by the fluidizing gas, the number of contact and collision increases. Therefore, due to softer contact behaviour, the irreversible deformations are higher for the mixtures with a higher proportion of ultra-fine particles. This induces a stronger hysteresis effect compared to mixtures with a lower amount of ultra-fine powders.
In addition to some irreversible deformation of ultra-fine particles due to cohesive forces, the formation and collapse of the channels and cracks in the powder bed and avalanching of different particle layers on each other can explain most of these irreversible deformations. The probability of irreversible deformation increases when increasing the proportion of ultra-fine particles.


 and
and 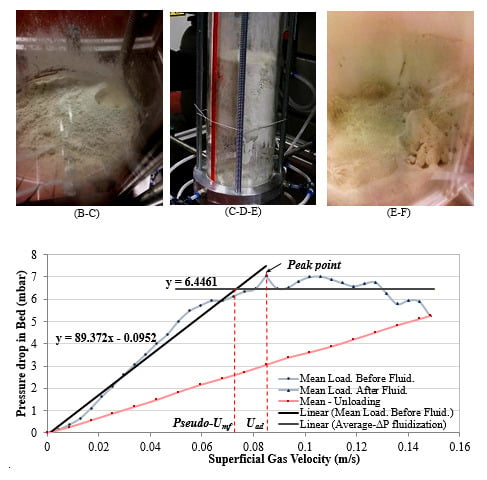


