Article

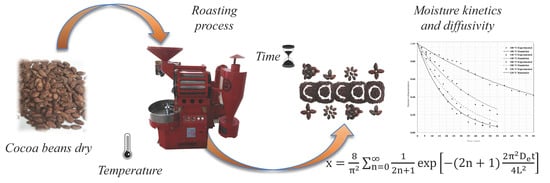
Kinetic Studies and Moisture Diffusivity During Cocoa Bean Roasting

by
Leydy Ariana Domínguez-Pérez
1,
Ignacio Concepción-Brindis
1,
Laura Mercedes Lagunes-Gálvez
1,
Juan Barajas-Fernández
2,
Facundo Joaquín Márquez-Rocha
3 and
Pedro García-Alamilla
1,*
1
División Académica de Ciencias Agropecuarias (DACA), Universidad Juárez Autónoma de Tabasco (UJAT), Carret. Villahermosa-Teapa Km 25 Ra. La Huasteca. Centro, Tabasco. C.P. 86280, Mexico
2
División Académica de Ingeniería y Arquitectura (DAIA), Universidad Juárez Autónoma de Tabasco (UJAT), Carret. Cunduacán-Jalpa de Méndez Km 1. Col. La Esmeralda. Cunduacán, Tabasco. C.P. 86690, Mexico
3
Centro Regional para la Producción más Limpia, Instituto Politecnico Nacional, Tabasco Business Center, Edificio FINTAB, Carretera Reforma-Dos Bocas, Km. 17+920, Ranch. Pechucalco, 2da. sección, Cunduacán, Tabasco, C.P. 86691, Mexico
*
Author to whom correspondence should be addressed.
Submission received: 17 September 2019 / Revised: 15 October 2019 / Accepted: 18 October 2019 / Published: 21 October 2019
(This article belongs to the Section Advanced Digital and Other Processes)

Abstract

:
Cocoa bean roasting allows for reactions to occur between the characteristic aroma and taste precursors that are involved in the sensory perception of chocolate and cocoa by-products. This work evaluates the moisture kinetics of cocoa beans during the roasting process by applying empirical and semi-empirical exponential models. Four roasting temperatures (100, 140, 180, and 220 °C) were used in a cylindrically designed toaster. Three reaction kinetics were tested (pseudo zero order, pseudo first order, and second order), along with 10 exponential models (Newton, Page, Henderson and Pabis, Logarithmic, Two-Term, Midilli, Verma, Diffusion Approximation, Silva, and Peleg). The Fick equation was applied to estimate the diffusion coefficients. The dependence on the activation energy for the moisture diffusion process was described by the Arrhenius equation. The kinetic parameters and exponential models were estimated by non-linear regression. The models with better reproducibility were the pseudo first order, the Page, and the Verma models (R2 ≥ 0.98). The diffusion coefficients that were calculated were in the order of 1.26 to 5.70 × 10⁹ m s−2 and the energy activation for moisture diffusion obtained was 19.52 kJ mol−1.

Graphical Abstract

1. Introduction

Cocoa beans (Theobroma cacao L.) are the raw material for several products in the food industry, cosmetics, and pharmaceuticals. The post-harvest cocoa bean processes have influence on the final chocolate product quality and chocolate characteristics; these depend a great deal on the roasting step process, in which many biochemical changes occur upon temperature changes. The roasting step process is conducted to reduce moisture, which might have an influence on the reactions that develop organoleptic properties, such as flavor, aroma, and color, in sum with another physicochemical changes of the intrinsic properties, such as the temperature of crystallization. All of these factors define the bean quality. In addition to the characteristics mentioned above, roasting reduces volatile compounds and tannins that are produced during fermentation [1,2]. Furthermore, the decrease in moisture allows for the shell to more easily detach from the bean, so that the nibs (beans without shell) can be obtained, and this creates a simpler bean-milling process that is more efficient while lessening the probability of damage by microorganisms, allowing for a longer period of preservation [3,4].
The roasting method that is most commonly used for cocoa beans is convection roasting (hot air roasting), whereby the seeds are subjected to high temperatures ranging from 150–250 °C for intervals of 30 min. to 2 h [5]. In addition, it should be mentioned that the seeds can be roasted in two ways; as cotyledons and as whole seeds [6]. This is why a difference of 10 to 12 °C in roasting temperatures has been defined for the cotyledon and the shell of the cocoa bean, to establish a heterogeneous roasting process. Producers in the chocolate industry only use the cotyledon and discard the shell, and the significant amount of cocoa butter that is transferred from the cotyledon to the shell represents a loss for the industry [2,7].
As for the quality and homogeneity of roasted cocoa beans, the operator or master roaster must adopt an artisan approach in adjusting the temperature and roasting time, while observing the changes in color and listening for the crack. These measurement skills are only acquired through experience, which is problematic because this ability cannot be passed on to another operator if consistent results are desired [8]. Today, the industry requires that its products always have the same characteristics in each batch and, because of this, it is vital to know the temperature and moisture distribution of the product in order to specify the equipment design and the production process. Therefore, there are now mathematical models that describe this process and they provide the necessary information on temperature and moisture [9].
The purpose of a mass and energy transfer model in a food production process is to describe the physical process as accurately as possible [10,11]. Mathematical models are an important tool for minimizing operational problems in the simulation of roasting, such as product damage, high energy consumption, hardness, palatability, and creation of products with a non-uniform quality, among others [12,13]. Knowledge of dehydration kinetics is necessary for the design, optimization, and control of the process [14].
Quality indicator models have three objectives: to understand, predict, and control [15]. The difference in the models is based on their defining systems; in each case, it is assumed that the limit conditions, transport mechanisms, and physical properties will vary [16]. In that sense, it is necessary to bear in mind that kinetic modeling implies that changes can be described in mathematical models with kinetic parameters, such as activation energy and velocity constants [15]. This will help in the design of equipment with adequate control of operating parameters [13].
In this regard, some empirical models have been proposed to describe the kinetics of dehydration in food products [17,18]. No complete model has been found to predict the moisture content over the entire drying time under different conditions and product types [19]. The theoretical model that has been used most in drying is Fick’s second law with an Arrhenius equation, since diffusivity is dependent on temperature [20] and it is considered as the mechanism of moisture transport in various roasting studies.
The most relevant aspects of drying and roasting technology are the mathematical modeling of processes and the experimental method [11]. In the drying process, experimental data are described while using different models, which are widely cited in the scientific literature due to the results obtained to describe drying kinetics [19]. The simulation of the roasting process through mathematical models is a widely used tool, since it helps to minimize operating problems, such as high energy consumption. It is necessary to use mathematical equations for the simulation and modeling of the kinetics of mass or moisture transfer, which are a function of the different conditions applied, while bearing in mind that any study carried out in simulation has to be validated to control the drying and/or roasting process [11,14]. Depending on the equations applied, models can be classified as theoretical, semi-empirical, and empirical [11,21,22]. Theoretical models generally use mass and energy transfer equations simultaneously, while taking food properties, such as particle geometry, shrinkage, diffusive moisture coefficient, and critical moisture content, into account [13,23]. In the case of empirical equations, kinetic models, such as Newton, Henderson and Pabis, Page, Wang-Singh, Logarithmic, and Two Term, among others, are used [13,14,24,25,26]. Although some empirical models may give good results for engineering applications in the food industry, they do not allow for the simulation of experiments performed under different conditions than those used to identify the parameters of the model. In such cases, a theoretical model might be more appropriate. Therefore, semi-theoretical models exist, which are widely used, as they offer a link between theory and easy application [9,13].
The objectives of this research were to evaluate moisture kinetics during cocoa bean roasting, compare the kinetic method with ten exponential models, and calculate the moisture diffusion coefficient by applying the analytical solution of Fick’s law in moisture kinetics during the roasting of cocoa beans. The results allowed for us to fit the best adjustment of the models (kinetic and exponential models), in addition to achieving the estimation of diffusivity coefficients as a function of temperature. The activation energy value was estimated from the diffusivity data, which allowed for the establishment of the minimum value that is required for the diffusion process to occur.

2. Materials and Methods

In this study, 80 kg of clean, fermented, and dried cocoa beans free of physical impurities were obtained from Intercambio Mexicano de Comercio, S. A. de C. V., located in Cardenas, Tabasco, Mexico. The cocoa beans had an initial moisture content of 0.07 g water/g dry matter.
The moisture content was measured by the gravimetric method [27]. Ten cocoa beans were used to determine the roasting time, and the samples were placed in a stove at 105 °C for 24 h until they reached a constant weight.

2.1. Experimental Roasting Procedure

The roasting process was performed in a rotating cylindrical structure geometry (100Mex®, Azteca, Mexico) with a three kilogram capacity. The roasting system was 40 cm long and it had a 16.5 cm radius and, inside, there was a system of baffles that allowed for the seeds to be mixed homogeneously during the roasting process. The insulated cylinder was gradually heated by a linear gas burner until the desired temperature was reached. The cylinder had two temperature measurement systems inside it, which recorded the temperature on the surface and inside the cylinder. The roaster had an air extraction system that consisted of an outside centrifugal separator. The roasting time started from the moment that the batch of cocoa was loaded into the system. The experiments were carried out at four temperatures: 100, 140, 180, and 220 °C. During the experimental trial, random samples were taken at intervals of 3 min. for 1 h, and all of the experiments were performed in duplicate.

2.2. Kinetic Model of Roasting

The experimental roasting data were described while using different models selected from the most commonly used equations in the literature on the drying and roasting kinetics of agricultural products, as described in Table 1. The kinetic equations of pseudo-zero order, pseudo-first order and second order were also used by solving Equation (1) (Table 2), while considering the value of “n” appropriately:
dx dt   =   kx n
where x = (xt/x0) is the ratio of moisture on a dimensionless basis; x0 is the initial average moisture, xt is the average moisture (g g−1 dry matter), t is the roasting time (min.), and k is the velocity constant and can be related to temperature by an Arrhenius equation:
k   =   k 0 exp ( E a RT )
where k0 is the pre-exponential factor, Ea is the activation energy (kJ mol−1), R is the universal gas constant (8.314 × 10⁻³ kJ mol−1 K−1), and T is the absolute temperature (K).
The activation energy was calculated by plotting ln (k) versus the temperature reciprocal (1/T).
The estimation of the equation parameters was performed while using nonlinear regression (Absoft Fortran). The parameters of each model were determined by minimizing the error between the experimental and calculated moisture. The fit of the mathematical models used in the roasting curves were evaluated using two statistical parameters: the sum of squared errors (SSE) and the coefficient of determination (R2).

2.3. Diffusion Model and Activation Energy

The roasting curves that were experimentally obtained were used to determine the coefficient of diffusivity of moisture, while using the equation of Fick’s second law.
x t   =   D e 2 x
An analytical solution of Fick’s law [28] was made, considering the sample as an infinite flat plate to estimate the diffusivity of moisture.
x   =   x t x 0 = 8 π 2 n   =   0 1 2 n + 1 exp [ ( 2 n + 1 ) 2 π 2 D e t 4 L 2 ]
De is the moisture effective diffusivity coefficient (m2 s−1), t is the roasting time (s), and L is half the thickness of the cocoa bean at zero time (L = 0.0039 m).
This equation was applied, while assuming one-dimensional moisture diffusion and constant effective diffusivity, without considering sample shrinkage or increase, uniform moisture distribution, and negligible external resistance.
lnx   =   ln 8 π 2 π 2 D e t 4 L 2
The diffusivity of moisture can be related to temperature by an Arrhenius equation:
D e = D 0 exp ( E a RT )
where De is the moisture effective diffusivity coefficient (m2 s−1), D0 is the constant equivalent to diffusivity at infinity temperature (m2 s−1), Ea is the activation energy (kJ mol−1), R is the universal gas constant (8.314 × 10⁻³ kJ mol−1 K−1), and T is the absolute temperature (K).
The activation energy was calculated by plotting ln (De) versus the reciprocal temperature (1/T). By linearizing Equation (6), the following is obtained:
ln ( D e )   =   ln ( D 0 ) E a R ( 1 T )

3. Results and Discussion

3.1. Roasting Kinetics

Figure 1 shows the moisture curves during roasting at the four temperatures used, being expressed as moisture content dimensionless with respect to time. Temperatures above 140 °C were used primarily for research purposes. The moisture content exponentially decreased as the roasting proceeded and this decrease can be explained by a reduction in the energy absorbed by the surface of the cocoa bean as the roasting process advances [19].
The moisture loss curve follows a typical water desorption curve for foodstuffs. The moisture rate (MR) depends on the initial moisture content; if the moisture content if high, the MR is higher. The MR decreases when free water in the cocoa beans decreases and the moisture desorption curve become asymptotic when the water content is water-linked to another component of the foodstuff, such as proteins with water retention functional properties, which constitute a barrier for water desorption. The range of temperatures selected for the roasting treatments were chosen to obtain a more accurate estimate of the kinetic parameters. Therefore, in the case of a temperature of 100 °C (equivalent to the boiling temperature of water at 1 atm), a moisture of 4% was obtained at 80 min., well beyond the time that is required by the other treatments to reach final moisture values of approximately 2%. This final value of moisture during roasting facilitates the grinding and extraction of fat from the seed [29]. Temperatures below 120 degrees indicate greater resistance to seed moisture transfer [30,31,32]. In addition, Arslan and Musa [33] have noted that, when the roasting temperature increases, the water vapor pressure within the seed also rises, increasing the pressure gradient between the surface and the interior of the food, which results in a faster drying process and moisture transfer.
For kinetic expressions, three orders were evaluated (pseudo zero order, pseudo first order, and pseudo second order), and Table 2 reports the values of the rate constant (k). Figure 1 shows the prediction versus the experimental data.
The results indicate that the rate constant (k) linearly increased as a function of temperature. The pseudo-first-order kinetics had the highest coefficient of determination (R2 ≥ 0.98) when compared to the other two orders tested, so changes in the moisture of the cocoa beans versus time can be described by a pseudo-first-order equation, and similar results were found for the case of Cassia occidentalis seeds [34], hazelnuts [35], maize seeds [36], and almonds [37]. In that sense, Van Boekel [15] noted that a first-order equation could describe chemical reactions in foods. Ben Haj [19] explained that the velocity of the rate constant k can be related to temperature by an Arrhenius equation and, therefore, can be considered as pseudo diffusivity. Therefore, first-order kinetics can be related to temperature with an Arrhenius equation to calculate the activation energy of the roasted cocoa beans (Figure 2), and by applying the corresponding equation values of the obtained coefficient (R2 ≥ 0.94).
Table 3 presents the activation energy values for kinetics; these values are lower than those that were reported for roasting coffee beans [38] and almonds [37]. However, they are similar to the values of roasted Cassia occidentalis seeds [34] and hazelnuts [35]. The value of the activity coefficient obtained in the pseudo first order equation is similar to the value that was obtained through Equation (7) (see Section 3.3), which indicates the intrinsic relationship between an exponential mechanism of the mass transfer (moisture) as a function of temperature.

3.2. Exponential Models

The moisture content that was obtained at four different temperatures was converted to a dimensionless form. The coefficients for 10 tested models were estimated by means of non-linear regression. The goodness of the models was characterized by the highest value of the R2 and the lowest value of the SSE. Table 4 shows the estimated values of the model coefficients and the corresponding values of the coefficients of determination, as well as the standard error. The constant (k1) in the different models increases as a function of temperature (with the exception of the approximation diffusion model), which was similarly reported in the drying that was carried out by Murta [13] and Cupuasu [24], and in hazelnut roasting [9]. This indicates that the mass transfer process by effective diffusivity controls the roasting process of cocoa beans, just like in food drying. The other constants of the models (k2, a, and b) do not show a trend as a function of temperature, which indicates that they can be treated as empirical variables. The value of the coefficient was from 0.97 to 0.99 in the 10 tested models. Figure 1 shows the similarity between the calculated value of Page’s model and the experimental data of cocoa roasting.

3.3. Effective Roasting Diffusivity

Moisture diffusion is given by gradients produced through various mechanisms involved in moisture migration or reduction, and its value is calculated through mathematical models adjusting the experimental values [24,39,40]. Applying Equation 6, the effective diffusivity values (De) were obtained, and they gradually increased as the temperature increased (Table 5). This is attributed to the fact that an increase in the roasting temperature also leads to an increase in the heating energy, which increases the activity of the water molecules, which results in high diffusivity values [11]. These values are within the reported range for food and agricultural products [41].

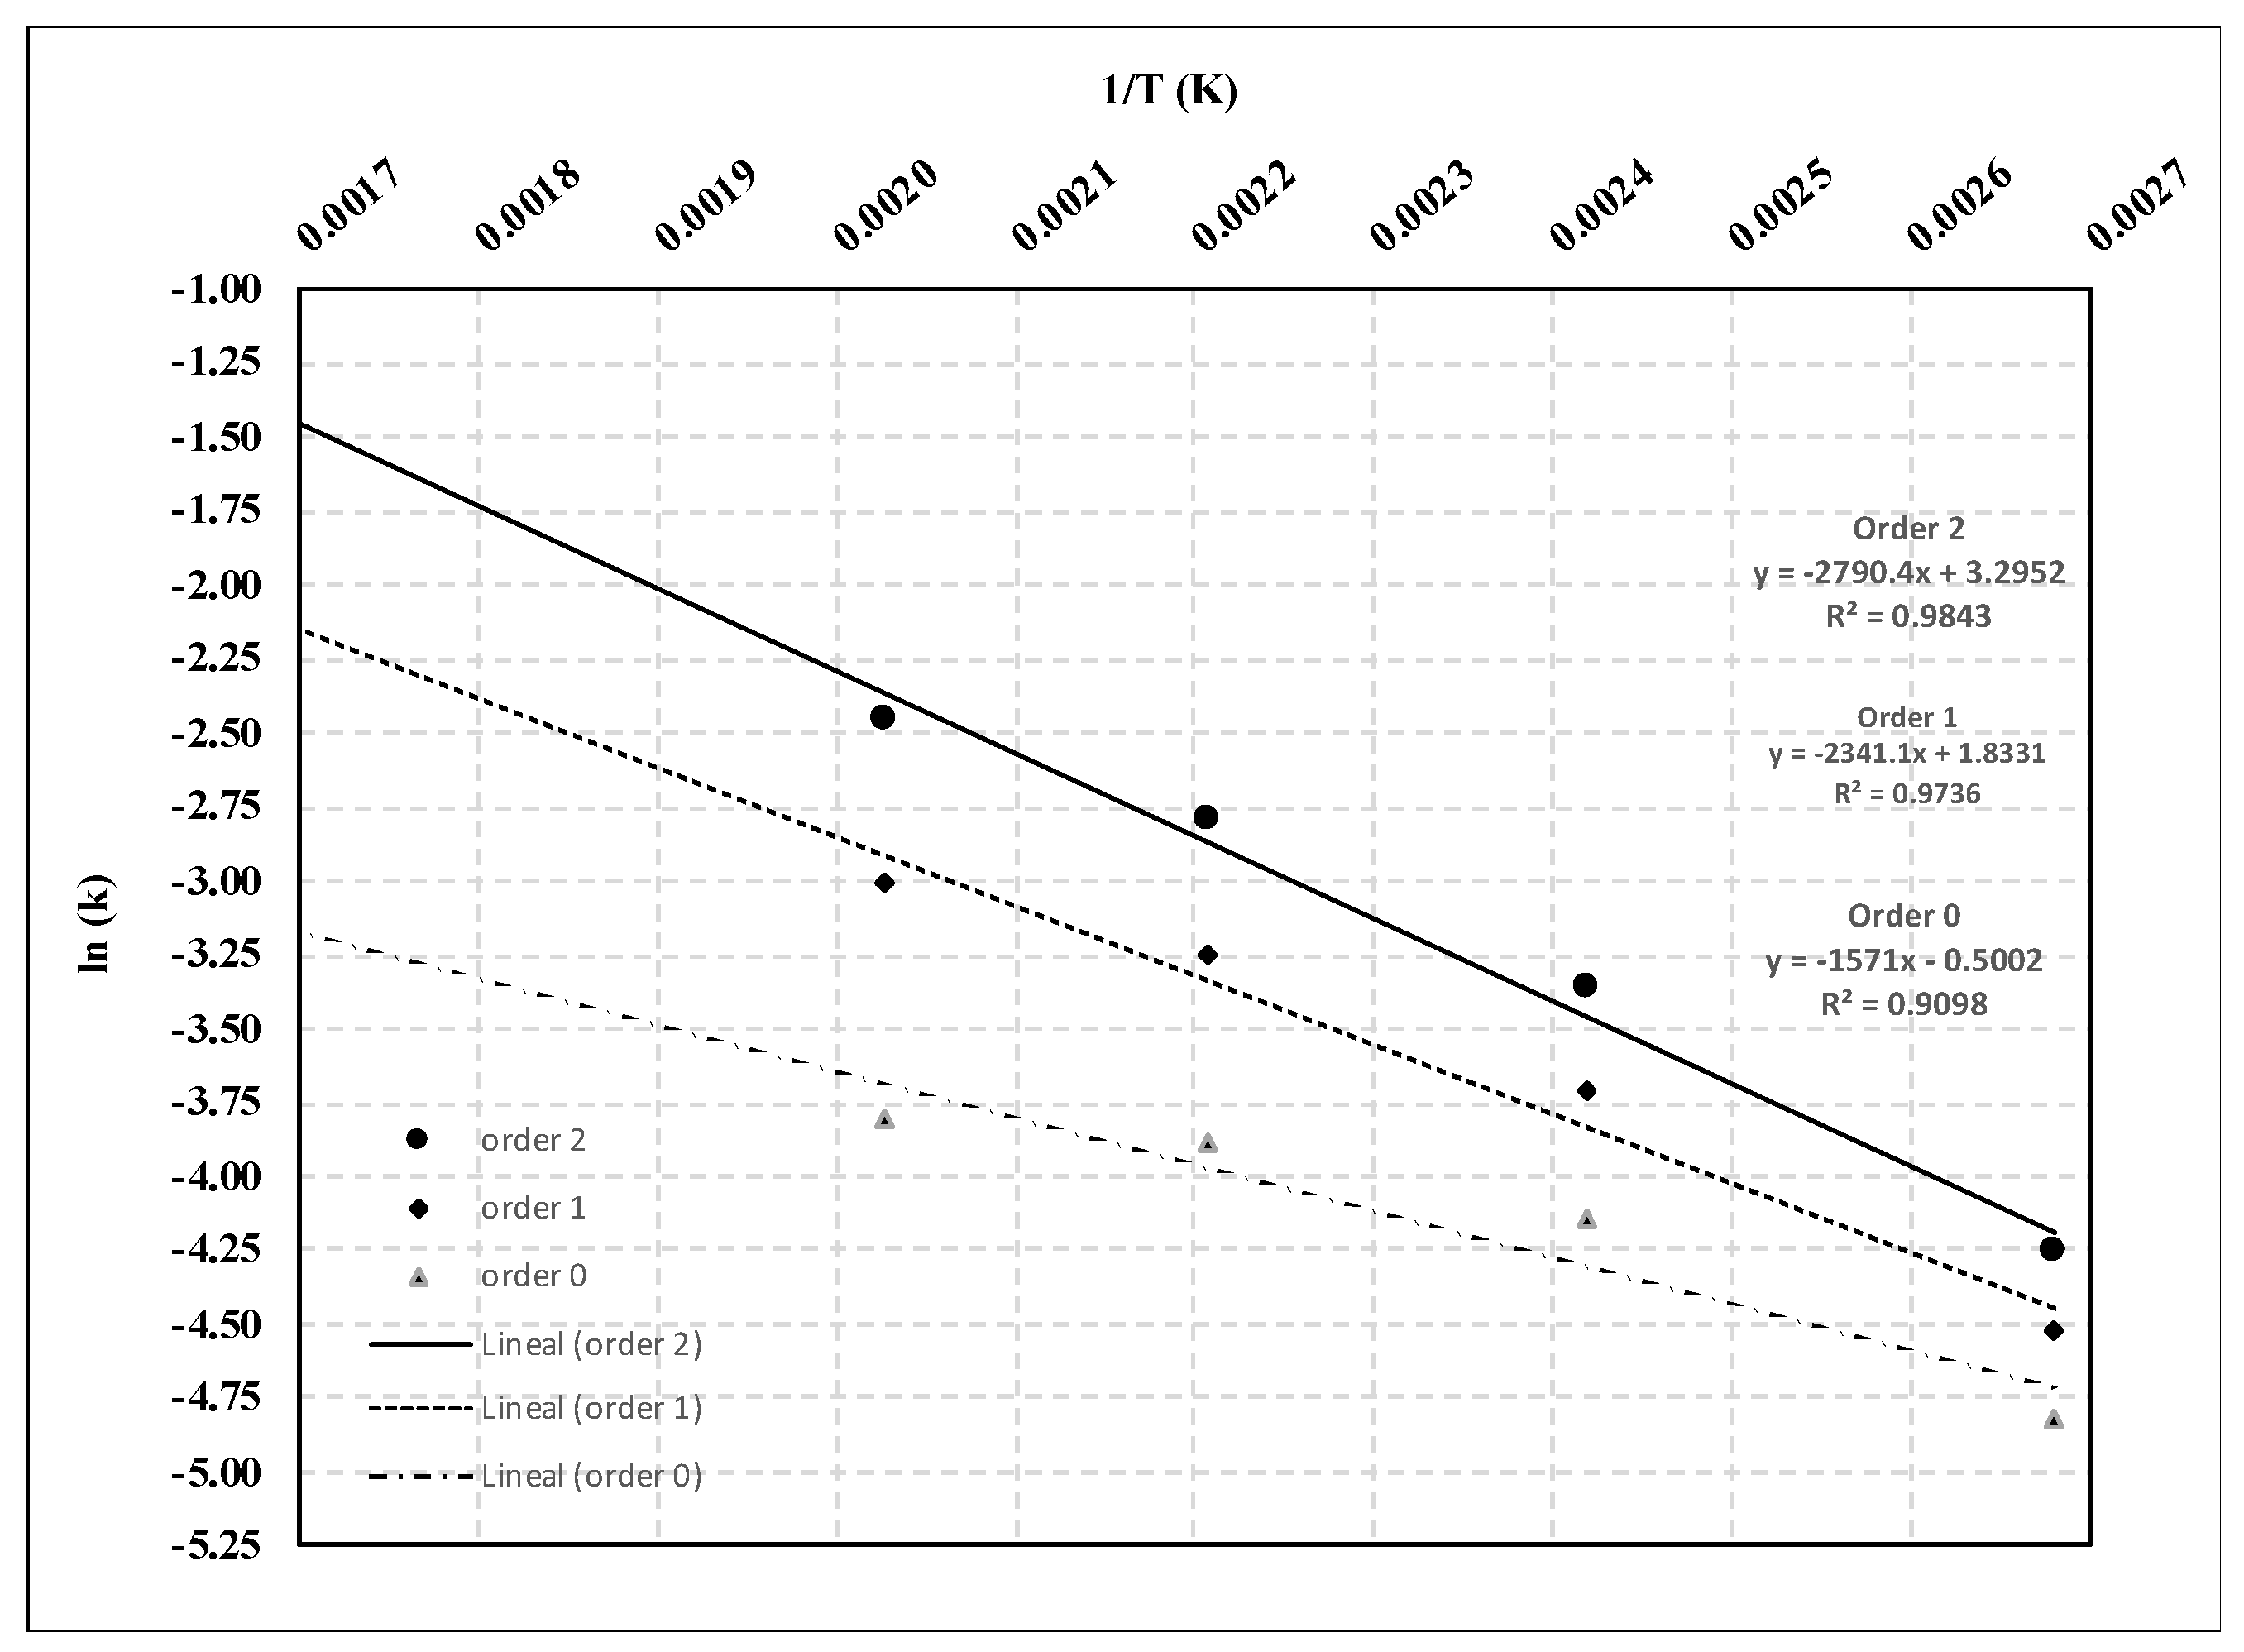
3.4. Activation Energy

The activation energy (Ea) was determined from the graph of ln De versus 1/(T + 273.15) while using Equation (7). The ln De as a function of the absolute temperature reciprocal was plotted (Figure 3); the slope of the line is (−Ea/R) and the intercept is equal to ln D0. The results show a straight line due to Arrhenius dependency. Equation (8) shows the effect of temperature on the average effective diffusivity coefficient of the roasted samples.
D e   =   0.78781 × 10 6 exp ( 19.5229 T + 273.5 )
The activation energy value was 19.5229 kJ mol−1, so these values are within the reported range of 12.7 kJ mol−1– 110 kJ mol−1 for food products [42]. The values of diffusivity and activation energy were compared with the results that were proposed in the literature by some authors for different cocoa beans and eggplants, and Table 6 presents these. The results were similar to those that were obtained for drying and roasting cocoa [29,43], as well as for roasting eggplants [44]; however, the results obtained were lower for the rest of the authors mentioned. These differences may be related to the finding that the lower the activation energy, the greater the water diffusivity in the product. However, the type of sample (origin and variety), the roasting method, and the geometry used with respect to other samples should have an influence. The activation energy value allows for the establishment of the minimum value required for the diffusion process to occur.

4. Conclusions

In this study, kinetic equations and 10 exponentials models were fitted to moisture experimental data for cocoa beans roasting temperatures of 100–220 °C. The Fick equation was applied to estimate the diffusion coefficients during the process. The results show that the pseudo-first-order equation had the best fit for the data related to moisture with deviations of experimental character, and considering the temperature dependence with the Arrhenius equation. The suitability of the 10 models was examined, showing that the Page model is the most appropriate model for the moisture behavior of cocoa beans during the roasting process. The results that were obtained for activation energy, as well as diffusivity values, are similar to the reported intervals for drying processes in foods. The present investigation is the experimental basis for the validation of the phenomenological models of mass transfer.

Author Contributions

Investigation, L.A.D.-P. and I.C.-B.; Methodology and Resources, P.G.-A., F.J.M.-R., and J.B.-F; Supervision, P.G.-A., and L.M.L.-G; Writing – original draft, L.A.D.-P. and I.C.-B.; Writing – review & editing, L.M.L.-G., F.J.M.-R., J.B.-F, and P.G.-A.; conceptualization, P.G.-A.

Funding

This research received no external funding.

Acknowledgments

To the National Counsel for Science and Technology in Mexico (CONACYT) for the grant provided during the Postgraduate Studies (CVU: 633979, grant number: 337055).

Conflicts of Interest

The authors declare no conflict of interest.

References

  1. Gutiérrez, T.J. State of the art chocolate manufacture: A review. Compr. Rev. Food Sci. Food Saf. 2017, 16, 1313–1344. [Google Scholar] [CrossRef]
  2. Krisiak, W. Effects of convective and microwave roasting on the physicochemical properties of cocoa beans and cocoa butter extracted from this material. Grasa y Aceites 2011, 62, 467–478. [Google Scholar] [CrossRef] [Green Version]
  3. Barrientos, L.D.P.; Oquendo, J.D.T.; Garzón, M.A.G.; Álvarez, O.L.M. Effect of the solar drying process on the sensory and chemical quality of cocoa (Theobroma cacao L.) cultivated in Antioquia, Colombia. Food Res. Int. 2019, 115, 259–267. [Google Scholar] [CrossRef] [PubMed]
  4. Jha, S.N. Mathematical simulation of roasting grain. J. Food Eng. 2005, 71, 304–310. [Google Scholar] [CrossRef]
  5. Zzaman, W.; Bhat, R.; Yang, T.A. Effect of Superheated Steam and Convection Roasting on Changes in Physical properties of Cocoa Bean (Theobroma cacao L.). Food Sci. Technol. Res. 2013, 19, 181–186. [Google Scholar] [CrossRef]
  6. Baghdadi, Y.M.; Hii, C.L. Mass transfer kinetics and effective diffusivities during cocoa roasting. J. Eng. Sci. Technol. 2017, 12, 127–137. [Google Scholar]
  7. Lares-Amaíz, M.D.; Gutiérrez, R.; Pérez, E.; Álvarez, C. Efecto del tostado sobre las propiedades fisicas, fisicoquimicas, composición proximal y perfil de ácidos grasos de la manetca de granos de cacao del estado Miranda, Venezuela. Rev. Cientifica UDO Agrícola 2012, 12, 439–446. [Google Scholar]
  8. Robbins, P.T.; Fryer, P.J. The spouted-bed roasting of barley: Development of a predictive model for moisture and temperature. J. Food Eng. 2003, 59, 199–208. [Google Scholar] [CrossRef]
  9. Özdemir, M.; Devres, O. Analysis of color development during roasting of hazelnuts using response surface methodology. J. Food Eng. 2000, 45, 17–24. [Google Scholar] [CrossRef]
  10. Feyissa, A.H.; Gernaey, K.V.; Adler-Nissen, J. Uncertainty and sensitivity analysis: Mathematical model of coupled heat and mass transfer for a contact baking process. J. Food Eng. 2012, 109, 281–290. [Google Scholar] [CrossRef]
  11. Kara, C.; Doymaz, I. Effective moisture diffusivity determination and mathematical modelling of drying curves of apple pomace. Heat Mass Transf. 2015, 51, 983–989. [Google Scholar] [CrossRef]
  12. Demirhan, E.; Özbek, B. Drying kinetics and effective moisture of purslane undergoing microwave heat treatment. Korean J. Chem. Eng. 2010, 27, 1377–1383. [Google Scholar] [CrossRef]
  13. Ah Hen, K.; Zambra, C.E.; Agüero, J.E.; Vega-Gálvez, A.; Lemus-Mondaca, R. Moisture diffusivity coefficient and convective drying modelling of murta (Ugni molinae Turcz): Influence of temperature and vacuum on drying kinetics. Food Bioprocess. Technol. 2013, 6, 919–930. [Google Scholar] [CrossRef]
  14. Vega-Gálvez, A.; Lemus-Mondaca, R.; Bilbao-Saínz, C.; Yagnam, F. Mass transfer kinetics during convective drying of red pepper var. Hungarian (Capsicum anuum L.): Mathematical modeling and evaluation of kinetic parameters. J. Food Process. Eng. 2008, 31, 120–137. [Google Scholar] [CrossRef]
  15. Van Boekel, M. Kinetic modeling of food quality: A critical review. Compr. Rev. Food Sci. Food Saf. 2008, 7, 144–157. [Google Scholar] [CrossRef]
  16. Yamsaengsung, R.; Rungsee, C.; Prasertsit, K. Simulation of the heat and mass transfer processes during the vacuum frying of potato chips. Songklanakarin J. Sci. Technol. 2008, 30, 109–115. [Google Scholar]
  17. Zhang, Q.; Litchfield, J.B. An optimization of intermittent corn drying in a laboratory scale thin layer dryier. Dry Technol. 1991, 9, 383–395. [Google Scholar] [CrossRef]
  18. Midilli, A.; Kucuk, H.; Yapar, Z. A new model for single-layer drying. Dry Technol. 2002, 20, 1503–1513. [Google Scholar] [CrossRef]
  19. Ben Haj Said, L.; Najjaa, H.; Farhat, A. Thin layer convective air drying of wild edible plant (Allium roseum) leaves: Experimental kinetics, modeling and quality. J. Food Sci. Technol. 2015, 52, 3739–3749. [Google Scholar] [CrossRef]
  20. Pavón-Melendez, G.; Hernández, J.A.; Salgado, M.A.; García-Alvarado, M.A. Dimensionless analysis of the simultaneous heat and mass transfer in food drying. J. Food Eng. 2002, 51, 347–353. [Google Scholar] [CrossRef]
  21. Simal, S.; Femenia, A.; Garau, M.C.; Roselló, C. Use of exponential, Pages’s and diffusional models to simulate the drying kinetics of kiwi fruit. J. Food Eng. 2005, 66, 323–328. [Google Scholar] [CrossRef]
  22. Corzo, O.; Bracho, N.; Pereira, A.; Vásquez, A. Weibull distribution for modelling air drying of coroba slices. LWT Food Sci Technol. 2008, 41, 2023–2028. [Google Scholar] [CrossRef]
  23. Doymaz, I. Air Drying Characteristics of Tomatoes. J. Food Eng. 2007, 78, 1291–1297. [Google Scholar] [CrossRef]
  24. Giraldo-Zuniga, A.D.; Arévalo-Pinedo, A.; Ferreira-Silva, A.; Ferreira Silva, P.; Valdes-Serra, J.; de Menezes-Pavlak, M.C. Datos experimentales de la cinética del secado y del modelo matemático para pulpa de cupuaçu (Theobroma grandiflorum) en rodajas. Ciência e Tecnologia de Alimentos 2010, 30, 179–182. [Google Scholar] [CrossRef]
  25. Adiletta, G.; Russo, P.; Senadera, W.; Di Matteo, M. Drying characteristics and quality of grape under physical pretreatment. J. Food Eng. 2016, 172, 9–18. [Google Scholar] [CrossRef]
  26. Onwude, D.I.; Hashim, N.; Janius, R.B.; Nawi, N.M.; Abdan, K. Modeling the Thin-Layer Drying of Fruits and Vegetables: A Review. Compr. Rev. Food Sci. Food Saf. 2016, 15, 599–618. [Google Scholar] [CrossRef]
  27. Association of Official Analytical Chemists. Official Methods of Analysis, 13th ed.; AOAC: Washington, DC, USA, 1980. [Google Scholar]
  28. Crank, J. The Mathematics of Diffusion, 2nd ed.; Oxford University Press: Oxford, UK, 1975. [Google Scholar]
  29. Sacchetti, G.; Ioannone, F.; De Gregorio, M.; Di Mattia, C.; Serafini, M.; Mastrocola, D. Non enzimatic browning during cocoa roasting as affected by processing time and temperature. J. Food Eng. 2016, 169, 44–52. [Google Scholar] [CrossRef]
  30. Rodriguez, J.; Mulet, A.; Bon, J. Influence of high-intensity ultrasound on drying kinetics in fixed beds of high porosity. J. Food Eng. 2014, 127, 93–102. [Google Scholar] [CrossRef]
  31. Liu, X.; Hou, H.; Chen, J. Applicability of moisture transfer parameters estimated by correlation between Biot number and lag factor (Bi-G correlation) for convective drying of eggplant slices. Heat Mass Transfer 2013, 49, 1595–1601. [Google Scholar] [CrossRef]
  32. Chayjan, R.A.; Salari, K.; Abedi, Q.; Sabziparvar, A.A. Modeling moisture diffusivity, activation energy and specific energy consumption of squash seeds in a semi fluidized and fluidized bed drying. J. Food Sci. Technol. 2013, 50, 667–677. [Google Scholar] [CrossRef]
  33. Arslan, D.; Musa Özcan, M. Study the effect of sun, oven and microwave drying on quality of onion slices. LWT Food Sci. Technol. 2010, 43, 1121–1127. [Google Scholar] [CrossRef]
  34. Nama, M.G.; Mbofung, M.F. Kinetics studies of some physic-chemical substances during roasting and preparation of beverage made by Cassia occidentalis seeds. LWT Food Sci. Technol. 2007, 40, 730–736. [Google Scholar] [CrossRef]
  35. Demir, A.D.; Cronin, K. The thermal kinetics of texture change and the analysis of texture variability for raw and roasted hazelnuts. Int. J. Food Sci. Technol. 2004, 39, 371–383. [Google Scholar] [CrossRef]
  36. Chung, H.-S.; Chung, S.-K.; Youn, J. Effects of roasting temperature and time bulk density, soluble solids, browning index and phenolic compounds of corn kernels. J. Food Process. Preserv. 2011, 35, 832–839. [Google Scholar] [CrossRef]
  37. Yang, J.; Bingol, G.; Pan, Z.; Brandl, M.T.; McHugh, T.H.; Wang, H. Infrared heating for dry-roasting and pasteurization of almonds. J. Food Eng. 2010, 101, 273–280. [Google Scholar] [CrossRef]
  38. Hernández, J.A.; Heyd, B.; Irles, C.; Valdovinos, B.; Trystram, G. Analysis of the heat and mass transfer during coffe batch roasting. J. Food Eng. 2007, 78, 1141–1148. [Google Scholar] [CrossRef]
  39. Udomkun, P.; Argyropoulos, D.; Nagle, M.; Mahayothee, B.; Janjai, S.; Müller, J. Single layer drying kinetics of papaya amidst vertical and horizontal airflow. LWT Food Sci. Technol. 2015, 64, 67–73. [Google Scholar] [CrossRef]
  40. Azzouz, S.; Guizani, A.; Jomaa, W.; Belghith, A. Moisture diffusivity and drying kinetic equation of convective drying of grapes. J. Food Eng. 2002, 55, 323–330. [Google Scholar] [CrossRef]
  41. Tunde-Akitunde, T.Y.; Ogunlankin, G.O. Influence of drying conditions on the effective moisture diffusivity and energy requeriments during the drying of pretreated and untreated pumpkin. Energy Convers. Manag. 2011, 52, 1107–1113. [Google Scholar] [CrossRef]
  42. Aghbashlo, M.; Kianmehr, M.H.; Samimi-Akhijhani, H. Influence of drying conditions on the effective moisture diffusivity, energy of activation and energy consumption during the thin-layer drying of berberis fruit (Berberidaceae). Energy Convers. Manag. 2008, 49, 2856–2871. [Google Scholar] [CrossRef]
  43. Páramo, D.; García-Alamilla, P.; Salgado-Cervantes, M.A.; Robles-Olvera, V.J.; Rodríguez-Jimenez, G.C. Mass transfer of water and volatile fatty acids in cocoa beans during drying. J. Food Eng. 2010, 99, 276–283. [Google Scholar] [CrossRef]
  44. Llave, Y.; Takemori, K.; Fukuoka, M.; Takemori, T.; Tomita, H.; Sakai, N. Mathematical modeling of shrinkage deformation in eggplant undergoing simultaneous heat and mass transfer during convection-oven roasting. J. Food Eng. 2016, 178, 124–136. [Google Scholar] [CrossRef]
  45. Hii, C.L.; Law, C.L.; Cloke, M. Modeling using a new thin layer drying model and product quality of cocoa. J. Food Eng. 2009, 90, 191–198. [Google Scholar] [CrossRef]
Figure 1. Moisture curves during roasting. Experimental data of moisture content (symbols) and simulation (red continuous lines) kinetics applying the pseudo-first order equation and (black continuous lines) Page model.
Processes 07 00770 g001
Figure 2. Effect of temperature on the kinetic constants during the roasting process to n order.
Processes 07 00770 g002
Figure 3. Effect of temperature on the pre-exponential factor in moisture diffusivity during the roasting process.
Processes 07 00770 g003
Table 1. Mathematical model applied to the experimental data of moisture during the cocoa bean roasting process.
Id.ModelEquationReference
1Newton x = exp ( kt ) [19]
2Page x = exp ( kt a ) [19]
3Henderson and Pabis x = aexp ( kt ) [19]
4Logarithmic x = aexp ( kt ) + b [19]
5Two term model x = aexp ( k 1 t ) + bexp ( k 2 t ) [19]
6Midilli and other model x = aexp ( kt ) + bt [11]
7Verma x = aexp ( kt ) + ( 1 a ) exp ( bt ) [26]
8Aproximation of diffusion x = aexp ( kt ) + ( 1 a ) exp ( kbt ) [26]
9Silva and other model x = exp ( at b t ) [26]
10Peleg x = 1 t ( a + bt ) [26]
Table 2. Kinetic constants for model of n order and adjusted coefficients.
OrderKinetics ModelsT (°C)kR2SSE
0 X w   =   X i + k t 100−0.00800.980.0166
140−0.01580.980.0214
180−0.02040.930.1371
220−0.02230.870.3358
1 X w   =   X i e k t 1000.01080.980.0128
1400.02420.980.0221
1800.03830.980.0587
2200.04920.980.0292
2 X w   =   [ 1 1 X i + k t ] 1000.01410.960.0364
1400.03470.945.0854
1800.06130.935.2128
2200.08590.945.1705
Table 3. Activation energy and pre-exponential factor for different temperatures.
ParametersOrder 0Order 1Order 2
k00.60646.253226.9828
Ea (kJ mol−1)13.065219.466923.2025
R20.90980.97360.9843
Table 4. Mathematical models applying to experimental data of moisture and their adjusted constants during the cocoa bean roasting process.
ModelT (°C)K1K2abR2SSE
Newton1000.0108------------0.980.0128
1400.0242------------0.980.0221
1800.0383------------0.980.0587
2200.0492------------0.980.0292
Page1000.0072----1.1048----0.980.0099
1400.0109----1.2338----0.990.0072
1800.0100----1.4203----0.990.0048
2200.0222----1.2615----0.990.0074
Henderson and Pabis1000.0110----1.0080----0.980.0125
1400.0255----1.0340----0.980.0186
1800.0428----1.0991----0.970.0348
2200.0524----1.0602----0.980.0215
Logarithmic1000.0048----1.8844−0.89570.980.0092
1400.0108----1.8043−0.80850.990.0060
1800.0303----1.2680−0.20200.980.0299
2200.0454----1.1103−0.06680.980.0173
Two terms1000.01100.01100.49380.51420.980.0125
1400.02550.02550.44940.58460.980.0186
1800.04280.04280.55250.54660.970.0186
2200.05240.05240.53370.52650.980.0186
Midilli et al.1000.0068----0.9882−0.00230.980.0093
1400.0153----0.9962−0.00440.990.0061
1800.0348----1.0682−0.00220.980.0213
2200.0484----1.0464−0.00090.980.0182
Verma et al.1000.0186----14.78100.01930.980.0093
1400.0443----8.92590.04800.990.0061
1800.0794----15.25880.08450.990.0034
2200.0882----11.21580.09440.990.0034
Aproximation difussion1000.0263----−0.54030.56870.980.0093
1400.0499----–3.96590.85910.990.0061
1800.0383----−0.43881.00030.980.0587
2200.0274----–24.67881.02390.980.0190
Silva et al.100--------0.0121−0.00860.980.0112
140--------0.0311−0.03640.980.0122
180--------0.0613−0.10800.990.0079
220--------0.0679−0.08150.990.0097
Peleg100--------103.31300.35850.980.0097
140--------50.12630.32200.990.0062
180--------30.70830.45650.980.0334
220--------20.44950.62530.980.0304
Table 5. Moisture diffusivity coefficient in the Fick model.
Temperature (°C)De (m2 s−1)R2
1001.26789 × 10−90.9852
1403.16974 × 10−90.9816
1805.07158 × 10−90.9883
2205.70553 × 10−90.9825
Table 6. Diffusivity data and activation energy for cocoa beans during different dehydration processes.
ReferencesProductT (°C)Characteristic
Dimension
Do Deff (m2 s−1)Ea
(kJ mol−1)
This paperCocoa beans100–220Infinite flat plate0.78 × 1061.26–5.70 × 10⁻⁹ 19.52
[29]Cocoa beans125–145Spherical geometry4.2 × 1064.4–9.3 × 10−959.6
[6]Cocoa beans120–160Infinite flat plate2.37 × 10−5 1.38–3.08 × 10⁻⁵ Nibs rewetted 2.49–4.42 × 10−528.6
[45]Cocoa beans60–80Spherical geometry4.08 × 1061.61–3.23 × 101028.11
[43]Cocoa beans60–80Infinite flat plate10.231.14–4.20 × 10−963.45
[44]Eggplant100–200Cylindrical geometry4.95 × 10111.79 × 108–5.15 × 10−918.27

