Article

Determination of KOSGEB Support Models for Small- and Medium-Scale Enterprises by Means of Data Envelopment Analysis and Multi-Criteria Decision Making Methods

1
Small and Medium Enterprises Development Organization of Turkey, Ankara 06000, Turkey
2
Department of Business Administration, Kırıkkale University, Kırıkkale 71450, Turkey
3
Department of Industrial Engineering, Kırıkkale University, Kırıkkale 71450, Turkey
*
Author to whom correspondence should be addressed.
Submission received: 13 December 2018 / Revised: 12 February 2019 / Accepted: 18 February 2019 / Published: 2 March 2019

Abstract

:
Small- and Medium-Scale Enterprises (SMEs) act as catalysts in the general economy with regard to their added value. Support programs have been designed by the government through the Small and Medium Enterprises Development and Support Administration KOSGEB) and other institutions in order to further the general economic contributions of such enterprises. However, there is no method for using support models according to a productivity and effectiveness principle. This causes serious wastes of both resources and time. In this study, the problem of applying support models to improve the most critical problems of SMEs was discussed. As a place of application, 82 firms registered to the Konya Chamber of Industry were selected for the automotive supplier industry. Firstly, a productivity evaluation of companies was performed by a data envelopment analysis (DEA). Firms were grouped into A, B1, B2, C1, and C2 according to their activity scores. Using an Analytical Hierarchy Process (AHP), the order of KOSGEB support was found using the Technique for Order Preference by Similarity to Ideal Solution method (TOPSIS). Thus, firms will be able to focus on their most pressing problems, as well as enabling the efficient use of resources A: Small- and Medium-Scale Enterprises Improvement and Support Program (KOBIGEL) support model, B1: Logistic support model, B2: KOBIGEL support model, C1: Test analysis and calibration support model, and C2: Test analysis and calibration support model. This means that these support models are required in the first place for group companies.A KOBIGEL support model is the provincial rank for A group companies.

1. Introduction

Economy management of Small- and Medium-Scale Enterprises (SMEs) has become an important means of increasing per capita national income in order to increase the welfare of the people. SMEs were evaluated as an opportunity to grow and develop the economy. Based on the added value that SMEs contribute to the country’s economy, SMEs increased their share in the overall economy and gained a significant position in the economy. A total of 99.7% of all enterprises are composed of SMEs, and they provide 78% of employment, 55% of added value, 59% of exports, 50% of total investments, 65.5% of total sales, and 24% of total credits. The added value SMEs contributed to the country’s economy attracted attention and economy entities of governments observing the potential of SMEs’ developed strategies, plans, and programs to contribute to the development and growth of SMEs in order to provide dynamism in the economy of a country. The Small and Medium Enterprises Development and Support Administration (KOSGEB) was established to carry out these activities. Support models have been developed to promote SMEs to work efficiently and effectively [1].
The approach of the utilization of the right support models by the right enterprises with regards to the utilization of scientific methods considering productivity and effectiveness in the presentation of KOSGEB support SMEs have been adopted. The gradual utilization of support models depending on the priority issues of the enterprises will be more beneficial to enterprises and save time. In addition, the KOSGEB budget will be used more effectively and maximum benefits will be provided to the economy of the country with limited resources. This study is one of the first studies for KOSGEB support models. Although there are studies in the literature to support SMEs, there is no study to assess the models offered to SMEs in Turkey. At this point, the contribution of this study to the literature is significant. SMEs have information about the support models provided and information is provided to enable them to apply for their own companies. The main aims of KOSGEB are to increase the share and efficiency of small- and medium-sized enterprises in the economy in line with the national and international objectives of the country. At the same time, it continues to support the projects that SMEs will prepare for the purpose of increasing the competitive power and the added value they provide.
In the utilization of KOSGEB support models, data envelopment analysis (DEA), as a scientific approach to identify the most active companies in the sectors, has been used in order to identify the active and inactive companies in the casting sector related to the automotive supply industry and the automotive sector. One of the most preferred methods for performance evaluation nowadays is a productivity measurement method. Export is very important for ecosystem. The Turkey Exporters Assembly (TIM) realized a total of £163,532,569 to the data of exports by 2018. The agricultural sector is $22,645,609, the manufacturing sector is $136,325,297, while the industrial products are $106,558,021. Among the industrial products, the automotive industry ranked first with $31,568,469, the second with $15,554,861, and the electrical and service sector ranked third with $11,309,459 [2]. The automotive sector has been the most export-oriented sector in the industry.
With respect to the identification of companies that are effective and ineffective by the DEA method, multi-criteria decision-making methods have been used to find which support models are correct for these enterprises. The significance level of the criteria was determined by the analytical hierarchy process (AHP). Application of this study was carried out in the automotive supply industry and the casting sector. The fact that the automotive sector constitutes close to one fifth of the total exports between 2015-2017 shows that it is in an important place in the general economy. [2]. Effective and ineffective companies were identified according to the data obtained from the 82 companies selected from the automotive sector and casting sector; weighting of the criteria was conducted with AHP and subsequently priority KOSGEB support models were ranked with the Technique for Order Preference by Similarity to Ideal Solution (TOPSIS) method. A wide range of methods is used in the weighting of criteria in the literature. Fuzzy methods are used where there is a lot of uncertainty. The fuzzy AHP method is one of these methods. The reason for using the AHP method in this study is that it is flexible and easy to apply. At the same time, it is possible to check whether the comparisons are consistent. In the Fuzzy AHP method, this control cannot be performed. Despite the consistency of the AHP method utilized by Kwong and Bai [3], the consistency of the literature cannot be controlled.
In the second section, the literature on SMEs was examined by means of DEA, AHP, and TOPSIS. In the third section, SME definition, problems of SMEs in management, marketing, production, and finance issues are discussed. In the fourth section, information about the DEA is presented. In the fifth section, information on multi-criteria decision-making methods, AHP, and TOPSIS methods are presented in order to discuss priority support models for the problems of SMEs, and the operations to be performed at each step of these methods are explained. In the sixth section, data of 82 SME-sized companies in the casting sector, automotive supply industry, and automotive sector were analyzed using the DEA method through a Frontier Analyst (DEA) program, and effective and ineffective companies were determined.

Literature Overview

SMEs caused a significant increase in added value to the general economy and their share in employment, production, marketing, export, and investment activities increased. They played an important role in the growth of the national economy. The growth and progress of each SME-sized company directly reflected on the economy.
In a study, Chang [4] identified 23 regions in Taiwan with the effectiveness measurement DEA, identified the active and inactive regions, and determined the extent to which the ineffective regions should be improved. In the Demir and Sütçü [5] study, SMEs operating in the forest products industry in the Isparta region were analyzed for post-crisis production, technology, and financing. In the forest products sector in Isparta, 22% of the employees and 30.4% of the added value is stated as the second important sector of the region. Özgener [6] analyzed the management and organizational problems in the growth process of SMEs operating in the flour industry of Nevşehir. Donthu et al. [7] conducted market productivity research using DEA and found their strengths and weaknesses in this issue. Düzakın and Demirtaş [8] identified products with high performance and sold in computer magazines and on internet sites that sell computer hardware using DEA and tried to create an alternative choice for consumers and producers. In a study, Kayalıdere and Kargın [9] evaluated the activities of textile and cement sector enterprises which are traded in Exchange Istanbul through DEA and gave information about how the ineffective companies should improve their input-output quantities in order to reach the position of effective companies.
Karpat and Kılıçkaplan [10] conducted research on the effectiveness of life insurance with DEA. Torlak and Uçkun [11] stated that the main financing problem of SMEs is a cash problem. According to the results of a study by Özkanlı and Namazalieva [12], problems experienced in SMEs are a lack of effective management, not having professional managers in the majority of enterprises, planning without experts, simple and not formal organization, poor recruitment systems, ignoring the training of existing personnel, and management by owner(s). Özdemir et al. [13] put forward that with recognition of the importance of SMEs for the general economy, they should be located at the center of economic policies, incentive policies for such size enterprises should be developed, and the thesis claimed that the economy of the country depends on the great success of SMEs. Bozdağ [14] analyzed the production productivity and total factor productivity of the sugar industry of EU candidate countries and Turkey through DEA and calculated changes in the total factor productivity by using a Malmquist Index. Özbek [15] specified that SMEs play an important function in terms of the development and protection of the national economies, and in developing countries such as Turkey SMEs are even more important from a social point of view due to the reduction of unemployment, the creation of new jobs, ensuring a balanced economic and social development, in addition to their positive contribution toward maintaining this structure and flexible production structure that can adapt quickly to changes in market conditions, their local nature, and empowerment of the middle class.
Rani et al. [16], using DEA, focused on the problems faced by the production systems in SMEs. They evaluated the improvement and development models with the simulation they developed. Ha et al. [17] examined the efficiency of SMEs by means of full enveloping. They analyzed the impact of support activities on business processes. Amornkitvikai et al. [18] focused on the technical efficiency of SMEs. At the same time, they made strategic recommendations to increase the competitiveness of SMEs. Ulusoy and Akarsu [19] examined the state support for SMEs in Turkey. They analyzed the impact of these support models on employment. Sarıkahya [20] analyzed the problems experienced by SMEs operating in the furniture sector in Turkey. They made recommendations to solve these problems. They have been informed about how they can benefit from state aids and training. Yıldız [21] conducted research on public subsidies on SMEs. Again, the impact of these supports on SMEs is analyzed. Yerlikaya and Arıkan [22] measured the effects of the support provided to SMEs on SME performance. They used The Preference Ranking Organization Method for Enrichment Evaluation (PROMETHEE) and Organisation, rangement et synthèse de données relationnelles (ORESTE) methods. They suggested a new sequence of activities for the support models on the basis of the results.
Uluyol [23] found inadequacies in SMEs regarding financial managers, financial management and applications. Sevinç and Eren [24] conducted research on productivity problems in 40 SMEs operating in the Kırıkkale organized industrial zone. It has been determined that R&D works will contribute to productivity. Stawowy and Duda [25] conducted their study regarding the usage of data envelope analysis on the usefulness of casting workshops. Skare and Rabar [26] investigated the factors affecting economic growth using the DEA method. Tran et al. [27] measured the performance of a transit road in 42 highways using DEA and Brisbane. Chittithaworn et al. [28] found the success factors of SMEs in Thailand. Mardani et al. [29] evaluated the SME-scale hotels in Iran with three main factors and 16 sub-factors using AHP and TOPSIS. In their work, Johnes and Johnes [30] assessed the performance of the economic units in the UK using DEA. In the study of Banker [31], the efficiency of hospitals and power plants was assessed according to DEA scale efficiency and scale return models. Chen et al. [32] evaluated the efficiency of the information technologies (IT) sector using DEA. Sengupta [33] used fuzzy set theory with DEA to measure effectiveness. Ji and Lee [34] found that WADA is a managerial tool for measuring organizations’ performance and is widely used to assess the efficiency of public and private sectors such as banks, airlines, hospitals, universities, defense industries, and manufacturers.
SMEs play an important role in the protection of national economies. In particular, they contribute to the reduction of unemployment, the creation of new employment areas, and economic and social development [15]. Compared to large enterprises, these enterprises are important because they are less influenced by the crisis, they fulfill projects that large enterprises are not interested in, and they perform activities not fulfilled by such big enterprises. They are also regarded as accelerators of quality and cheap production owing to their flexible structures and advanced technology [13].

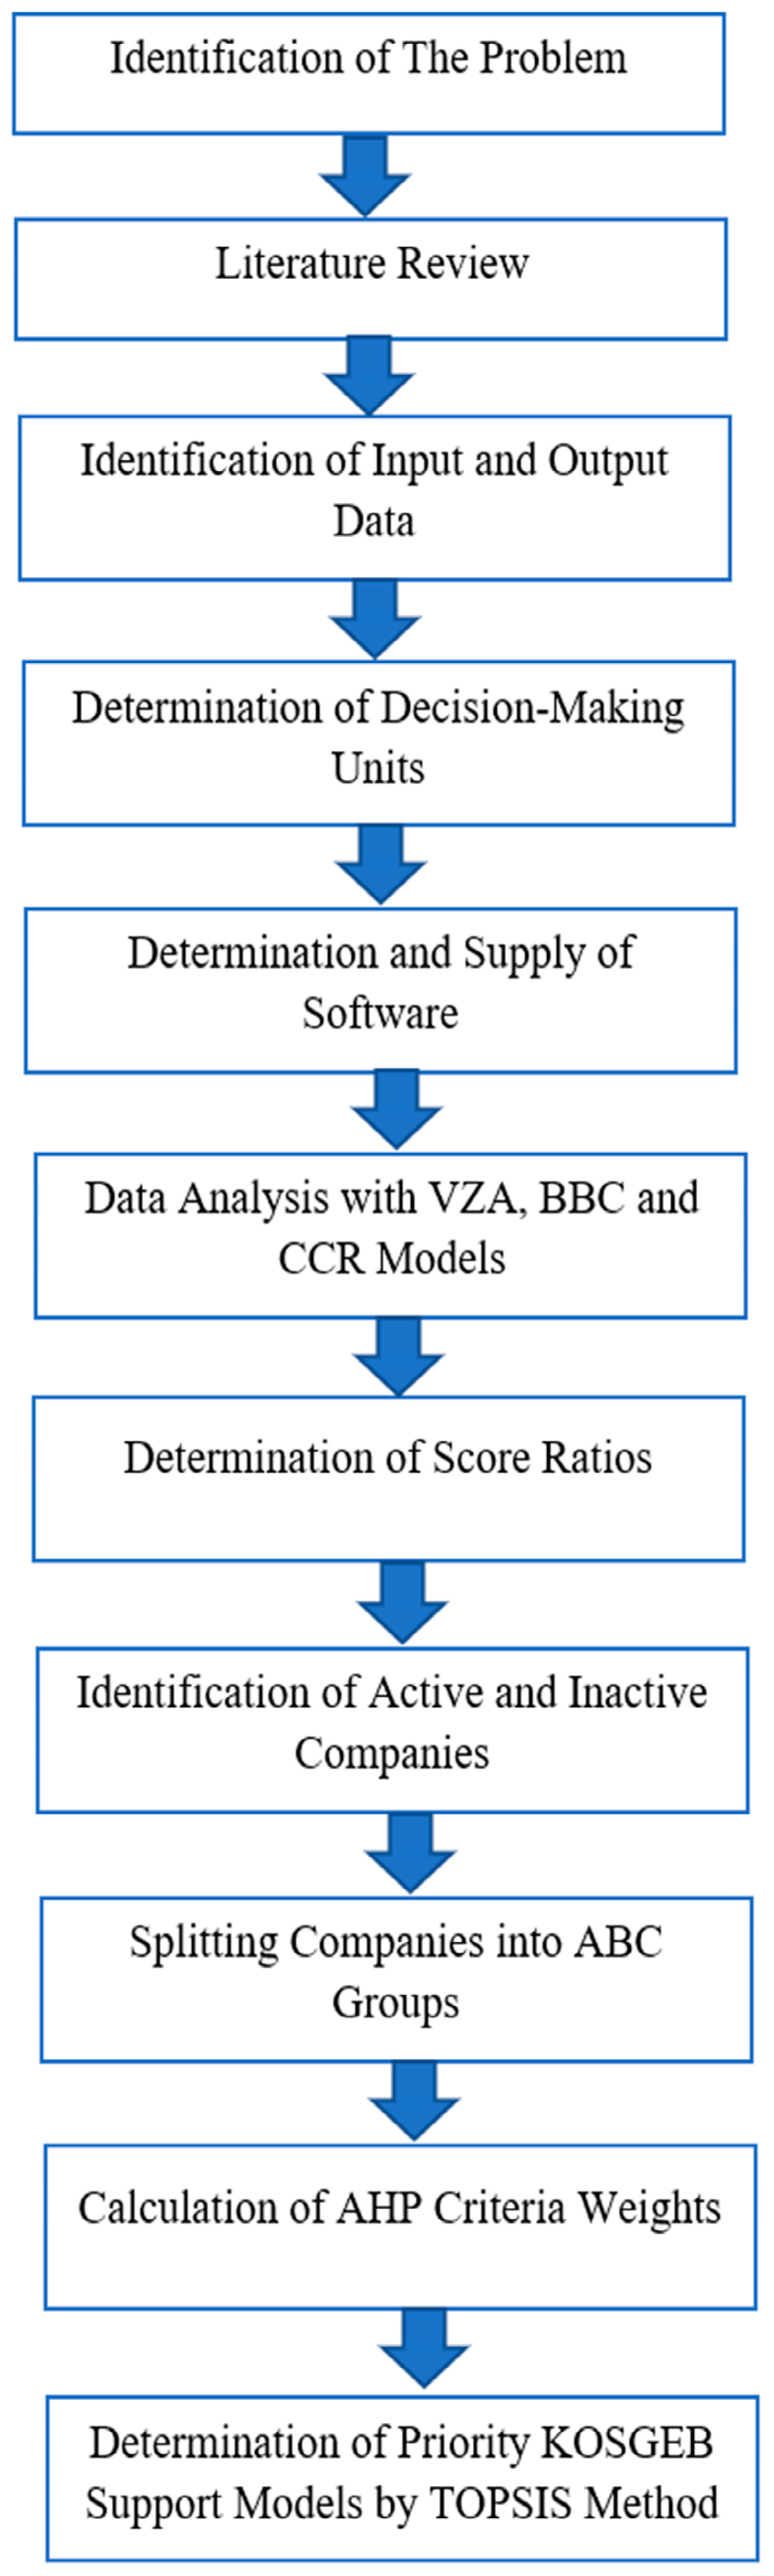
2. Materials and Method

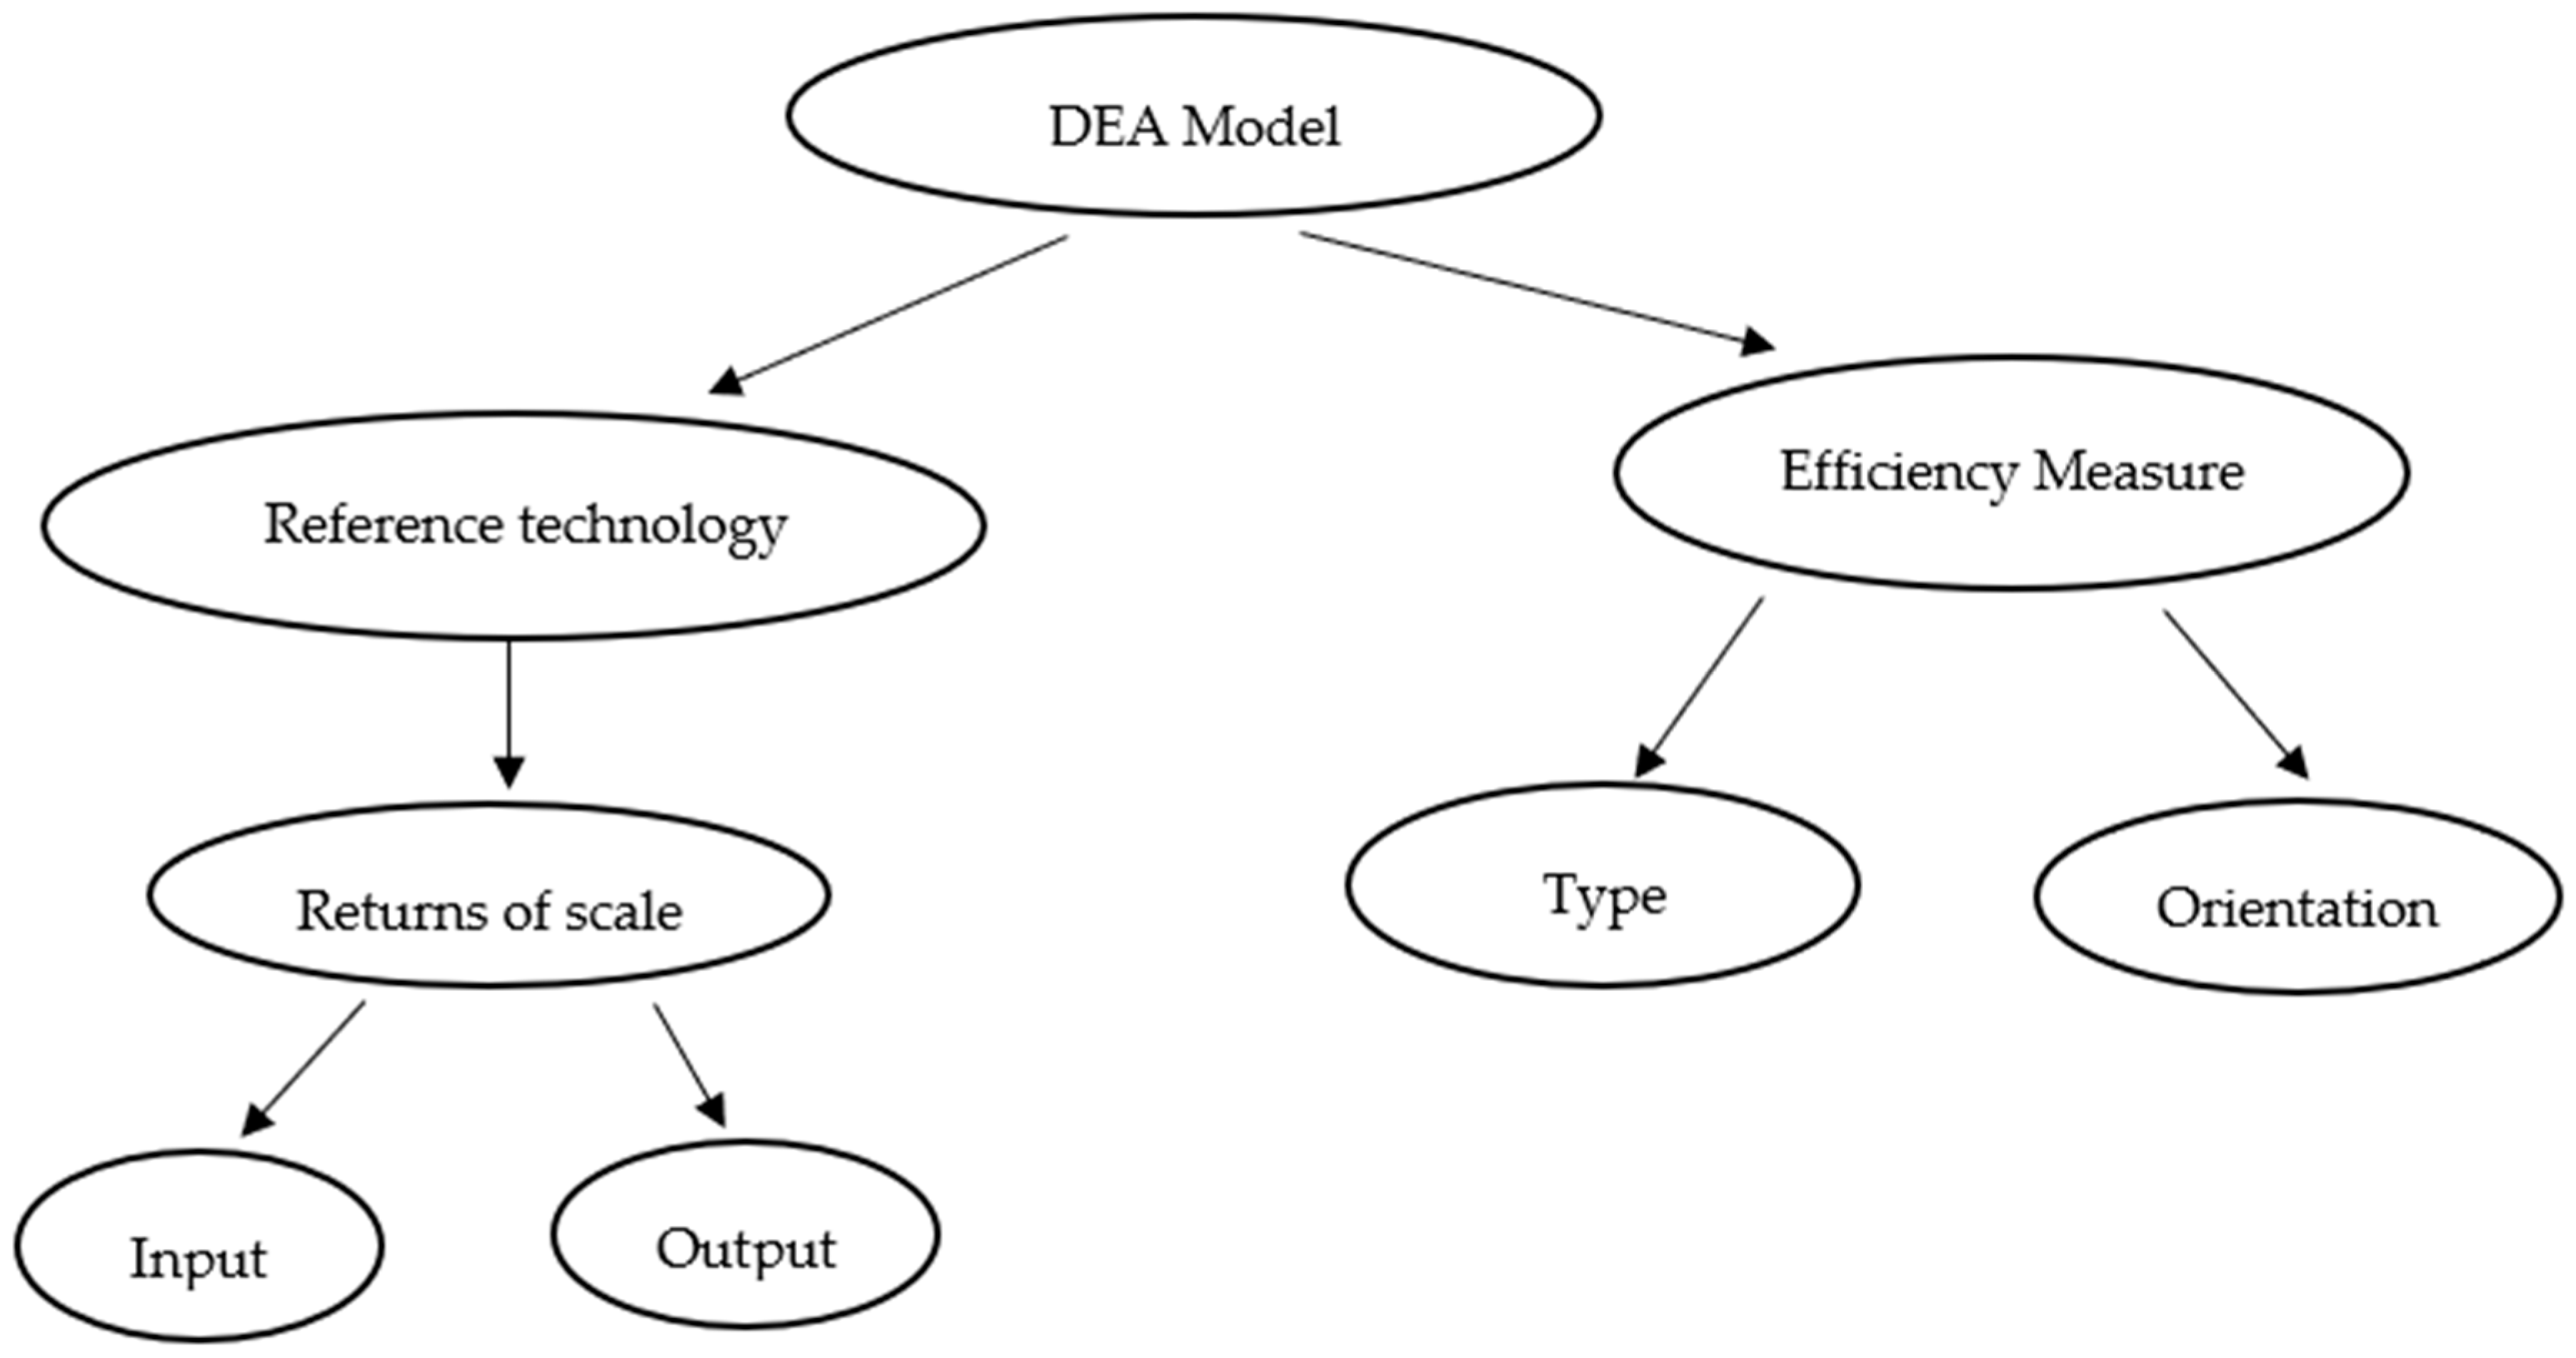
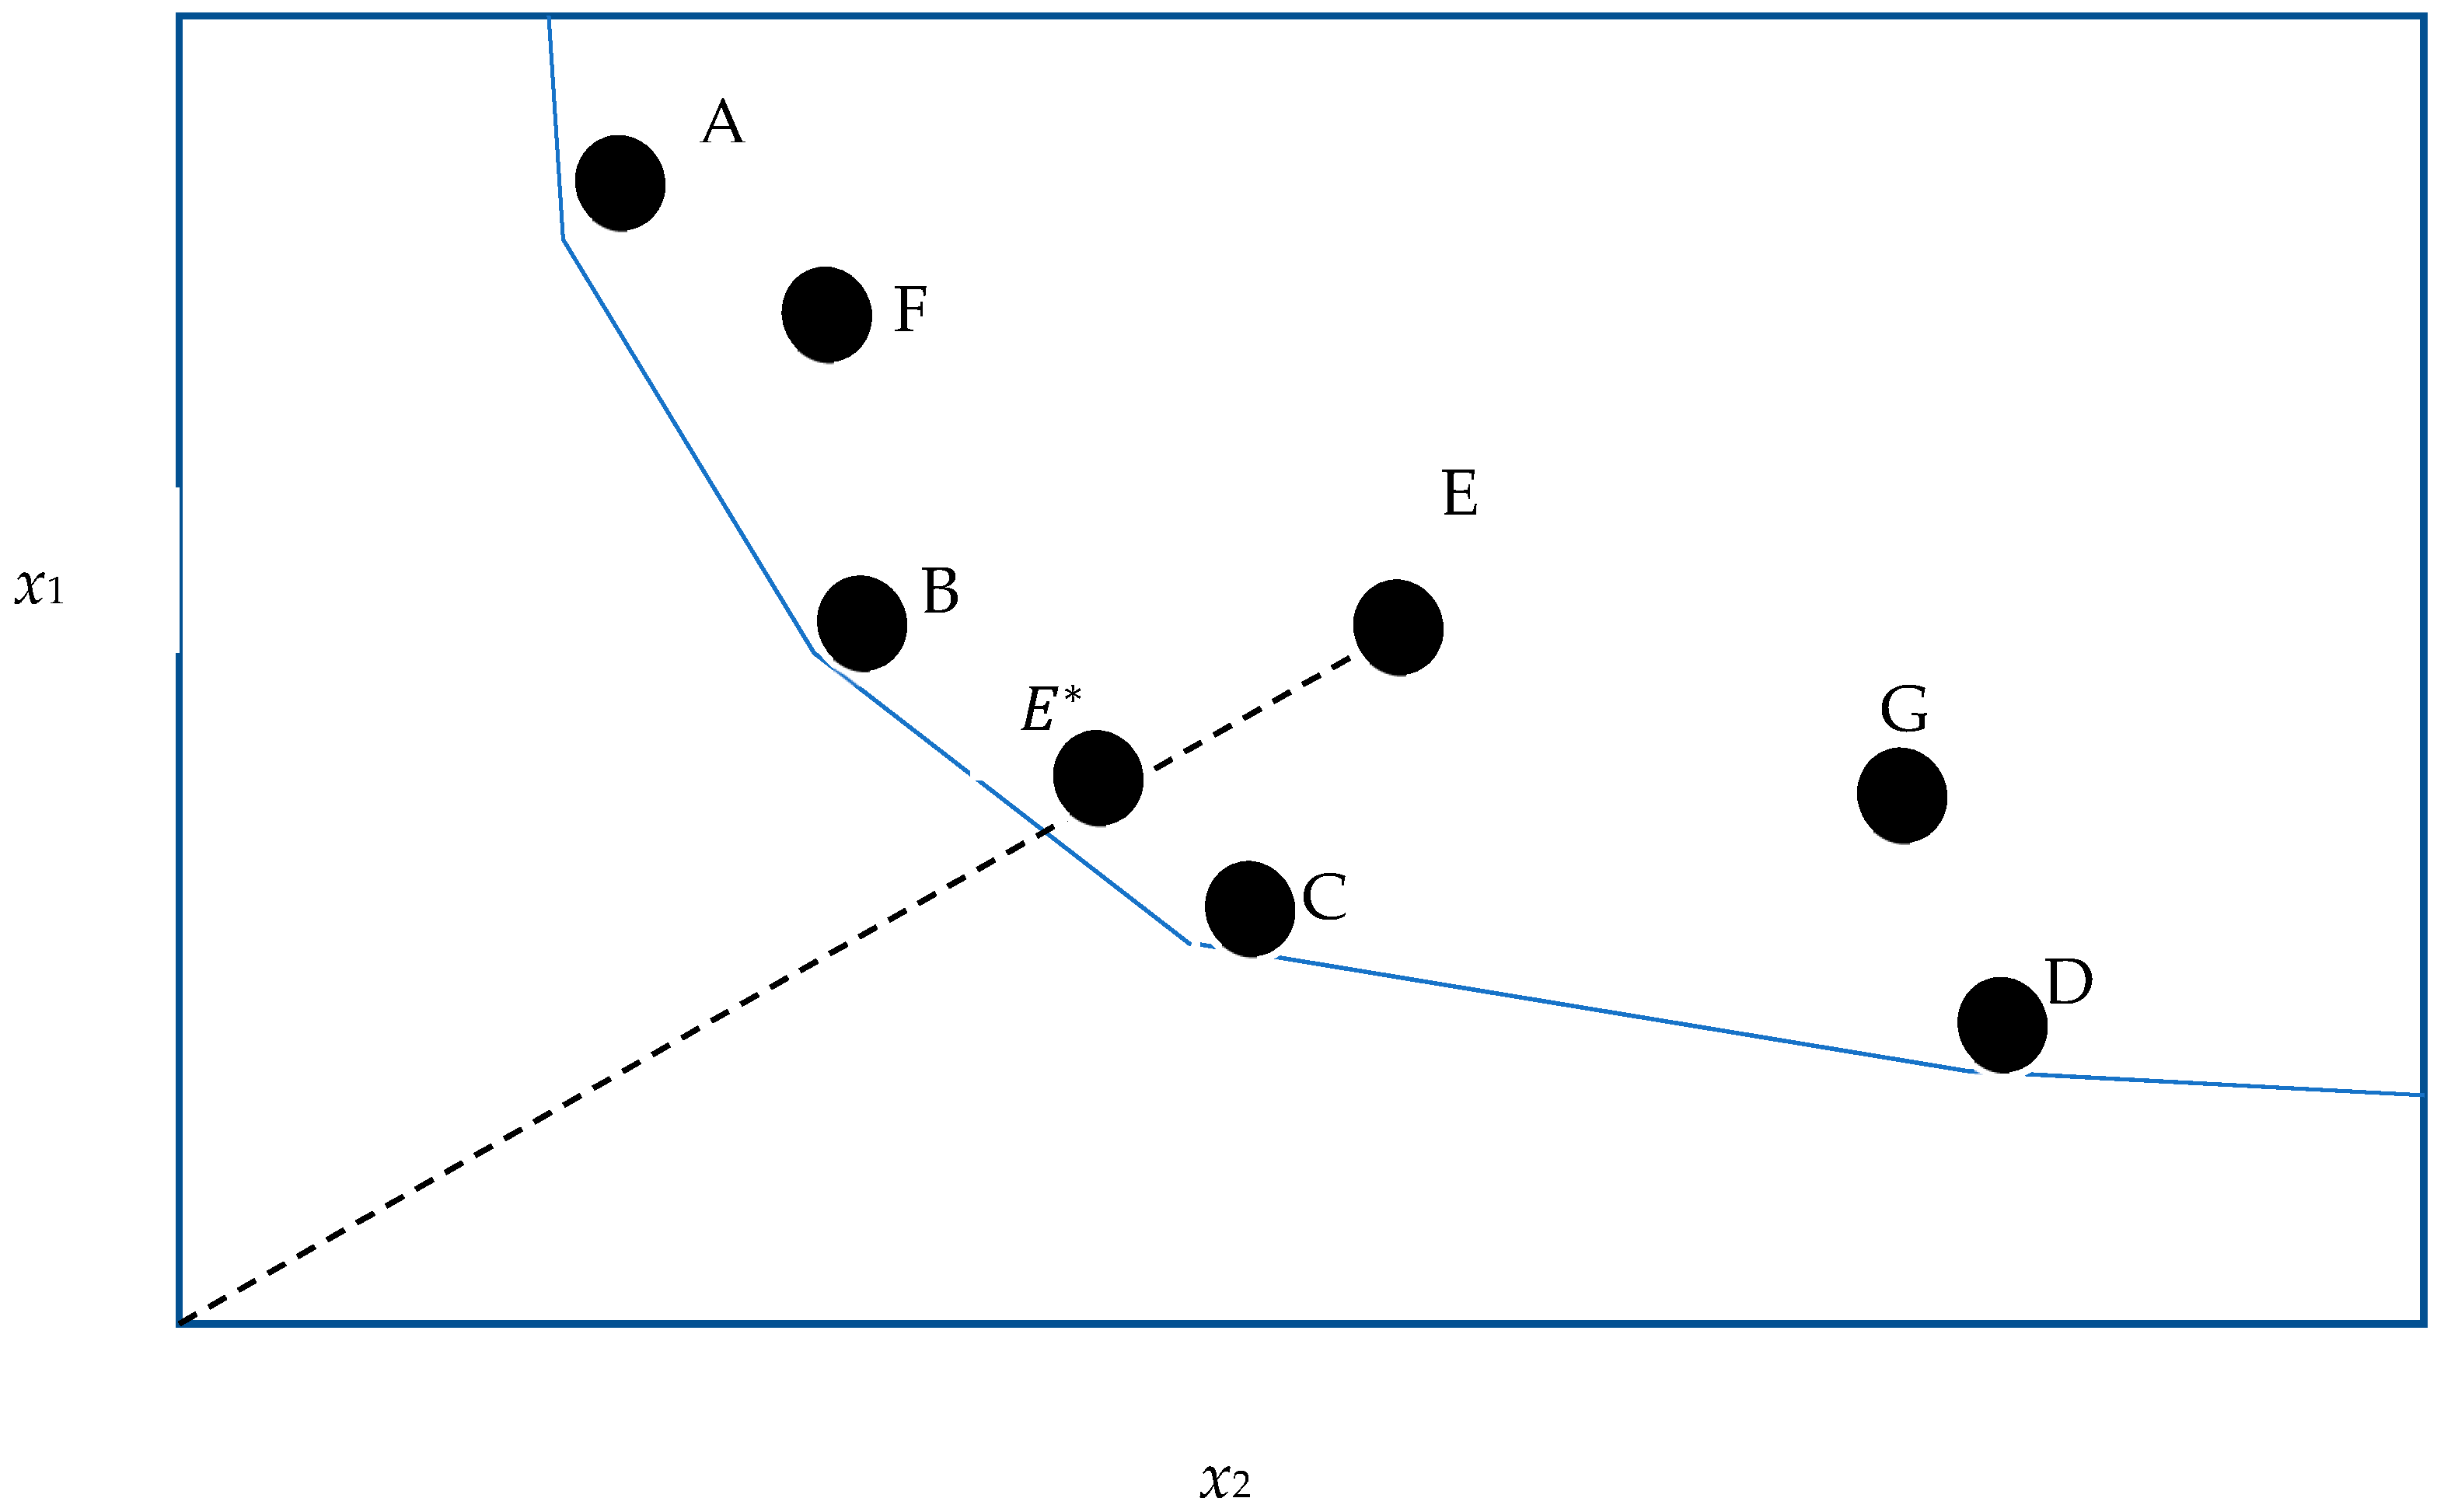
2.1. Data Envelopment Analysis

Data envelopment analysis (DEA) Charnes, Cooper, and Rhodes (CCR) [35] was developed in 1978. Later, in 1984, another model was developed by Banker, Charnes, and Cooper (BCC) [27]. It was constructed on Farell’s boundary activity. DEA is an empirical modeling based on non-parametric linear programming and optimization. The production units are widely used to measure their efficiency using a large number of inputs and outputs. In the literature, it is seen that it is applied in banking, transportation, power plants, education, and the health sector [27]. CCR and BBC models are input- and output-oriented models. The purpose of input-oriented models is to reduce the inputs of inactive units and aim to reach the efficiency limit [25]. The CCR model is based on the assumption of fixed return activities and makes an objective assessment of the overall efficiency. The BCC model represents one of the various theoretical extensions developed based on the original CCR model. Under the assumption of a variable return scale, it allows us to estimate pure technical effectiveness at a given study scale. It determines whether there is increasing, decreasing, or fixed possibilities for more returns [26].
DEA operates according to the system in the production facilities set. It is a method that includes all inactive and input transformations that are effective in a given technology [36]. It evaluates ineffective units, identifies inactive resources, and allows for the reassessment of resource allocation [37]. The DEA approach represents a method in which an entity combines non-reciprocal, multiple inputs and outputs as a measure of organizational efficiency [4].

2.1.1. Fractional Programming Model

DEA is in the form of fractional programming. There is no standard method for fractional programming. A mathematical programming model is used in the event analysis. It can transform a fractional programming model to a linear programming model.
Let the quantity of output factors produced by a DMU be Y i k , r = 1, r and quantity produced by X i k , i = 1,......,m. According to weights given to the factors for output and inputs total factor productivity DMU K is respectively given in the equation for urk, r = 1,...,s and V i k , i = 1,…,m, (1)
r = 1 s S r k Y r k i j m V i k X i k
There must be a set limit for activity scores to be within a certain range. This upper limit was chosen as 1.0. Moreover, the effectiveness score obtained by DMU D should be normalized within the framework of the scores of other DMUs. This limit is expressed in Equation (2)
Model;
Max   h k = r = 1 s   U r k   Y r k i = 1 m   V i k   X i k
Subject to
r = 1 s   U r k   Y r k i = 1 m   V i k   X i k 1     j = 1 , ........... , N
U r k r k 0   &   V i k 0   r = 1 , , s ,   i = 1 , , m

2.1.2. Linear Programming Model

The fractional programming model can be transformed into a linear programming model that can be solved by a simplex algorithm. In the expression given in the fractional programming model objective function, if a solution is possible (U, V) that maximizes under the limit of the model, all (𝛼u, 𝛼v) solutions, including α > 0, maximize the objective function. The expression of this situation is given in (5).
V X i k   m   i = 1
To find a solution that contains an infinite set of elements using the above equation and this model, which can be solved with the help of the simplex algorithm which is the result of the above equation and is called MI, Equation (6) is given below;
Model; MI:
M a x k = μ r k Y r k s r = 1
Subject to
V i k X i k s   i = 1
μ r k Y r j   s   r = 1 V i k X i j   m   i 1 0 j = 1 , ..... , N
μ r k 0 ;   V i k 0 ;   r = 1 .... , s ;   i = 1 , .... , m
The above CCR models calculate the total activity scores. The total activity score is obtained as a result of multiplying technical activity and scale activity values. In order to obtain technical activity scores, Banker et al. [35] this model covers the assumption of the variable return by scale [38].
Since the total factor productivity of DEA is based that is calculated for decision unit (k) using m number of inputs and producing s number of output (10).
r = 1   U r k s   Y r k i = 1 m   V i k X i k
  • Y r k    r = 1, ∝ the output produced by the decision unit,
  • X i k    i = m quantity of input produced by decision unit,
  • U r k    r = 1, s the coefficient of weight given to output by the decision unit
  • V i k    i = 1 m the coefficient of weight given to input by the decision unit
For this purpose, virtual factor weights are assigned to the outputs used and produced by DEA decision units, and relative effectiveness is measured by ensuring that activity scores are formed within the range of 0 to 1. Activity scores within the range of 1 (11) are given as constraints.
r = 1 s   U r k   Y r j i = 1 m   V i k   X i j 1
The constraints that prevents the input and output weights to be used from being negative are given in (12) and (13).
U r k 0    r = 1 , ...... , s
V i k 0    i = 1 , ....... m
In order to equate the denominator of the objective function in maximization to 1 and to make a constraint it is necessary to transform the above set of inequalities into linear programming form and solve with simplex or similar algorithms. This model was developed under the assumption of a fixed return (CRS) based on the scale.

2.1.3. CCR DEA Model

Max   h k
Constraints are given in (14)–(18).
U r k Y r j s r = 1
V i k m i = 1
V i k X i j 0
U r k 0
V i k 0
The model mentioned above should be solved n times according to the parameters of each of the N units of the organizational decision unit. The dual model that provides support for detecting active reference sets is given below. In addition, the VZA operation system is given in Figure 1.

2.2. Multi-Criteria Decision Making Methods

When the scientific studies are examined, it can be seen that there are uncertainties in making decisions in complex and difficultly structured problems, and that decision makers overcome these structures by evaluating their knowledge and experience in the best way and the best solution is reached. At this stage, decision-makers should identify the objectives, goals, and alternatives they will evaluate, and the criteria or criteria that arise in this process when identifying the problem they address. Multi-criteria decision-making methods are used to define the contradictions between the criteria that arise in decision-making problems, to improve the situation and to talk about the best solution. There are many accepted methods in the literature. The AHP and TOPSIS methods of multi-criteria decision-making methods used in problem solving are mentioned [39].
There are many studies in the literature about AHP and TOPSIS methods from multi-criteria decision-making methods. The application areas of these studies vary in many different areas. Some of the studies include, Özcan et al. [40] in the energy sector; Geyik et al. [41], Alver et al. [42] in the education sector; Ayan et al. [43], Taş et al. [44] in the health sector; Gür and Eren [45], Asoğlu and Eren [46]; Gür et al. [47] in transportation; Geyik and Eren [48] in sports; and Alakaş et al. [49] in the communication industry.

2.2.1. Analytical Hierarchy Process

It is one of the alternative solution methods used in decision-making problems with a model developed by Saaty [50]. In cases where hierarchical expression is needed, it is defined as a method that evaluates many subjective judgments, giving the distributions of the factors affecting the decision as a percentage. The AHP method, which has been found to be applied in a wide range of fields since its development, provides the best solution by evaluating the criteria affecting the problem according to an established scale. The AHP method consists of five main steps. These steps are, respectively [39];
• Step 1: Defining the Decision Problem
It is the stage of defining the problem being addressed. Criteria related to the problem/sub-criteria are determined.
• Step 2: Establishing Hierarchical Structure
Hierarchical structure is formed according to the determined purpose. The aim is at the top of the hierarchical structure. There are alternatives at a lower level below criteria and criteria.
• Step 3: Creating Binary Comparison Matrices
Once the hierarchical structure is established, the criteria and alternatives are evaluated among themselves. These evaluations are made with binary comparison matrices. The binary comparison matrix is a nxn matrix. The components on the diagonal take the value 1. While creating the decision matrix, a 1–9 scale developed by Saaty [50] is used.
A = [ 1 a 21 a n 1 1 / a 21 1 / a n 1 1 1 / a n 2 a n 2 1 ] n x n
The binary matrices are generated as shown in Equation (19) using the significance scale shown in Table 1.
• Step 4: Calculation of Relative Importance Vector (Eigenvector)
Each element in the binary comparison matrix is calculated with the help of Equation (20) and created as in Equation (21).
b ij = a ij i = 1 n a ij
B = [ b 11 b 1 n b m 1 b mn ] mxn
Line averages of matrix B showing the importance of factors importance weights are obtained as shown in Equation (22).
w i = j = 1 n c ij n
• Step 5: Measurement of Consistency Ratio Between Criteria.
After weights are found in the AHP method, the consistency of the study should be tested. For the consistency test, firstly, the column vector D, shown in Equation (23), is obtained by multiplying the criteria weights with the decision matrix.
D = [ a 11 a 12 a 1 n a 21 a 22 a 2 n . . . . . . a n 1 a n 2 a n n ] x [ w 1 w 2 . . . w n ]
The E column vector is obtained by the help of the formula in Equation (24) by dividing the resulting D column vector into the criteria weights.
E i = d i w i    ( i = 1 , 2 , , n )
By taking the arithmetic average of the E column vector, λ is obtained as in Equation (25).
λ = i = 1 n E i n
The consistency indicator (CI) is calculated by using the formula λ and Equation (26).
C I = λ n n 1
The consistency indicator is divided by the value of the rationality table, see Table 2, to the value corresponding to the number of criteria, and the consistency ratio (CR) is obtained as shown in Equation (27).
C R = C I R I
If the CR value calculated with Equation (9) is less than 0.10, it means that the comparison is consistent.

2.2.2. TOPSIS Method

This method developed by Yoon and Hwang [51] and frequently used today among multi-criteria decision-making methods enables making decisions between conflicting criteria. Through this method, the distance of options to ideal solution is evaluated according to specific criteria and maximum and minimum values that these criteria can obtain among M number of alternatives. Accordingly, it is possible to sort the M number of alternative options. The steps for the solution process of TOPSIS are formed of six basic steps and are as follows [52]:
Step 1: Formation of Decision Matrix (A)
The decision matrix is also named as the initial matrix. In the decision matrix structure, decision points that are required to rank superiority are listed in rows and evaluation factors to be used in decision making are included in columns. In the decision matrix Aij matrix, m gives the number of decision points and n is the number of evaluation factors.
Step 2: Formation of Standard Decision Matrix (R)
R matrix is acquired in this formulation where a normalization process is concluded by dividing the sum total of squares of values corresponding to each column of values in the decision matrix to the square root with the values calculated later. This matrix is given in Equation (28).
r i j = a i j i = 1 m a i j 2    i = 1 , , m ;    j = 1 ,   ,   n
R i j = [ r 11 r 12 r 1 n r 21 r 22 r 2 n . . . . . . r n 1 r n 2 r n n ]
Step 3: Formation Weighted Standard Decision Matrix
At this stage, first, the weight values (wi) for the evaluation criteria are determined.
A weighted standard decision matrix (V) is generated by multiplying the values of this wi with each value in the Matrix R. This matrix is shown in Equation (30).
V i j = [ w 1 r 11 w 2 r 12 w n r 1 n w 1 r 21 w 2 r 22 w n r 2 n . . . . . . w 1 r m 1 w 2 r m 1 w n r m n ]
Due to the nature of some problems, decision makers calculate weight values in various methods at this stage or they continue calculation steps by accepting the weight values of the evaluation criteria as equal.
Step 4: Formation of Ideal (A*) and Negative Ideal ( A ) Solutions
It is thought that the criteria identified in the problem have a tendency to monotonously increase or decrease according to the TOPSIS method. For this reason, the maximum value in each column in the Matrix V represents the ideal (A*) solution and the minimum values represent the negative ideal ( A ) solution.
A * = { ( max i   v i j | j J ) ,   ( min i   v i j | j J ) }
Set obtained as a result of this calculation is shown as A * = { v 1 * , v 2 * ,   v n * } .
A = { ( min i   v i j | j J ) ,   ( max i   v i j | j J ) }
Set obtained as a result of this calculation is shown as A = { v 1 , v 2 , , v n } .
In both formulas, J is the benefit (maximization), and J’ represents the loss (minimization) value.
Step 5: Calculation of Separation Criteria
It is necessary to calculate the distances of each criterion evaluated in this step to the ideal and negative ideal solution points. Accordingly, the calculation of maximum and minimum points to ideal points with the Euclidian distance approach during calculation is shown in Equations (33) and (34).
S i * = j = 1 n ( v i j v j + ) 2      i = 1 , , m
S i = j = 1 n ( v i j v j ) 2      i = 1 , , m
The number of S i * and S i to be calculated here will be the number of decision points.
Step 6: Calculation of Relative Proximity According to the Ideal Solution
In order to find the proximity ( C i * ) of alternatives to the ideal solution, the distances of the criteria to the ideal and negative solution points are used. The criterion used at this point reflects the share of the negative ideal separation criterion within the total separation criterion. The formula given in Equation (35) is calculated as the value of the proximity to the ideal solution.
C i * = S i S i + S i +
As a result of this calculation, if the ( C i * ) value is found between 0 C i * 1 range at C i * = 1 point it shows the proximity of related decision point to the ideal solution, if C i * = 0 it shows the absolute proximity of the related decision point to ideal solution.

3. Results

3.1. Evaluation by Data Envelopment Analysis in Automotive Sub-Industry In Konya

This doctorate thesis titled “Determination of KOSGEB support models for SMEs with data envelopment analysis and Multi-Criteria Decision-Making methods” has been accepted by the Kırıkkale University, Institute of Social Sciences, Department of Business Administration on 18 May, 2017.

3.1.1. Definition of Problem

Due to features of SMEs supporting stability in the economic crises, potential employment capacity plans and programs have been implemented on enterprises of these sizes. Support programs were organized by various public institutions, especially by KOSGEB, in order to improve the added value provided to the general economy at higher levels. However, placement of the productivity to the center of all these works, solving productivity problems of the enterprises together with other problems and producing projects for the future will make the economy of the country more dynamic. In addition to support program projects provided for SMEs by KOSGEB with respect to projects and project preparation, enhancing and promoting aspects of the supports provided by other government institutions have a direct relationship with the resolution of problems of enterprises and opening the way for these enterprises. Despite the high number of models promoting SMEs in other institutions, especially KOSGEB, there is no priority ranking and method to decide which support program should be used by a specific enterprise in accordance with its size, productivity, and problems of the enterprise. Resolving the priority problems of enterprises and support models that will open up business-specific frontiers will generate more added value, both to the enterprise and the general economy. In this context, this study was aimed to find solutions for problems of enterprises by taking into account the productivity conditions and creating a ranking of KOSGEB support models for enterprises listing the priority supports needed according to their productivity status. Implementation steps created for this purpose have been given above.
In this study, the problems of SMEs are discussed under four titles. These titles are problems related to management organization, production, and technology, in addition to finance and marketing.
Management and organizational problems are determined as problems experienced in the management processes of enterprises; management method, training, personnel management and supply, organization, planning, corporate structure, delegation of power, decision making, follow-up of legal regulations, bureaucratic obstacles, lack of information and coordination [6,7,8,9,10,11,12,13,14,15,16,17,18,19,20,21,22,23,24].
Financing problems: Lack of expert recruitment in financial matters, a lack of knowledge and experience of an enterprise manager regarding financial management issues increases financial problems [11,12,13,14,15,16,17,18,19,20,21,22,23,24,25,26,27,28,29,30,31,32,33,34,35,36,37,38,39,40,41,42,43,44,45,46,47,48,49,50,51,52,53,54,55].
Production and technology issues: The weakness in the export performance of SMEs is due to the insufficiency of their technological capacity and capabilities. It seems that SMEs that do not perform R&D activities that produce technology and are incapable of modernizing their existing capacities will find it difficult to increase their competitiveness against new products and production methods in the market and to maintain the continuity of their growth [5].
Marketing problems: The main problems experienced by SMEs regarding marketing are; difficulties in product development, product differentiation, rapid changes in consumer preferences, high distribution commissions, price agreements of competitors, market dominance of distributors, monopolization of raw material sellers, increase in fake products, oppressive sales methods applied by competitors, deceptive and misleading advertisements, difficulties in satisfying customers, difficulty in keeping up with technological developments, failure to adapt to new sales methods, failure to employ qualified sales people, problems with transportation and storage, problems with inventory control, and deficiencies in information systems [11].

3.1.2. Collection of Data

According to the records of the Konya Chamber of Industry, 595 companies were found in the casting sector related to the automotive supplier industry and the automotive sector. Dates were requested from a total of 100 companies, of which 70 companies were in the automotive supply industry and 30 companies were in the casting sector by means of survey method. A total of 18 companies were ignored because the data they sent were incomplete. The data of 82 companies were evaluated and analyzed by a Frontier Analysis (DEA) program. The companies are divided into groups of A, B1, B2, C1, and C2 according to their activity scores between 0–1.00. Effective companies have been identified and ineffective companies were identified accordingly. The relationship between KOSGEB 14 support models and target criteria were awarded points between 1 and 5. Criteria were weighted with AHP. Priority KOSGEB support models for the companies in the ABC groups were ranked using the TOPSIS method. All steps are given in Figure 2. The total number of employees, total liabilities, equity, total expense, and fixed assets items for 2015 were received as inputs and net sales and total receivables for 2015 were taken as outputs from companies. The literature was used to select the data. A literature survey is given in Table 1. The data were collected through interviews with the company officials and by a questionnaire method. Data Analysis was conducted through the licensed Frontier Analysis (DEA) program. At the end of the analysis, the score distributions were determined and the information obtained was used to determine the effective and ineffective companies. At the end of these operations, improvement rates were found. The analysis is divided into the groups of A, B1, B2, C1, and C2 according to the score of the effective and ineffective companies that were found. After this, the common problems and characteristics of the companies covered by these groups were determined.
In the DEA method, the literature was used to select input and output variables. In evaluating the effectiveness of companies, which input and output variables are used in the literature has been studied. In Table 3, this is presented. In the companies mentioned in the table, generally, a balance sheet and income statement were used. Inputs and outputs are determined by taking into consideration the literature and DEA criteria.
Also in the input and output selection, it is determined that the data in the balance sheet and income statement are used in studies in the literature regarding DEA. Along with the relationship between the input and output variables and the number of DMU and input-output variables was examined in the literature in terms of proportion. The following criteria have been identified.
The number and characteristics of input and output variables need to be determined carefully. Also, it is stated that if more than necessary input and output variables are included in DEA models and associated directly with the production process among variables, in addition to the presence of inappropriate inputs and outputs, the success of the DEA method will be adversely affected [55]. However, the selected input and output factors should have positive and isotonicity characteristics. A positivity feature is that input and output variables should take positive values. According to the co-compatibility feature proposed by Charnes et al. [56], while an increase in the amount of any of the input factors in the model increases the output amounts, it should not lead to any reduction in the output value. For this purpose, although generally the correlation analysis is done in the literature, it is considered sufficient to have a logical co-compatibility between input and output variables [57].
Since all of the data in this study were positive, the resulting figures were positive. Not conducting an isotonicity test was considered not to be a problem in terms of the validity of the results. The number of decision-making units in this study is 82, and the total of the input and output variable number is 12. Therefore, in terms of reliability of research, it complies with the limitation that the decision unit should be one more than the total input and output variable or the number of variables should be at least twice as high. Since the current input and output variable was considered to be sufficient, it was not deemed necessary to add new data. Figure 2 shows the flowchart of the study.

3.1.3. Model and Method

The DEA method was used for the detection of effective companies which was followed by the weighting of the criteria with AHP. After determining these factors, the TOPSIS method was used to rank KOSGEB support models for effective companies and ineffective companies.
Contribution of the Data Envelopment Analysis method to this study; as stated in Figure 3, the input and output variables of SME-scale firms in the automotive supply industry sector in which the number of employees and the yearly net sales revenue are different in size but the firms are aimed at the same target audience were analyzed using the DEA method on equal terms. In this way, effective and ineffective firms were identified. The companies with a score of 1.00 are considered effective, and the companies with a score below 1.00 are not considered effective. In order for ineffective companies to be effective, the score value must be completed to 1.00 by making adjustments to the input or output variables. In other words, it presents the potential improvement rates to us.
In the DEA method, there are two models focused on input and output. The output-focused model aims to produce more output with a certain amount of input. The purpose of the input-focused model is to research what the most appropriate input quantity should be to produce a certain amount of output [60]. The input-focused DEAmodel researches the optimum amount of input to be used that is required to produce a certain amount of output. The output-focused DEA model researches the amount of output that can be obtained with a certain amount of input [61].
In the Frontier analysis program, analyzed by the DEA, Banker, Charnes ve Cooper (BCC) and Charnes, Cooper ve Rhodes (CCR) method, the score was taken to be between 0–1.00. While the highest value is 0, the lowest value is 1.00. Enterprises with a value of 1.00 were considered active, enterprises taking a value below 1.00 were not considered effective. In the DEA BBC model, 31 companies were effective, and 51 companies were not effective. In the DEA CCR model, while 16 companies were effective, 66 companies were not effective. These models also give potential improvement percentages.

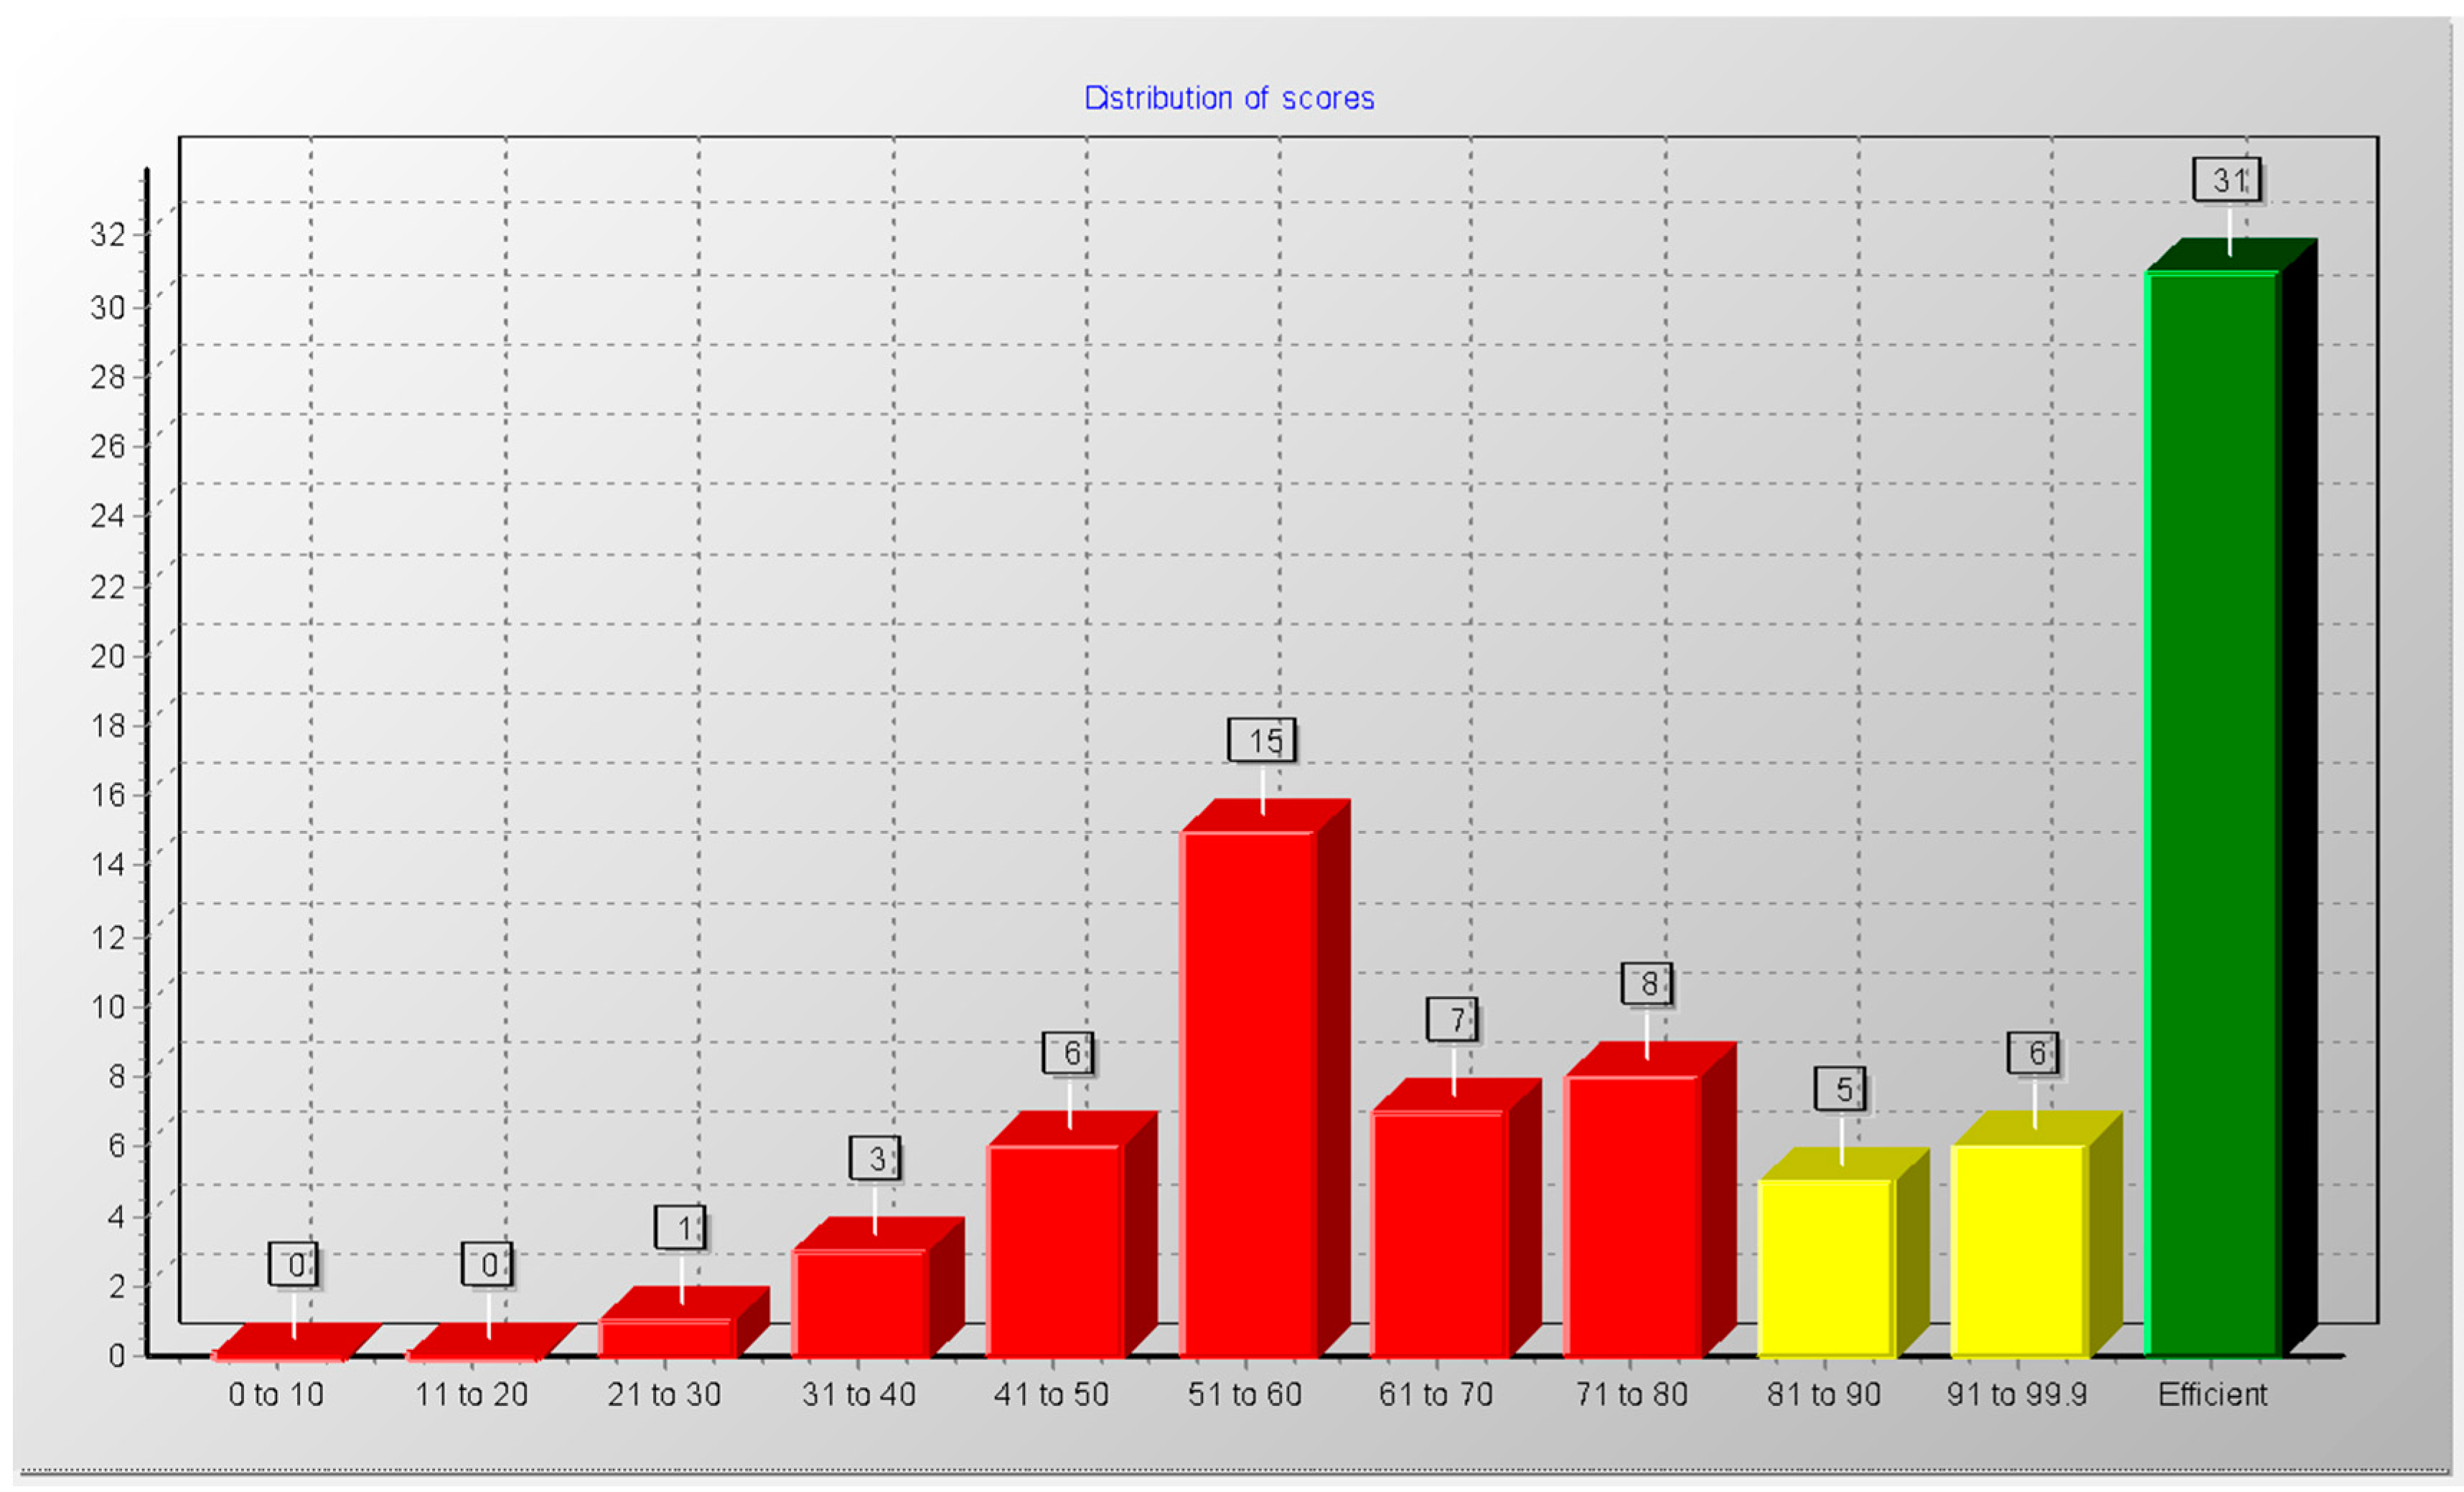
Determining the Firms’ Score Ratios

In the Frontier Analysis (DEA) program, the BCC and CCR models of DEA were analyzed according to an input and output focus method, and the score value of each company was obtained accordingly. The highest score is 1.00 and the lowest score is 0. While the companies that reached the highest score were considered effective, it was found that companies that were below this value were ineffective. Improvement rates are proposed over ineffective scores.
(1) Determination of score rates for BCC model
In Figure 3, scores of 31 companies were found to be 1.00 and 51 companies that were below the reference score 1.0 were not found effective.
Effective firms and ineffective firms the effective companies in Figure 3 are working according to the effective boundary theorem in Figure 4, A, B, C, D, and E* points above the beam give the activity limit. E, F, and G points on this boundary are located above the production limit in Farell’s definition and are considered to be effective in total. An ineffectiveness value is determined over this [62]. Values less than 1.00 are not considered effective when active units are accepted as 1.00 [63].
It is possible to that the variables which are not considered effective may become effective by improving the DMU input and output.
Potential improvement rates are given in Figure 5. By BCC model maximum focused method
(2) BCC model finding score rates by minimum focused method
Company scores were obtained according to DEA and the BCC model minimum focus method. As a result of the analysis, companies with a score reference of 1.00 are regarded as effective. All of the companies that were below this score were included in the group of ineffective companies.
In Figure 6, 31 companies were found to be effective and 51 companies were found to be ineffective.
Potential improvement rates are given in Figure 7. By BCC model maximum focused method.

Determination of Score Rates for CCR Model

Score ratios were determined according to the BBC and CCR maximum and minimum focus models. Effective and ineffective companies were determined based on these score ratios. Suggestions for improvement have been made in order to make ineffective companies effective.
The results are given in Figure 8 that while the score of the 16 firms was 1.00 in the DEA CCR maximum focused method, the score of 64 firms was below 1.00. Some firms have a score of 90–99 and some are between 70–80, while some firms are below.
Potential improvement rates are given in Figure 9. By CCR model maximum focused method.

3.2. Grouping of Firms

The companies were separated into groups of A, B1, B2, C1, and C2. Scoring ratios were taken into account when grouping. Companies with the score of 1.00 were assigned to a group of effective companies as group A whereas companies with a score ratio less than 1.00 were defined as ineffective and listed under groups B and C. Class B was divided into two groups as B1 and B2 while class C was divided into two groups C1 and C2. In grouping process scoring ratios between 1.00, 90–99,9, 81–90, 61–80, 0–60 were taken into consideration. 1.00: A, 90–99: B1, 81–90: B2, 61–80: C1 and 0–60: C2.
Common problems of companies assigned to each group were analyzed after the groups of companies were identified. Class A companies have problems with corporate structure, branding, and qualified personnel. Moreover, they have not received training and consultancy services in the fields of production and marketing. A noteworthy common problem of class B companies is the qualified personnel. Moreover, they also have a corporate structure problem. They need to work on R&D activities. Export market problems have also been identified. A technological equipment problem exists. Class C companies are experiencing problems concerning product quality. There has also been the problem of qualified personnel. Domestic and foreign market problems have also been identified. It is understood that they have a problem with corporate structure. They also have financing problems. Target criteria have been determined in order to provide solutions to these identified problems.

3.2.1. Goal Criteria

The six target criteria that SMEs need to reach are given in Table 4. The AHP weighing procedures were carried out based on these factors. In the assignment of the target criteria, whether companies are effective, ineffective, less effective, and common problems were taken into account. KOSGEB support models related to these criteria were determined on the basis of these target criteria. The hierarchical structure of the criteria is given in Figure 10. The questionnaire Table 5 for the AHP model is given in Table 5.
A consistency check, which is the last step of the binary comparison matrices in the AHP method, has been done. The consistency ratio of all matrices was found to be less than 0.1. This shows that all comparisons and judgments are consistent and logical.

3.2.2. KOSGEB Support Models

KOSGEB support models are designed to solve the problems of companies. The problems of the enterprises are taken into consideration when determining the support models. KOSGEB support models cover support for R&D projects, domestic exhibition support, business trips abroad, promotion support, qualified staff support, consultancy support, training support, loan interest support, matching support, (Small- and Medium-Scale Enterprises Improvement and Support Program) (KOBIGEL) project support, logistic support, test, analysis and calibration support, and voluntary expertise support [64]. The scale value used in the scoring process used in the determination of priority KOSGEB support models was prepared with the AHP-based TOPSIS method and submitted in Table 6. Scoring was made between 1 and 5 depending on the intensity of the relationship.

3.2.3. Determination of Priority KOSGEB Support Models for a Group Companies with AHP-Based TOPSIS Method

Following the ranking of the priority KOSGEB support models, after the scale value is found, criteria for the A group of companies were weighted with the AHP and the priority KOSGEB support models were ranked using the TOPSIS method. The weighting of the criteria with AHP matrix was formulated as shown in Table 7. In the TOPSIS method, when the normalized matrix was calculating in application steps, a benefit normalization formulation was used.
After the decision matrix was established, the A Group AHP Normalized Decision Matrix was established and the consistency ratios were found to be 0.0439 < 0.10. It was understood that the weights obtained with AHP for group A were consistent. Ranking of support models with the TOPSIS method for Group A companies, Decision Matrix created with the TOPSIS method for a group A company, Group A Standard Decision Matrix, Group A Weighted Standard Decision Matrix, Creation of Ideal (+) and Negative Ideal (−) solutions, KOSGEB support models determined by TOPSIS method based on Discriminatory Criteria and Relative Proximity according to an Ideal Solution are listed in Figure 11.
Figure 11 shows the ranking of priority KOSGEB support models for A group.
Table 5 lists the priority KOSGEB support models recommended for companies A, B1, B2, C1, and C2 by using the methods of DEA, AHP, and TOPSIS. The first support model is proposed in the first order, while the second model is recommended in the second order. The ranking is indicated along the bottom line, and the recommendation level is descending in the lower order.

3.3. Ranking of KOSGEB Support Models with the AHP-Based TOPSIS Method

The KOSGEB support models ranked by the AHP-based TOPSIS method and found as a result of DEA analysis divided as effective and ineffective companies into B1, B2, C1, and C2 groups are given in Table 8.

4. Discussion and Conclusions

Efficiency scores of firms were determined using the DEA method. As the values of the scores of firms are 1.00, firms with a score below 1.00 were not effective. Firms are classified as ABC according to their score. Firms with a score of 1.00 are in class, firms below 1.00 are classified into B1, B2, C1, and C2 according to their score values so that KOSGEB support models that can be used by ABC class firms are listed by multi-criteria decision models.
The KOBİGEL support model ranked first for A group companies; it is a support model for business development, investment, production, institutionalization, and marketing. It is quite meaningful that the support model that addresses the many problems of the enterprises ranks first. There is a logistical support model for the B1-group companies, and this is a support model for increasing exports. It is considered that it is a good place for a group that wants to export. The emergence of the KOBIGEL support model for the B2-group companies is considered to be positive because it addresses the many problems of the companies. It is possible to say that the fact that the test, analysis, and calibration support model ranks first in the C1 and C2 group and that they are the companies having quality problems in production is meaningful.
In the literature, the evaluation of the effectiveness of DEA in different sectors was studied. It has been determined that the following results were found. Kula and Özdemir [65] found seven enterprises out of 17 businesses effective in the cement sector. They have identified potential improvement rates of inefficient enterprises. Improvements can be made by reducing and increasing inputs and output rates. Sattary and Shiraz [66] found the performance of 14 companies effective in the Iron and Steel Metal Main Industry sector. Yayar ve Çoban [67], According to the CCR model, 4 firms were effective in the weaving industry and 2 in the apparel industry, while 11 in the weaving industry and 4 in the apparel industry were found to be effective according to the BBC model. Türkmen [68], Real estate investment partnerships is evaluated between 2007–2010 that It has been determined that in 2007: four companies, 2008: four companies, and in 2010: five companies in the İstanbul Stock Exchange were effective. Başkaya and Akar [69] found that six of the 12 insurance companies were effective and the others were below 1.00. Meher and Sahu [70] examined the effectiveness of 40 electricity distribution companies in India. It was observed that 29 companies were not effective. It has been stated that improvement should be made. In the study of Liu and Lyu [71], efficiency evaluations were made in the medical instrument manufacturer companies in China, the score of a company was found to be 1.00; and two firms were lower, meaning not active. Docekalová and Bocková [72] evaluated the effectiveness of the Czech manufacturing sector, while the forest products and paper manufacturing sector became active, the automotive sector remained below this, in other words, it was not seen as effective. Sevinç et al. [73] addressed the challenges SMEs face in the transition to industry 4.0. They analyzed these difficulties with multi-criteria decision-making methods.
In this study, the efficiency analysis of 82 SME companies operating in the automotive supply industry sector was made by the DEA BBC and CCR methods. In the BBC method, while 32 enterprises were effective, meaning the score was 1.00, other enterprises were not found to be effective. In the CCR method, while the operational score of 16 enterprises was 1.00 other enterprises were below 1.00.
The solution to productivity problems is of great importance in the development and growth of SMEs. In the case of providing support to companies using the methods that are the subject of this study according to the problems of the companies, the productivity and efficiency of companies will be improved and more added value will be created for the economy. Although KOSGEB increased the budget allocation for SMEs between the years 2006–2017, no studies were found in the literature on the use of support models according to the productivity of companies. With this study, KOSGEB supports will solve the priority problems of SMEs, ineffective companies will become effective, companies will generate much-added value and the much-added value will be produced for the economy in general.
In this study, BBC and CCR models were used in DEA. There are two main DEA models in the literature: CCR and BCC. In the CCR model, while working under the assumption of constant return (CRS) according to the scale, the study is carried out under the assumption of the BCC model variable return (VRS). The method under which the method is used depends on the sector analyzed. It is effective in the BBC model, which is active in the CCR model. Since the CCR model cannot measure pure technical efficiency and scale efficiency of individual firms, the BBC model has been added. The BBC model activity limit remains below the CCR model. The idle cases of each firm were uncovered, and potential improvements were identified. Thus, the use of resources of firms will be revealed. Input and output directional models are available in DEA. In the input-oriented model; the outputs are kept constant and the inputs are reduced to a minimum. In the output-oriented model, the inputs are kept constant and the outputs are maximized. All of the enterprises included in the working group are commercial firms and profitable enterprises. Therefore, a large number of productions for each company, i.e., output and efficiency rates are important as well as input. It is important to see the results of both the CCR and the BBC model.
In order for DEA to be highly capable of decomposing, a large number of inputs and outputs is desirable. Therefore, as many inputs and output elements as possible should be selected. However, the selected input and output elements must be used for each decision making unit (DMU). If the number of inputs selected is m, the number of outputs is s, then, the minimum number of m + s + 1 KVB is a necessary restriction for the reliability of the research [74]. Golany and Roll (1989) suggested that the KVB number should be at least twice the number of input and output variables [75]. In their study, Boussofiane et al. reported that the total number of input and output variables should not exceed the number of KVBs involved in the analysis [76]. The number and characteristics of input and output variables need to be determined carefully. However, it has been stated that the success of the VZA method will be adversely affected in the case that the input and output variables are included in the VZA models and if there are inappropriate inputs and outputs to be directly related to the production process [77].
There are no arrangements for prioritizing the problems of companies in real life. Firms need to use a support model that will solve the efficiency problem while the productivity problem is found, while the use of another support model is below the contribution potential expected from the support models. In this study, the aim was to prevent this problem. According to the model proposed in this study, if KOSGEB support models are used, they will contribute to the solution of the priority problems of firms. Thus, it will provide maximum contribution to both business and the general economy, scarce resources will be used efficiently, and the right support models will be provided to the right enterprises.
In order to select the support model that will provide the best benefit to the companies in this study, data were collected from the automotive supply industry and the casting sector related to this sector in Konya by a questionnaire from 82 SME-sized companies. DEA BCC and CCR models were analyzed by an input and output focus method, and effective and ineffective companies were determined. Companies were divided into groups as A, B1, B2, C1, and C2 according to the scores they received. Common problems of companies were identified for each group. Criteria were weighted using AHP and KOSGEB support programs, which should be granted to SMEs preferentially by TOPSIS and are listed. The first three support models in group A include KOBIGEL, a qualified personnel support model, and a matching support model. The B1 group includes logistic support, KOBIGEL support program, matching support program, B2 group includes KOBIGEL support model, qualified support model, domestic exhibition support model, C1 group, test includes an analysis and calibration support model, qualified personnel support model, domestic exhibition support, and the C2 group includes test analysis support model, qualified personnel support model, and domestic exhibition support model. The support models recommended according to the score values and problems of the companies that were covered according to groups of A, B1, B2, C1, and C2.
The number of KVBs in DEA applications and their homogeneity are important in terms of healthy working results. In this study, there are 82 KVB, and the total number of inputs and outputs is seven. In this context, it is considered that there is no discrepancy in the study since it meets the criteria of the relationship between DMU (Decision making unit) and input-output.
If the relations between the number of KVB and the input and output are not followed, that is, the excessive number of total entries against the number of KVB will be negatively reflected in the study results, a healthy study result will not be achieved. In order to avoid any problems, the relationship between the number of KVB in the observation set and the number of inputs and outputs associated with it is described in the literature by Aykıran [78], Boussofiane et al. [76], and Ramanathan [55]. Otherwise, it will not be possible to reach the correct results in the studies.
On the basis of the study, inputs consist of the number of employees, fixed assets, equity, total expenses, and total liabilities. Outputs consist of net sales and total receivables.
By utilization of support models that will bring solutions to the problems of SMEs, there will be highly competitive enterprises in national and international markets, successful SMEs will emerge, and there will be a contribution to the general economy in terms of employment, production, and export increase. As a result, the system will contribute to the growth of the economy, increase national income, and resources will be used effectively and efficiently.
According to the priority problems of SMEs by the KOSGEB Administration, there is no method for using support models. In other words, while the firms should use a support model to solve the problem while the productivity problem is found, the use of the other support model remains below the contribution potential expected from the support models. In this study, a model has been designed to solve the primary problems of the support models provided by KOSGEB to SMEs by using scientific methods which are the DEA- and AHP-based TOPSIS methods. If KOSGEB is using support models via this model, it contributes to the solution of the priority problems of the support models. Therefore, these models will provide a maximum contribution to both business and the general economy and will be used efficiently in scarce resources. Thus, the results obtained from this study and the right support models will be provided to the right enterprises.
In the next study, it is planned to prepare a ranking for KOSGEB support models according to AHP-based TOPSIS method by determining companies that are effective and ineffective through DEA in high-technology sectors such as the steel industry, chemical industry, etc. In addition, the use of PROMETHEE and ORESTE with DEA will be taken into consideration. The performance of KOSGEB support models will be evaluated with multi-criteria decision-making methods. Moreover, the productivity status before using KOSGEB supports and one year after using KOSGEB supports will be examined.

Author Contributions

Data curation, Methodology, A.S.; Writing—original draft preparation, A.S., and T.E.; Validation, T.E.

Funding

Funding information is not applicable/No funding was received.

Acknowledgments

This article is supported by Ankara-KOSGEB. This article is supported by Scientific Research Program (BAP) of Kırıkkale University as project of 2015/138.

Conflicts of Interest

The authors declare that there is no conflict of interest regarding the publication of this paper.

References

  1. Sevinç, A. Determination of KOSGEB Support Models for SMEs by Data Envelopment Analysis and Multi-Criteria Decision-Making Methods. Ph.D. Thesis, Kırıkkale University, Institute of Social Sciences, Kırıkkale, Turkey, 2017. [Google Scholar]
  2. Turkey Exporters Assembly. Available online: http://www.tim.org.tr (accessed on 20 December 2018).
  3. Kwong, C.K.; Bai, H. Determining the Importance Weights for the Customer Requirements in QFD Using a Fuzzy AHP with an Extent Analysis Approach; Department of Industrial and Systems Engineering, The Hong Kong Polytechnic University: Hong Kong, China, 2003. [Google Scholar]
  4. Chang, P.L.; Hwang, S.N.; Cheng, W.Y. Using Data Envelopment Analysis to Measure the Achievement and Change of Regional Development in Taiwan. J. Environ. Manag. 1995, 1, 49–66. [Google Scholar] [CrossRef]
  5. Demir, Y.; Sütçü, A. An Analysis of Production Technology and Financial Problems Faced by Small and Medium Sized Enterprises (SME) in the Forest Products Industry of Isparta After Economic Crisis. Turk. J. For. 2002, 2, 79–96. [Google Scholar]
  6. Özgener, Ş. Management and Organization of SMEs in Growth Problems: Nevşehir Unıted Industry Example. Erciyes Univ. J. Fac. Econ. Adm. Sci. 2003, 20, 137–161. [Google Scholar]
  7. Donthu, N.; Hershberger, E.K.; Osmonbekov, T. Benchmarking Marketing Productivity Using Data Envelopment Analysis. J. Bus. Res. 2005, 11, 1474–1482. [Google Scholar] [CrossRef]
  8. Düzakın, E.; Bulgurcu, B. Measuring the Economic Efficiency of Priority Provinces in Development during Particular Period. Fac. Econ. Adm. Sci. 2010, 1, 1–18. [Google Scholar]
  9. Kayalıdere, K.; Kargın, S. Efficiency and Data Envelopment Analysis in the Cement and Textile Sectors. T.R. Dokuz Eylül Univ. J. Grad. Sch. Soc. Sci. 2004, 1, 196–219. [Google Scholar]
  10. Karpat, G.; Kılıçkaplan, S. Efficiency in Life Insurance Sector Investigation in Turkey. Dokuz Eylül Univ. Fac. Econ. Adm. Sci. J. 2004, 1, 1–14. [Google Scholar]
  11. Torlak, Ö.; Uçkun, N. The Interface of The Marketıng And Financial Problems of Small and Medium Sized Businesses in Eskısehır. J. Soc. Sci. 2005, 1, 199–215. [Google Scholar]
  12. Özkanlı, Ö.; Namazalieva, K. A Research on Management Problems in Some Small and Medium Sized Enterprises Operating in Kyrgyzstan. J. Soc. Sci. Turk. World 2006, 39, 97–125. [Google Scholar]
  13. Özdemir, S.; Ersöz, H.Y.; Sarıoğlu, H.İ. Increasing Importance of Small Entrepreneurship and SMEs in Turkey’s Economy Place. J. Soc. Policy Conf. 2007, 53, 173–230. [Google Scholar]
  14. Bozdağ, E.G. Comparison of Turkey and the European Union Activities of the Sugar Industry 1990–2005. Atatürk Univ. J. Econ. Adm. Sci. 2008, 22, 45–55. [Google Scholar]
  15. Özbek, Z. The Effects of SMEs on the Turkish Economy. J. Int. Econ. Probl. 2008, 31, 49–57. [Google Scholar]
  16. Rani, R.M.; Ismail, W.R.; Ishak, I. An integrated simulation and data envelopment analysis in improving SME food production system. World J. Model. Simul. 2014, 10, 136–147. [Google Scholar]
  17. Ha, S.Y.; Lee, G.H.; Kim, B.S. Strategies for Manufacturing Servitization of Korean SMEs: By Using Data Envelopment Analysis. J. Appl. Bus. Res. 2016, 32, 635. [Google Scholar] [CrossRef]
  18. Amornkitvikai, Y.; Harvie, C.; Charoenrat, T. Estimating a technical inefficiency effects model for Thai manufacturing and exporting enterprises (SMEs): A stochastic frontier (SFA) and data envelopment analysis (DEA) approach. In Proceedings of the Informing Science & IT Education Conference (InSITE), 2014, Wollongong, Australia, 30 June–4 July 2014; pp. 363–390. [Google Scholar]
  19. Ulusoy, R.; Akarsu, R. Support for SME’s in Turkey and Its Influence on Employment. Kocaeli Univ. J. Inst. Soc. Sci. 2012, 23, 105–126. [Google Scholar]
  20. Sarikahya, M. Effect of State Subsidies Granted to SMEs in Furniture Industry on The Companies (Ankara Example). J. Politek. 2012, 15, 177–183. [Google Scholar]
  21. Yildiz, S.B. The Importance of Impact Evaluation for Public Supports for SMEs. Celal Bayar Univ. J. Soc. Sci. 2013, 11, 381–390. [Google Scholar]
  22. Yerlikaya, M.A.; Arikan, F. Constructing the performance effectiveness order of SME supports programmes via PROMETHEE and ORESTE techniques. Gazi Univ. J. Fac. Eng. Archit. 2016, 31, 1007–1016. [Google Scholar]
  23. Uluyol, O. Financial Management Applications in Small and Medium Sized Enterprises (SMEs). J. Account. Financ. 2013, 60, 4. [Google Scholar]
  24. Sevinç, A.; Eren, T. Productivity Problems and Solution Proposals of SMEs in Kırıkkale, the 5th National Productivity Congress; Ministry of Science, Industry of Technology: Ankara, Turkey, 2015; pp. 1–72. [Google Scholar]
  25. Stawowy, A.; Duda, J. A Study of the Efficiency of Polish Foundries Using Data Envelopment Analysis. Arch. Foundry Eng. 2017, 17, 223–227. [Google Scholar] [CrossRef] [Green Version]
  26. Skare, M.; Rabar, D. Measuring Economic Growth Using Data Envelopment Analysis. Amfiteatru Econ. 2016, 18, 386. [Google Scholar]
  27. Tran, K.D.; Bhaskar, A.; Bunker, J.M.; Lee, B.L. Data Envelopment Analysis (DEA) Based Transit Routes Performance Evaluation. Transp. Res. Board 96th Annu. Meet. 2017, 8, 1–23. [Google Scholar]
  28. Chıttıthaworn, C.; İslam, M.A.; Keawchana, H.D.; Yusuf, M.H.D. Factors Affecting Business Success of Small and Medium Enterprises (SMEs) in Thailand. Asian Soc. Sci. 2011, 7, 180. [Google Scholar] [CrossRef]
  29. Mardani, A.; Jusoh, A.; Bagheri, M.M.; Kazemilari, M. A Combined Hybrid Fuzzy Multiple Criteria Decision-making Approach to Evaluating of QM Critical Success Factors in SME’s Hotels Firms. Procedia-Soc. Behav. Sci. 2015, 172, 786–793. [Google Scholar] [CrossRef]
  30. Johnes, G.; Johnes, J. Measuring the Research Performance of UK Economics Departments: An Application of Data Envelopment Analysis. Oxf. Econ. Pap. 1993, 45, 332–347. [Google Scholar] [CrossRef]
  31. Banker, R.D. Estimating Most Productive Scale Size Using Data Envelopment Analysis. Eur. J. Oper. Res. 1984, 17, 35–44. [Google Scholar] [CrossRef]
  32. Chen, Y.; Liangb, L.; Yangb, F.; Zhuc, J. Evaluation of Information Technology Investment: A Data Envelopment Analysis Approach. Comput. Oper. Res. 2006, 33, 1368–1379. [Google Scholar] [CrossRef]
  33. Sengupta, J.K. A Fuzzy Systems Approach in Data Envelopment Analysis. Comput. Math. Appl. 1992, 24, 259–266. [Google Scholar] [CrossRef]
  34. Ji, Y.; Lee, C. Data Envelopment Analysis. Stata J. 2010, 10, 267–280. [Google Scholar] [CrossRef]
  35. Banker, R.D.; Charnes, A.; Cooper, W.W. Some models for estimating technical and scale inefficiencies in data envelopment analysis. Manag. Sci. 1984, 30, 1078–1092. [Google Scholar] [CrossRef]
  36. Cook, W.D.; Tone, K.; Zhu, J. Data Envelopment Analysis: Prior to choosing a model. Omega 2014, 44, 1–4. [Google Scholar] [CrossRef]
  37. Liu, J.S.; Lu, L.Y.; Lu, W.M.; Lin, B.J. A Survey of DEA Applications. Omega 2013, 41, 893–902. [Google Scholar] [CrossRef]
  38. Tarım, A. Data Envelopment Analysis: Mathematical programming based relative efficiency measurement approach. Tca Publ. Ank. 2001, 15, 5–40. [Google Scholar]
  39. Saaty, T.L.; Niemira, M.P. A Framework for Making A Better Decision. Res. Rev. 2006, 1, 1–4. [Google Scholar]
  40. Özcan, E.C.; Ünlüsoy, S.; Eren, T. A Combined Goal Programming—AHP Approach Supported with TOPSIS for Maintenance Strategy Selection in Hydroelectric Power Plants. Renew. Sustain. Energy Rev. 2017, 78, 1410–1423. [Google Scholar] [CrossRef]
  41. Geyik, O.; Tosun, M.; Ünlüsoy, S.; Hamurcu, M.; Eren, T. Using AHP And TOPSIS Methods for Selecting of Publishing House. Int. J. Soc. Educ. Sci. 2016, 3, 106–126. [Google Scholar]
  42. Alver, V.; Çetin, S.; Eren, T.; Bedir, N. The Solution of the Assignment Problem of Paid Teachers to Primary and Secondary Schools with the AHP and Mathematical Programming Model: A Case in Kırıkkale, Turkey. Int. J. Lean Think. 2018, 9, 13–32. [Google Scholar]
  43. Ayan, E.; Cihan, Ş.; Eren, T.; Topal, T.; Yıldırım, E.K. Echocardiography Device Selection with Multicriteria Decision Making Methods. J. Health Sci. Prof. 2016, 4, 41–49. [Google Scholar]
  44. Taş, C.; Bedir, N.; Alağaş, H.M.; Eren, T.; Çetin, S. Policlinic Evaluation with Integrating AHP-TOPSIS Methods: An Application in Ankara. J. Health Manag. 2018, 2, 1–16. [Google Scholar]
  45. Gür, Ş.; Eren, T. 3PL Company Selection for Online Shopping Sites with AHP and TOPSIS Methods. Hitit Univ. J. Inst. Soc. Sci. 2017, 10, 819–834. [Google Scholar]
  46. Asoğlu, İ.; Eren, T. Selection a Shipping Company for a Business with AHP, TOPSIS, PROMETHEE Methods. Yalova Univ. J. Soc. Sci. 2018, 8, 102–122. [Google Scholar]
  47. Gür, Ş.; Hamurcu, M.; Eren, T. Selecting of Monorail projects with analytic hierarchy process and 0-1 goal programming methods in Ankara. Pamukkale Univ. J. Eng. Sci. 2017, 23, 437–443. [Google Scholar] [CrossRef] [Green Version]
  48. Geyik, O.; Eren, T. Evaluation of Sports Toto Basketball Super League and Euroleague Basketball Teams with AHP-TOPSIS Methods. J. Sport Sci. Res. 2018, 3, 32–53. [Google Scholar]
  49. Alağaş, H.M.; Bedir, N.; Mermi, Ö.S.; Kızıltaş, Ş.; Eren, T. Evaluation of Main News Bulletins with AHP-TOPSIS. In Proceedings of the 2th International Media Studies Congress, Antalya, Turkey, 20–23 April 2016. [Google Scholar]
  50. Saaty, T.L. The Analytical Hierarchy Process, Planning, Priority; Resource Allocation; RWS Publications: Pittsburgh, PA, USA, 1980. [Google Scholar]
  51. Hwang, C.L.; Yoon, K. Methods for multiple attribute decision making. In Multiple Attribute Decision Making; Springer: Berlin/Heidelberg, Germany, 1981; pp. 58–191. [Google Scholar]
  52. Jahanshahloo, G.R.; Lotfi, F.H.; Izadikhah, M. An Algorithmic Method to Extend TOPSIS for Decision-Making Problems with Interval Data. Appl. Math. Comput. 2006, 175, 1375–1384. [Google Scholar] [CrossRef]
  53. Gebeş, F.; Battal, Ü. Aviation Cluster in Turkey and Financing Problems. Acad. Rev. Econ. Adm. Sci. 2014, 7, 1. [Google Scholar]
  54. Çakır, S. Effıcıency Measurement in Caykur Factories with Fuzzy Data Envelopment Analysis. J. Fac. Eng. Archit. Gazi Univ. 2016, 31, 369–381. [Google Scholar]
  55. Ramanathan, R. An Introduction to Data Envelopment Analysis: A Tool for Performance Measurement; Sage Publications: New Delhi, India, 2003. [Google Scholar]
  56. Charnes, A.; Cooper, W.W.; Golany, B.; Seiford, L.; Stutz, J. Foundations of Data Envelopment Analysis for Pareto–Koopmans Efficient Empirical Production Functions. J. Econom. 1985, 30, 91–127. [Google Scholar] [CrossRef]
  57. Bowlin, W.F. Measuring Performance: An Introduction to Data Envelopment Analysis (DEA). J. Cost Anal. 1998, 15, 3–27. [Google Scholar] [CrossRef]
  58. Ulucan, A. Data Envelopment Analysis Approach in Efficiency Measurement of 1S0500 Companies: Evaluations Using Differed Input Output Components and Different Returns to Seale. Ank. Univ. Sbf J. 2002, 57, 187–202. [Google Scholar]
  59. Özdemir, A.İ.; Düzgün, R. Capital of Turkish Automatic Films effective Analysis According to The Structure. J. Econ. Adm. Sci. 2009, 23, 1. [Google Scholar]
  60. Gülel, F.E. Internet Usage Effıcıency Analysıs Between Countrıes In Europe: A Sımar And Wılson Approach. Dogus Univ. J. 2013, 14, 65–72. [Google Scholar] [CrossRef]
  61. Behdioğlu, S.; Özcan, G. Data Envelopment Analysis and An Application In Banking Sector. Suleyman Demirel Univ. J. Fac. Econ. Adm. Sci. 2009, 14, 301–326. [Google Scholar]
  62. Armağan, T. Data Envelopment Analysis Mathematical Programming Based Relative Efficiency Measurement Approach; Sayıştay Presidency: Ankara, Turkey, 2001. [Google Scholar]
  63. Seyrek, İ.H.; Ata, H.A. Data Envelopment Analysis and Data Mining and Efficiency Measurement in Deposit Banks. Bddk Bank. Financ. Mark. 2010, 4, 67–84. [Google Scholar]
  64. KOSGEB Support Regulations. Available online: A www.kosgeb.gov.tr (accessed on 6 May 2016).
  65. Kula, V.; Özdemir, L. Determination of Relative Efficiency Areas in Cement Sector by Data Envelopment Analysis, Afyon Kocatepe University. J. Econ. Adm. Sci. 2007, 9, 55–70. [Google Scholar]
  66. Bakirci, F.; Seyedhadi, S.E.; Sattary, A. Financial Performance Analysis of Iron, Steel Metal Industry Sector Companies in the Borsa İstanbul: DEA Super Efficiency and TOPSIS Methods. Ege Acad. Rev. 2014, 14, 9–19. [Google Scholar]
  67. Yayar, R.; Çoban, M.N. Data Envelopment Analysis Approach to Measure Activities of Iso 500 Firms: Weaving and Clothing Industry, Niğde University. Acad. Rev. Econ. Adm. Sci. 2012, 5, 165–180. [Google Scholar]
  68. Türkmen, S.Y. Analysis of the Financial Efficiency of Real Estate Investment Trusts in ISE by Data Envelopment Analysis. Marmara Univ. J. Econ. Adm. Sci. 2011, 31, 273–288. [Google Scholar]
  69. Akar, C.; Başkaya, Z. Determining Sales Performance of Insurance Companies with Data Envelopment Analysis. Muğla Univ. J. Inst. Soc. Sci. 2005, 15, 37–51. [Google Scholar]
  70. Meher, S.; Sahu, A. Efficiency of electricity distribution utilities in India: A data envelopment analysis. OPEC Energy Rev. 2016, 40, 155–179. [Google Scholar] [CrossRef]
  71. Liu, Y.; Lyu, W. Applying Data Envelopment Analysis to Evaluate Financial Leasing Performance of Medical Device Industry in China. Revısta De Cercet. Sı Interv. Socıala 2018, 63, 304–315. [Google Scholar]
  72. Marie Docekalová, M.; Bocková, N. The Use of Data Envelopment Analysis to Assess the R&D Effectiveness of The Czech Manufacturing Industry, Versu\S: Teorija Ir Praktika Business. Theory Pract. 2013, 14, 308–314. [Google Scholar]
  73. Sevinç, A.; Gür, Ş.; Eren, T. Analysis of the Difficulties of SMEs in Industry 4.0 Applications by Analytical Hierarchy Process and Analytical Network Process. Processes 2018, 6, 264. [Google Scholar] [CrossRef]
  74. Ertuğrul, İ.; Işık, A.T. Eficiency Measurement Based on Financial Statements of Companies with DEA: An Application in Metal Main Industry. Afyon Kocatepe Univ. J. Econ. Adm. Sci. 2008, 10, 1. [Google Scholar]
  75. Golany, B.; Roll, Y. An Application Procedure For DEA. Omegainternational J. Manag. Sci. 1989, 17, 237–250. [Google Scholar] [CrossRef]
  76. Boussofiane, A.; Dyson, E. Thanassoulis. Applied Data Envelopment Analysis. Eur. J. Oper. Res. 1991, 52, 1–15. [Google Scholar] [CrossRef]
  77. Gökgöz, F. Data Envelopment Analysis and Application to Finance Field; Ankara University Faculty of Political Sciences: Ankara, Turkey, 2009; Volume 597. [Google Scholar]
  78. Avkıran, N. Investigating Technical and Scale Efficiencies of Australian Universities through Data Envelopment Analysis. Socio-Econ. Plan. Sci. 2001, 35, 57–80. [Google Scholar] [CrossRef]
Figure 1. The operating system of a data envelopment analysis (DEA) model.
Processes 07 00130 g001
Figure 2. Application Steps (DEA: Data Envelopment Analysis; BCC: Banker, Charnes ve Cooper; CCR: Charnes, Cooper ve Rhodes; AHP: Analytical Hierarchy Processes; KOSGEB: Small and Medium Enterprises Development and Support Administration; TOPSIS: Technique for Order Preference by Similarity to Ideal Solution.
Processes 07 00130 g002
Figure 3. Maximum focused method score distribution with Banker, Charnes ve Cooper (BCC) Model.
Processes 07 00130 g003
Figure 4. Efficiency boundary.
Processes 07 00130 g004
Figure 5. Maximum focused method potential improvement rates with Banker, Charnes ve Cooper (BCC) Model.
Processes 07 00130 g005
Figure 6. BCC model minimum focused method score distribution.
Processes 07 00130 g006
Figure 7. Minimum focused method potential improvement rates with BCC Model.
Processes 07 00130 g007
Figure 8. CCR Model Maximum Focused Method Score Distribution.
Processes 07 00130 g008
Figure 9. Maximum focused method potential improvement rates with the CCR Model.
Processes 07 00130 g009
Figure 10. Hierarchical structure.
Processes 07 00130 g010
Figure 11. Priority KOSGEB support models for group A (effective firms) companies.
Processes 07 00130 g011
Table 1. The 1–9 scale.
Importance LevelDefinition
1Equally important
3One and the other partially
5Basic or strong importance
7Very powerful importance
9Extreme importance
2,4,6,8intermediate values
Table 2. Rassality indicator table.
n12345678
RI (Rassality Indicator)000.580.91.121.241.321.41
n9101112131415-
RI (Rassality Indicator)1.451.491.511.481.561.571.59-
Table 3. Input and Output variables in literature.
Author(s) and YearInputsOutputs
Yıldız
[21]
Total number of employees
Total asset
Net Sales
Net Profit
Kayalıdere
Kargın
[9]
Total number of employees
Total asset
Fixed assets
Net sales
Net profit
Ulucan
[58]
Total number of employees,
Equity
Sales
Profit
Özdemir ve Düzgün
[59]
Net Active
Equity
Total number of employees
Total Sales
Profit
Table 4. Target Criteria.
CodeGoal Criteria
K1Branding
K2Technology
K3Corporate structure
K4Marketing
K5Production
K6Financing
Table 5. Questionnaire table for Analytical Hierarchy Processes (AHP).
Comparison of Evaluation Criteria with Each Other and the Scoring Questionnaire
987654321123456789
BrandingTechnology
BrandingCorporate structure
BrandingMarketing
BrandingProduction
BrandingFinancing
TechnologyCorporate structure
TechnologyMarketing
TechnologyProduction
TechnologyFinancing
Corporate structureMarketing
Corporate structureProduction
Corporate structureFinancing
MarketingProduction
MarketingFinancing
ProductionFinancing
Table 6. Scale Value.
Scale ValueScale Status
1Very limited relation
2Limited relation
3Normal relation
4Much related
5Very much related
Table 7. A Group AHP Decision Matrix.
BrandingCorporate StructureTechnologyFinance
Branding1.00003.00005.00007.0000
Corporate structure0.33331.00003.00005.0000
Technology0.20000.33331.00003.0000
Finance0.14290.20000.33331.0000
Table 8. Priority Small and Medium Enterprises Development and Support Administration KOSGEB upport models proposed for Group A, B1, B2, C1, and C2 Companies.
NoA Group CompaniesB1 Group CompaniesB2 Group CompaniesC1 Group CompaniesC2 Group Companies
1P10: KOBIGEL support modelP11: Logistic support modelP10: KOBIGEL support modelP14: Test analysis and calibration support modelP14: Test analysis and calibration support model
2P5: Qualified staff support modelP10: KOBIGEL support modelP5: Qualified staffs supportP5: Qualified staff support modelP5: Qualified staff support model
3P9: Matching support modelP9: Matching support modelP2: Domestic Exhibition support modelP2: Domestic exhibition support modelP2: Domestic exhibition support model
4P2: Domestic exhibition support modelP2: Domestic exhibition support modelP11: Logistic support modelP6: Consultancy support modelP6: Consultancy support model
5P6: Consultancy support modelP4: Promotion support modelP3: Domestic exhibition support modelP13: Documentation support modelP7: Training support model
6P7: Training support modelP5: Qualified staff support modelP4: Promotion support modelP7: Training support modelP8: Credit interest support model
7P8: Credit interest support modelP6: Consultancy support modelP8: Credit interest support modelP15: Voluntary expertise support model
8P4: Promotion support modelP7: Training support modelP6: Consultancy support modelP8: Credit interest support model
9P3: Business trip abroadP8: Credit interest support modelP7: Training support model
10P1: R&D support modelP15: Voluntary expert support modelP15: Voluntary expertise support model
11P3: Overseas Business TripP13: Documentation support model
12P1: R&D support modelP1: R&D support model
KOBIGEL: Small- and Medium-Scale Enterprises Improvement and Support Program

