Article

Drying of Phyla nodiflora Leaves: Antioxidant Activity, Volatile and Phytosterol Content, Energy Consumption, and Quality Studies

1
School of Engineering, Taylor’s University, Lakeside Campus, No 1, Jalan Taylor’s, Subang Jaya, Selangor 47500, Malaysia
2
Institute of Agricultural Engineering, Wrocław University of Environmental and Life Sciences, 37a Chełmońskiego Street, 51-630 Wrocław, Poland
3
School of Engineering and Physical Sciences, Heriot-Watt University Malaysia, No 1 Jalan Venna P5/2 Precinct 5, Putrajaya 62200, Malaysia
4
Department of Fruit, Vegetable and Plant Nutraceuticals Technology, Wrocław University of Environmental and Life Sciences, 371 Chełmońskiego Street, 51-630 Wrocław, Poland
5
Department of Chemistry, Wrocław University of Environmental and Life Sciences, Norwida 25, 53-375 Wrocław, Poland
*
Author to whom correspondence should be addressed.
Submission received: 12 March 2019 / Revised: 8 April 2019 / Accepted: 10 April 2019 / Published: 12 April 2019
(This article belongs to the Section Environmental and Green Processes)

Abstract

:
Drying is an important process in the preservation of antioxidants in medicinal plants. In this study, leaves of Phyla nodiflora, or commonly known as frog fruit, were dried using convective drying (CD) at 40, 50, and 60 °C; vacuum-microwave drying (VMD) at 6, 9, and 12 W/g; and convective pre-drying followed by vacuum-microwave finish drying (CPD–VMFD) at 50 °C and 9 W/g. Drying kinetics of P. nodiflora leaves was modelled, and the influences of drying methods on the antioxidant activity, total phenolic content, volatile and phytosterol contents, energy consumption, water activity, and color properties were determined. Results showed that drying kinetics was best described by modified Page model. VMD achieved highest drying rate, whereas VMFD considerably reduced the drying time of CD from 240 min to 105 min. CPD–VMFD was the best option to dry P. nodiflora in terms of retaining volatiles and phytosterols, with lower energy consumption than CD. Meanwhile, VMD at 6 W/g produced samples with the highest antioxidant activity with 2,2′-Azinobis (3-ethylbenzthiazoline-6-sulfonic acid) (ABTS) and ferric reducing antioxidant power (FRAP) value of 11.00 and 15.99 µM Trolox/100 g dw, respectively.

1. Introduction

Antioxidants play important roles in nutrition by increasing the shelf life and preserving the nutritional aspect of lipid-containing food products. Antioxidants also prevent the oxidation of biological molecules in the body by chelating redox metals or quenching free radicals [1,2]. Plants contain numerous natural antioxidants and can be a source of new antioxidant compounds given the various chemical structures and mechanisms of action of these natural antioxidants [3]. Phyla nodiflora (L.) Greene, also known as Lippia nodiflora and widely known as frog fruit, belongs to family Verbenaceae and is distributed in subtropical and tropical regions [4,5]. Previous studies have confirmed the presence of antioxidants in P. nodiflora extracts [6,7], namely, stigmasterols, nodifloretin, nodiflorin, lippiflorin, and batalilfolin [4]. Traditionally, the leaves are used to treat diarrhea, fever, cold, knee joints pain, and gonorrhea [5]. Fresh leaves are high in moisture and are perishable commodities [8]. The antioxidant compounds in the leaves may undergo reduction during the period between harvesting and processing. Thus, fresh medicinal plants must be effectively preserved by removing moisture to inactivate enzymatic, chemical and metabolic reactions, which may otherwise cause the loss of important antioxidants [9].
Moisture removal from food is an integral operation in food processing. Convective drying (CD) has remained the most common drying method to reduce moisture from food and biomaterials. In CD, heat is transferred convectively from the hot air or combustion gasses to the cooler moist boundaries of the drying material. Thereafter, heat diffuses into the drying material primarily through conduction. Evaporation of moisture at the surface of the material is efficient; however, the removal of moisture from the center regions to the surface is slow because it is driven by a moisture concentration gradient, rendering CD a low drying rate method [10]. In view of the limitations of CD, there is increasing interest in emerging drying technologies, such as microwave drying, which gives better drying performance. Microwave drying is gaining popularity because drying time can be reduced and a higher retention of active constituents can be achieved. Despite fast drying rates, the heterogenic structure of materials and the inhomogeneity of microwave field may result in hot spots within the material at the final stage of drying [11]. A solution is to use microwave drying in combination with vacuum drying. This combination has been proven effective in many previous studies on preserving active compounds in the drying of herbs and fruits [12,13]. Furthermore, a lower pressure of vacuum-microwave drying (VMD) induces quicker water evaporation from food material at a lower temperature [14], thereby reducing chemical alterations [15]. However, high water evaporation from plant material at the initial stage of VMD can exceed the vacuum pump’s capacity, so reducing the material load or a larger vacuum pump installation is required [11,14]. Pre-drying through CD, hereafter denoted as CPD, reduces the load mass of raw material to be dried in VMD. This two-stage drying method of CPD followed by vacuum-microwave finish drying (VMFD), hereafter denoted as CPD–VMFD, reduces the total cost of dehydration and improves the quality of products [16].
Although the chemical composition of several herb species dried using vacuum-microwaves has already been well recognized [13,17,18], to date no studies have investigated the influences of VMD and CPD–VMFD on the antioxidant activity of P. nodiflora and similar species. Therefore, it is of interest to evaluate the effectiveness of new vacuum-microwave drying methods compared to conventional CD in retaining bioactive constituents. In the present work, the drying kinetics and energy consumption of CD, VMD, and CPD–VMFD were determined, and the influence of all investigated drying methods was evaluated in terms of antioxidant activity, total phenolic content, concentration of volatiles and phytosterols, color properties, and water activity. Fatty acids were also profiled to identify active constituents in the plant extracts.

2. Results and Discussion

2.1. Drying Kinetics

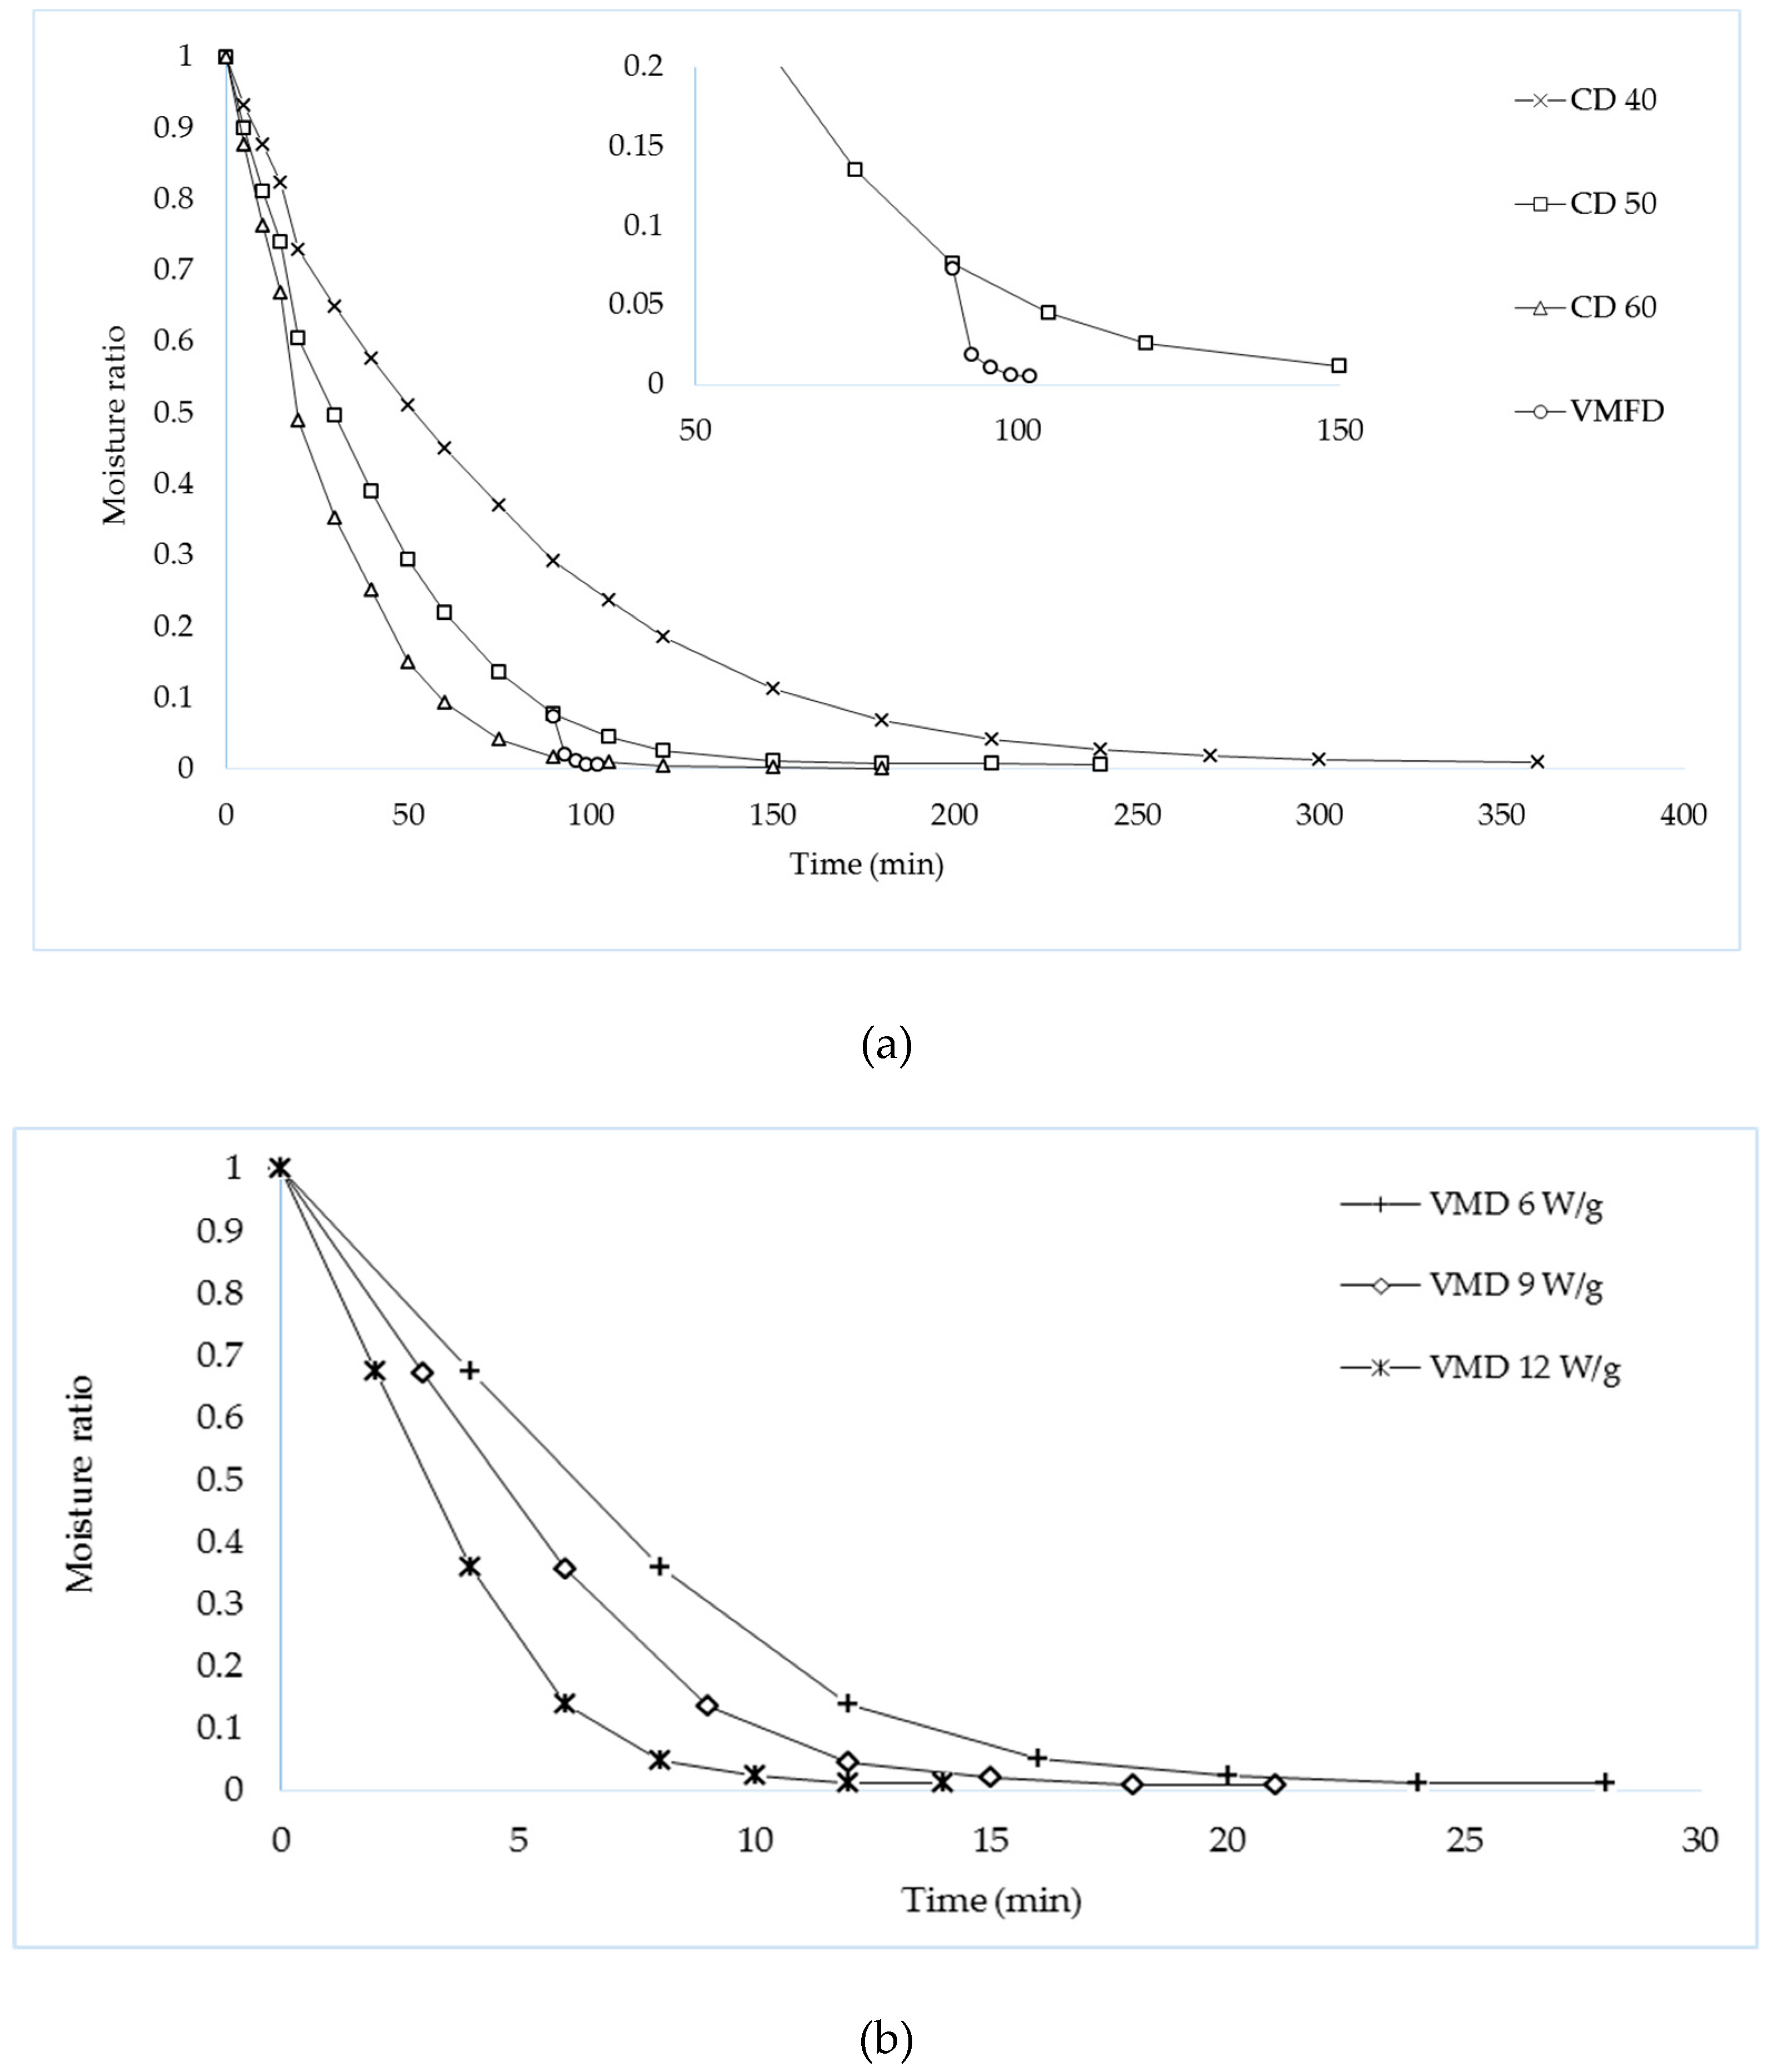
Figure 1a shows the drying kinetics of P. nodiflora leaves dried with CD and CPD–VMFD, while Figure 1b shows the drying kinetics of P. nodiflora dried using VMD. Drying kinetics of all drying methods were best described by an exponential function, namely, the modified Page model (Equation (4)). Table 1 shows the values of both statistical parameters and mathematical constants of the Lewis, modified Page and Henderson and Pabis model. Selection of the best model was based on the highest Coefficient of determination (R2) and the lowest root-mean-square error (RMSE), thereby suggesting goodness of fit. The values, R2 and RMSE, obtained suggest a good agreement between the experimental values obtained and the modified Page model.
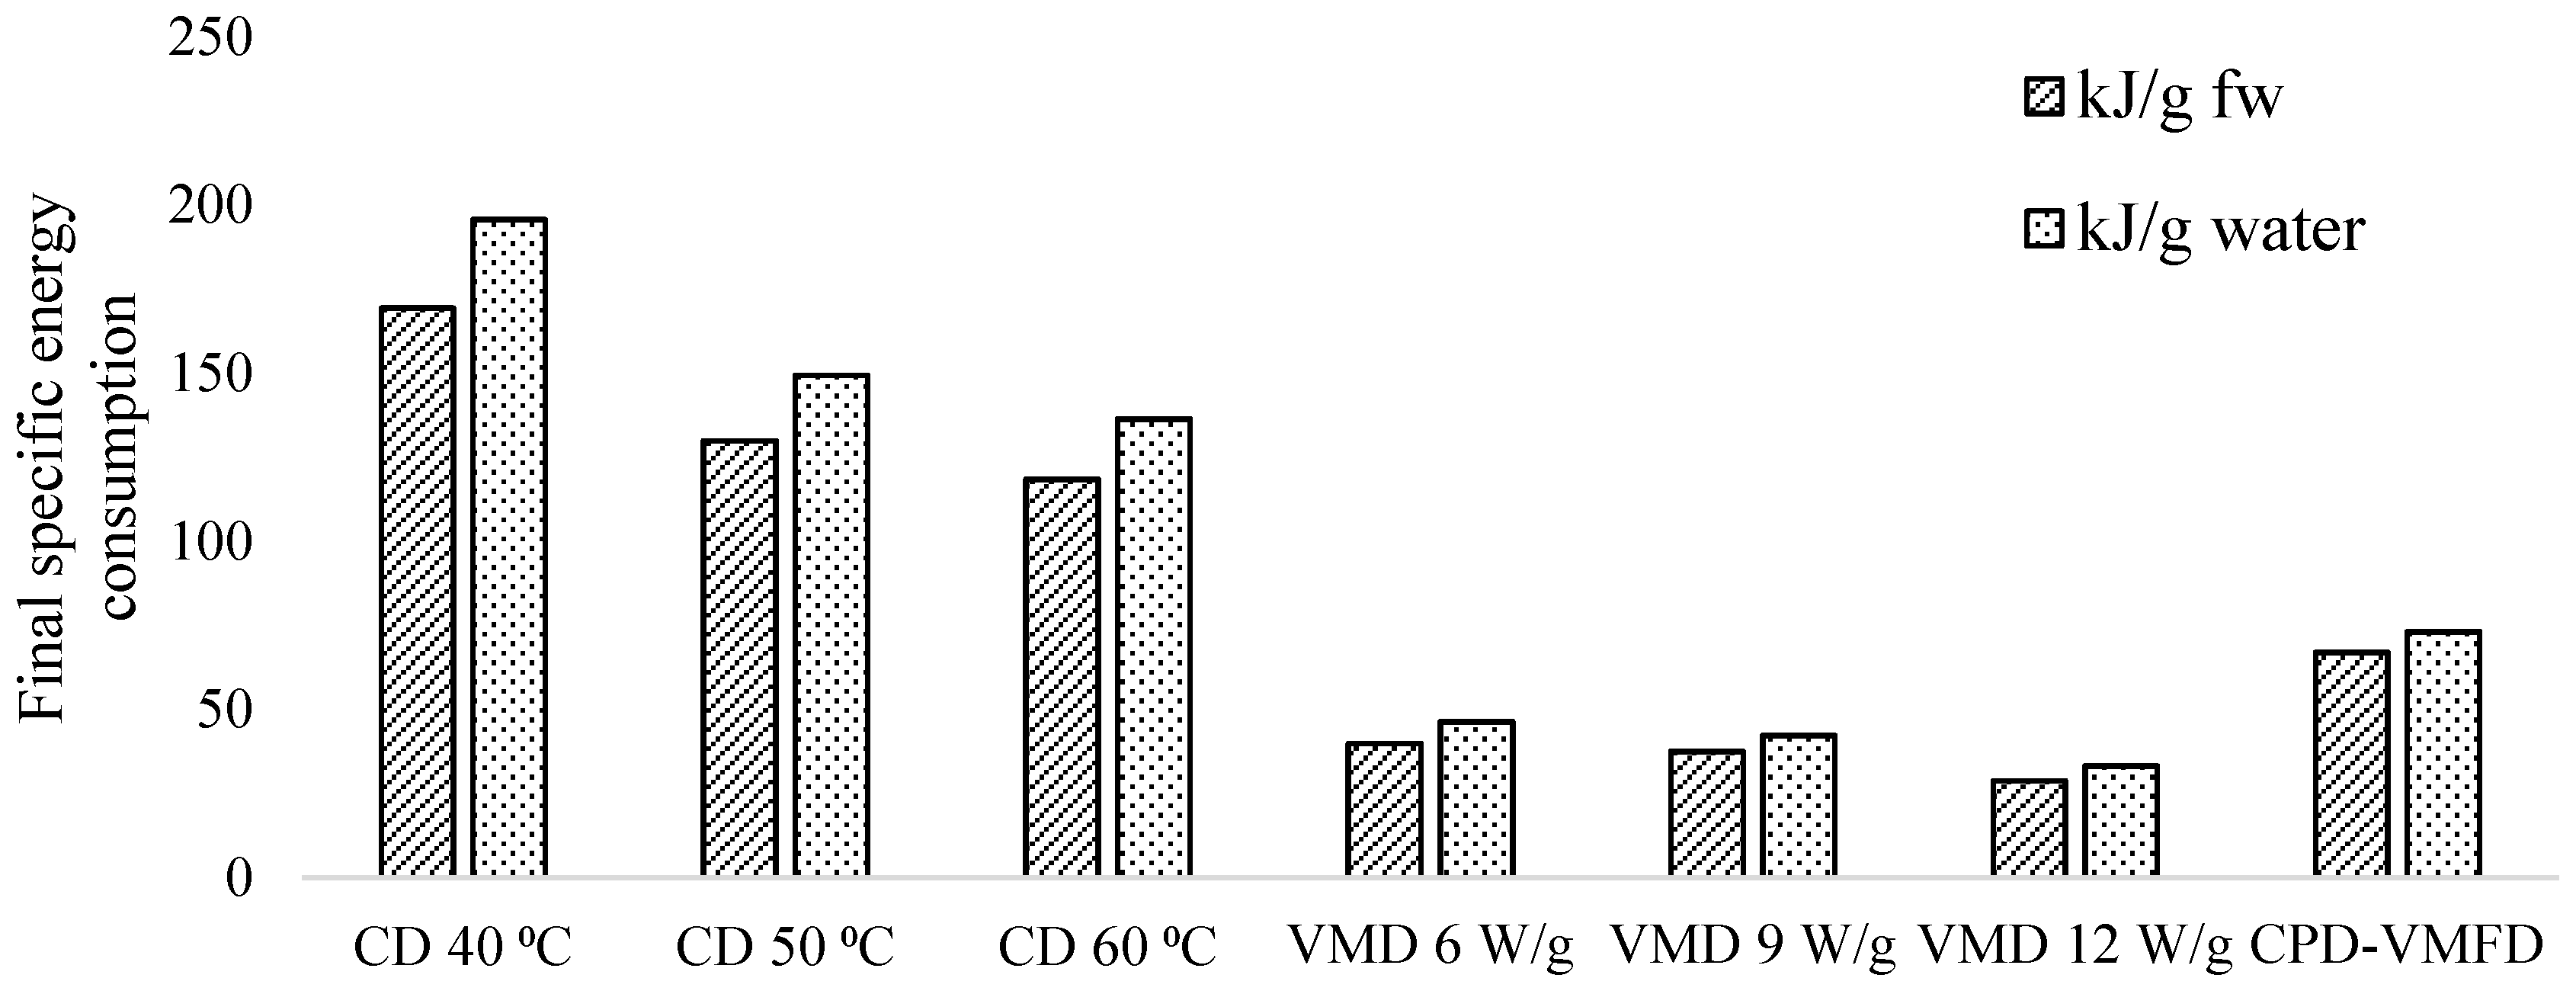
Drying duration of CD was the longest compared with VMD and CPD–VMFD. At the initial stage of CD, moisture loss was fast; however, successive moisture loss reduced with time. This phenomenon occurs because CD uses surface heating; the evaporation of moisture from the surface of plant material was efficient but moisture diffusion from internal region to the surface is slow and rate-limiting [19]. However, when VMFD at 9 W/g was applied to convective pre-dried leaves, drying time was 105 min, as opposed to 240 min of CD, thereby achieving 2.3 times shorter drying duration.
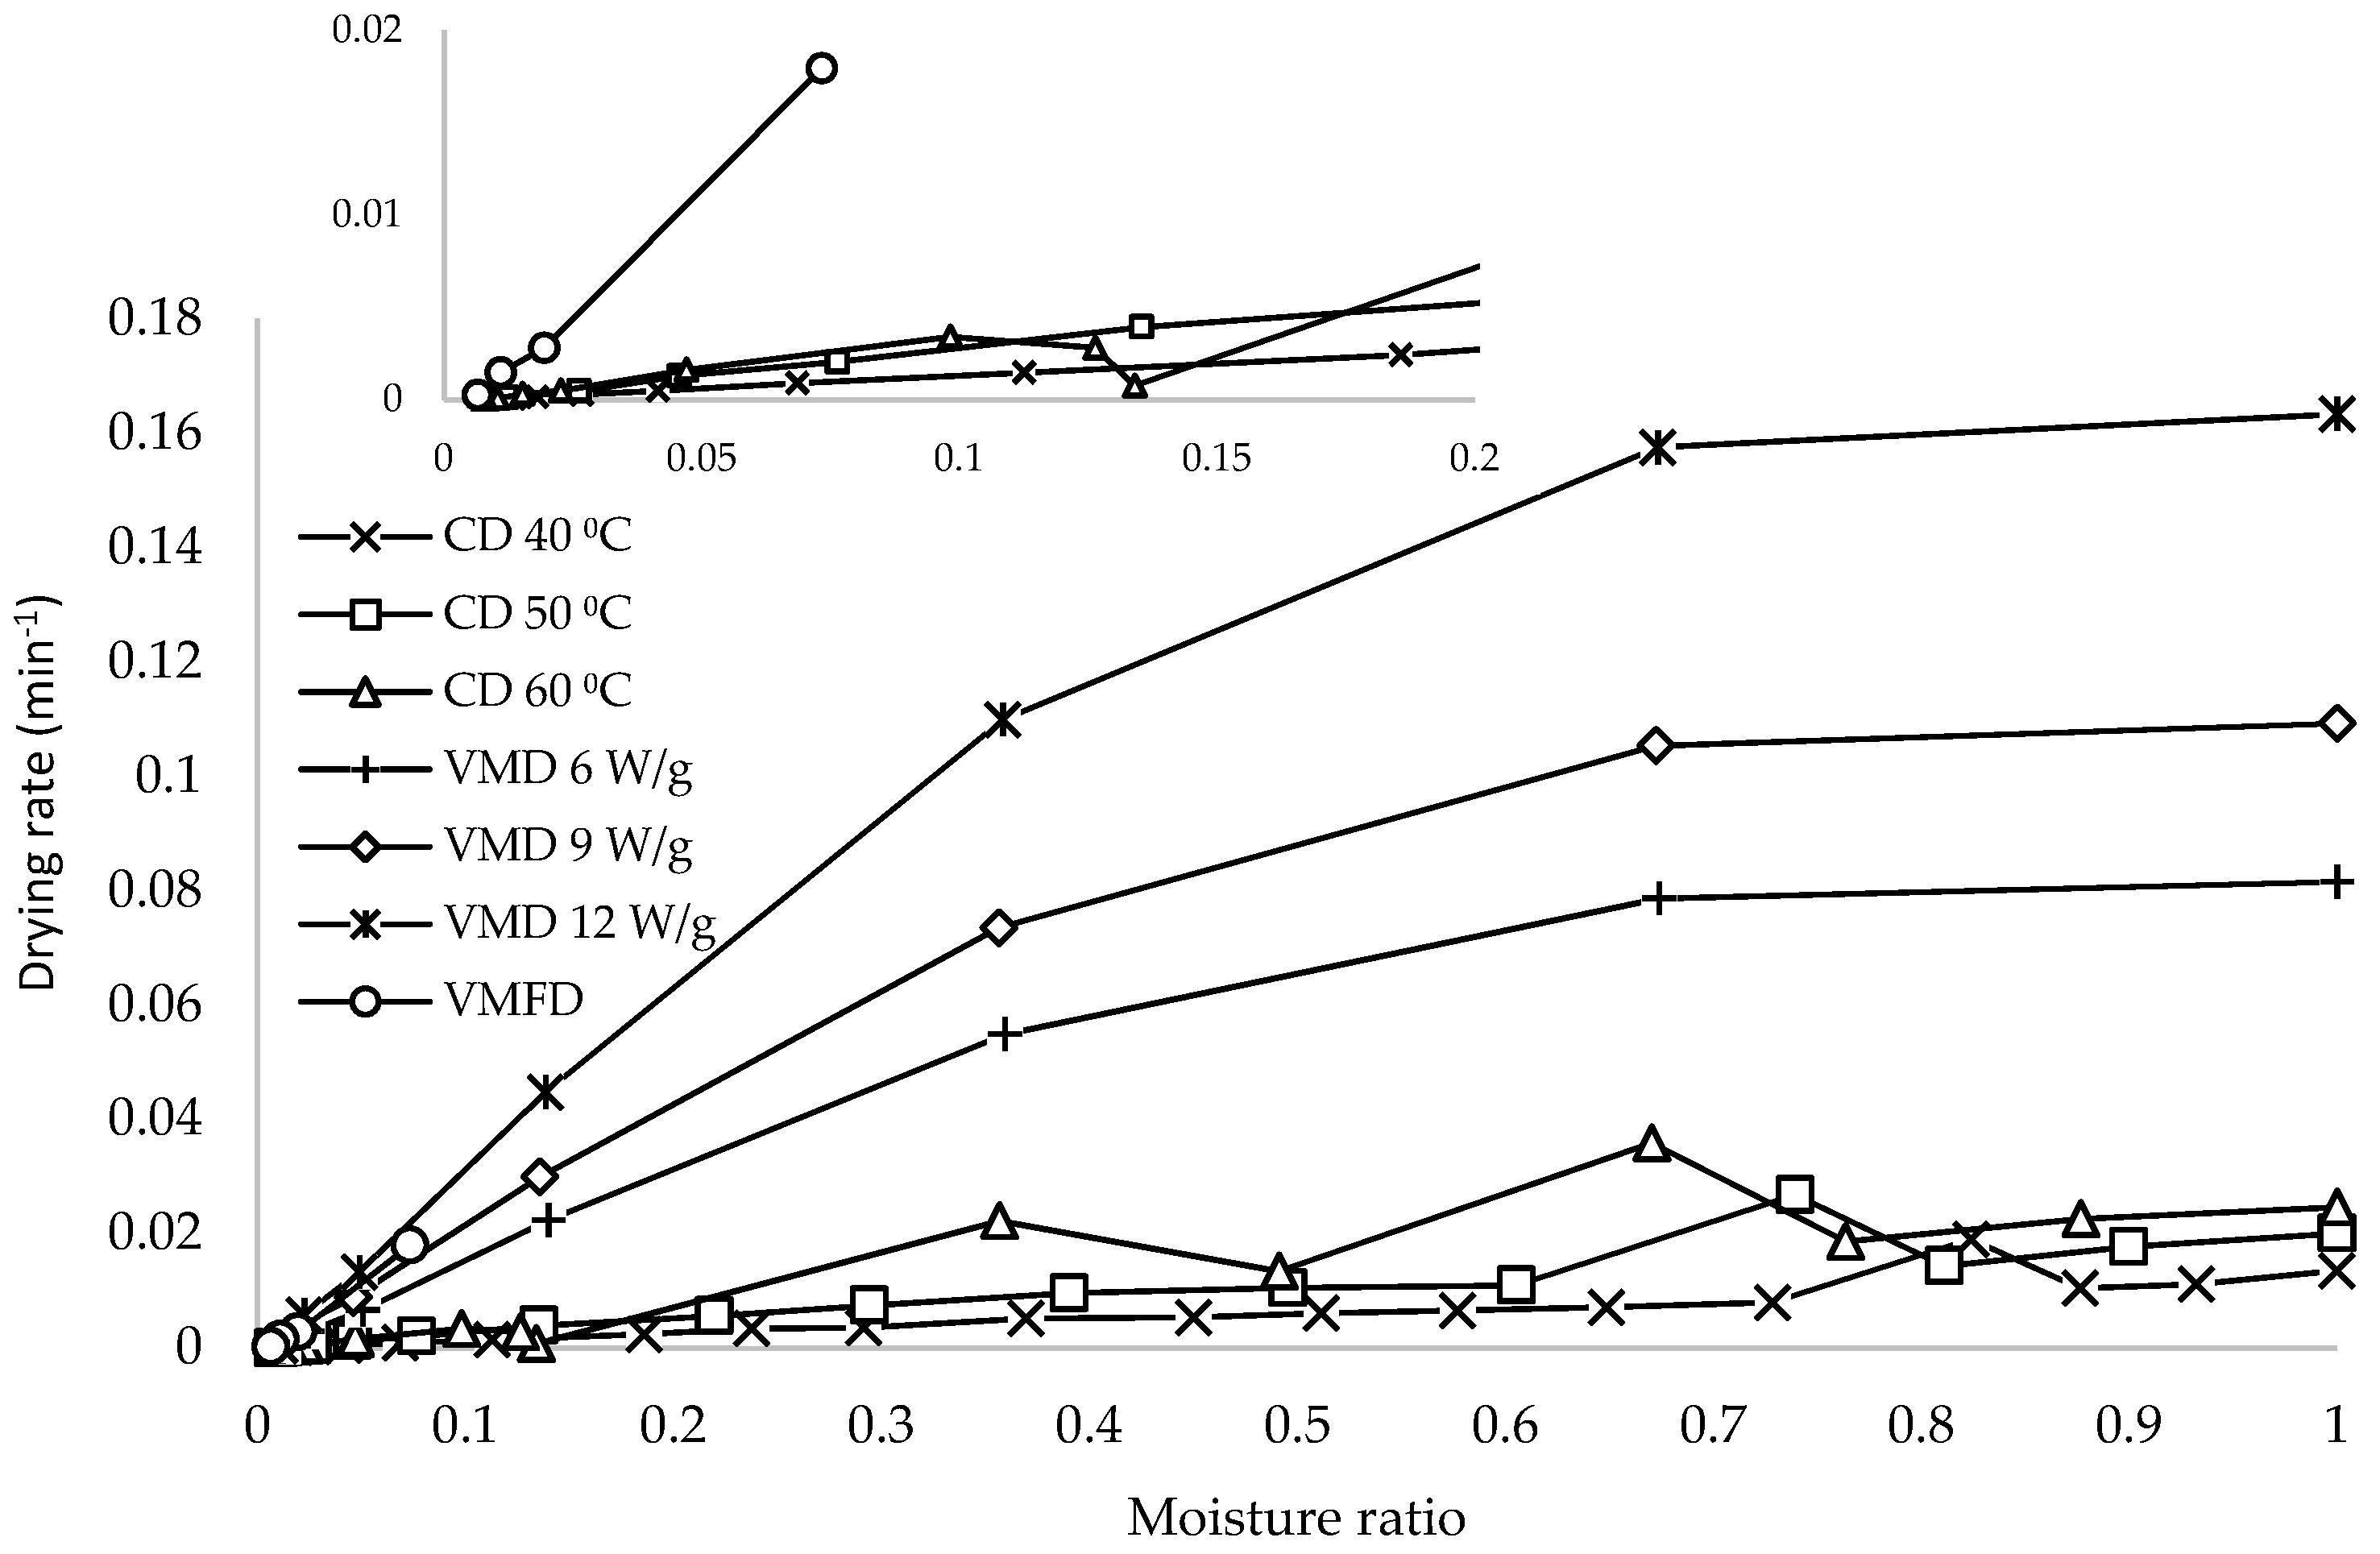
The relationship between drying rate and moisture ratio is shown in Figure 2. The drying rate of VMD was the highest, which was attributed to the volumetric heating of microwave drying. Microwaves penetrate inner regions of leaf tissue, thereby producing heat by the absorption of microwave energy by water molecules. Increased positive steam pressure in leaf structure pushes vapor to the surface to be removed [20]. CD recorded the lowest drying rates, but these values increased with increased temperatures. An increase from 40 to 50 °C showed an average increase of 0.003 min−1, whereas in the case of VMD, an increase from 6 to 9 W/g showed a higher average drying rate of 0.012 min−1. The low drying rate of CD at 50 °C can be compensated for by the introduction of VMFD, which showed a considerable improvement in drying rate at low moisture ratios.
The drying rate also decreased with decreased moisture ratio. This falling rate period is characterized by a continuous decrease in drying rate [17]. With VMD, a higher drying rate is typically observed at the initial stage as moisture content was initially higher in leaves, and this finding corresponded to a higher dielectric constant. Larger microwave radiation was absorbed by the sample, generating more heat, thereby increasing the drying rate. As drying progressed, the reduced amount of moisture reduced the microwave absorption, resulting in decreased drying rates.

2.2. Specific Energy Consumption

Profiles of specific energy consumptions are shown in Figure 3 and Figure 4. Curve shapes revealed that as moisture content decreases, specific energy consumption increased, with a drastic increment at the final stage of drying, as characterized by the critical moisture content, K. The K values of all drying methods (below 0.1847 kg water kg−1 dw) are indicated in Figure 3 and Figure 4. The shape of characteristic curves resulted from the course of the drying kinetics shown in Figure 1a,b. The shape of the drying curves in Figure 1a,b shows that moisture removal was time consuming when moisture content was low. The prolonged time period to remove moisture at the final stages of drying corresponded to the high energy requirement for the removal of the same amount of moisture at the final stage of drying compared to initial drying stages. This behavior is usually seen in plant materials with osmotic cellular structure to limit the escape of moisture from plant tissues [21].
VMD required less energy to remove moisture compared with CD. However, energy consumption of CD can be minimized with VMFD, reducing final specific energy consumptions of CD by 80.2% and 51.1% (kJ/g water). CPD reduced water load by 92.4%, from an initial moisture content of 7.032 to 0.537 kg water kg−1 dw. Drying intensity was also an influencing factor on the respective specific energy consumptions. Higher drying intensities in terms of increased hot-air temperature and microwave wattage reduced final specific energy consumptions (Figure 5), which is consistent with observations of past reports [21,22].

2.3. Antioxidant Activity and Total Phenolic Content Analysis

Analysis of antioxidant activity showed that the highest antioxidant activity was observed for VMD 6 W/g samples 2,2′-Azinobis (3-ethylbenzthiazoline-6-sulfonic acid (ABTS), 11.00 µM Trolox/100 g dw; ferric reducing antioxidant power (FRAP), 15.99 µM Trolox/100 g dw). The lowest antioxidant activity was obtained with VMD 12 W/g with an ABTS value of 6.62 µM Trolox/100 g dw, whereas the lowest FRAP value of 8.26 µM Trolox/100 g dw was shown by CD 40 °C samples (Table 2).
Active compounds of thermally dried herbs were assumed to have undergone thermal degradation and oxidative degradation in the case of CD and CPD–VMFD, thereby leading to the lower antioxidant activities observed. The results clearly indicate that a suitable application of hot-air temperature and microwave power, during CD and VMD, have the potential in yielding high antioxidant activities. A low microwave power of 6 W/g (VMD) and a higher temperature of 60 °C in CD were beneficial in yielding high antioxidant activities.
The intensity of drying treatment also affected antioxidant activity. The increase in temperature of CD, from 40 to 60 °C, shortened the drying length within 360 to 180 min. At 50 and 60 °C, the degradation of heat-sensitive compounds was considerably lower compared to CD at 40 °C, which was confirmed by relatively high antioxidant activity. These results indicate that the increase in temperature during CD is effective in accelerating the drying process, thereby shortening sample’s exposure to elevated drying temperature in a highly oxygenated condition. With increased microwave power of VMD, from 6 to 12 W/g, antioxidant activity decreased. The increase in microwave power from 6 to 12 W/g decreased the drying time from 28 to 21 min, which; however, did not contribute to the preservation of antioxidant activity in the same way as observed in the case of CD. Evidently, the reduction in drying time did not compensate for the degradation of the antioxidant compounds resulting from the greater amount of heat generated inside the material by increased microwave radiation.
The lengthy CD process can be shortened with microwave heating, as seen in CPD–VMFD. Results of FRAP assay showed that CPD–VMFD produced samples of higher or not significantly different antioxidant activity from samples dried exclusively with CD or VMD. The higher antioxidant activity of CPD–VMFD samples compared to CD at 40 °C (for FRAP assay) can be explained by the shortened drying time of the former. The presence of high moisture, oxygen, and heat during the lengthy drying process of CD 40 °C may have facilitated the degradation of antioxidant compounds by enzymes [23]. As for the higher antioxidant activity of CPD–VMFD samples compared with VMD at 9 and 12 W/g, the oxygen exposure during CPD–VMFD did not cause a large reduction in antioxidant activity. Several previous studies have indicated that phenolic content and antioxidant activity increase after heat treatment of peppermint leaves, Artemisia annua leaves [24], and culinary herbs, namely basil, rosemary, oregano, sage, thyme, and marjoram [25]. Wojdylo et al. suggested that polyphenols found in strawberry fruits that were exposed to oxygenated condition may have high antioxidant activity, although the increase is temporary [26].
Unexpectedly, the total phenolic content (TPC) values of fresh samples were lower than those of dried samples. The thermal treatment may have promoted an easier release of cell constituents from plant cells [27], as heat exerts modifications to plant tissue microstructure, thereby reducing cell integrity [28] and allowing for the easy exit of phenolic compounds from plant cells. Dried leaves have the tendency to exhibit increased bioactivity, as reported in past studies [29,30]. Moisture loss in leaves during drying, an abiotic stress, may have triggered the production and accumulation of phenolic compounds, thereby increasing the overall antioxidant activity [31]. Furthermore, the increase in antioxidant activity may have resulted from the Maillard reaction and the formation of Maillard reaction products (MRPs) with antioxidant power [26].
Although the TPC of samples dried with CPD–VMFD was high, antioxidant activity was relatively low. This finding implies that TPC of P. nodiflora did not correlate with the antioxidant activity. There are three major classes of chemical compounds in plants: phenolic metabolites, alkaloids, and terpenoids [32]. Phenolic compounds are the most researched and regarded as potent antioxidants; thus, the correlation between TPC and antioxidant activity has often been made. Terpenoids have also been established to exhibit strong antioxidant properties [33]. Therefore, in the case of P. nodiflora, it was assumed that terpenes and terpenoids present, which accounted for 36.5% of total volatiles, may have contributed to the overall antioxidant activity.
The overall antioxidant activity of P. nodiflora may be contributed by the major constituents in the extract and essential oil. For instance, 1-octen-3-ol, the major volatile compound (Table 3), β-sitosterol (Table 4) and α-linolenic acid, accounting for 48.3% of total fatty acids (Table 5), are among the antioxidants considered potent [34]. Terpenoids are known to exert antioxidant effect because of their ability to interact with free radicals. The presence of various terpenoids in the volatile fraction of P. nodiflora could also contribute to the antioxidant effect. With the presence of a wide variety of constituents in the extract of P. nodiflora, it can be assumed that the synergistic interactions between these molecules have effectively led to the observed antioxidant activities.
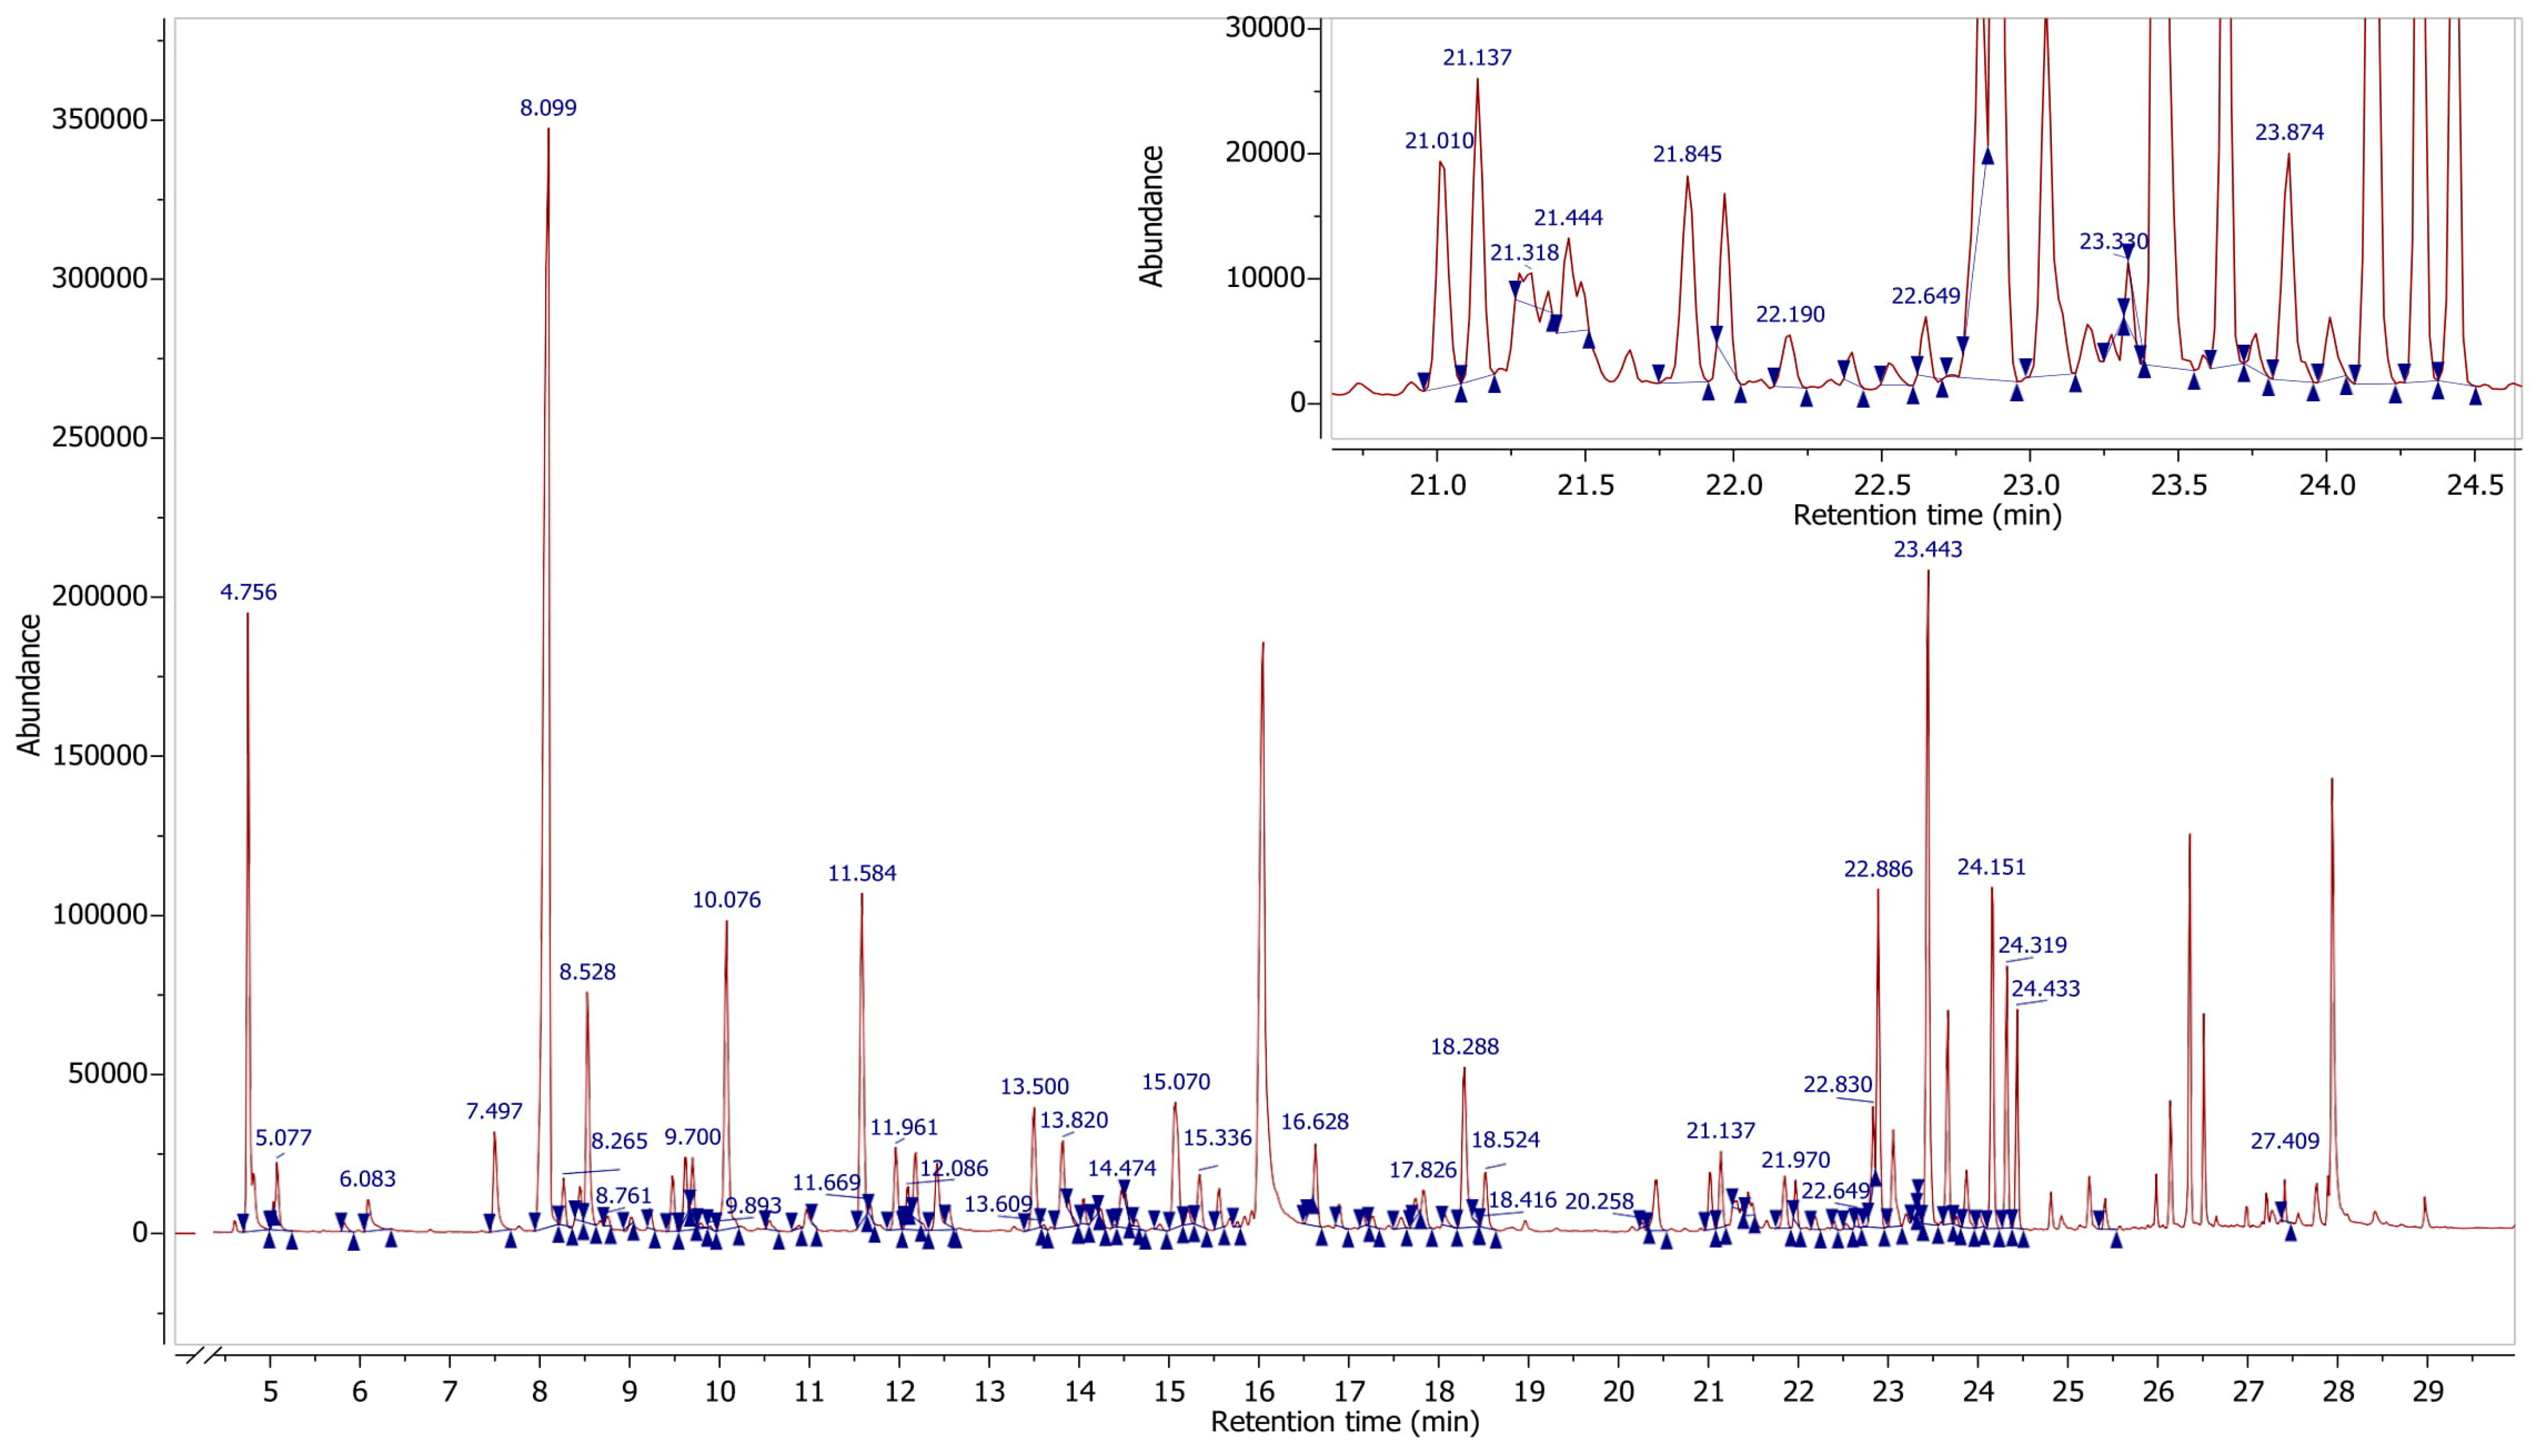
Eighty-three compounds were identified in P. nodiflora leaves, amounting to 176.81 mg 100 g−1 db of volatile compounds in fresh leaves (Table 3). Figure 6 shows a typical chromatogram of the volatile compounds identified. The major volatiles present in fresh P. nodilfora were 1-octen-3-ol (60.34 mg 100 g−1 db), 2-hexenal (20.42 mg 100 g−1 db), and α-amorphene (10.55 mg 100 g−1 db). The volatiles present in P. nodilfora can be are categorized under the following groups; alcohols (42.5%), sesquiterpenes (21.8%), aldehydes (16.2%), sesquiterpenoids (8.4%), monoterpenoids (3.2%), esters (3.0%), monoterpenes (2.5%) and diterpenoids (0.6%), thereby representing 98.2% of total volatiles. Other volatile compounds, phenylpropenes and ketones, were present in small concentrations.
Leaves dried using CPD–VMFD (179.02 mg 100 g−1 db) achieved higher retention of volatiles compared with fresh leaves (176.81 mg 100 g−1 db), but the differences in values were marginal (Table 3). Thermal treatment of leaves during CPD–VMFD may have inactivated polyphenol oxidase (PPO), thereby reducing enzymatic degradation of volatiles [27]. In addition, short thermal treatment, achieved by the introduction of VMFD assured that volatiles were not exposed to high temperature for an excessively long period.
Consistent with the literature, CD and VMD led to considerable losses of volatiles, evidenced by the drying of thyme [17], basil [13], and rosemary [35]. In this study, CD retained a higher amount of volatiles than did VMD. A similar result was reported in the drying of rosemary [35]. In another study, VMD was shown to retain higher total volatiles because of the fast drying process at a mild temperature [18]. However, in this study, average temperature throughout VMD, irrespective of microwave power, was 46 °C. Slightly higher temperatures of CD at 50 and 60 °C and CPD–VMFD at 50 °C were advantageous in forming a partially dried surface layer on leaves that function as a barrier, thereby limiting the diffusion of volatiles and minimizing their loss [36]. Furthermore, the formation of a crust layer is characteristic of products dried using CD. Parameters in CD and VMD also affect the total concentration of volatiles. A moderate temperature of 50 °C and microwave power of 9 W/g were preferable in yielding higher total volatiles. At these conditions, leaves were subjected to moderate temperature at a relatively short time. It was suggested that VMD led to higher amount of volatiles loss as microwave treatment causes a more porous structure in plant tissue because of the high internal vapor formed during the drying process. The higher porosity of tissue structure of vacuum microwave-dried leaves, compared to convective-dried leaves, could be a possible reason that a higher amount of volatiles could escape to the surrounding medium [37,38].

2.4. Analysis of Volatile Content

Analysis of volatile compounds of dried samples showed that CPD–VMFD and CD 50 °C yielded the highest volatile concentrations. Therefore, both methods were used to determine the influence on phytosterols concentration. Table 4 shows the identified phytosterols in P. nodiflora and their respective concentrations. The total concentrations of phytosterols in fresh leaves were 1237.39 mg 100 g−1 db. β-Sitosterol was the major phytosterol in fresh and dried samples, followed by stigmasterol and campesterol. CPD–VMFD was able to retain a higher total yield of phytosterols (711.07 mg 100 g−1 db) compared with CD 50 °C samples (668.66 mg 100 g−1 db). Due to the chemical structures of phytosterols, such as the unsaturation at the side chain or ring, these compounds may undergo oxidation when exposed to air and heat treatment at high temperatures. The oxidation process of phytosterols is reported to increased when phytosterols are subjected to heat and the stability of phytosterols is also influenced by the temperature and time of heat treatment [39]. In this study, microwave treatment during VMFD benefited the retainment of higher phytosterol content. Lower temperature and reduced oxygen condition during VMFD may have minimized the thermo-oxidation of phytosterols, thereby increasing the stability of phytosterols. This result is in agreement with the results obtained by Soupas et al. [40], Rudzińska, Przybylski, and Wąsowicz [41], which all reported that phytosterol concentration decreased with increased drying temperature and prolonged drying time.

2.5. Fatty Acid Analysis

Thermal drying has little effect on the concentration of fatty acids because it was reported that fatty acids remained stable even at a high temperature of 325 °C [43]. In another study, less than 1% of long-chain fatty acids were lost when subjected to thermal hydrolysis at 90 °C for 30 min [44]. Therefore, drying temperatures of CD, VMD, and CPD–VMFD, applied in this study, can be assumed to have no degradative effect on fatty acids. Profiles of the relative abundance of fatty acids identified in P. nodilfora leaves are presented in Table 5. The major fatty acid present was α-linolenic acid, followed by palmitic acid, with boiling points of 231 and 351.5 °C, respectively [45,46]. Therefore, this further proves that the temperatures applied in this study could not have affected the total concentrations of α-linolenic acid and palmitic acid. α-linolenic acid is a plant-derived omega-3 fatty acid and is an antioxidant, widely researched for its role in mediating cardiovascular disease [47].

2.6. Color Analysis

Color values of fresh and dried P. nodiflora leaves are shown in Table 6. Parameters investigated include lightness (L*), 0 (black) to 100 (white); greenness or redness (a*), −60 (green) to 60 (red); and blueness or yellowness (b*), −60 (blue) to 60 (yellow). Color changes in herbs subjected to drying are usually due to the loss of green pigments and carotenoids or enzymatic browning [48]. However, the shaping of the color profile of the dried product depends not only on the time and drying conditions but also on the amount of residual water, which can be estimated by the water activity values.
Fresh leaves recorded the highest L* value, whereas VMD at 12 W/g resulted in the darkest colored leaves with lowest L* value, but these values were not significantly different from those of VMD 6 and 9 W/g and CD 40 °C. These conditions promote PPO activity, which results in browning characteristics of dried products [49,50]. An increase in microwave power, from 6 to 12 W/g, associated with increased maximal temperature of dried material from 52 to 57 °C, decreased the L* value from 45.62 to 43.94. At higher microwave powers, increased amounts of absorbed energy used to vaporize water were observed, which may have been sufficiently large to increase the sample temperatures further during the falling rate period, thereby producing darker leaves [38]. This finding was evidenced in a previous study, in which burnt spots were observed on mint leaves after VMD [38].
The loss in green color was assumed to be related to the loss of chlorophyll [48], as indicated by an increase in a* values (Table 6) which is thought to be associated with decreased aw (Table 7). This relationship was confirmed for CD and VMD samples because the decrease in aw from 0.2252 to 0.1081 and from 0.2780 to 0.2353 resulted in increased a* values from −6.35 to −5.21 and from −5.96 to −5.86, respectively. The lowest values of a* were −6.35 and −7.02, which were found for CD 40 °C and CPD–VMFD samples, respectively. In the case of CD 40 °C, the processing temperature was the lowest, whereas combined drying CPD–VMFD underwent at a relatively short time and moderate conditions in terms of temperature and microwave power, thereby leading to lower extents of chlorophyll degradation.
Carotenoids, which tend to have yellowish color, were far better preserved in VMD 6 W/g, as indicated by a higher b* value. High vacuum conditions and lower temperatures of VMD compared with CD methods guaranteed improved preservation of carotenoids. In the presence of oxygen, the susceptibility of carotenoids to oxidation is high [51]; therefore, we can assume that higher oxidation occurred during CD. However, shortening drying time of CD by applying vacuum microwaves increased the value of b* coordinate, thereby indicating the effectiveness of CPD–VMFD in preserving natural colorants.

2.7. Water Activity Analysis

Water activity (aw) measures the extent of water removal and the amount of residual moisture of dried products [10]. To eliminate the possibility of microbial growth and unfavorable enzymatic activities, dried products should have low aw, ranging from 0.60 to 0.80. Spoilage bacteria are inhibited below aw of 0.91 and most types of mold are inhibited at aw of 0.80 [51]. However, for dried leaves or tea products, the suggested aw should be below 0.267 [52]. The lowest aw recorded was for convective-dried (CD) samples at 60 °C (Table 7). Leaves dried at CD 50 and 60 °C and CPD–VMFD have significantly lower aw, because drying temperatures coupled with extended drying durations of CD ensured minimal residual moisture in leaves. Increasing the hot-air temperature during CD corresponded to lower aw, because the temperature difference between the leaf material and surrounding heated air increased, which resulted in greater heat and moisture transfer. Thus, higher evaporation of water occurs, leaving material with a lower amount of moisture. The low aw values obtained for all drying methods suggest that samples were microbiologically stable, and that a limited amount of residual water was present for undesirable chemical reactions to occur.

3. Materials and Methods

3.1. Chemicals and Reagents

2,2′-Azinobis (3-ethylbenzthiazoline-6-sulfonic acid (ABTS)), potassium persulfate, 6-hydroxy-2,5,7,8-tetramethylchroman-2-carboxylic acid (Trolox), ferric reducing/antioxidant power (FRAP) reagent, acetate buffer, acetic acid, 2,4,6-tripyridyl-1,3,5-triazine (TPTZ), Folin–Ciocalteu reagent, sodium carbonate, gallic acid, p-methoxyphenol, chloroform, potassium hydroxide, hexane, sodium chloride, methanol, hydrochloric acid, boron trifluoride-methanol solution (BF3/MeOH), magnesium sulfate, pyradine, and N,O-Bis(trimethylsilyl)trifluoroacetamide (BSTFA)) were purchased from Sigma-Aldrich (Steinheim, Germany).

3.2. Plant Material Preparation

Fresh leaves of P. nodiflora were purchased from TKC Nursery (Negeri Sembilan) and identified at the Forest Research Institute Malaysia with voucher number (049/17). Leaves were cleaned and vacuum-oven dried at 60 °C for 24 h to obtain the initial moisture content as determined by Equation (1).
Initial   moisture   content =   Initial   weight dry   matter   weight dry   matter   weight

3.3. Drying Methods

Drying was conducted in the Institute of Agriculture Engineering (Wroclaw, Poland). Leaves were dried in 40 g portions using three methods, namely CD, VMD, and CPD–VMFD. Drying was ended when the mass loss of consecutive samples was 0.05 g or less. For VMD and CPD–VMFD, the sample temperature was measured with an infrared thermometer (Flir i50, Portland, OR, USA) after removing from the dryer, thereby providing an indication of the maximal temperature.

3.3.1. Convective Drying (CD)

Leaves were dried at 40, 50, and 60 °C in a convective hot-air oven designed and constructed in the Institute of Agriculture Engineering (Wroclaw, Poland). Leaves were spread on a wire mesh tray and placed on top of drying chambers with an air velocity of 1.8 ms−1.

3.3.2. Vacuum-Microwave Drying (VMD)

Leaves were dried in a vacuum-microwave dryer (Plazmatronika, Wroclaw, Poland) at microwave powers of 6, 9, and 12 W/g. Leaves were placed in an organic glass container, connected to a vacuum system that was rotated at a speed of 6 rpm. The pressure in the vacuum drum was varied from 4 to 6 kPa. An electric fan at the bottom of the dryer provided an air stream velocity and temperature of 1 ms−1 and 22 °C, respectively, to prevent local overheating of leaves.

3.3.3. Two-Stage Drying—Convective Pre-Drying Followed by Vacuum-Microwave Finish Drying (CPD–VMFD)

CPD of leaves was conducted with the same procedures as CD at 50 °C for 90 min to achieve a moisture content of 0.537 kg water kg−1dw. Pre-dried leaves were finish dried in a vacuum-microwave dryer (Plazmatronika, Wroclaw, Poland) at 9 W/g, with similar operating conditions to those for VMD. Intermediate hot-air temperature at 50 °C and microwave wattage at 9 W/g were used in CPD–VMFD, as both parameter levels ensured the highest concentration of volatile compounds in the dried product (Table 3).

3.4. Modelling of Drying Kinetics

Drying kinetics were determined based on the mass losses of leaves throughout the drying process. Drying curves were plotted as functions of moisture ratio against time. Moisture ratios M R were determined from Equation (2):
M R =   M ( t )   M e M 0 M e
where M ( t ) indicates moisture content after drying time t, M 0 denotes initial moisture content and M e denotes equilibrium moisture content, determined at the final stage of the drying process as an asymptotic value of the function fitted to the experimental points using Table Curve 2D Windows v2.03 (Jandel Scientific Software, San Rafael, CA, USA). To select the most suitable model, three commonly used thin layer models, namely Lewis (Equation (3)), modified Page (Equation (4)), and Henderson and Pabis (Equation (5)) were examined.
M R = exp ( k · t )
M R = a · exp ( k · t n )
M R = a · exp ( k · t )
where MR is moisture ratio, a is model constant, k denotes drying constant, and n represents the dimensionless empirical constant.

3.5. Determination of Energy Consumption

3.5.1. Energy Consumption of CD

Energy consumed during CD, E C (kilojoules) was determined as follows [53]:
E C = ( N f 6 + N h ) × t
where N f (kilowatts) is the power consumption of the fan supplying air to the six pipes, fixed with an electric heater of power consumption N h (kilowatts), whereas t is the time of drying (seconds).

3.5.2. Energy Consumption of VMD

Energy consumed during VMD, E V M (kilojoules) was determined as follows [53]:
E V M = ( N M η M + N V + N e ) × t
where N M is the output power of magnetrons (kilowatts), η M is the efficiency of magnetrons, N V is the power consumption of vacuum pump (kilowatts), N e is the power consumption of electric engine rotating the container (kilowatts), and t is drying time (seconds).

3.5.3. Specific Energy Consumption of CD, VMD, and CPD–VMFD

Specific energy consumption is calculated to determine the energy consumption per unit mass of fresh weight and energy consumption per unit mass of water. The specific energy consumption expressed in kJ/g fresh weight of sample can be useful in prediction of energy expenditure for drying of specified plant material. On the other hand, specific energy consumption expressed in kJ/g water contained in sample enables comparison of energy consumption for different plant materials with different moisture content.
Specific energy consumptions of CD, E C m ( k J   g 1   f w ) , and E C W ( k J   g 1   water ) were calculated based on Equations (8) and (9) [53], and the specific energy consumptions of VMD, E V M m   ( k J   g 1   f w ) and E V M W ( k J   g 1   water ) , Equations (10) and (11) [53], were calculated as (1) ratio of energy consumption to the initial sample mass, m (grams); and (2) ratio of energy consumption to the mass of water W (grams) removed from the sample.
E C m = E C m
E C W = E C W
E V M m = E V M m
E V M W = E V M W
Specific energy consumptions for CPD–VMFD, E C V M m   ( k J   g 1   f w ) and E C V M W ( k J   g 1   water ) , are as shown in Equations (12) and (13), respectively [53]. Both equations are the ratios of the sum of energy E C and E V M to the mass of initial sample, m (grams) and total mass of water (grams) from CPD, W C and VMFD, W V M removed from the sample, respectively.
E C V M m =   E C + E V M m
E C V M W =   E C + E V M W C + W V M

3.6. Extraction of Polyphenol Compounds

Ground samples (0.3 g) were measured into tubes. Then, 80% aqueous methanol (0.7 mL) was added with 1% HCl and stirred gently. Tubes with suspension were sonicated twice for 15 min and left at 4 °C for 24 h. The extract was centrifuged for 10 min at 15,000 rpm (MPW-360R, Warsaw, Poland) and supernatants were collected.

3.7. Antioxidant Activity Analysis

3.7.1. ABTS●+ Radical-Scavenging Assay

ABTS assay was conducted as previously described by Re at al. [54]. ABTS was dissolved in water to form a concentration of 7 mM. ABTS stock solution was mixed with 2.45 mM potassium persulfate to obtain ABTS radical cation (ABTS●+). This mixture was left to stand for 12–16 h in the dark at room temperature. The solution was diluted with distilled water to obtain an absorbance of 0.700 ± 0.02 at 734 nm. Diluted radical solution (3 mL) was mixed with 20 µL of the extracted supernatant. Absorbance was determined using a UV-vis spectrophotometer (Shimadzu, UV-2401 PC, Kyoto, Japan) at 734 nm after 6 min. Results were expressed as micromolar Trolox per 100 grams of dry weight (dw).

3.7.2. FRAP Assay

FRAP assay was performed as described previously by Benzie and Strain [55]. FRAP reagent was prepared by mixing acetate buffer (300 µM, pH 3.6), solution of 10 µM TPTZ in 40 µM HCl and 20 µM of FeCl3 (Sigma-Aldrich, Steinheim, Germany) at a ratio of 10:1:1 (v/v/v). The FRAP reagent (300 µL) and sample solution (10 µL) were mixed thoroughly. Absorbance was read at 593 nm using a UV-vis spectrophotometer (Shimadzu, UV-2401 PC, Kyoto, Japan) after 10 min. A standard curve was constructed using different concentrations of Trolox.

3.8. Analysis of Total Phenolic Content

Total phenolic content was determined using the Folin–Ciocalteu method, previously described by Gao, Ohlander, Jeppsson, Björk, and Trajkovski [56]. Leaf extract (0.1 mL) was mixed with 2 mL of water and 0.2 mL of Folin–Ciocalteu reagent. The mixture was incubated at room temperature for 3 min and added with 1 mL of 20% sodium carbonate. Absorbance was measured using a UV-vis spectrophotometer (Shimadzu, UV-2401 PC, Kyoto, Japan) at 765 nm after 1 h of incubation at room temperature. Quantification was determined based on a gallic acid standard curve. Results were expressed as gallic acid equivalence (in milligrams per 100 grams of dw).

3.9. Analysis of Volatile Compounds

Analysis of volatile compounds was conducted using headspace solid phase microextraction (HS-SPME). Approximately 0.25 g of crushed dried and fresh leaf samples were placed in vials with the internal standard; p-methoxyphenol (2 µg). Vials were covered with PTFE/silicon septum and placed in a water bath at 60 °C for equilibration (10 min). SPME fiber (Supelco, Bellefonte, PA, USA) with a vivinylbenzene/carboxen/polydimethylsiloxane (DVB/CAR/PDMS, 50/30 μm, coating 2 cm) (Supelco) was used. Prior to extraction, SPME fiber was conditioned by inserting into a GC injection port for 1 h at 220 °C. For each extraction, SPME fiber was inserted into a vial that contained a sample kept in a water bath at 60 °C for 30 min. Next, the fiber was drawn into a needle and injected into the injection port of a GC-MS at an injection temperature of 220 °C for 3 min. The GC-MS analysis was performed on a Varian CP-3800/Saturn 2000 (Varian, Wallnut Creek, CA, USA) equipped with a capillary column, ZB-5MS (30 m × 0.25 mm i.d × 0.25 μm film thickness) (Phenomenex, Shim-Pol, Poland).
Our gradient temperature program was as follows. The initial oven temperature was 50 °C, which was increased to 130 °C at a rate of 4 °C min−1. Then, the temperature was raised to 180 °C at 10 °C min−1 and finally raised up to 280 °C at a rate of 2 °C min−1. Samples were injected in split mode (1:10), and helium gas was used as the carrier gas at a flow rate of 1.0 mL min−1. Mass spectra were obtained in EI ionisation mode at 70 eV within a scan range of 35–550 m/z. After each extraction, SPME fiber was prepared for the subsequent extractions by placing in the injection port of GC-MS for 15 min at 220 °C, to ensure complete elution of volatiles. Identification of all volatile constituents was based on a comparison of experimentally obtained compound mass spectra with mass spectra available in NIST14 database. Furthermore, the experimentally obtained retention index (RI) by Kovats was compared with RI available in the NIST WebBook and literature data [42].

3.10. Extraction of Lipids

Lipids were extracted using a previous method by Folch, Lees, and Stanley [57]. Lipids from ground leaves were extracted using 2:1 chloroform–methanol (v/v) for 24 h and filtered thereafter. The resultant filtrate was subjected to vacuum rotary evaporator at 65 °C to remove extraction solvent. Crude lipids obtained were weighed and later saponified (10 min at 80°C) with 10 mL of 0.5 M KOH/MeOH, boiled with reflux for 5–10 min and left to cool at 12 °C. The sample was placed in a separation funnel; hexane (10 mL) and water (10 mL) were added sequentially twice and mixed vigorously. To facilitate phase separation, 5 mL of saturated NaCl solution was added, and the mixture was mixed vigorously and left for phase separation. After separation, the bottom layer (fatty acids) was separated and removed from the top layer (sterols).

3.11. GC-MS Analysis of Phytosterols

Phytosterol portion was dried with MgSO4 and evaporated using a vacuum rotary evaporator to remove the extraction solvent. The resultant residue was added with 0.2 mL of pyridine and 0.2 mL of BSTFA (silylation agent) in a capped tube. Cholesterol (1.0 mg, Sigma-Aldrich, Steinheim, Germany) was added as the internal standard. The reaction was heated at 60 °C for 45 min in an incubator orbital shaker at 110 rpm. Once derivatization was completed, the mixture was transferred to small capped tubes and subjected to GC-MS analysis. Scanning was performed at an EI of 70 eV, at a mass range of 50–400 m/z, and with a 5-scan s−1 mode. The carrier gas used was helium with a flow rate of 1.0 mL min−1 at a split ratio of 1:10. The temperature gradient programs used was as follow: (a) 45 °C for 3 min, (b) 45 °C to 220 °C at a rate of 5 °C min−1, and (c) 220 °C to 250 °C at a rate of 10 °C min−1 and, lastly, maintained at 250 °C for 2 min. The injector was held at a temperature of 260 °C. Identification of plant sterols was based on the comparison of experimentally obtained mass spectra with ones available in literature and with relative retention times of standards. The concentrations of identified phytosterols were obtained by comparing the peak area of each compound to the peak area of the internal standard, cholesterol, with a concentration of 1 mg/mL.

3.12. GC-MS Analysis of Fatty Acids

The fatty acid portion was acidified with 1 M HCl and extracted with 10 mL of hexane. The organic portion was separated and subjected to a vacuum rotary evaporator to remove the extraction solvent. Next, the sample was subjected to methylation (10 min, 80 °C) by adding 4 mL of 14% BF3/MeOH (v/v). Fatty acid methyl esters (FAMEs) that were formed were extracted using 2.5 mL of hexane, dried with MgSO4, and filtered using a cotton plug and silicate power into a small container. The FAME profile was analyzed using GC-MS (GCMS-QP 2020, Shimadzu, Kyoto, Japan). Separation was conducted using the Zebron ZB-WAX capillary column (30 m × 0.25 mm i.d. × 0.25 μm film thickness) (Phenomenex, Torrance, CA, USA). GC-MS analysis was conducted as follows: Scanning was performed from 50–400 m/z in electronic impact (EI) at 70 eV, in the 5-scan s−1 mode. Helium was used as the carrier gas with a flow rate of 1.0 mL min−1 and a split ratio of 1:10. The temperature gradient program used was (a) 45 °C for 3 min; (b) 45–220 °C with a rate of 5 °C min−1; (c) 220–250 °C at a rate of 10 °C min−1 and kept at 250 °C for 2 min. An injector was held at 260 °C.

3.13. Color Analysis

The colors of fresh and dried powdered P. nodiflora leaves were determined with Minolta a Chroma Meter CR-200 (Minolta Co. Ltd., Osaka, Japan). Color data were expressed as CIE L*, a*, b* coordinates. Color measurements were measured five times to obtain a mean value per sample.

3.14. Water Activity Analysis

The water activity of fresh and dried leaves was determined with a water-activity meter (Aqualab 4TE, Pullman, WA, USA). Fresh and ground leaves were placed and spread up to three-fourths of the sample cup which was inserted into the measuring chamber. Measurement of water activity was carried out at an average temperature of 24.9 ± 0.05 °C.

3.15. Statistical Analysis

Results are presented as mean ± standard deviation. One-way analysis of variance (ANOVA) was conducted using SPSS 20 (IBM, Tulsa, OK, USA). Significant differences between means were evaluated using Tukey’s test at a significance level of p ≤ 0.05. Mathematical modelling of the drying kinetics of CD, VMD, and CPD–VMFD methods was achieved with Table Curve 2D Windows v2.03 (Jandel Scientific Software, San Jose, CA, USA). R2 RMSE were used to evaluate the goodness of fit of models (Equations (3)–(5)) to experimental data. All determinations were performed in triplicate.

4. Conclusions

The drying kinetics of P. nodiflora leaves were best described by the modified Page model. VMD achieved the shortest drying time, whereas CD was the most time-consuming method. However, the application of VMFD, in CPD–VMFD reduced drying time of CD considerably. The application of CPD–VMFD is also justified by the lower specific energy consumption compared with conventional CD. CPD–VMFD reduced the final specific energy consumptions by 80.2% and 51.1% (kJ/g water) compared with CD 50 °C. Moreover, CPD was effective in reducing water content by approximately 92.4%, from the initial moisture content of 7.032 to 0.537 kg water kg−1 dw of samples. Based on the antioxidant-activity results, VMD at 6 W/g showed the highest antioxidant activity, consistent for both ABTS and FRAP analyses. β-Sitosterol was the major fatty acid that may have contributed to the antioxidant activity of P. nodiflora. Water-activity results showed that all methods produced samples that were microbiologically and shelf stable. Color analysis revealed that CPD–VMFD was superior in preserving the color of P. nodiflora. CPD–VMFD is a promising drying method based on the results of TPC, volatile, and phytosterol analysis.

Author Contributions

L.Y.W.C., B.L.C., C.H.C. and A.F. designed the experiment. L.Y.W.C., A.F., A.S., A.W. and J.Ł. performed the experiments. L.Y.W.C. (supported by B.L.C., A.F. and C.H.C.) wrote the manuscript.

Funding

The authors would like to acknowledge Taylor’s University Lakeside for providing financial support under Taylor’s Research Grant Schemes (TRGS/MFS/1/2017/SOE/008) and The Polish Ministry of Science and Higher Education “Strategy of Excellence—University of Research” Project (0019/SDU/2018/18).

Conflicts of Interest

The authors declare no conflict of interest.

References

  1. Halliwell, B.; Aeschbach, R.; Löliger, J.; Aruoma, O.I. The characterization of antioxidants. Food Chem. Toxicol. 1995, 33, 601–617. [Google Scholar] [CrossRef]
  2. Flora, G.; Mittal, M.; Flora, S.J.S. Medical countermeasures-chelation therapy. In Handbook of Arsenic Toxicology; Flora, S.J.S., Ed.; Academic Press: London, UK, 2015; pp. 589–626. [Google Scholar]
  3. Angerhofer, C.K.; Maes, D.; Giacomoni, P.U. The Use of natural compounds and botanicals in the development of anti-aging skin care products. In Skin Aging Handbook; Dayan, N., Ed.; William Andrew: New York, NY, USA, 2009; pp. 205–263. [Google Scholar]
  4. Sharma, R.A.; Singh, R. A review on Phyla nodiflora Linn.: A wild wetland medicinal herb. Int. J. Pharm. Sci. Rev. Res. 2013, 20, 57–63. [Google Scholar]
  5. Salve, S.D.; Bhuktar, A.S. Pharmacognostic study of Phyla nodiflora Linn. Int. Res. J. Pharm. 2012, 3, 255–260. [Google Scholar]
  6. Ashokkumar, D.; Thamilselvan, V.; Senthilkumar, G.P.; Mazumder, U.K.; Gupta, M. Antioxidant and free radical scavenging effects of Lippia nodiflora. Pharm. Biol. 2008, 46, 762–771. [Google Scholar] [CrossRef]
  7. Sudha, A.; Srinivasan, P. Bioassay-guided isolation and antioxidant evaluation of flavonoid compound from aerial parts of Lippia nodiflora L. BioMed Res. Int. 2014, 2014, 549836. [Google Scholar] [CrossRef]
  8. Chan, J.W.R.; Chong, C.H.; Ng, D.K.S. Process synthesis and design for extraction of bioactive compounds from Strobilanthes crispus. J. Eng. Sci. Technol. 2015, 113–137. [Google Scholar]
  9. Sarker, S.D.; Latif, Z.; Gray, A.I. Natural product isolation. In Natural Products Isolation, 2nd ed.; Sarker, S.D., Satya, D., Eds.; Humana Press: Totowa, NJ, USA, 2005; pp. 1–25. [Google Scholar]
  10. Chen, X.D.; Mujumdar, A.S. Drying Technologies in Food Processing; Blackwell Publihing: Oxford, UK, 2008; pp. 1–52. [Google Scholar]
  11. Wray, D.; Ramaswamy, H.S. Novel concepts in microwave drying of foods. Dry. Technol. 2015, 33, 769–783. [Google Scholar] [CrossRef]
  12. Wojdyło, A.; Figiel, A.; Lech, K.; Nowicka, P.; Oszmiański, J. Effect of convective and vacuum-microwave drying on the bioactive compounds, color, and antioxidant capacity of sour cherries. Food Bioprocess Technol. 2014, 7, 829–841. [Google Scholar] [CrossRef]
  13. Calín-Sánchez, Á.; Lech, K.; Szumny, A.; Figiel, A.; Carbonell-Barrachina, Á.A. Volatile composition of sweet basil essential oil (Ocimum basilicum L.) as affected by drying method. Food Res. Int. 2012, 48, 217–225. [Google Scholar] [CrossRef]
  14. Figiel, A. Drying kinetics and quality of beetroots dehydrated by combination of convective and vacuum-microwave methods. J. Food Eng. 2010, 98, 461–470. [Google Scholar] [CrossRef]
  15. Drouzas, A.E.; Schubert, H. Microwave application in vacuum drying of fruits. J. Food Eng. 1996, 28, 203–209. [Google Scholar] [CrossRef]
  16. Hu, Q.G.; Zhang, M.; Mujumdar, A.S.; Xiao, G.N.; Sun, J.-C. Drying of edamames by hot air and vacuum microwave combination. J. Food Eng. 2006, 77, 977–982. [Google Scholar] [CrossRef]
  17. Calín-Sánchez, Á.; Figiel, A.; Lech, K.; Szumny, A.; Carbonell-Barrachina, Á.A. Effects of drying methods on the composition of thyme (Thymus vulgaris L.) essential oil. Dry. Technol. 2013, 31, 224–235. [Google Scholar] [CrossRef]
  18. Figiel, A.; Szumny, A.; Gutiérrez-Ortíz, A.; Carbonell-Barrachina, Á.A. Composition of oregano essential oil (Origanum vulgare) as affected by drying method. J. Food Eng. 2010, 98, 240–247. [Google Scholar] [CrossRef]
  19. Chua, K.J.; Chou, S.K. Recent advances in hybrid drying technologies. In Emerging Technologies for Food Processing, 2nd ed.; Sun, D.W., Ed.; Academic Press: London, UK, 2014; pp. 447–457. [Google Scholar]
  20. Scaman, C.H.; Durance, T.D. Combined microwave vacuuum-drying. In Emerging Technologies for Food Processing, 2nd ed.; Sun, D.W., Ed.; Academic Press: London, UK, 2014; pp. 507–533. [Google Scholar]
  21. Calín-Sanchez, Á.; Figiel, A.; Szarycz, M.; Lech, K.; Nuncio-Jáuregui, N.; Carbonell-Barrachina, Á.A. Drying kinetics and energy consumption in the dehydration of pomegranate (Punica granatum L.) arils and rind. Food Bioprocess Technol. 2014, 7, 2071–2083. [Google Scholar] [CrossRef]
  22. Soysal, Y.; Öztekin, S.; Eren, Ö. Microwave rrying of parsley: Modelling, kinetics, and energy aspects. Biosyst. Eng. 2006, 93, 403–413. [Google Scholar] [CrossRef]
  23. Chong, K.L.; Lim, Y.Y. Effects of drying on the antioxidant properties of herbal tea from selected vitex species. J. Food Qual. 2012, 35, 51–59. [Google Scholar] [CrossRef]
  24. Yi, W.; Wetzstein, H.Y. Effects of drying and extraction conditions on the biochemical activity of selected herbs. HortScience 2011, 46, 70–73. [Google Scholar] [CrossRef]
  25. Hossain, M.B.; Barry-Ryan, C.; Martin-Diana, A.B.; Brunton, N.P. Effect of drying method on the antioxidant capacity of six Lamiaceae herbs. Food Chem. 2010, 123, 85–91. [Google Scholar] [CrossRef]
  26. Wojdyło, A.; Figiel, A.; Oszmiański, J. Effect of drying methods with the application of vacuum microwaves on the bioactive compounds, color, and antioxidant activity of strawberry fruits. J. Agric. Food Chem. 2009, 57, 1337–1343. [Google Scholar] [CrossRef]
  27. Yahia, E.M. The contribution of fruit and vegetable consumption to human health. In Fruit and Vegetable Phytochemicals; John Wiley & Sons: Hoboken, NJ, USA, 2009; pp. 3–51. [Google Scholar]
  28. Gonzalez, M.E.; Barrett, D.M. Thermal, high pressure, and electric field processing effects on plant cell membrane integrity and relevance to fruit and vegetable quality. J. Food Sci. 2010, 75, 121–130. [Google Scholar] [CrossRef]
  29. Abdullah, S.; Shaari, A.R.; Azimi, A. Effect of drying methods on metabolites composition of misai kucing (Orthosiphon stamineus) leaves. APCBEE Procedia 2012, 2, 178–182. [Google Scholar] [CrossRef]
  30. Rabeta, M.S.; Lai, S.Y. Effects of drying, fermented and unfermented tea of Ocimum tenuiflorum linn. on the antioxidant capacity. Int. Food Res. J. 2013, 20, 1601–1608. [Google Scholar]
  31. Dixon, R.A.; Harrison, M.J.; Paiva, N.L. The isoflavonoid phytoalexin pathway: From enzymes to genes to transcription factors. Physiol. Plant. 1995, 93, 385–392. [Google Scholar] [CrossRef] [Green Version]
  32. Walton, N.J.; Brown, D.E.; Harborne, J.B. Classes and functions of secondary products from plants. In Chemicals from Plants; Alvarez, M.A., Ed.; Imperial College Press: London, UK, 2011; pp. 1–25. [Google Scholar]
  33. Ludwiczuk, A.; Skalicka-Woźniak, K.; Georgiev, M.I. Terpenoids. In Pharmacognosy: Fundamentals, Applications and Strategy; Badal, S., Delgoda, R., Eds.; Academic Press: London, UK, 2016; pp. 233–265. [Google Scholar]
  34. Lee, K.G.; Shibamoto, T. Antioxidant properties of aroma compounds isolated from soybeans and mung beans. J. Agric. Food Chem. 2000, 48, 4290–4293. [Google Scholar] [CrossRef]
  35. Szumny, A.; Figiel, A.; Gutiérrez-Ortíz, A.; Carbonell-Barrachina, Á.A. Composition of rosemary essential oil (Rosmarinus officinalis) as affected by drying method. J. Food Eng. 2010, 97, 253–260. [Google Scholar] [CrossRef]
  36. Buchaillot, A.; Caffin, N.; Bhandari, B. Drying of lemon myrtle (Backhousia citriodora) leaves: Retention of volatiles and color. Dry. Technol. 2009, 27, 445–450. [Google Scholar] [CrossRef]
  37. Dong, W.; Cheng, K.; Hu, R.; Chu, Z.; Zhao, J.; Long, Y. Effect of microwave vacuum drying on the drying characteristics, color, microstructure, and antioxidant activity of green coffee beans. Molecules 2018, 23, 1146. [Google Scholar] [CrossRef]
  38. Therdthai, N.; Zhou, W. Characterization of microwave vacuum drying and hot air drying of mint leaves (Mentha cordifolia Opiz ex Fresen). J. Food Eng. 2009, 91, 482–489. [Google Scholar] [CrossRef]
  39. Lampi, A.M.; Juntunen, L.; Toivo, J.; Piironen, V. Determination of thermo-oxidation products of plant sterols. J. Chromatogr. B Anal. Technol. Biomed. Life Sci. 2002, 777, 83–92. [Google Scholar] [CrossRef]
  40. Soupas, L.; Juntunen, L.; Lampi, A.M.; Piironen, V. Effects of sterol structure, temperature, and lipid medium on phytosterol oxidation. J. Agric. Food Chem. 2004, 52, 6485–6491. [Google Scholar] [CrossRef]
  41. Rudzińska, M.; Przybylski, R.; Wąsowicz, E. Products formed during thermo-oxidative degradation of phytosterols. JAOCS J. Am. Oil Chem. Soc. 2009, 86, 651–662. [Google Scholar] [CrossRef]
  42. Adams, R.P. Identification of Essential Oil Components by Gas Chromatography/Mass Spectrometry; Allured publishing Corporation: Carol Stream, IL, USA, 2007; pp. 1–804. [Google Scholar]
  43. Shin, H.Y.; Lim, S.M.; Bae, S.Y.; Oh, S.C. Thermal decomposition and stability of fatty acid methyl esters in supercritical methanol. J. Anal. Appl. Pyrolysis 2011, 92, 332–338. [Google Scholar] [CrossRef]
  44. Charuwat, P.; Boardman, G.; Bott, C.; Novak, J.T. Thermal degradation of long chain fatty acids. Water Environ. Res. 2018, 90, 278–287. [Google Scholar] [CrossRef]
  45. National Center for Biotechnology Information. Available online: https://pubchem.ncbi.nlm.nih.gov/compound/985 (accessed on 3 September 2018).
  46. National Center for Biotechnology Information. Available online: https://pubchem.ncbi.nlm.nih.gov/compound/5280934 (accessed on 3 September 2018).
  47. Bourourou, M.; Duncan, M.W.; Lipsky, R.H.; Gorelick, P.B.; Marini, A.M.; Blondeau, N. Alpha-linolenic acid: An omega-3 fatty acid with neuroprotective properties—Ready for use in the stroke clinic? BioMed Res. Int. 2015, 2015, 519830. [Google Scholar]
  48. Sledz, M.; Witrowa-Rajchert, D. Influence of microwave-convective drying of chlorophyll content and color of herbs. Acta Agrophys. 2012, 19, 865–876. [Google Scholar]
  49. Fratianni, A.; Niro, S.; Alam, M.D.R.; Cinquanta, L.; Di Matteo, M.; Adiletta, G.; Panfili, G. Effect of a physical pre-treatment and drying on carotenoids of goji berries (Lycium barbarum L.). LWT Food Sci. Technol. 2018, 92, 318–323. [Google Scholar] [CrossRef]
  50. Boon, C.S.; McClements, D.J.; Weiss, J.; Decker, E.A. Factors influencing the chemical stability of carotenoids in foods. Crit. Rev. Food Sci. Nutr. 2010, 50, 515–532. [Google Scholar] [CrossRef]
  51. Samoticha, J.; Wojdyło, A.; Lech, K. The influence of different the drying methods on chemical composition and antioxidant activity in chokeberries. LWT Food Sci. Technol. 2016, 66, 484–489. [Google Scholar] [CrossRef]
  52. Schmidt, S.J.; Fontana, A.J. Appendix E: Water activity values of select food ingredients and products. In Water Activity in Foods: Fundamentals and Applications; Barbosa-Canovas, G.V., Fontana, A.J., Schmidt, S.J., Labuza, T.P., Eds.; Blackwell Publishings: Ames, IA, USA, 2008; pp. 407–420. [Google Scholar]
  53. Calín-Sánchez, Á.; Figiel, A.; Wojdyło, A.; Szarycz, M.; Carbonell-Barrachina, Á.A. Drying of garlic slices using convective pre-drying and vacuum-microwave finishing drying: Kinetics, energy consumption, and quality studies. Food Bioprocess Technol. 2014, 7, 398–408. [Google Scholar] [CrossRef]
  54. Re, R.; Pellegrini, N.; Proteggente, A.; Pannala, A.; Yang, M.; Rice-Evans, C. Antioxidant activity applying an improved ABTS radical cation decolorization assay. Free Rad. Biol. Med. 1999, 26, 1231–1237. [Google Scholar] [CrossRef]
  55. Benzie, I.F.F.; Strain, J.J. The ferric reducing ability of plasma (FRAP) as a measure of “antioxidant power”: The FRAP assay. Anal. Biochem. 1996, 239, 70–76. [Google Scholar] [CrossRef]
  56. Gao, X.; Ohlander, M.; Jeppsson, N.; Björk, L.; Trajkovski, V. Changes in antioxidant effects and their relationship to phytonutrients in fruits of sea buckthorn (Hippophae rhamnoides L.) during maturation. J. Agric. Food Chem. 2000, 48, 1485–1490. [Google Scholar] [CrossRef]
  57. Folch, J.; Lees, M.; Stanley, G.H.S. A simple method for the isolation and purification of total lipids from animal animal tissues. J. Biol. Chem. 1957, 226, 497–509. [Google Scholar]
Figure 1. (a) Drying kinetics of Phyla nodiflora leaves dried using convective drying (CD) method at 40, 50, and 60 °C and vacuum microwave finish drying (VMFD) at 9 W/g preceded by convective predrying (CPD) at 50 °C. (b) Drying kinetics of P. nodiflora leaves dried using vacuum microwave drying (VMD) at 6, 9, and 12 W/g.
Processes 07 00210 g001
Figure 2. Drying rate for P. nodiflora leaves dehydrated using CD method at 40, 50, and 60 °C, VMD at 6, 9, and 12 W/g, and VMFD at 9 W/g preceded by CPD at 50 °C.
Processes 07 00210 g002
Figure 3. Profile of specific energy consumption for drying a gram of P. nodiflora leaves, dried using CD, VMD, and CPD–VMFD methods.
Processes 07 00210 g003
Figure 4. Profile of specific energy consumption related to the gram of water evaporated from sample of P. nodiflora leaves, dried using CD, VMD, and CPD–VMFD methods.
Processes 07 00210 g004
Figure 5. Final specific energy consumptions of CD, VMD, and CPD–VMFD of P. nodiflora leaves.
Processes 07 00210 g005
Figure 6. A typical gas chromatography—mass spectrometry (GC-MS) chromatogram of fresh P. nodiflora.
Processes 07 00210 g006
Table 1. Statistical parameters, total drying duration, and mathematical model constants describing the drying kinetics of P. nodiflora leaves.
Drying ConditionModelaknR2RMSEDrying Time (min)
CD 40 °CLewis0.01380.99890.0113360
Page (modified)0.99370.01261.02090.99890.0117
Henderson–Pabis1.00000.01380.99890.0117
CD 50 °CLewis0.02460.99620.0216240
Page (modified)0.99430.01511.12930.99890.0124
Henderson–Pabis1.02840.02540.99720.0193
CD 60 °CLewis0.02870.97780.0493180
Page (modified)1.03240.03710.93760.97880.0521
Henderson–Pabis1.01680.02930.97820.0507
VMD 6 W/gLewis0.18600.97940.053421
Page (modified)0.99830.07661.47020.99960.0086
Henderson–Pabis1.04020.19190.98130.0549
VMD 9 W/gLewis0.18600.97940.053421
Page (modified)0.99830.07661.47020.99960.0086
Henderson–Pabis1.04020.19190.98130.0549
VMD 12 W/gLewis0.27690.98010.052314
Page (modified)0.99860.14031.45820.99960.0091
Henderson–Pabis0.99860.14030.99960.0091
CPD–VMFD 50 °C, 9 W/gLewis0.07540.98110.0521105
Page (modified)0.07330.76810.50110.99970.0007
Henderson–Pabis0.07250.37340.97820.0049
a—model constant; k—drying constant; n—dimensionless empirical constant; CD—convective drying; VMD—vacuum microwave drying; CPD—convective pre-drying; VMFD—vacuum microwave finish drying; R2—coefficient of determination; RMSE—root mean square error.
Table 2. Effects of drying methods on the antioxidant activity and total phenolic content of P. nodiflora leaves.
Drying MethodAntioxidant Activity (µM Trolox/100 g dw)Total Phenolic Content (mg/100 g dw)
ABTSFRAP
Fresh 14.34 ± 0.93 b18.25 ± 0.54 b1484.46 ± 30.68 a
CD 40 °C7.60 ± 0.46 a,d8.26 ± 0.54 a,c1609.73 ± 69.24 a,c
CD 50 °C10.25 ± 0.77 c,d14.18 ± 1.69 e,f1762.20 ± 31.38 a,c
CD 60 °C10.54 ± 1.22 c14.17 ± 0.91 e,f1828.92 ± 110.18 c
VMD 6 W/g11.00 ± 0.19 c15.99 ± 1.53 b,f1661.54 ± 123.30 a,c
VMD 9 W/g9.28 ± 0.34 a,c,d10.21 ± 0.16 c,d1091.26 ± 136.04 b
VMD 12 W/g6.62 ± 0.63 a9.25 ± 1.31 c,d1473.23 ± 80.60 a
CPD–VMFD7.11 ± 2.15 a12.11 ± 0.50 d,e2352.93 ± 101.09 d
ABTS—2,2′-Azinobis (3-ethylbenzthiazoline-6-sulfonic acid); FRAP—ferric reducing antioxidant capacity; VMD—vacuum microwave drying; CPD—convective pre-drying; VMFD—vacuum microwave finish drying; mean values with different alphabets (a, b, c, d) within each column is significantly different (p < 0.05), according to Tukey’s test.
Table 3. Concentration of volatile compounds influenced by various drying methods and conditions.
CompoundRTRetention IndexesFreshCPD–VMFDCDVMD
40 °C50 °C60 °C6 W/g9 W/g12 W/g
Exp.Lit.Concentration (mg 100 g−1 db)
2-Hexenal4.75684385120.426.491.413.360.880.050.420.09
(E)-2-Hexen-1-ol5.0348588620.540.450.080.410.090.000.000.00
1-Hexanol5.0778618680.573.090.770.970.360.020.040.04
2-Heptanol5.8188999010.000.980.000.240.100.050.250.09
(E,E)-2,4-Hexadienal 6.0839099110.930.510.150.400.110.000.000.06
Benzaldehyde7.4979599621.382.240.560.830.700.200.870.56
1-Octen-3-ol8.09988388060.3479.0619.3021.8421.111.898.806.03
6-Methyl-5-hepten-2-one8.2659869861.152.350.830.790.400.070.580.30
3-Octanol8.4449929940.640.330.040.030.060.010.220.05
6-Methyl-5-hepten-2-ol8.5289979943.495.191.662.221.500.100.900.36
Octanal8.761100210030.230.230.030.050.020.110.350.05
(E,E)-2,4-Heptadienal9.012101110120.223.930.381.420.930.161.360.69
(E,E)-2,4-Heptadienol9.2231015-0.910.020.030.050.010.000.010.00
p-Cymene9.474102410250.360.270.420.120.010.040.150.11
Limonene9.610102910300.350.100.130.200.000.020.470.14
Eucalyptol9.700103110320.010.000.000.000.000.000.020.00
Benzyl alcohol9.893103510361.011.070.120.040.240.040.250.02
β-Ocimene9.893103810370.120.340.030.060.090.010.040.01
Benzeneacetaldehyde10.076104210452.961.700.510.550.630.371.390.72
γ-Terpinene10.563105910600.490.150.040.160.030.000.020.11
cis-Sabinene hydrate10.884106810700.040.030.000.030.000.000.000.03
cis-Linalool oxide11.065107210742.336.460.902.411.940.211.400.00
Fenchone11.584108810960.020.000.020.000.010.000.020.67
2-Nonanone11.669109110920.000.200.120.540.560.000.100.00
Linalool11.961110010990.230.060.120.130.100.020.080.01
Nonanal12.086110411040.860.400.040.330.230.080.370.05
β-Thujone12.184110711140.054.090.130.811.220.151.560.22
Phenylethyl Alcohol12.422111411162.894.050.390.821.070.180.440.74
3-Thujanone12.546111811192.862.750.860.140.370.080.860.23
Camphor13.500114511430.780.760.110.190.200.030.280.46
Hexyl isobutyrate13.609114811500.120.020.070.030.000.000.020.16
Menthone13.820115411540.460.090.000.360.320.040.020.00
trans-Pinocamphone13.900115611600.120.210.200.130.070.030.230.02
Isomenthone14.054116111640.000.020.180.010.000.000.000.03
p-Menthan-3-one14.166116511660.550.130.070.020.000.000.010.00
Borneol14.251116711670.330.030.010.020.000.000.040.06
1-Nonanol14.391117111731.021.010.070.280.230.030.390.04
Menthol14.474117311750.000.020.090.080.010.020.010.20
3-Pinanone, cis14.517117511730.000.000.010.020.010.000.000.01
Terpinen-4-ol14.639117811770.000.030.000.010.000.000.000.00
p-Cymen-8-ol14.903118611830.360.400.010.120.080.020.150.00
Hexanoic acid butyl ester15.070119111890.410.010.010.210.100.010.220.13
Methyl salicylate15.211119511922.291.150.500.491.140.050.040.00
Estragole15.336119911961.521.550.170.570.560.100.590.27
2-Octynoic acid-methyl ester15.558121012120.290.750.090.300.220.070.350.17
Acetic acid, octyl ester15.766122312100.161.150.100.320.290.040.410.22
Isogeraniol16.559123512400.000.010.000.000.010.000.000.01
Butanoic acid, 2-methyl-, hexyl ester16.628123812360.040.000.000.010.090.000.000.01
D-Carvone16.893124512460.530.310.140.280.160.060.370.04
Isopentyl hexanoate17.158125312520.000.000.000.010.000.000.000.00
Linalyl acetate17.271125712570.590.010.000.330.150.010.000.15
iso-3-Thujanol acetate 17.577126512670.480.610.020.200.160.010.240.14
neo-3-Thujanol acetate 17.7421271-0.050.000.040.000.000.000.030.00
Benzeneacetaldehyde, α-ethylidene-17.826127312790.340.210.100.000.010.020.120.03
neo-iso-3-Thujanol acetate 18.2881280-0.090.010.010.010.010.000.000.00
Anethole18.300128712860.220.000.130.060.030.010.100.04
2-Undecanone18.524129312940.220.400.230.440.320.110.270.10
α-Cubebene20.258135713512.202.020.320.390.560.130.800.38
Propanoic acid21.010137813800.290.820.070.170.060.210.640.14
Copaene21.137138313765.374.260.500.701.410.341.870.74
β-Bourbonene21.318139013841.877.820.630.480.220.521.350.59
β-Cubebene21.444139113895.154.110.370.871.040.031.340.96
cis-α-Bergamotene21.845140914150.480.180.020.090.040.110.220.09
Caryophyllene21.970141714192.641.450.250.260.470.030.580.30
β-Duprezianene22.190142714231.830.220.060.120.010.410.130.65
β-Gerjunene22.3991437-0.190.140.010.020.030.000.030.03
Isogermacrene D22.523144414480.080.000.000.000.000.000.000.01
Neoclovene22.649145014540.170.000.000.120.030.000.030.01
Alloaromadendrene22.830145714612.590.930.090.140.070.130.600.12
Sesquisabinene22.886146214643.931.300.190.170.120.190.940.33
9-epi-Caryophyllene23.054147014673.032.360.360.400.620.150.940.32
γ-Muurolene23.275148014770.110.060.010.000.020.000.010.01
γ-Curcumene23.330148314800.350.210.040.030.050.010.080.04
α-Amorphene23.4431489148210.550.970.520.740.900.482.001.39
γ-Amorphene23.665149814962.201.630.390.330.540.150.760.56
α-Muurolene23.762150514990.090.010.030.000.040.000.020.01
β-Bisabolene23.874151315090.210.020.010.050.020.000.070.08
δ-Cadinene24.011152215240.200.020.010.010.010.000.010.02
cis-Calamenene24.151153015315.535.710.991.011.710.281.700.92
α-Cadinene24.319154015382.110.730.130.110.210.080.310.20
α-Himachalene24.433155015491.010.130.030.030.030.040.130.07
Widdrol25.413161816100.050.080.000.010.010.010.030.03
Isopropyl myristate27.409182518270.280.310.070.120.080.330.610.25
TOTAL 176.81179.0244.4757.8353.3216.1548.0229.94
RT—retention time; Exp.—experimental; Lit.—retention indices according to NIST 14 database; CD—convective drying; VMD—vacuum microwave drying; CPD—convective pre-drying; VMFD—vacuum microwave finish drying.
Table 4. Phytosterols profile of P. nodiflora dried using different drying methods.
CompoundRetention Time (min)FreshCD 50 °CCPD–VMFD
Exp.Lit.Concentration (mg 100 g−1 db)
β-Sitosterol28.9928.98529.67268.88280.99
Stigmasterol28.0628.15323.47173.34191.72
Campesterol 27.5827.58205.81100.2499.65
Betulin31.1631.1730.6837.3039.17
Desmosterol 26.6426.6376.8935.5937.94
Cycloartenol30.0030.0528.1524.1522.43
Lanosterol26.8926.8840.5819.8820.31
α-tocopherol 25.9725.952.149.3018.86
Total--1237.39668.66711.07
Exp.—experimental; Lit.—Retention time according to Adams [42]; CD—convective drying; CPD—convective pre-drying; VMFD—vacuum microwave finish drying.
Table 5. Profile of fatty acid methyl esters of P. nodiflora.
CompoundTotal Area (%)
α-linolenic acid48.30
Palmitic acid21.99
Linolelaidic acid8.80
Oleic acid7.98
Stearic acid5.60
11-hexadecenoic acid, methyl ester, (11Z)-1.53
Myristic acid1.41
Behenic acid0.71
Erucic acid0.69
Arachidic acid0.68
Palmitoleic acid0.64
Elaidic acid0.43
Heptadecanoic acid0.26
cis-10-heptadecenoic acid0.25
Lauric acid0.22
Pentadecanoic acid0.22
Capric acid0.12
Linolelaidic acid0.09
Tridecanoic acid0.08
Table 6. Color parameters of P. nodiflora leaves measured after applications of different drying methods.
Drying ConditionsColor Parameters
L*a*b*
Fresh46.90 ± 0.09 c−6.33 ± 0.09 a18.52 ± 0.12 a
CD 40 °C45.23 ± 0.24 a,b,c−6.35 ± 0.07 a15.92 ± 0.09 b
CD 50 °C46.56 ± 0.13 c−5.5 ± 0.04 b,c16.05 ± 0.13 b
CD 60 °C46.05 ± 0.08 b,c−5.21 ± 0.03 c15.86 ± 0.06 b
VMD 6 W/g45.62 ± 0.16 a,b,c−5.96 ± 0.19 a,b17.17 ± 0.30 d
VMD 9 W/g44.54 ± 0.04 a,b−5.5 ± 0.04 b,c16.14 ± 0.05 b
VMD 12 W/g43.94 ± 0.22 a−5.86 ± 0.05 b16.31 ± 0.06 b,c
CPD–VMFD46.49 ± 0.16 c−7.02 ± 0.02 d16.77 ± 0.15 c,d
CD—convective drying; VMD—vacuum microwave drying; CPD—convective pre-drying; VMFD—vacuum microwave finish drying; mean values with different alphabets (a, b, c, d) within each column is significantly different (p < 0.05), according to Tukey’s test.
Table 7. Water activity of different drying methods.
Drying MethodWater Activity, aw
Fresh0.9879 ± 0.006 a
CD 40 °C0.2252 ± 0.003 b,d
CD 50 °C0.1485 ± 0.010 c
CD 60 °C0.1081 ± 0.010 c
VMD 6 W/g0.2780 ± 0.001 d
VMD 9 W/g0.1743 ± 0.044 b,c
VMD 12 W/g0.2353 ± 0.008 b,d
CPD–VMFD0.1339 ± 0.020 c
CD—convective drying; VMD—vacuum microwave drying; CPD—convective pre-drying; VMFD—vacuum microwave finish drying; mean values with different alphabets (a, b, c, d) within each column is significantly different (p < 0.05), according to Tukey’s test.

