Natural Deep Eutectic Solvent-Assisted Pectin Extraction from Pomelo Peel Using Sonoreactor: Experimental Optimization Approach

 ,
,  , ,
, ,
Abstract
:
1. Introduction
2. Materials and Methods
2.1. Materials
2.2. NADESs Preparation
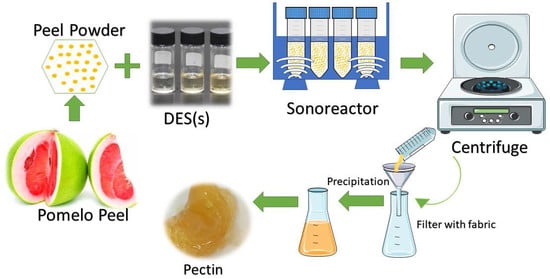
2.3. Pectin Extraction
2.3.1. Screening of the Potential NADESs and Their Individual Components
2.3.2. Optimization Using Definitive Screening Design (DSD)
2.4. Pectin Yield Determination
2.5. Degree of Esterification (DE%) Determination
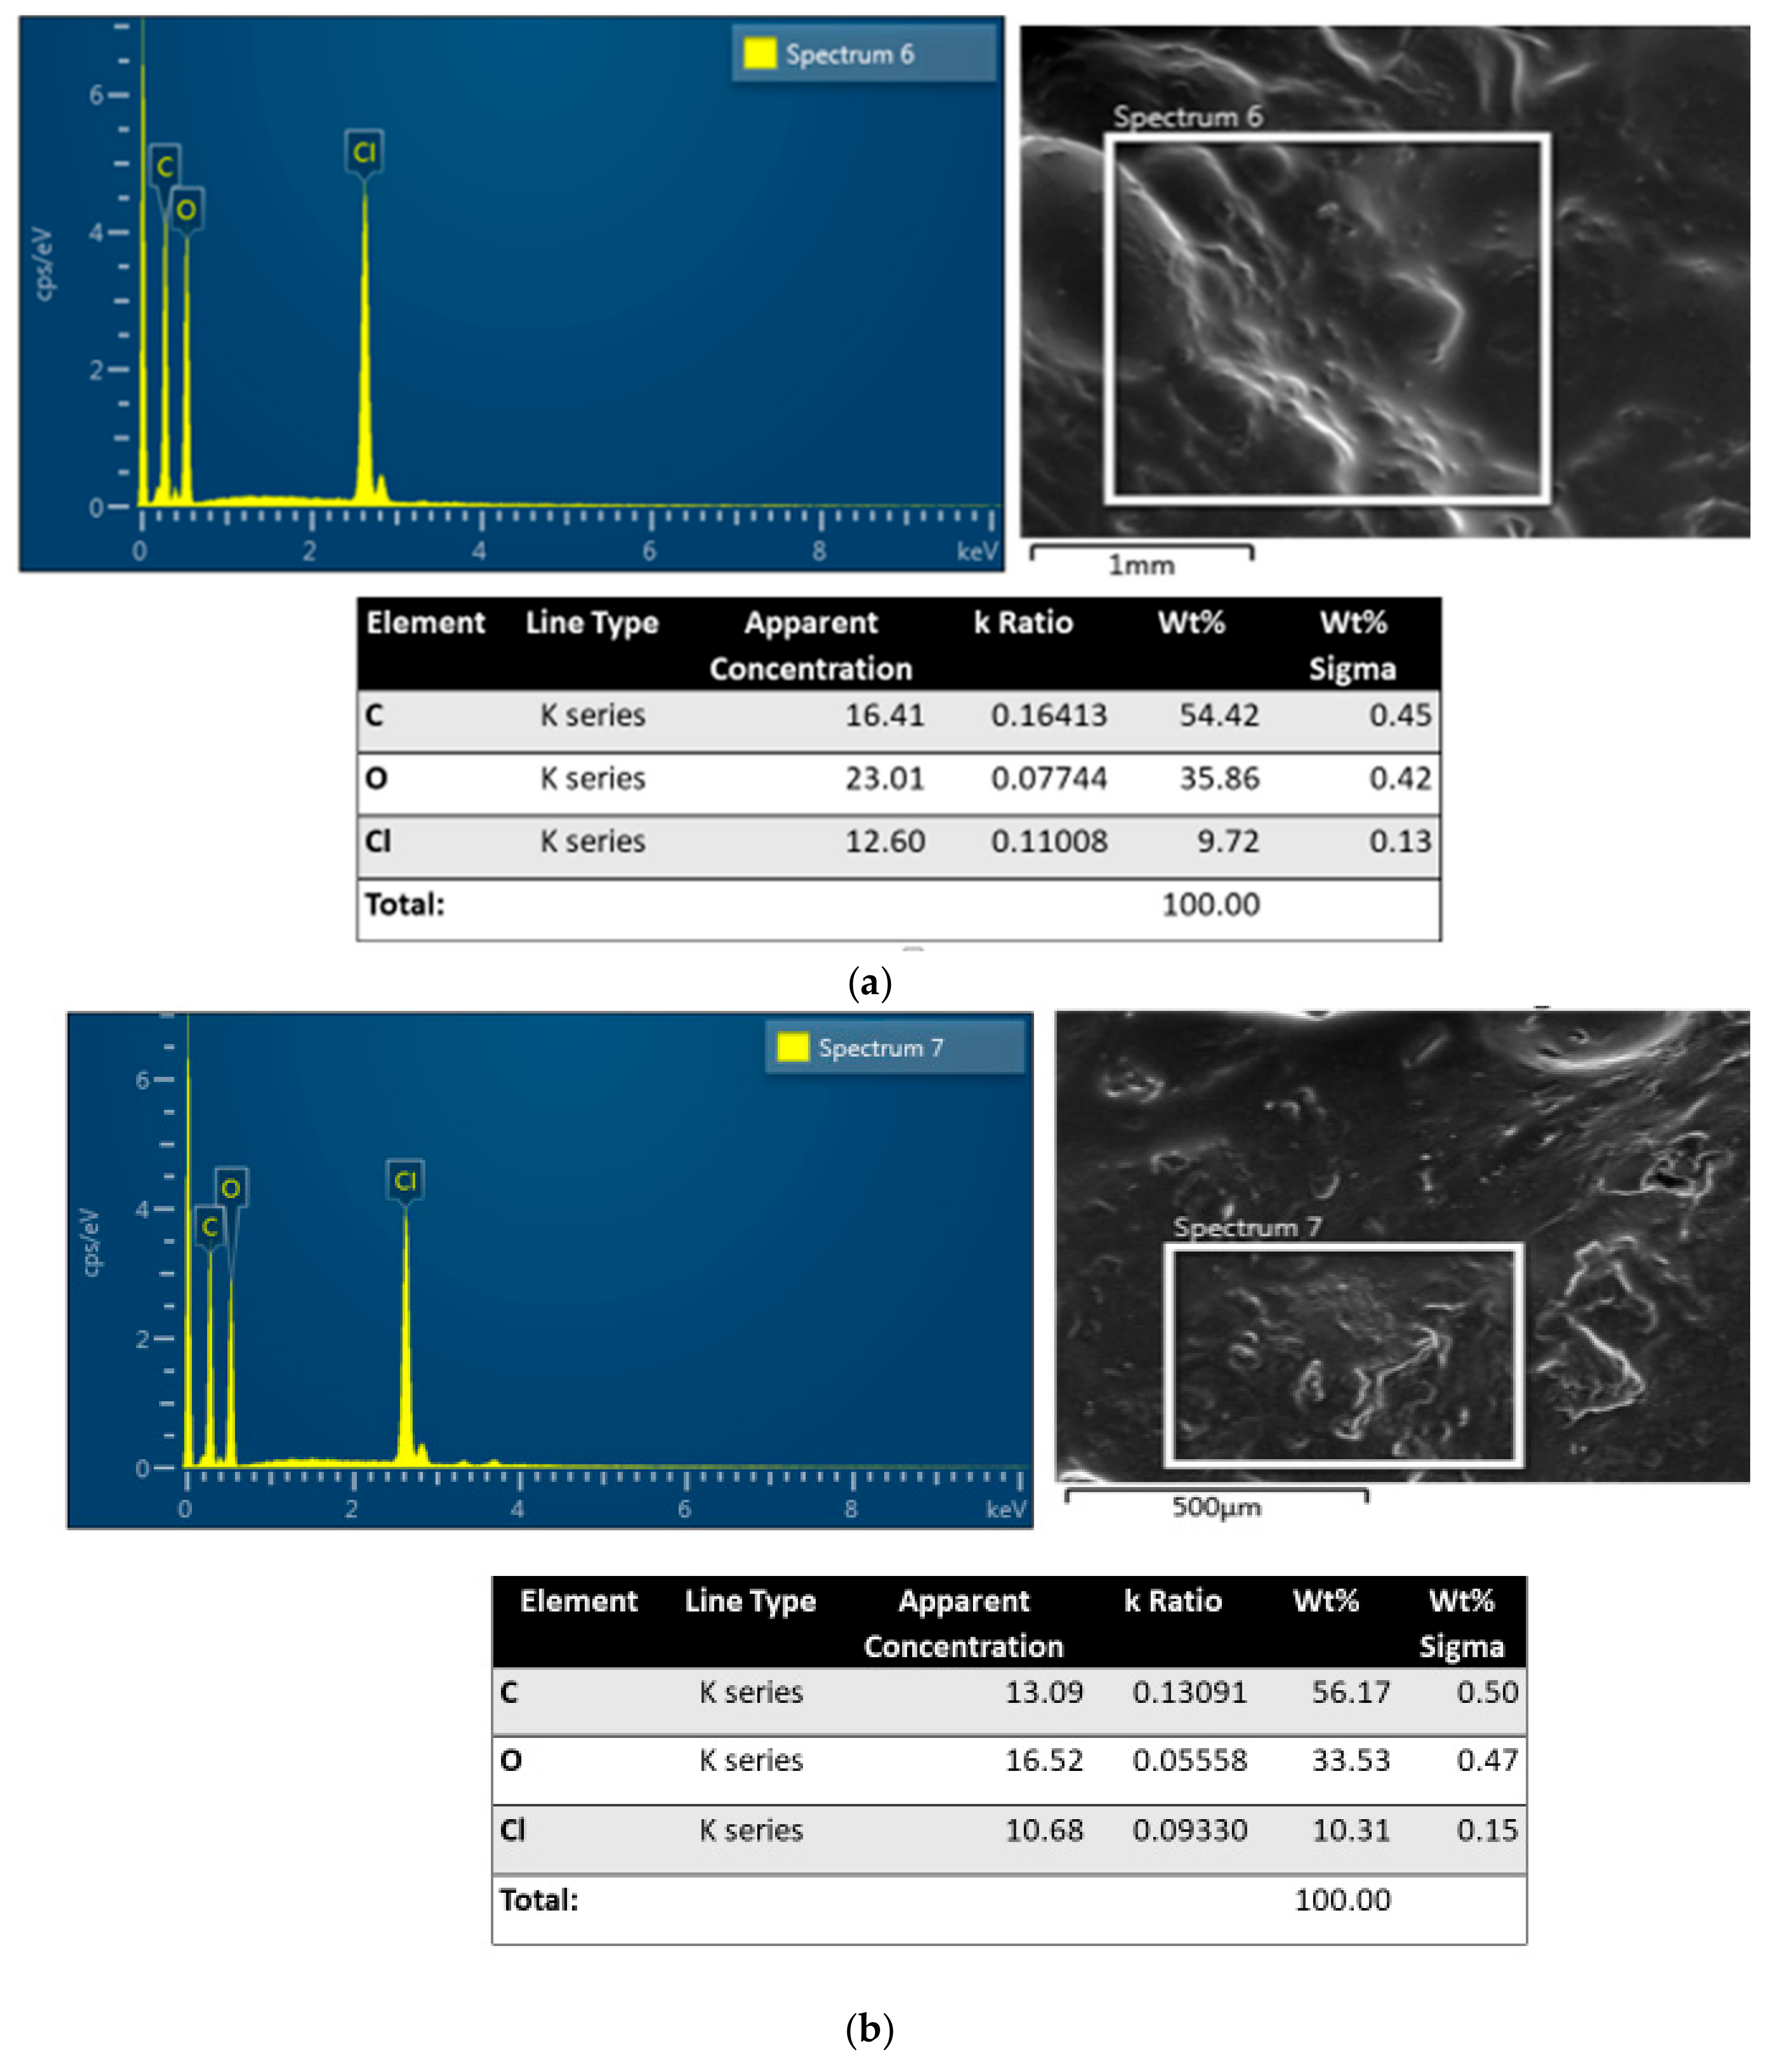
2.6. Analysis of Pectin Samples Using Field-Emission Scanning Electron Microscopy (FESEM)
3. Results and Discussion
3.1. Screening of the Potential NADESs and the Former Components
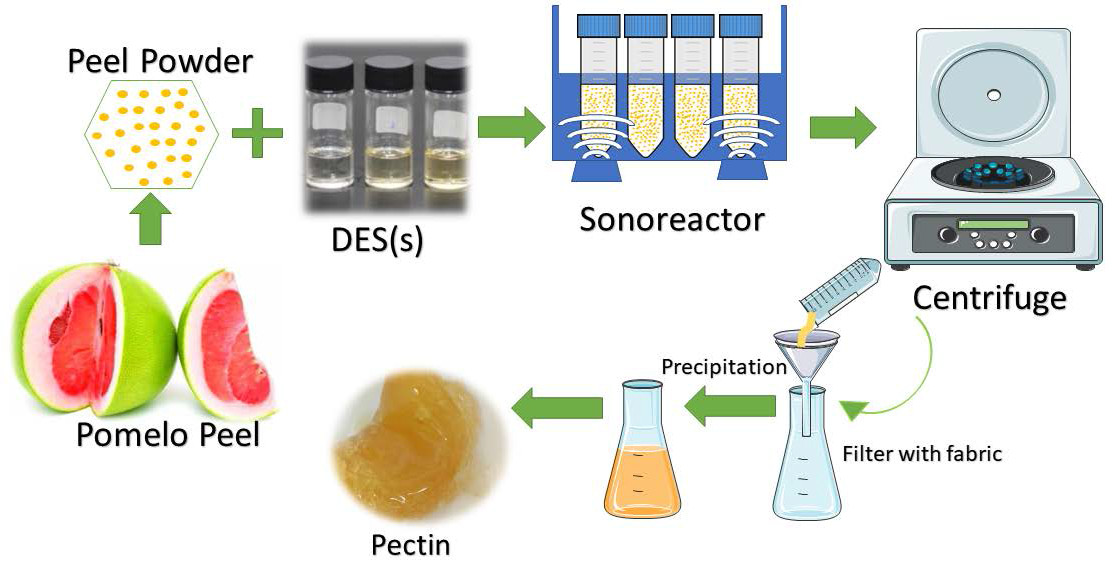
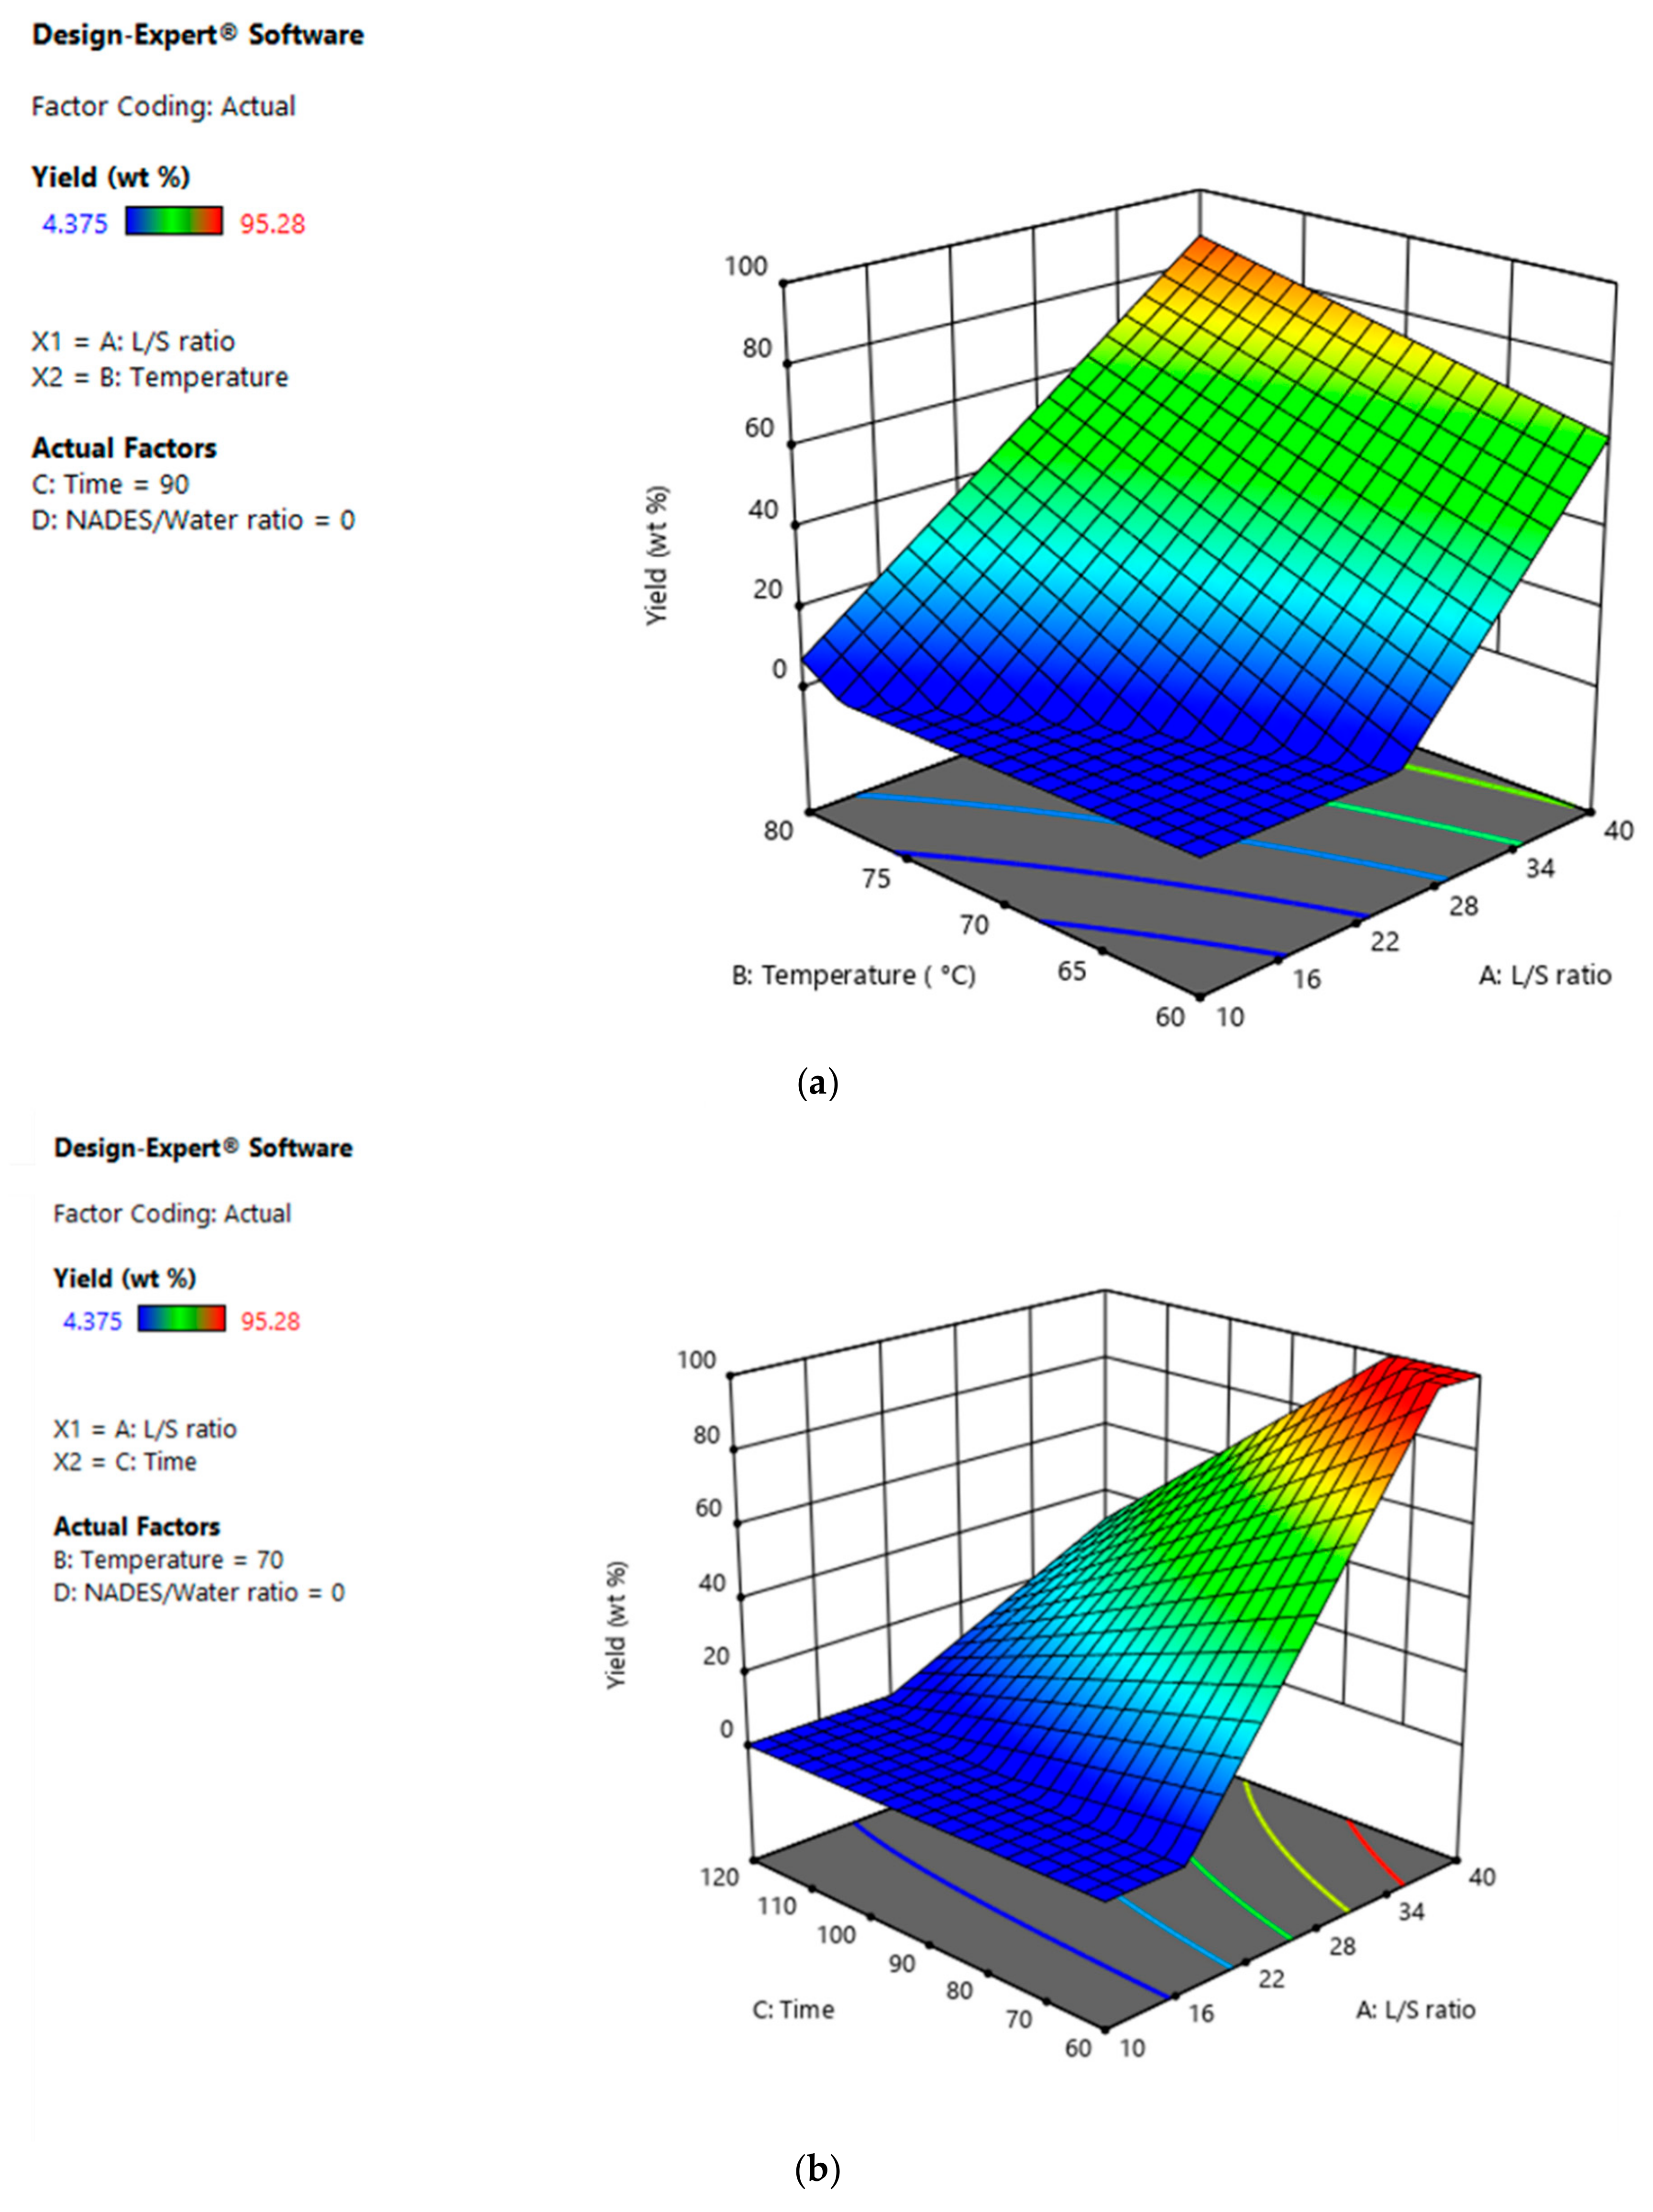
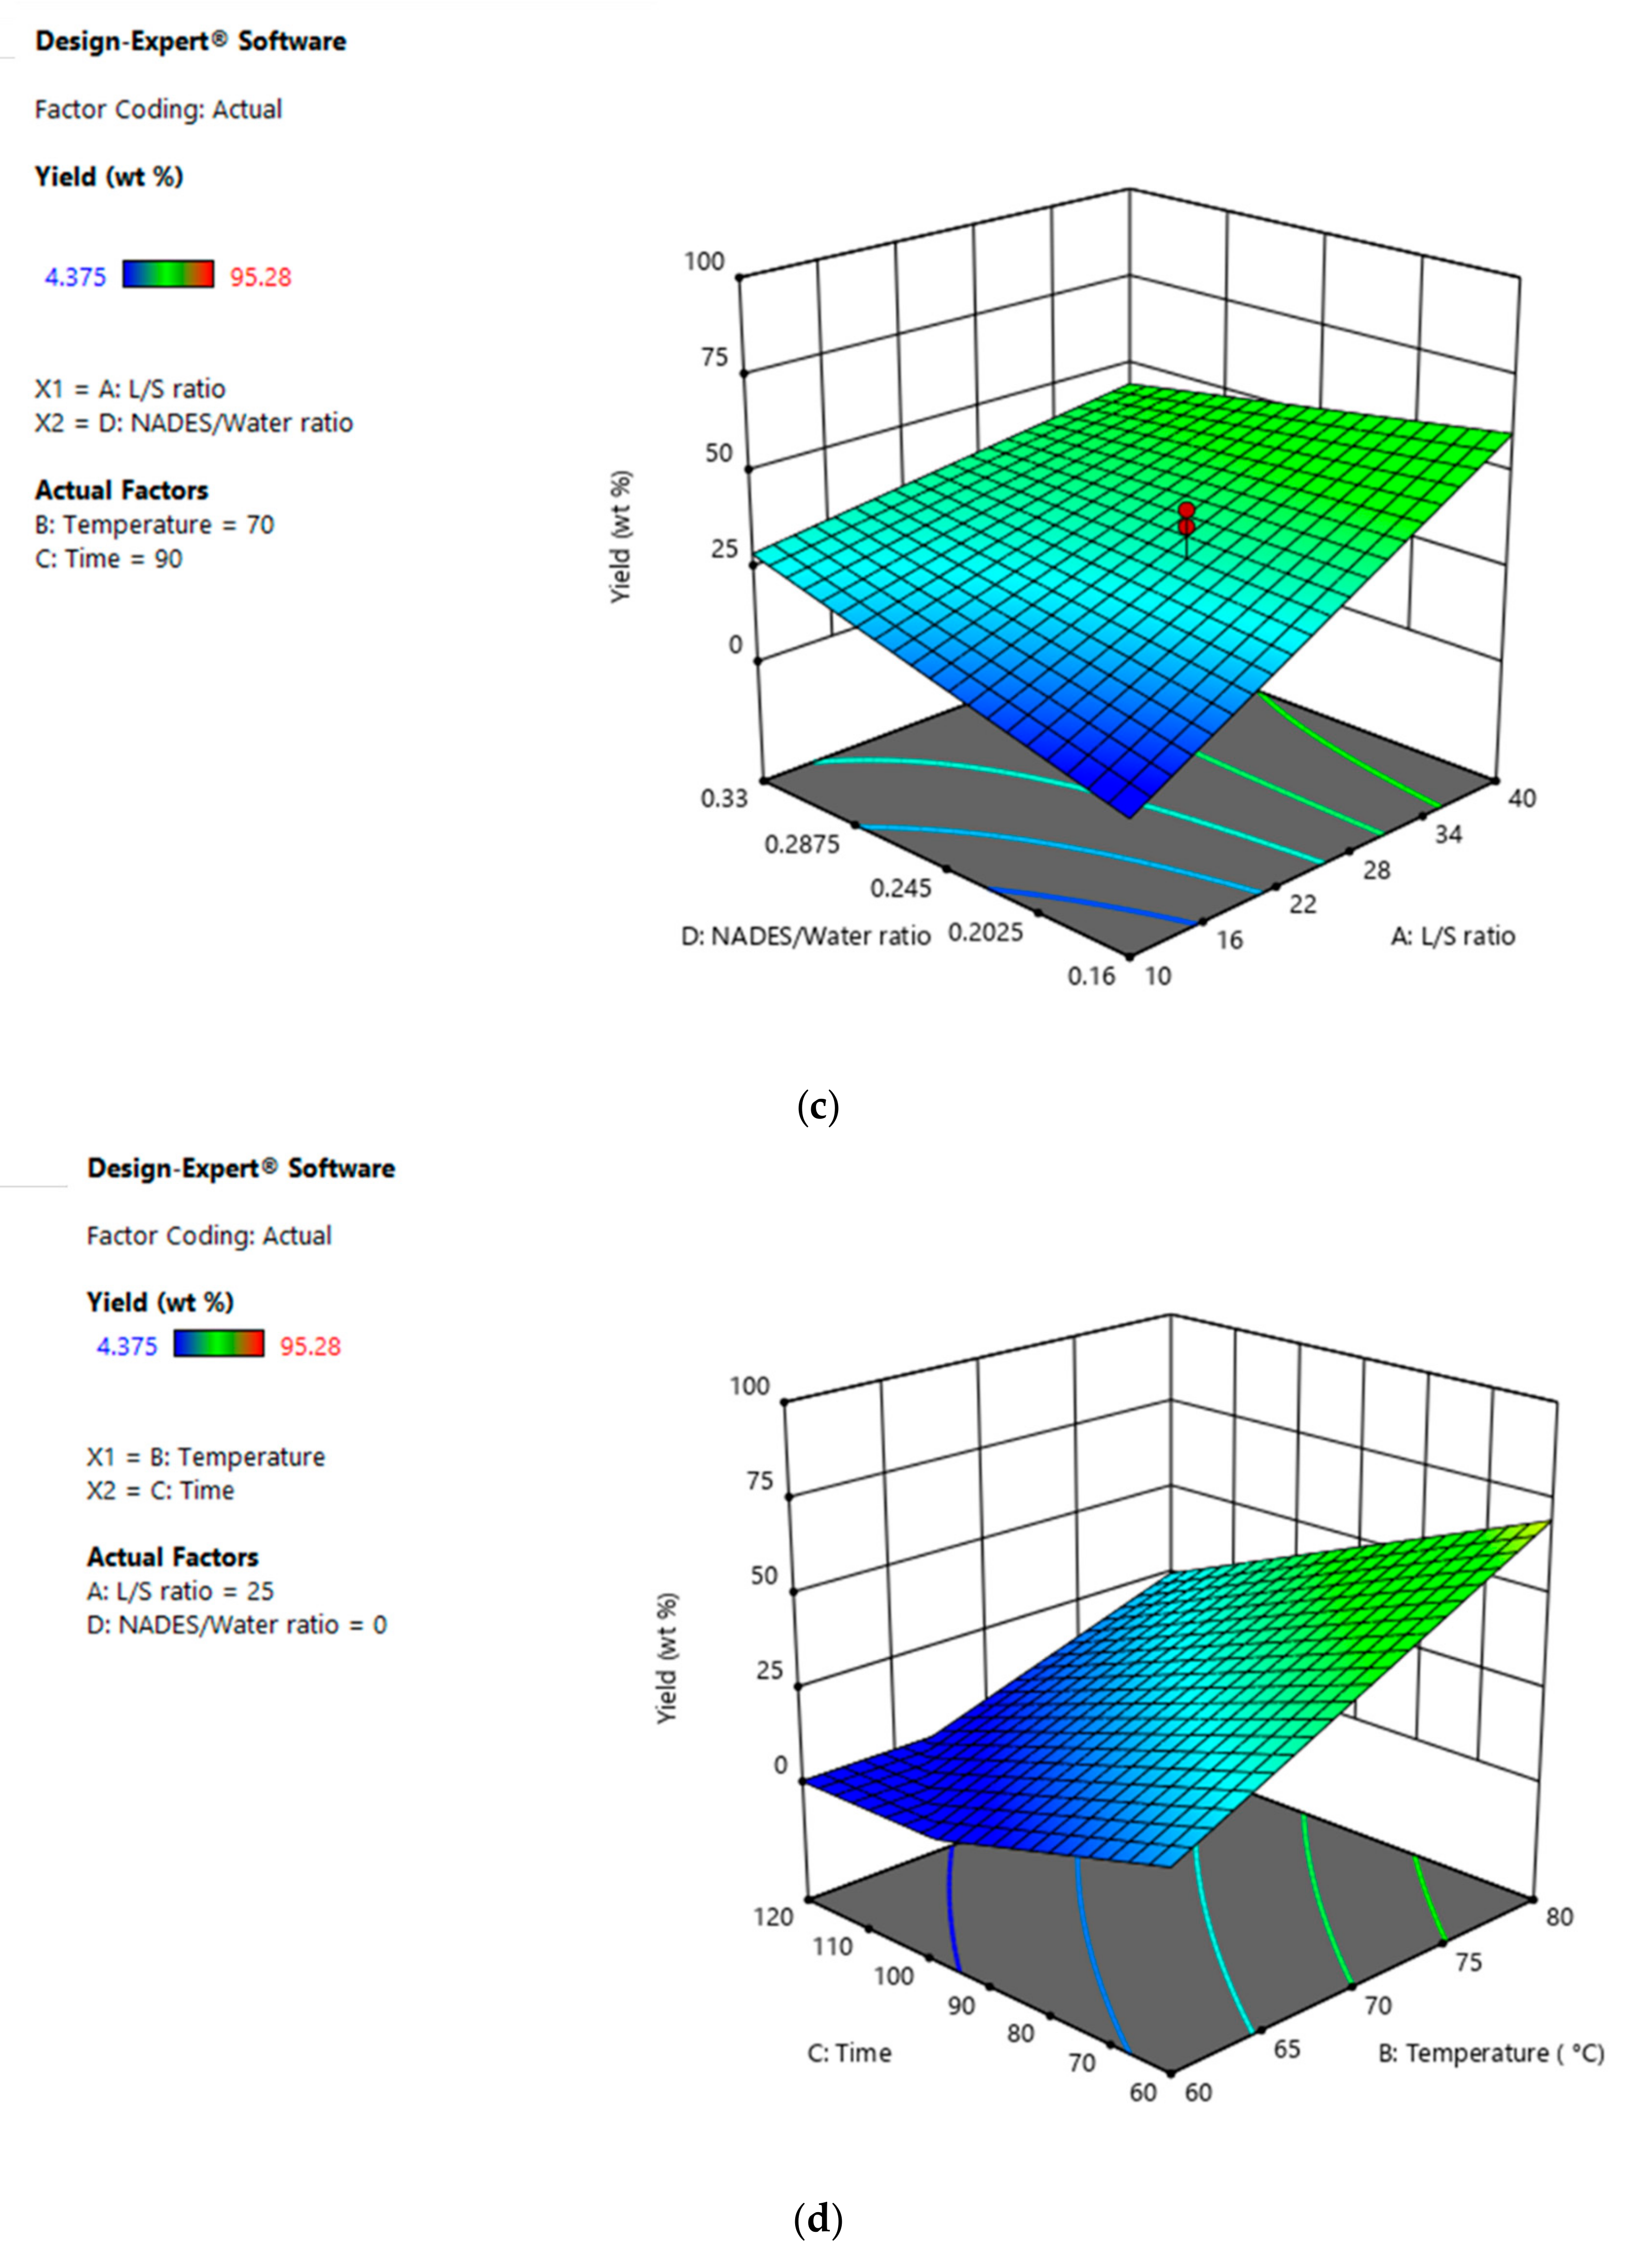
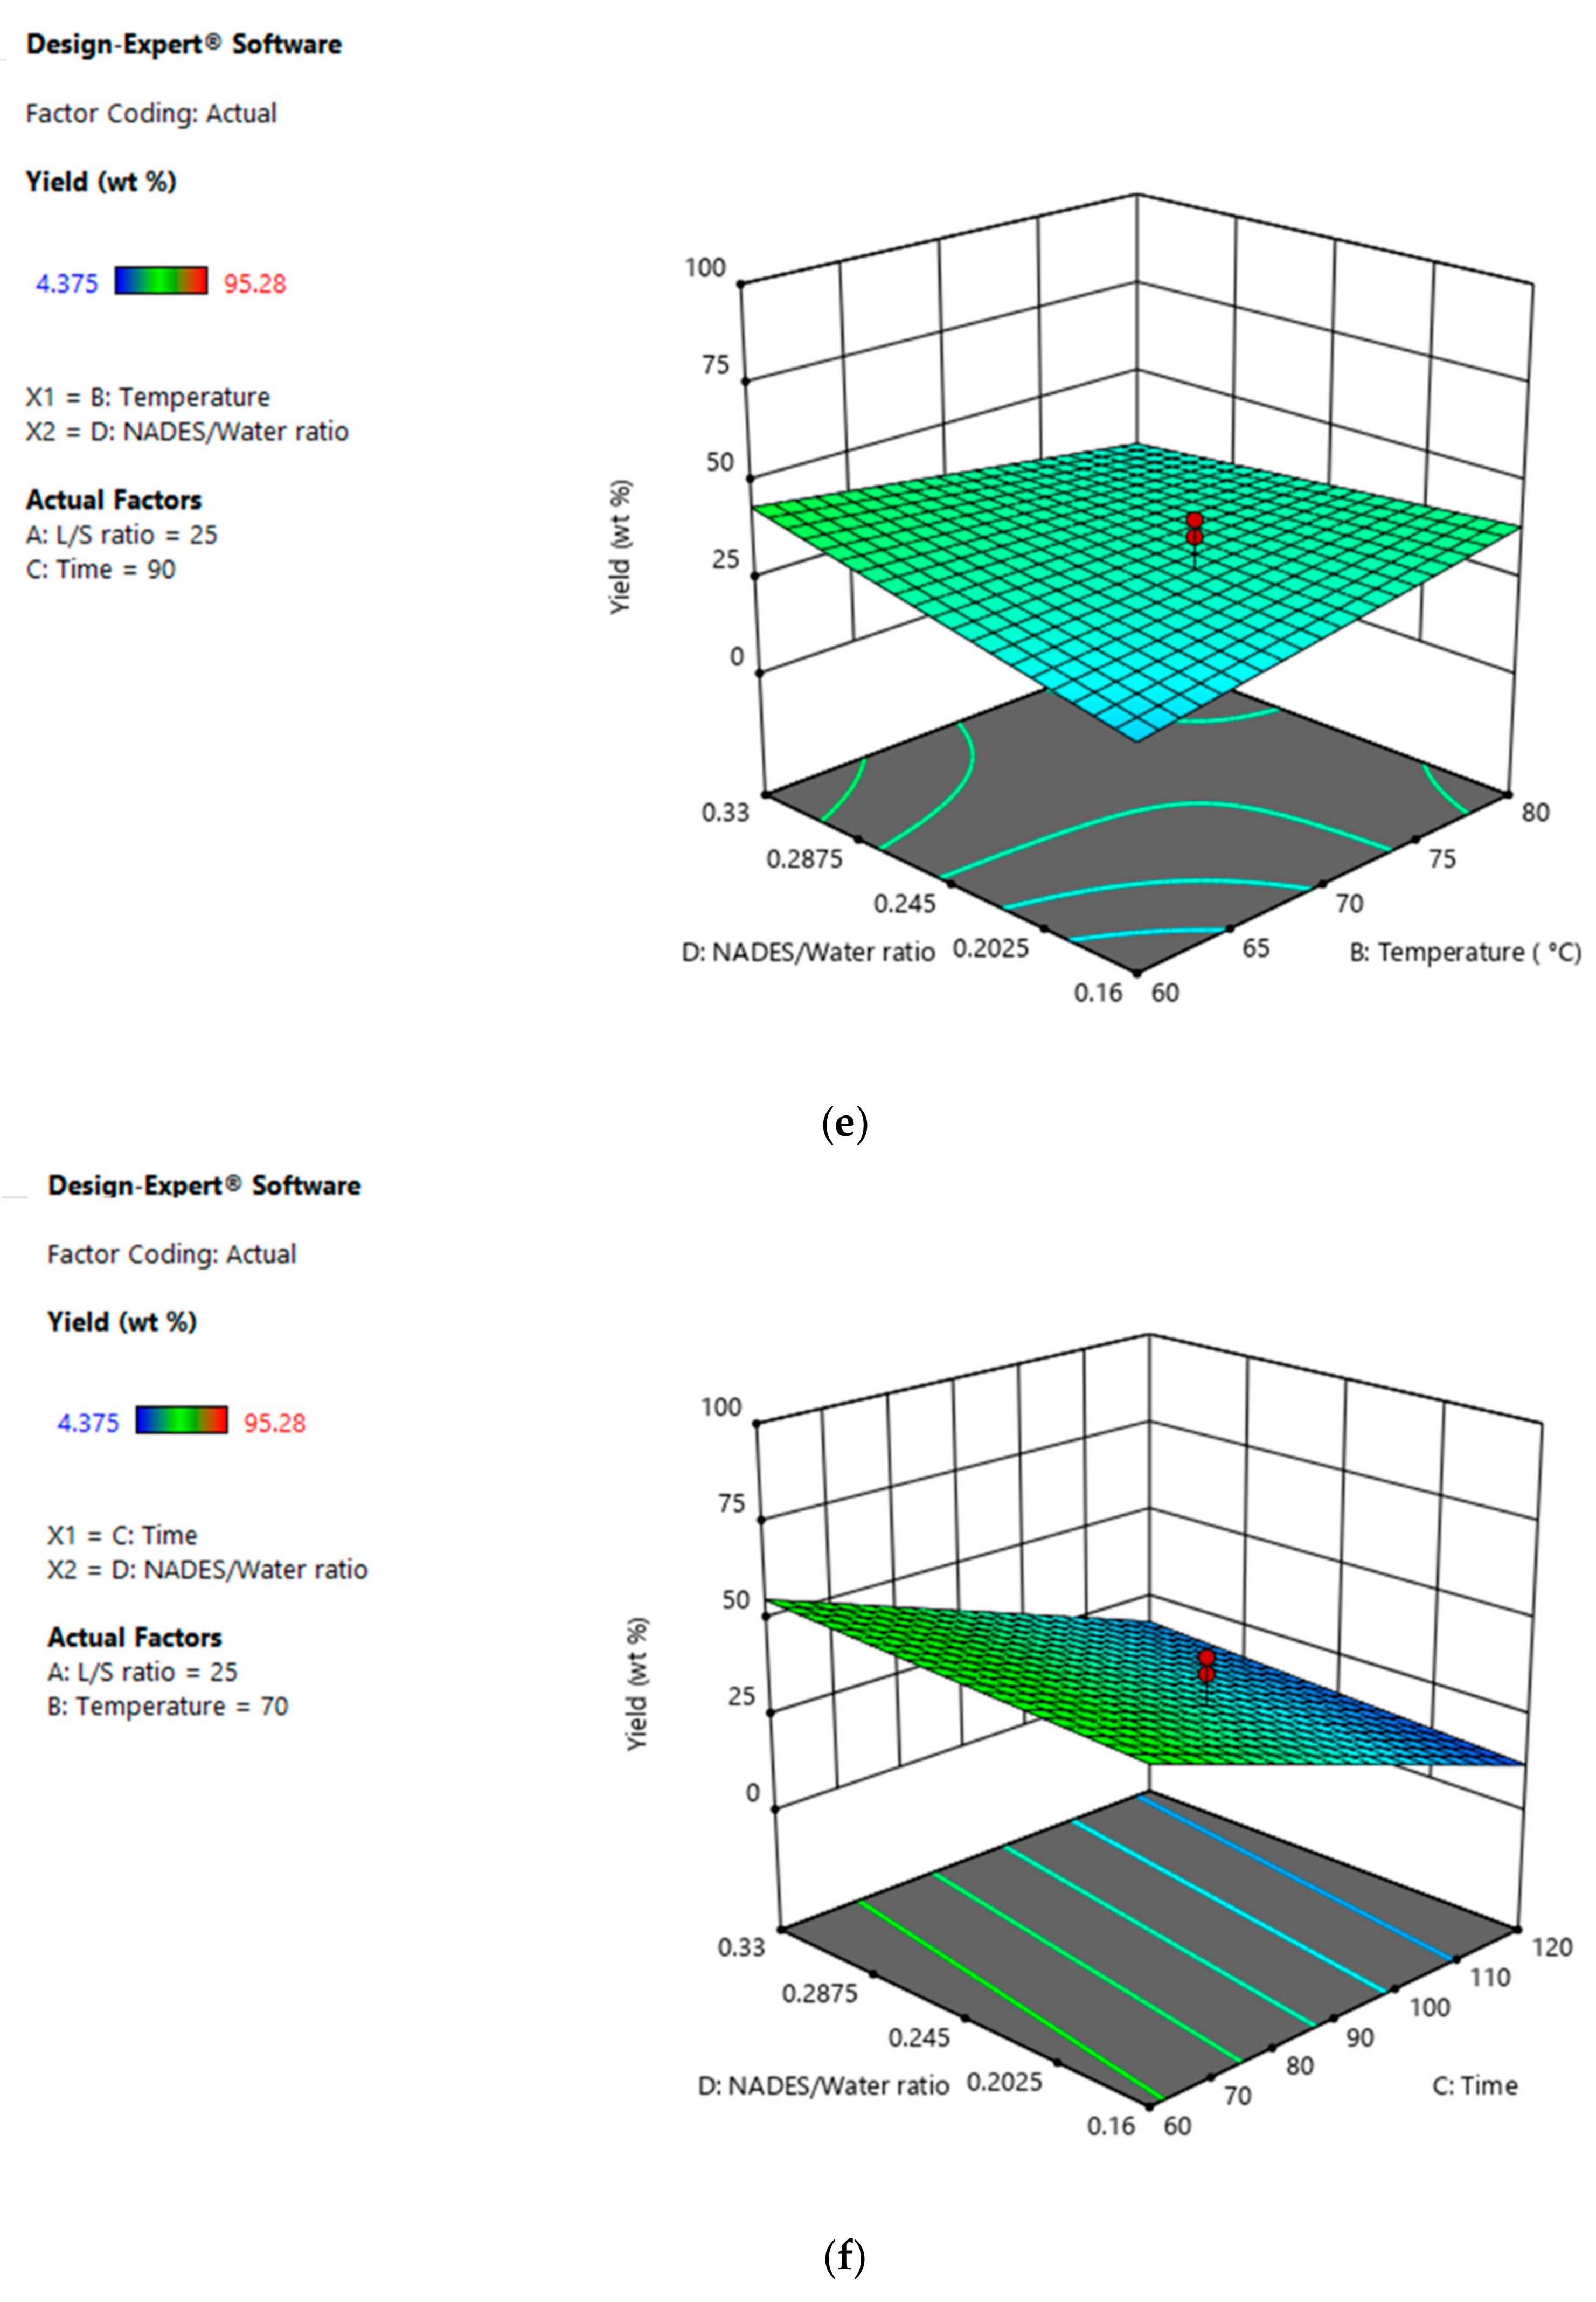
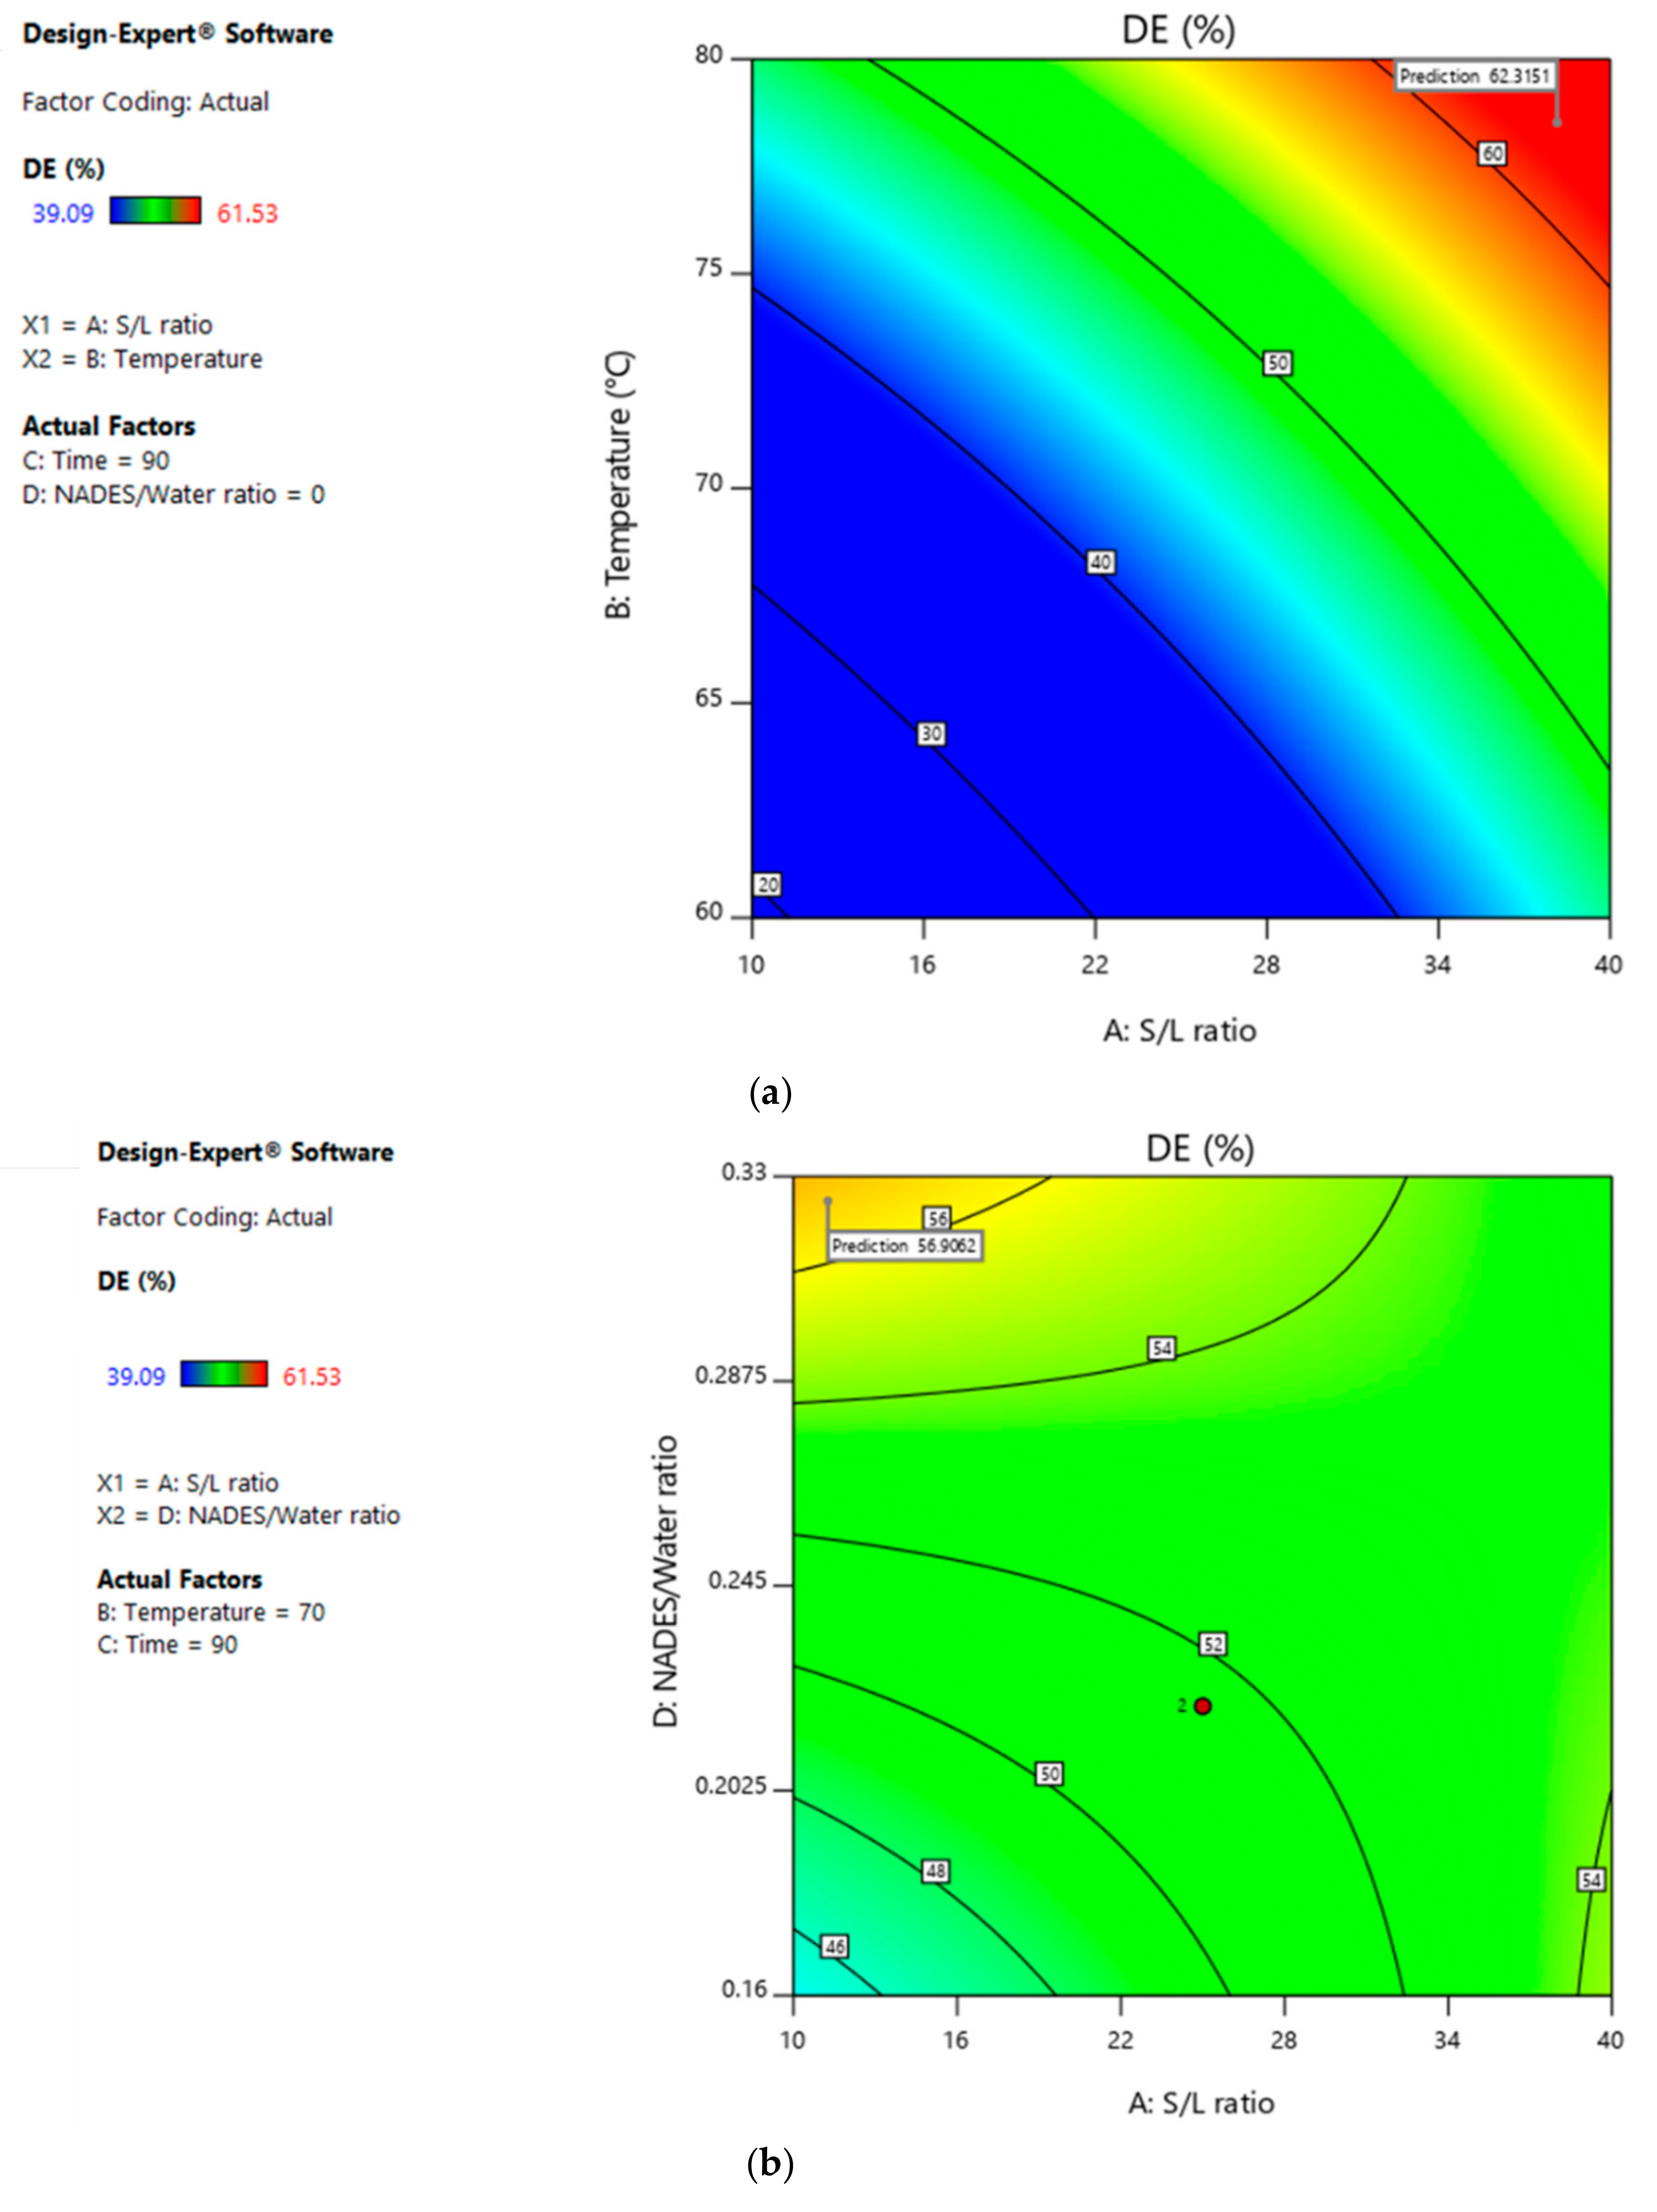
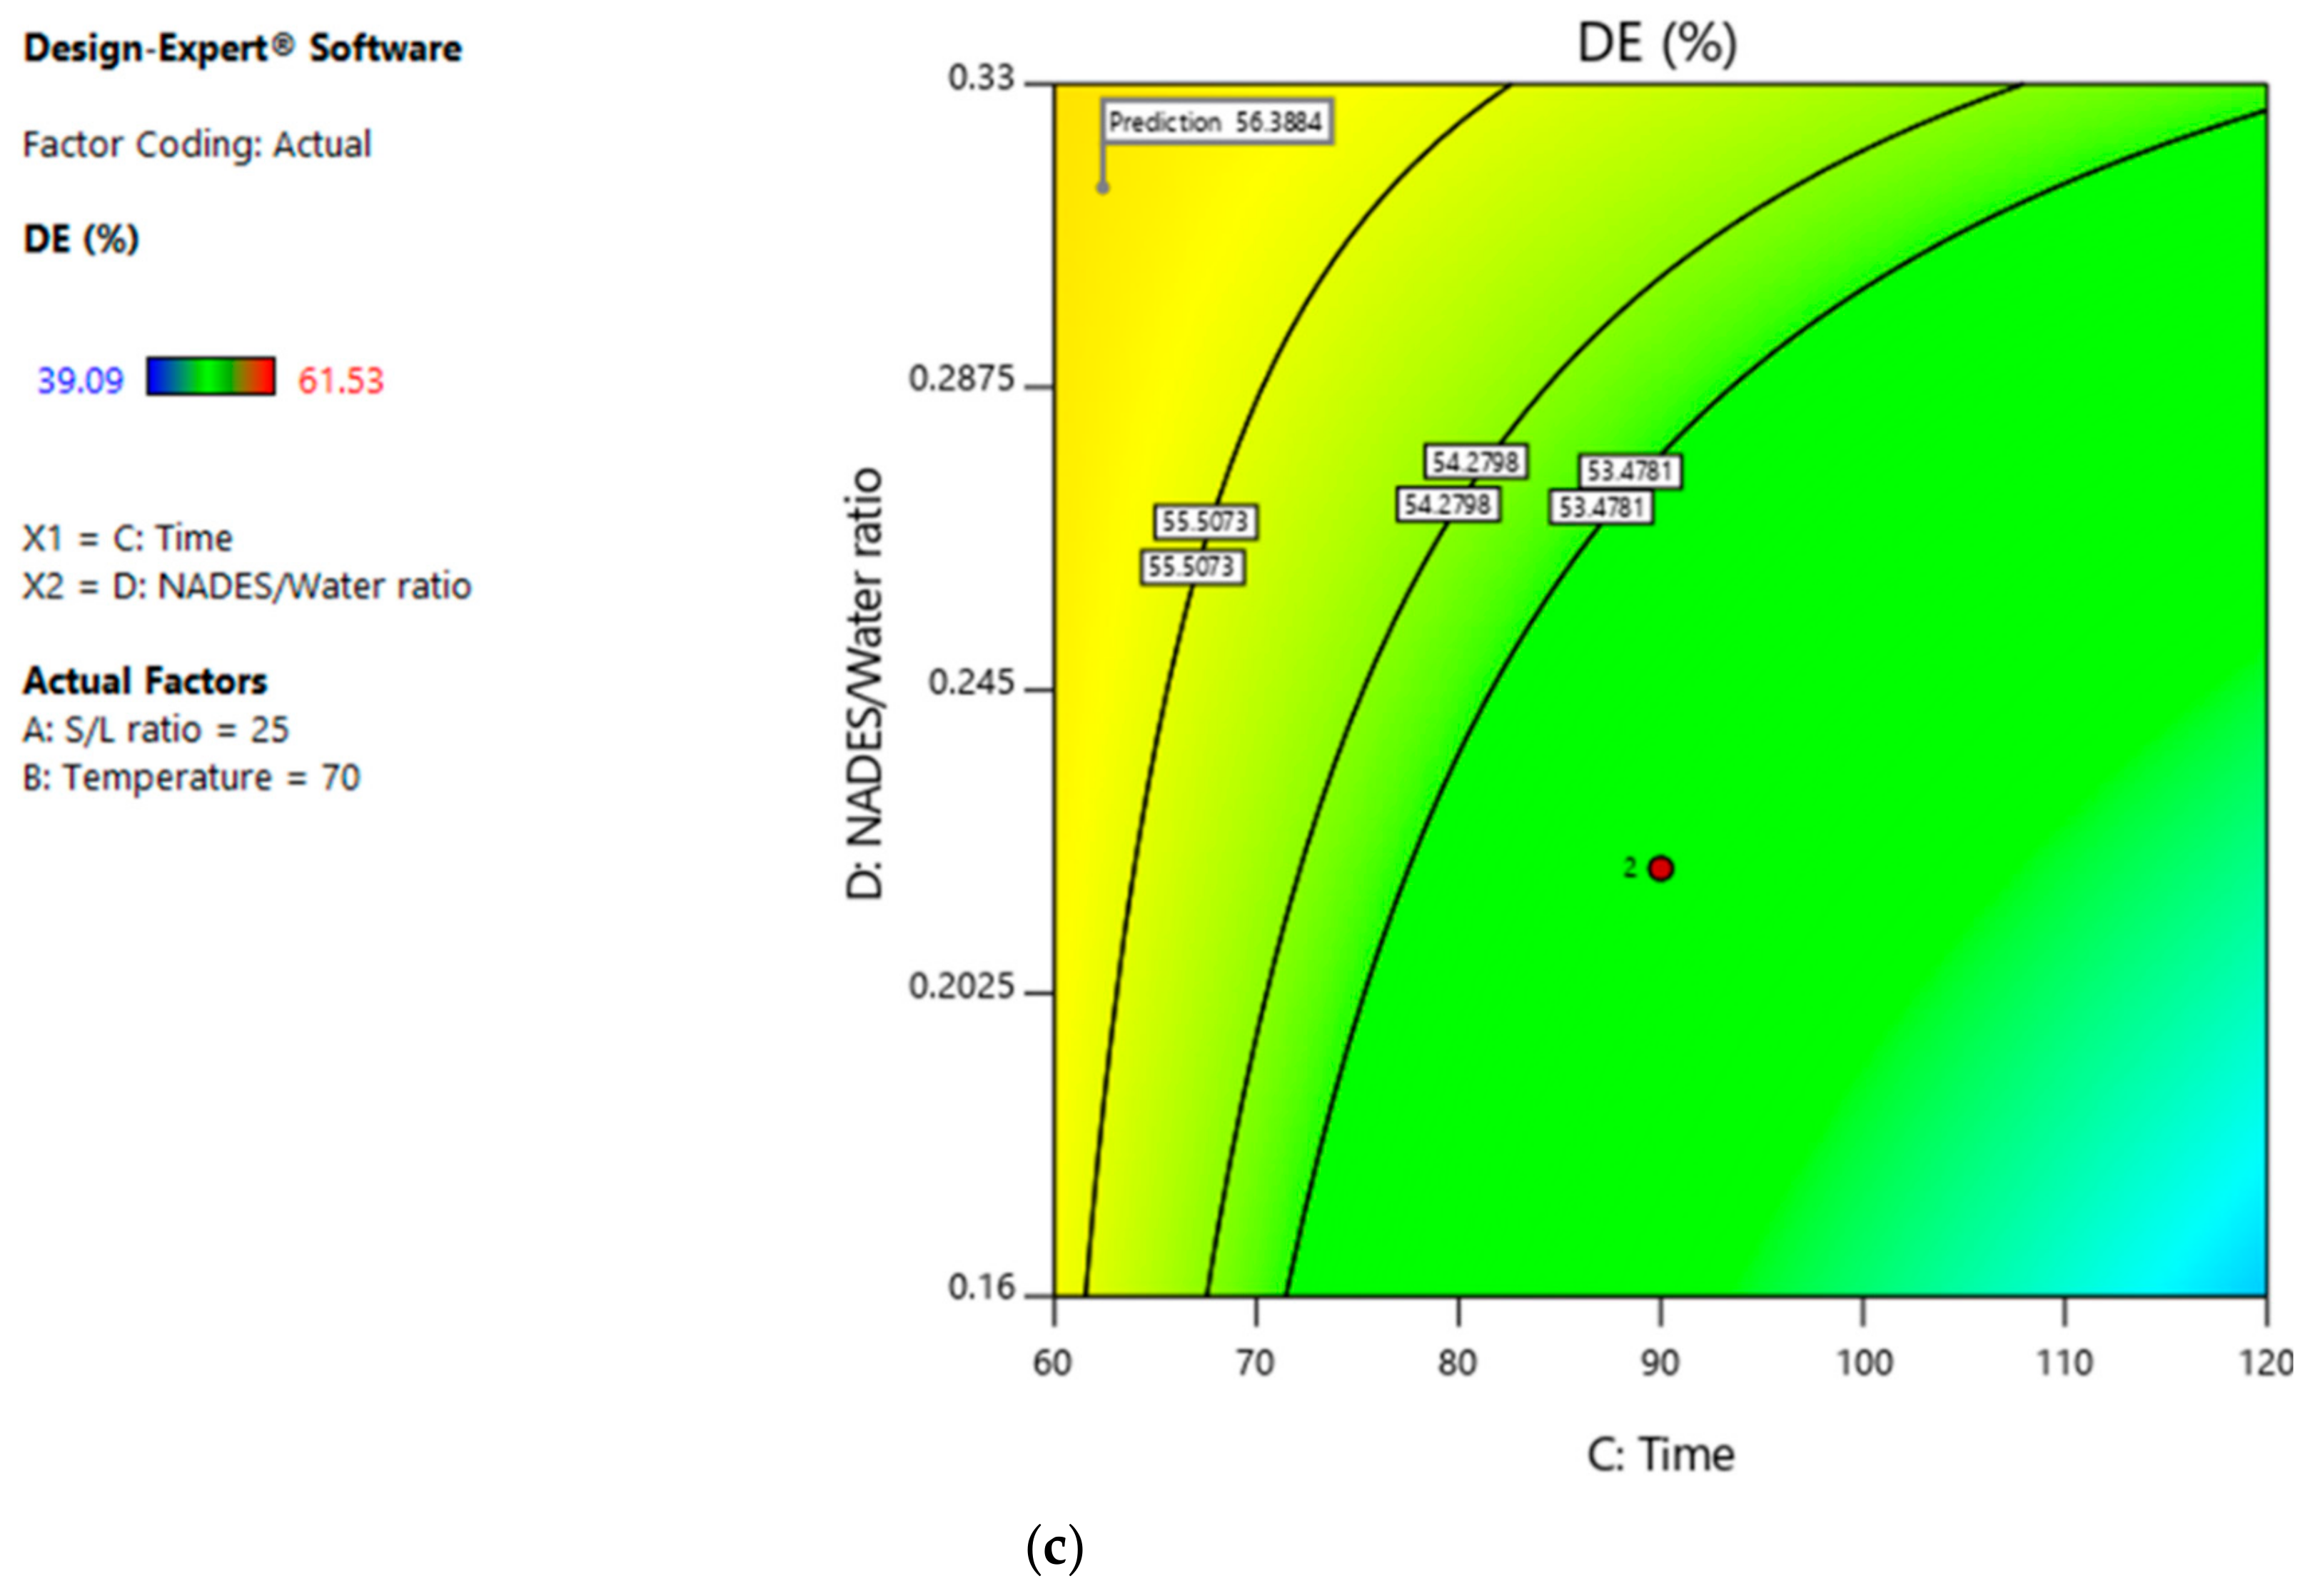
3.2. Optimization Using Definitive Screening Design (DSD)
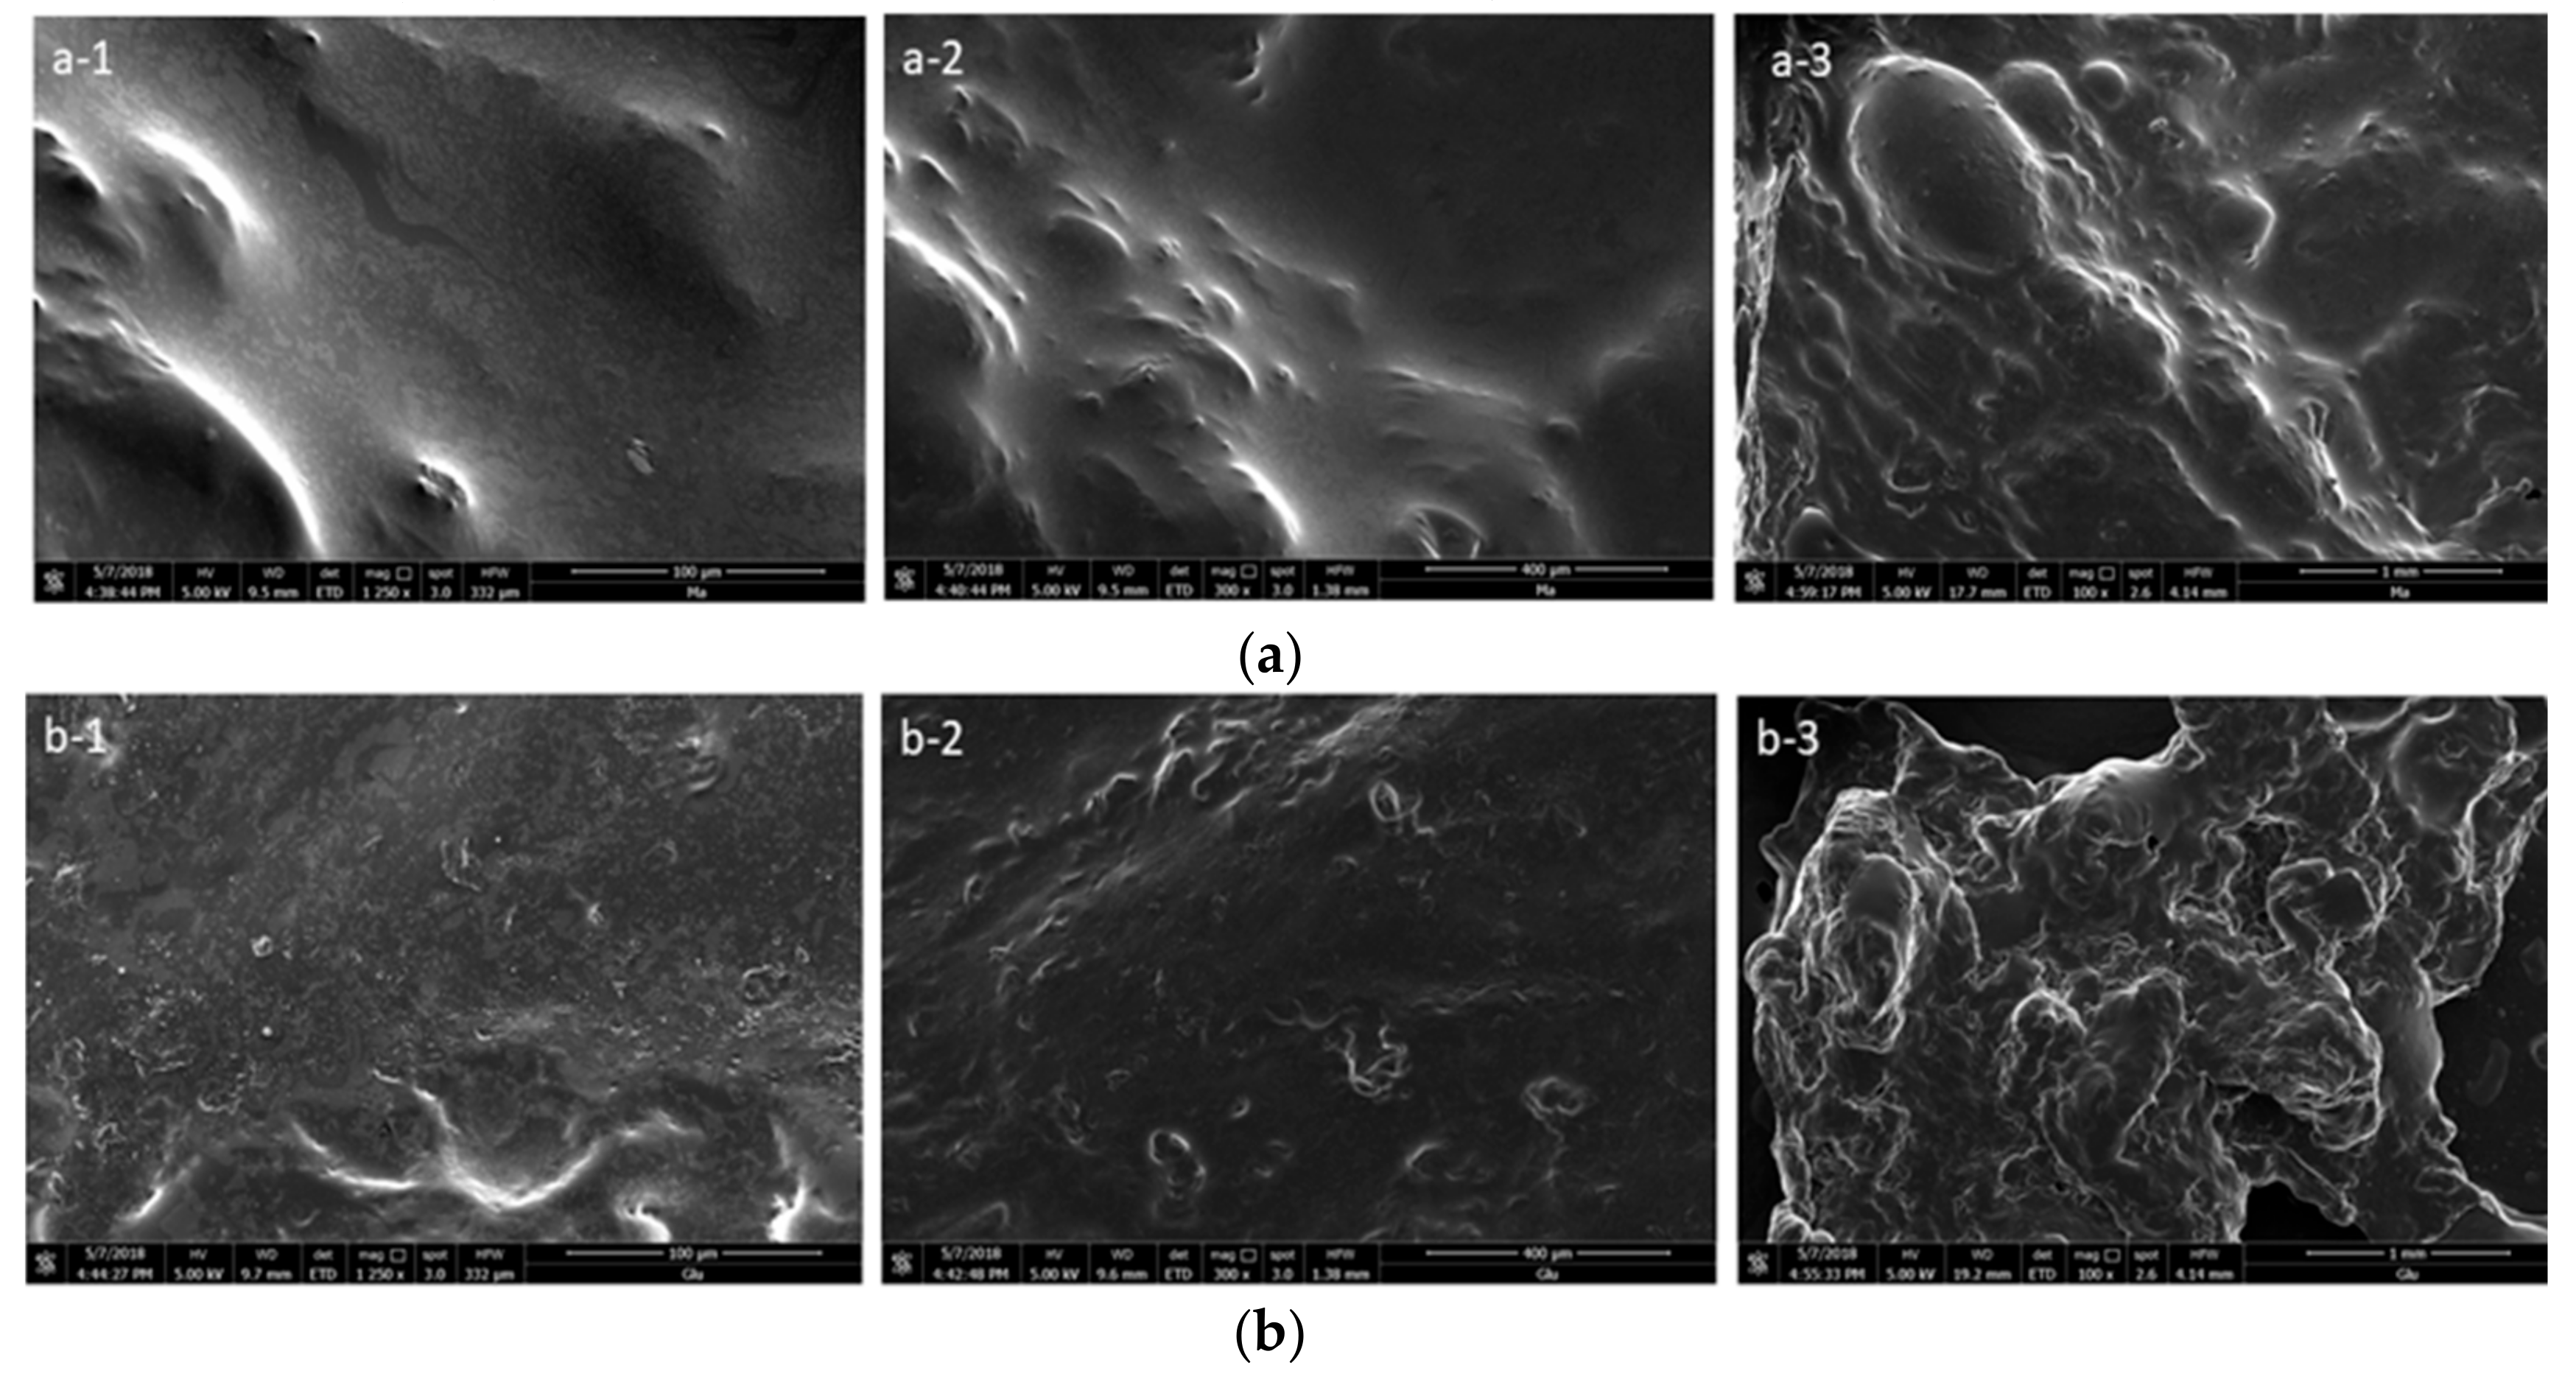
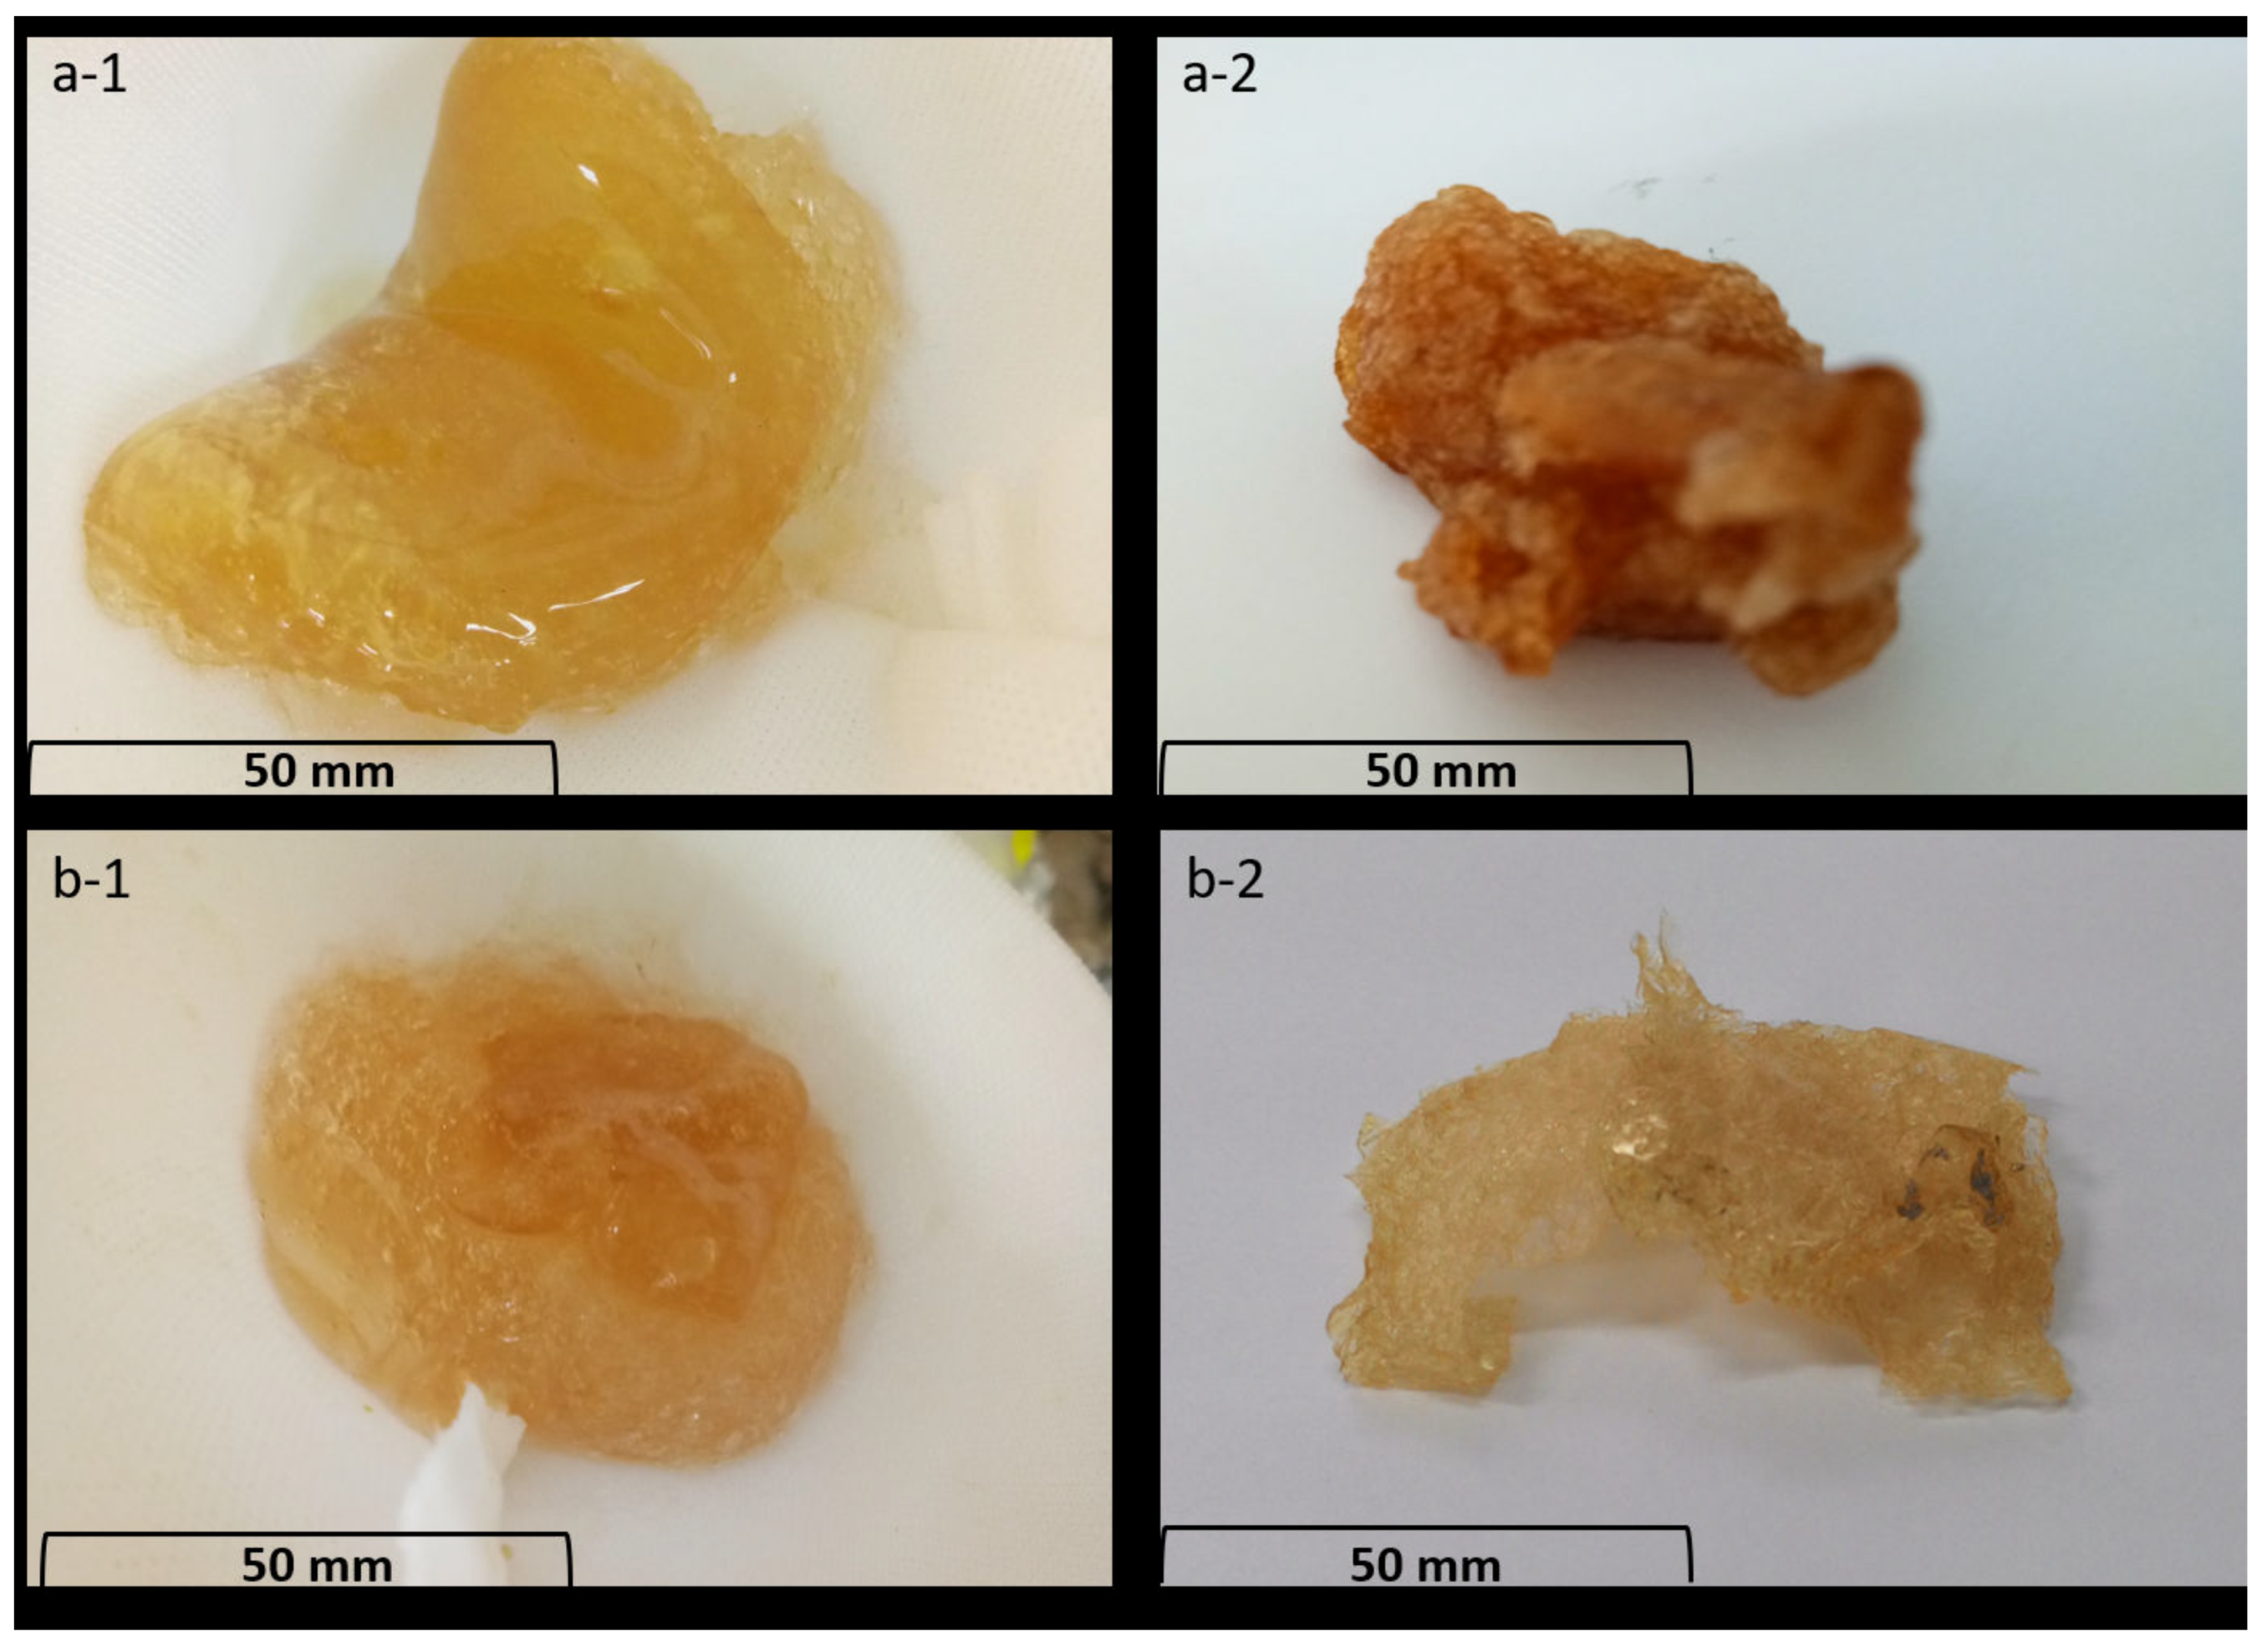
3.3. Observation of Pectin Sample Morphology
4. Conclusions
Author Contributions
Funding
Acknowledgments
Conflicts of Interest
References
- Mohnen, D. Pectin structure and biosynthesis. Curr. Opin. Plant Biol. 2008, 11, 266–277. [Google Scholar] [CrossRef] [PubMed]
- Liew, S.Q.; Ngoh, G.C.; Yusoff, R.; Teoh, W.H. Acid and Deep Eutectic Solvent (DES) extraction of pectin from pomelo (Citrus grandis (L.) Osbeck) peels. Biocatal. Agric. Biotechnol. 2018, 13, 1–11. [Google Scholar] [CrossRef]
- Barrera, A.M.; Ramírez, J.A.; González-Cabriales, J.J.; Vázquez, M. Effect of pectins on the gelling properties of surimi from silver carp. Food Hydrocoll. 2002, 16, 441–447. [Google Scholar] [CrossRef]
- Liew, S.Q.; Chin, N.L.; Yusof, Y.A. Extraction and characterization of pectin from passion fruit peels. Agric. Agric. Sci. Procedia 2014, 2, 231–236. [Google Scholar] [CrossRef]
- De Oliveira, C.F.; Giordani, D.; Gurak, P.D.; Cladera-Olivera, F.; Marczak, L.D.F. Extraction of pectin from passion fruit peel using moderate electric field and conventional heating extraction methods. Innov. Food Sci. Emerg. Technol. 2015, 29, 201–208. [Google Scholar] [CrossRef]
- Zhang, Y.; Li, Z.; Wang, H.; Xuan, X.; Wang, J. Efficient separation of phenolic compounds from model oil by the formation of choline derivative-based deep eutectic solvents. Sep. Purif. Technol. 2016, 163, 310–318. [Google Scholar] [CrossRef]
- García, A.; Rodríguez-Juan, E.; Rodríguez-Gutiérrez, G.; Rios, J.J.; Fernández-Bolaños, J. Extraction of phenolic compounds from virgin olive oil by deep eutectic solvents (DESs). Food Chem. 2016, 197, 554–561. [Google Scholar] [CrossRef] [PubMed]
- Dietz, C.H.J.T.; Gallucci, F.; van Sint Annaland, M.; Held, C.; Kroon, M.C. 110th Anniversary: Distribution coefficients of furfural and 5-hydroxymethylfurfural in hydrophobic deep eutectic solvent + water systems: Experiments and perturbed-chain statistical associating fluid theory predictions. Ind. Eng. Chem. Res. 2019, 58, 4240–4247. [Google Scholar] [CrossRef]
- Verevkin, S.P.; Sazonova, A.Y.; Frolkova, A.K.; Zaitsau, D.H.; Prikhodko, I.V.; Held, C. Separation performance of biorenewable deep eutectic solvents. Ind. Eng. Chem. Res. 2015, 54, 3498–3504. [Google Scholar] [CrossRef]
- Aroso, I.M.; Paiva, A.; Reis, R.L.; Duarte, A.R.C. Natural deep eutectic solvents from choline chloride and betaine – Physicochemical properties. J. Mol. Liq. 2017, 241, 654–661. [Google Scholar] [CrossRef]
- Hayyan, M.; Mbous, Y.P.; Looi, C.Y.; Wong, W.F.; Hayyan, A.; Salleh, Z.; Mohd-Ali, O. Natural deep eutectic solvents: Cytotoxic profile. Springerplus 2016, 5, 913. [Google Scholar] [CrossRef] [PubMed]
- Oliveira, T.Í.S.; Rosa, M.F.; Cavalcante, F.L.; Pereira, P.H.F.; Moates, G.K.; Wellner, N.; Mazzetto, S.E.; Waldron, K.W.; Azeredo, H.M.C. Optimization of pectin extraction from banana peels with citric acid by using response surface methodology. Food Chem. 2016, 198, 113–118. [Google Scholar] [CrossRef] [PubMed]
- Shafie, M.H.; Yusof, R.; Gan, C.-Y. Deep eutectic solvents (DES) mediated extraction of pectin from Averrhoa bilimbi: Optimization and characterization studies. Carbohydr. Polym. 2019, 216, 303–311. [Google Scholar] [CrossRef] [PubMed]
- Jablonský, M.; Škulcová, A.; Kamenská, L.; Vrška, M.; Šíma, J. Deep Eutectic Solvents: Fractionation of Wheat Straw. BioResources 2015, 10, 8039–8047. [Google Scholar] [CrossRef]
- Tommasi, E.; Cravotto, G.; Galletti, P.; Grillo, G.; Mazzotti, M.; Sacchetti, G.; Samorì, C.; Tabasso, S.; Tacchini, M.; Tagliavini, E. Enhanced and selective lipid extraction from the microalga P. tricornutum by dimethyl carbonate and supercritical CO2 using deep eutectic solvents and microwaves as pretreatment. ACS Sustain. Chem. Eng. 2017, 5, 8316–8322. [Google Scholar] [CrossRef]
- Hayyan, A.; Mjalli, F.S.; AlNashef, I.M.; Al-Wahaibi, T.; Al-Wahaibi, Y.M.; Hashim, M.A. Fruit sugar-based deep eutectic solvents and their physical properties. Thermochim. Acta 2012, 541, 70–75. [Google Scholar] [CrossRef]
- Raji, Z.; Khodaiyan, F.; Rezaei, K.; Kiani, H.; Hosseini, S.S. Extraction optimization and physicochemical properties of pectin from melon peel. Int. J. Biol. Macromol. 2017, 98, 709–716. [Google Scholar] [CrossRef] [PubMed]
- Canteri-Schemin, M.H.; Fertonani, H.C.R.; Waszczynskyj, N.; Wosiacki, G. Extraction of pectin from apple pomace. Braz. Arch. Biol. Technol. 2005, 48, 259–266. [Google Scholar] [CrossRef] [Green Version]
- Yapo, B.M.; Robert, C.; Etienne, I.; Wathelet, B.; Paquot, M. Effect of extraction conditions on the yield, purity and surface properties of sugar beet pulp pectin extracts. Food Chem. 2007, 100, 1356–1364. [Google Scholar] [CrossRef]
- Bogaars, R.A. Exploring Commercial Applications of Natural Deep Eutectic Solvents, TUDelft University. 2015. Available online: https://repository.tudelft.nl/islandora/object/uuid%3Abe6d9d2b-93d7-4af5-9860-91bd75e0632b (accessed on 30 April 2019).
- Dai, Y.; Rozema, E.; Verpoorte, R.; Choi, Y.H. Application of natural deep eutectic solvents to the extraction of anthocyanins from Catharanthus roseus with high extractability and stability replacing conventional organic solvents. J. Chromatogr. A 2016, 1434, 50–56. [Google Scholar] [CrossRef]
- Zainal-Abidin, M.H.; Hayyan, M.; Hayyan, A.; Jayakumar, N.S. New horizons in the extraction of bioactive compounds using deep eutectic solvents: A review. Anal. Chim. Acta 2017, 979, 1–23. [Google Scholar] [CrossRef] [PubMed]
- Paiva, A.; Craveiro, R.; Aroso, I.; Martins, M.; Reis, R.L.; Duarte, A.R.C. Natural deep eutectic solvents - Solvents for the 21st Century. ACS Sustain. Chem. Eng. 2014, 45, 1069–1071. [Google Scholar] [CrossRef]
- Radošević, K.; Cvjetko Bubalo, M.; Gaurina Srček, V.; Grgas, D.; Landeka Dragičević, T.; Radojčić Redovniković, I. Evaluation of toxicity and biodegradability of choline chloride based deep eutectic solvents. Ecotoxicol. Environ. Saf. 2015, 112, 46–53. [Google Scholar] [CrossRef] [PubMed]
- Methacanon, P.; Krongsin, J.; Gamonpilas, C. Pomelo (Citrus maxima) pectin: Effects of extraction parameters and its properties. Food Hydrocoll. 2014, 35, 383–391. [Google Scholar] [CrossRef]
- Zanella, K.; Taranto, O.P. Influence of the drying operating conditions on the chemical characteristics of the citric acid extracted pectins from “pera” sweet orange (Citrus sinensis L. Osbeck) albedo and flavedo. J. Food Eng. 2015, 166, 111–118. [Google Scholar] [CrossRef]
- Devi, W.E.; Shukla, R.N.; Abraham, A.; Jarpula, S.; Kaushik, U. Optimized extraction condition and characterization of pectin from orange peel. Int. J. Res. Eng. Adv. Technol. 2014, 2, 1–9. [Google Scholar]
- Abdul Hadi, N.; Ng, M.H.; Choo, Y.M.; Hashim, M.A.; Jayakumar, N.S. Performance of choline-based deep eutectic solvents in the extraction of tocols from crude palm oil. J. Am. Oil Chem. Soc. 2015, 92, 1709–1716. [Google Scholar] [CrossRef]
- Sun, T.; Cui, D.; Ma, Q.; Peng, X.; Yuan, L. Synthesis of BiVO4/MWCNT/Ag@AgCl composite with enhanced photocatalytic performance. J. Phys. Chem. Solids 2017, 111, 190–198. [Google Scholar] [CrossRef]


| No | Factor | Level | |
|---|---|---|---|
| Low | High | ||
| 1 | X1: Liquid/solid ratio | 10 | 40 |
| 2 | X2: Temperature, °C | 60 | 80 |
| 3 | X3: Time, min | 60 | 120 |
| 4 | X4: NADES/water ratio | 1:6 | 1:3 |
| Entry | Co-solvent | Ratio | Pectin Weight (g) | Pectin Yield (wt.%) |
|---|---|---|---|---|
| 1 | ChCl–malonic acid | 1:1 | 1.45 ± 0.05 | 96.37 ± 2.00 |
| 2 | ChCl–fructose–H2O | 5:2:5 | 1.07 ± 0.05 | 71.49 ± 1.00 |
| 3 | ChCl–glycerol–H2O | 1:2:1 | 0.63 ± 0.02 | 41.71 ± 1.00 |
| 4 | ChCl–fructose | 5:2 | 0.44 ± 0.02 | 29.25 ± 1.00 |
| 5 | ChCl–sucrose–H2O | 4:1:4 | 0.78 ± 0.03 | 51.73 ± 1.00 |
| 6 | ChCl–glucose–H2O | 5:2:5 | 1.45 ± 0.05 | 96.73 ± 2.00 |
| 7 | ChCl–glucose | 5:2 | 0.76 ± 0.02 | 50.54 ± 1.00 |
| 8 | H2O | - | 0.21 ± 0.01 | 13.73 ± 1.00 |
| 9 | ChCl–citric acid | 1:1 | 0.65 ± 0.01 | 43.18 ± 1.00 |
| 10 | ChCl–malic acid | 1:1 | 0.67 ± 0.02 | 44.96 ± 1.00 |
| 11 | ChCl–oxalic acid | 1:1 | 0.49 ± 0.02 | 32.91 ± 1.00 |
| 12 | d-Malic acid only | 1:1 | 1.15 ± 0.05 | 76.53 ± 1.00 |
| 13 | Oxalic acid | 1:1 | 0.91 ± 0.05 | 60.56 ± 1.00 |
| 14 | Fructose | 1:1 | 0.45 ± 0.02 | 29.80 ± 1.00 |
| 15 | Malonic acid | 1:1 | 0.56 ± 0.02 | 37.01 ± 1.00 |
| 16 | Choline chloride | 1:1 | 0.047 ± 0.00 | 3.16 ± 1.00 |
| 17 | Citric acid | 1:1 | 0.52 ± 0.02 | 34.45 ±1.00 |
| 18 | Fructose–citric acid | 1:1 | 0.37 ± 0.02 | 36.97 ±1.00 |
| (M) | (G) | |||||||
|---|---|---|---|---|---|---|---|---|
| Factors | X1 | X2 | X3 | X4 | Response 1 | Response 2 | Response 1 | Response 2 |
| Run | L/S * ratio | T * °C | t * min | NADES/ Water Ratio | Yield % | DE% | Yield Wt.% | DE% |
| 1 | 40 | 80 | 120 | 1:6 | 11.25 ± 1.5 | 49.02 ± 1.75 | 12.68 ± 1.5 | 49.52 ± 1.75 |
| 2 | 10 | 80 | 60 | 1:6 | 14.97 ± 1.5 | 58.99 ± 1.75 | 16.32 ± 1.5 | 59.76 ± 1.75 |
| 3 | 40 | 60 | 90 | 1:6 | 59.68 ± 1.5 | 51.09 ± 1.75 | 72.25 ± 1.5 | 52.03 ± 1.75 |
| 4 | 40 | 60 | 120 | 1:3 | 21.49 ± 1.5 | 56.29 ± 1.75 | 57.59 ± 1.5 | 55.55 ± 1.75 |
| 5 | 10 | 70 | 120 | 1:6 | 5.79 ± 1.5 | 39.88 ± 1.75 | 6.40 ± 1.5 | 40.17 ± 1.75 |
| 6 | 40 | 80 | 60 | 1:4.5 | 93.93 ± 1.5 | 62.19 ± 1.75 | 87.59 ± 1.5 | 60.89 ± 1.75 |
| 7 | 10 | 60 | 120 | 1:4.5 | 7.25 ± 1.5 | 38.22 ± 1.75 | 4.14 ± 1.5 | 41.07 ± 1.75 |
| 8 | 10 | 60 | 60 | 1:3 | 16.64 ± 1.5 | 57.91 ± 1.75 | 15.12 ± 1.5 | 55.76 ± 1.75 |
| 9 | 10 | 80 | 90 | 1:3 | 32.19 ± 1.5 | 60.01 ± 1.75 | 33.73 ± 1.5 | 59.51 ± 1.75 |
| 10 | 40 | 70 | 60 | 1:3 | 86.97 ± 1.5 | 54.76 ± 1.75 | 84.27 ± 1.5 | 55.33 ± 1.75 |
| 11 | 25 | 80 | 120 | 1:3 | 5.09 ± 1.5 | 53.85 ± 1.75 | 5.33 ± 1.5 | 52.01 ± 1.75 |
| 12 | 25 | 60 | 60 | 1:6 | 38.17 ± 1.5 | 50.48 ± 1.75 | 35.68 ± 1.5 | 49.78 ± 1.75 |
| 13 | 25 | 70 | 90 | 1:4.5 | 43.31 ± 1.5 | 47.74 ± 1.75 | 48.12 ± 1.5 | 48.12 ± 1.75 |
| Source | Sum of Squares | df | Mean Square | F-Value | p-Value | |
|---|---|---|---|---|---|---|
| Model | 21692.35 | 12 | 1807.7 | 936.46 | <0.0001 | significant |
| X1 L/S ratio | 902.1 | 1 | 902.1 | 467.32 | <0.0001 | |
| X2Temp | 62.17 | 1 | 62.17 | 32.21 | <0.0001 | |
| X3Time | 10.04 | 1 | 10.04 | 5.2 | 0.04 | |
| X4 NADES/water ratio | 154.04 | 1 | 154.04 | 79.8 | <0.0001 | |
| X1 X2 | 34.76 | 1 | 34.76 | 18.01 | 0.001 | |
| X1 X3 | 341.29 | 1 | 341.29 | 176.8 | <0.0001 | |
| X1 X4 | 360.69 | 1 | 360.69 | 186.85 | <0.0001 | |
| X2 X3 | 102.31 | 1 | 102.31 | 53 | <0.0001 | |
| X2 X4 | 57.49 | 1 | 57.49 | 29.78 | 0.0001 | |
| X3 X4 | 38.04 | 1 | 38.04 | 19.71 | 0.0007 | |
| X12 | 236.68 | 1 | 236.68 | 122.61 | <0.0001 | |
| X22 | 0 | 0 | ||||
| X32 | 0 | 0 | ||||
| X42 | 0 | 0 | ||||
| X1 X2 X4 | 15.18 | 1 | 15.18 | 7.86 | 0.0149 | |
| Lack of fit | 15.1757761 | 1 | 15.1757761 | 7.861636586 | ||
| Pure error | 25.094659 | 13 | 1.930358385 | |||
| SD | 1.39 | R2 | 0.9988 | |||
| Mean | 33.59 | Adjusted R2 | 0.9978 | |||
| C.V.% | 4.14 | Predicted R2 | 0.9954 | |||
| Adequate precision | 90.4309 | |||||
| Source | Sum of Squares | df | Mean Square | F-Value | p-Value | |
|---|---|---|---|---|---|---|
| Model | 1293.74 | 11 | 117.61 | 193.09 | <0.0001 | significant |
| X1 L/S ratio | 68.47 | 1 | 68.47 | 112.42 | <0.0001 | |
| X2 Temp | 42.76 | 1 | 42.76 | 70.20 | <0.0001 | |
| X3 Time | 138.10 | 1 | 138.10 | 226.73 | <0.0001 | |
| X4 NADES/Water ratio | 222.70 | 1 | 222.70 | 365.61 | <0.0001 | |
| X1 X2 | 33.25 | 1 | 33.25 | 54.59 | <0.0001 | |
| X1 X3 | 19.28 | 1 | 19.28 | 31.65 | <0.0001 | |
| X1 X4 | 55.08 | 1 | 55.08 | 90.43 | <0.0001 | |
| X2 X3 | 26.18 | 1 | 26.18 | 42.98 | <0.0001 | |
| X2 X4 | 33.71 | 1 | 33.71 | 55.34 | <0.0001 | |
| X3 X4 | 88.90 | 1 | 88.90 | 145.95 | <0.0001 | |
| X12 | 31.28 | 1 | 31.28 | 51.35 | <0.0001 | |
| X22 | 0.0000 | 0 | ||||
| X32 | 0.0000 | 0 | ||||
| X42 | 0.0000 | 0 | ||||
| Residual | 8.53 | 14 | 0.6091 | |||
| Lack of fit | 0.0239 | 1 | 0.0239 | 0.0366 | 0.8513 | not significant |
| Pure error | 8.50 | 13 | 0.6541 | |||
| Cor total | 1302.27 | 25 | ||||
| SD | 0.7805 | R2 | 0.9935 | |||
| Mean | 52.34 | Adjusted R2 | 0.9883 | |||
| C.V.% | 1.49 | Predicted R2 | 0.9775 | |||
| Adequate precision | 45.2177 | |||||
| No | X1 | X2 | X2 | X4 | Experimental Pectin Yield (wt.%) a | Predicted Pectin Yield (wt.%) | Experimental DE% b | Predicted DE% | Error % |
|---|---|---|---|---|---|---|---|---|---|
| 1 | 35 | 78 | 64 | 1:3 | 94.05% | 95.28% | 66.27% | 70.92% | −1.29% a, −6.56% b |
| 2 | 40 | 79 | 60 | 1:4.5 | 95.07% | 95.64% | 60.52% | 64.80% | −0.6% a, −6.60% b |
| 3 | 38 | 78 | 63 | 1:6 | 96.25% | 97.38% | 62.47% | 69.00% | −1.16% a, −9.46% b |
| Source | Sum of Squares | df | Mean Square | F-value | p-value | |
|---|---|---|---|---|---|---|
| Model | 1036.33 | 11 | 94.21 | 66.54 | <0.0001 | significant |
| X1 S/L ratio | 23.93 | 1 | 23.93 | 16.9 | 0.0011 | |
| X2 Temp | 6.95 | 1 | 6.95 | 4.91 | 0.0438 | |
| X3 Time | 55.26 | 1 | 55.26 | 39.03 | <0.0001 | |
| X4 NADES/Water ratio | 144.78 | 1 | 144.78 | 102.26 | <0.0001 | |
| X1X2 | 7.43 | 1 | 7.43 | 5.25 | 0.038 | |
| X1X3 | 0.5023 | 1 | 0.5023 | 0.3548 | 0.5609 | |
| X1X4 | 16 | 1 | 16 | 11.3 | 0.0047 | |
| X2X3 | 0.6233 | 1 | 0.6233 | 0.4402 | 0.5178 | |
| X2X4 | 3.81 | 1 | 3.81 | 2.69 | 0.1232 | |
| X3X4 | 27.43 | 1 | 27.43 | 19.37 | 0.0006 | |
| X12 | 26.59 | 1 | 26.59 | 18.78 | 0.0007 | |
| X22 | 0 | 0 | ||||
| X32 | 0 | 0 | ||||
| X42 | 0 | 0 | ||||
| Residual | 19.82 | 14 | 1.42 | |||
| Lack of fit | 0.0005 | 1 | 0.0005 | 0.0003 | 0.9863 | not significant |
| Pure error | 19.82 | 13 | 1.52 | |||
| Cor total | 1056.15 | 25 | ||||
| SD | 1.19 | R2 | 0.9812 | |||
| Mean | 52.27 | Adjusted R2 | 0.9665 | |||
| C.V.% | 2.28 | Predicted R2 | 0.9345 | |||
| Adequate precision | 25.6342 | |||||
© 2019 by the authors. Licensee MDPI, Basel, Switzerland. This article is an open access article distributed under the terms and conditions of the Creative Commons Attribution (CC BY) license (http://creativecommons.org/licenses/by/4.0/).
Share and Cite
Elgharbawy, A.A.M.; Hayyan, A.; Hayyan, M.; Mirghani, M.E.S.; Salleh, H.M.; Rashid, S.N.; Ngoh, G.C.; Liew, S.Q.; Nor, M.R.M.; bin Mohd Yusoff, M.Y.Z.; et al. Natural Deep Eutectic Solvent-Assisted Pectin Extraction from Pomelo Peel Using Sonoreactor: Experimental Optimization Approach. Processes 2019, 7, 416. https://0-doi-org.brum.beds.ac.uk/10.3390/pr7070416
Elgharbawy AAM, Hayyan A, Hayyan M, Mirghani MES, Salleh HM, Rashid SN, Ngoh GC, Liew SQ, Nor MRM, bin Mohd Yusoff MYZ, et al. Natural Deep Eutectic Solvent-Assisted Pectin Extraction from Pomelo Peel Using Sonoreactor: Experimental Optimization Approach. Processes. 2019; 7(7):416. https://0-doi-org.brum.beds.ac.uk/10.3390/pr7070416
Chicago/Turabian StyleElgharbawy, Amal A. M., Adeeb Hayyan, Maan Hayyan, Mohamed E. S. Mirghani, Hamzah Mohd. Salleh, Shahidah Nusailah Rashid, Gek Cheng Ngoh, Shan Qin Liew, Mohd Roslan Mohd Nor, Mohd Yakub Zulkifli bin Mohd Yusoff, and et al. 2019. "Natural Deep Eutectic Solvent-Assisted Pectin Extraction from Pomelo Peel Using Sonoreactor: Experimental Optimization Approach" Processes 7, no. 7: 416. https://0-doi-org.brum.beds.ac.uk/10.3390/pr7070416