Article

Investigating the Dynamic Impact of CO2 Emissions and Economic Growth on Renewable Energy Production: Evidence from FMOLS and DOLS Tests

by
Muhammad Waris Ali Khan
1,*,
Shrikant Krupasindhu Panigrahi
2,
Khamis Said Nasser Almuniri
2,
Mujeeb Iqbal Soomro
3,
Nayyar Hussain Mirjat
4 and
Eisa Salim Alqaydi
5
1
Faculty of Industrial Management, Universiti Malaysia Pahang, Gambang 26300, Malaysia
2
College of Business, University of Buraimi, Alburaimi, P.O. Box 890, P.C.512, Oman
3
Department of Mechanical Engineering, Mehran University of Engineering & Technology, SZAB Campus, Khairpur 66020, Pakistan
4
Department of Electrical Engineering, Mehran University of Engineering and Technology, Jamshoro 76062, Pakistan
5
Faculty of Health Sciences, DeMontfort University, Leicester LE8 4AA, UK
*
Author to whom correspondence should be addressed.
Submission received: 26 April 2019 / Revised: 27 July 2019 / Accepted: 28 July 2019 / Published: 1 August 2019

Abstract

:
Understanding the dynamic nexus between CO2 emissions and economic growth in the sustainable environment helps the economies in developing resources and formulating apposite energy policies. In the recent past, various studies have explored the nexus between CO2 emissions and economic growth. This study, however, investigates the nexus between renewable energy production, CO2 emissions, and economic growth over the period from 1995 to 2016 for seven Association of Southeast Asian Nations (ASEAN) countries. Fully Modified Ordinary Least Square (FMOLS) and Dynamic Ordinary Least Square (DOLS) methodologies were used to estimate the long- and short-run relationships. The panel results revealed that renewable energy production has a significant long term effect on CO2 emissions for Vietnam (t = −2.990), Thailand (t = −2.505), and Indonesia (t = −2.515), and economic growth impact for Malaysia (t = 2.050), Thailand (t = −2.001), and the Philippines (t = −2.710). It is, therefore, vital that the ASEAN countries implement policies and strategies that ensure energy saving and continuous economic growth without forsaking the environment. This study, as such, recommends that ASEAN countries should take measures to decrease the reliance on fossil fuels for achieving these objectives. Future research should consider the principles of circular economy and clean energy development mechanisms integrated with renewable energy technologies.

1. Introduction

The promotion of sustainable development and combating climate change is altogether an integral and challenging aspect of energy planning and policy development. Over the past decades, global warming has been rising, which has emerged as one of the key challenges that humanity is facing. The increased emissions of greenhouse gases (GHGs), such as carbon dioxide (CO2), methane (CH4), ozone, and nitrous oxide, are causing severe damage to the global environment. Among other greenhouse gases, CO2 emissions are considered as the principal cause of global warming, thereby toppling the climate [1,2,3]. The CO2 emissions due to excessive burning of fossil fuels, such as coal, oil, and gas, along with increased deforestation, have considerably contributed to climate change. There is a great abundance of CO2 in the atmosphere compared to other greenhouse gases and it is estimated rise in the next 100 years [4]. This situation has prompted the consideration and research on the measures to reduce CO2 emissions. One of the key measures to reduce CO2 emissions is to reduce fossil fuel consumption and maintain economic growth by meeting part of the energy needs by harnessing renewable energy sources [3]. In order to substantiate this measure, the literature has sufficiently maintained the establishment of relationships among renewable energy production, CO2 emissions, and economic growth [5,6,7]. However, the higher production cost of renewable energy compared to fossil fuel energy hinders its full-scale commercialization and, hence, has not achieved the much-needed success so far. The researchers are, nevertheless, attempting to establish the much required positive relationship between environmental quality and economic growth [8]. As such, it is essentially required that energy policymakers should come up with robust, sustainable policy endeavors to address the environmental and economic challenges with the effective utilization of renewable energy resources [8]. According to the Environmental Kuznets Curve (EKC) hypothesis [9], income and emissions are directly proportional to the threshold level. In this context, various empirical studies have so far only focused on CO2 emissions as a pollutant in the industrialized world. A review of previous studies in a similar context reveals that there is lack of studies performed on developing countries especially for the Association of Southeast Asian Nations (ASEAN) countries, including the emerging economies of the region, such as Myanmar and Vietnam, see for example [1,4,10,11]. These studies, however, have not produced clarity in their work for neglecting Myanmar and Vietnam as they have only considered five leading ASEAN countries (Malaysia, Thailand, Indonesia, the Philippines, and Singapore) for their past economic growth [10]. As such, the impact of the emerging economies of Myanmar and Vietnam for their renewable energy production has consistently gone unnoticed. As such, in this study, a summary of percentages of renewable energy production, CO2 emissions per capita, and Gross Domestic Product (GDP) per capita for seven selected ASEAN countries for the study period of 1995–2016 is thoroughly analyzed. The panel data plots of the CO2 emissions per capita for ASEAN countries is shown in Figure 1a while the real GDP for the ASEAN countries as shown in Figure 1b indicate that Singapore and Malaysia have been growing consistently from 1995 until 2016. These details signify the importance of the relationships between renewable energy production, CO2 emissions, and the economies for the selected ASEAN countries, which require essential investigations. The dynamic relationship between energy consumption and economic growth has been thoroughly investigated in the past few decades [12]. However, the impact of harnessing renewable energy on the reduction of CO2 emissions and thereby bringing about sustainable economic growth has been overlooked by previous studies. It is pertinent to mention that renewable energy resources are now emerging as the mainstream sources of energy in various developed economies and co-operative ownership of these resources has also increased and expanded rapidly in the past few years. The contribution of low growing economies like Myanmar and Vietnam towards renewable energy production, as shown in Figure 1c, has been consistently unnoticed [12].
Given the above facts, the main objective of this study is to investigate the impact of renewable energy production on CO2 emissions and economic growth for seven ASEAN countries from 1995 to 2016. This objective is achieved by employing a panel co-integration technique that followed the growth model framework. Furthermore, an attempt has been made to validate the EKC hypothesis for the selected seven ASEAN countries using panel data analysis with an approach of co-integration and Granger causality tests. The consistency of the results was assured by the inclusion of each country, thereby analyzing the environmental complexities in the respective countries. The country-specific investigation helped to merge the complexities of renewable energy production, the CO2 emission relationship, and economic growth nexus, which has been ignored in previous studies. As such, contrary to previous studies, this study explored the causality relationships among renewable energy production, CO2 emissions, and economic growth.

ASEAN Countries as the Context

Historically, the consumption and reliance on fossil fuels in ASEAN countries have been generally on the rise [13]. ASEAN countries are experiencing the world’s most significant jump and are considered as regions vulnerable to causing climate change [14]. Every decade, since 1960, the average temperature in the Southeast Asian region has risen, which has adversely added to climate change. The economic progress of five of the ASEAN countries: Malaysia, Indonesia, the Philippines, Singapore, and Thailand, is commendable compared to the other two [4]. Nevertheless, Vietnam and Myanmar have shown the highest renewable energy production among the other regional counties. As such, these two developing economies of ASEAN, for renewable energy initiatives, were also included in this study. It is pertinent to mention that 57% of the total electricity production in Myanmar has been based on its indigenous hydropower resources, thereby tackling, effectively, the emission of greenhouse gases [15]. Moreover, Myanmar, together with Vietnam, has also focused on implementing the climate-resilient de-carbonization pathways, thus assuring its significance in the renewable energy market. It is estimated that Myanmar can further install electricity plants of 104,000 MW capacity based on the wind and hydropower plants and that it can produce another 40 TWh/year (TWh/year stands for terawatt-hour per year) from solar power plants [16]. As per a World Bank Database report (2016), Singapore (98%), the Philippines (46%), Thailand (42%), and Cambodia (33%) were the four major energy-importing ASEAN countries [17]. Meanwhile, other countries like Brunei, Indonesia, Myanmar, and Vietnam are well-known energy resource exporters. In most of the ASEAN countries, renewable energy resources are abundant and are sufficiently consumed, such as in Indonesia, Malaysia, Thailand, and Vietnam [18]. As such, these countries with the further harnessing of renewable energy resources can significantly reduce greenhouse gas emissions. On the other hand, Singapore being a highly urbanized and energy-intensive nation (Figure 1a), aims at reducing its emissions by 7%–11% by 2020 using urban renewable energy applications [19]. The environmental quality in many large ASEAN cities has also considerably declined, which is alarming, and thus requires the development of appropriate energy strategies.
The leading contributors of greenhouse gas emissions in the ASEAN counties are the cement industry, palm oil, and chemical plants, petroleum refineries, power generating plants, and wood-based industries [20]. In general, almost 90% of the energy requirements of ASEAN economies are fulfilled by fossil fuels [21]. The electricity generation using these fossil fuels is one of the key processes which results in GHG emissions. Apart from urbanization, rapid industrialization over the past decades has also caused enormous demands and consumption of electricity which, being produced from fossil fuels, has caused an environmental imbalance. Energy consumption in the selected ASEAN countries of this study grew by 261 Million Tons of Oil Equivalent (MTO) throughout 1990–2013, and the majority of this consumption was attributed to Indonesia, Malaysia, Thailand, and Vietnam [22]. The leading contributors for CO2 emissions among ASEAN countries include Malaysia and Singapore for their rapid economic growth. It has been documented that the air quality in the capital cities of ASEAN countries, such as Bangkok, Jakarta, Kuala Lumpur, and Manila has severally deteriorated and is very poor, which is unhealthy for human beings [23]. This poor air quality in the environment can be attributed to the booming industrialization in the ASEAN countries, causing irreversible environmental damage. It is quite evident that the major industrial processes utilize non-renewable fossil fuels as their primary energy source, releasing a high amount of greenhouse gases (carbon dioxide, methane, nitrous oxide, etc.) in the surrounding environment. Moreover, some industries, such as palm oil production plants, release highly hazardous and toxic effluents in the nearby water bodies, considerably affecting the water quality and its inhabitant’s survival. It is, therefore, essential to investigate and develop innovative techniques which suggest harnessing renewable and environmentally friendly energy fuels on a large scale. This study employed panel cointegration and causal relationships among renewable energy production, CO2 emissions, and economic growth for seven key ASEAN countries for the period of 1995–2016. The recently developed Fully Modified Ordinary Least Square (FMOLS) testing approach and Granger causality tests were used to achieve the objective of this study.
The following section of the paper further provides an insight into renewable energy production, CO2 emissions, and economic relationship analysis under this study for the selected ASEAN countries of this study.

2. Review of the Literature

The fourth industrial revolution has transformed various aspects of the industry, such as super-computing, cellular phones, robot intelligence, self-driving cars, genetic editing, and much more happening around us at an exponential speed. It is apparent that all fields of knowledge will be further revolutionized by future technologies in the next 50 years. The energy sector, therefore, has also somewhat adjusted to these changes and requires essential efforts to transform and diversify energy sources to increase energy security and reliability while reducing GHG emissions. Conservation of energy is also one of the essential aspects that the economies need to undertake to cope with climate change. In particular, with respect to mitigation efforts to contain climate change, there has been increased attention on improving energy efficiency worldwide, which can effectively reduce the energy demand [24,25]. As such, with the conservation measures realized, the consumption of energy in the future is likely to lower at 1.3% compared to 2.2% per annum during 1995–2015 [26]. However, China and India are the leading, fast-growing, and emerging economies have now almost accounted for over half of the increased global energy demand [27]. More energy will also be required for the economic growth of developing countries. It is anticipated that electricity generation capacity will grow to 90% by 2040, and around 80% of this will be from developing countries [28]. Over the next 20 years, it is also expected that energy supply growth will be sufficiently contributed by the renewable source together with nuclear and hydroelectric power. This anticipated situation is likely to help in offsetting GHG emissions. In 2016, the top CO2 emitters were China, India, Japan, Russia, and the United States, whereas the European nations were the top contributors to renewable power generation. However, the pace of the transition to a lower-carbon economy is insignificant and uncertain without key initiatives by leading GHG emitting countries in the future. It is anticipated that the speeding up of the said transition will also significantly impact future economic growth. It is, therefore, expected that by 2035, non-fossil fuels and renewables will form a greater share of the overall rising energy mix. It is also anticipated that natural gas will grow twice the rate of oil and coal in the future, but the demand could be slower if coal consumption is not prioritized appropriately [29].
Various studies [30,31] have been alarmed that GHGs and, in particular, CO2 adversely impact human activities and thus, hamper the natural ecosystem globally. Climate change and energy problems have deeply threatened mankind and their sustainable existence. Globally, the intensity of primary energy declined continuously by 30% between 1990 and 2014. Nevertheless, the global economic growth was better, resulting in a steady net growth in energy demand of 56% between 1990 and 2014 with an annual growth of 1.9% [32]. In some recent studies, the relationship between renewable energy consumption and economic growth has been investigated. In studies which examined the energy consumption of EU countries throughout 1992–2010, [33,34], using the residual cointegration test, it was established that, on average, a 1% increase in energy consumption per capita increased per capita emissions by 0.56%. A group of studies in the literature has also prioritized the economic growth and environmental pollution nexus under the EKC framework. The use of the EKC hypothesis explains the relationships between natural resources, economic growth, and pollutant emissions. Kuznets [35] hypothesized that income inequality increases to a certain level and then falls with an increased income per capita. Various studies have focused on validating the EKC hypothesis (see for example [36,37,38]). The main focuses of these studies have been to validate the EKC hypothesis. However, there are other groups of studies in the literature which contradict the EKC hypothesis (see for example [39,40]). There are some other studies which validate the EKC hypothesis, too [33,41,42]. Based on the contradiction of the confirmation of the EKC hypothesis, this study contributes to validating the EKC hypothesis by examining broader literature in detail. For a review of the extensive literature on the causal relationship between energy consumption and economic growth see [20,43,44]. A summary of studies which employed the empirical linkage of CO2 emissions, economic growth, and the energy consumption is provided in (Table 1) with the econometric method utilized by each of these studies. A review of these studies reveals that there has been a variance in the usage of the specific econometric method. Regarding the findings, some studies suggested that CO2 emissions had a negative impact on the GDP, whereas energy consumption increased the CO2 emissions [45].
It was apparent from the review of the literature, wherein the complex relationships among CO2 emissions, economic growth, energy consumption, and other factors had been studied, that the evidence is still inconclusive. Furthermore, the evidence of the pollution heaven hypothesis was also limited. However, limited research efforts were the only evidence about the promotion of renewable energy sources as alternatives to fossil fuels to reduce CO2 emissions and achieve economic growth. Finally, most of these studies utilized the panel data analysis and lack usage of extensive evidence on long-run relationships among the investigated variables.

3. Methodology

In the context of exploring the relationships among renewable energy production, CO2 emissions, and the associated economic growth, this study employed the FMOLS model, [55], DOLS regression analysis [56], and Granger causality analysis, among others, using renewable energy production, CO2 emissions, and economic growth as variables in the empirical model.

3.1. Empirical Model

The empirical model developed in this study examined the relationships among renewable energy production ( R W t ), CO2 emissions ( C O 2 t ), and economic growth (Gt) for seven ASEAN countries: Indonesia, Malaysia, Myanmar, the Philippines, Singapore, Thailand, and Vietnam. The methodology employed for the model development was similar to earlier studies [10,11,33]. However, the parameters of this study differed from those studies.
It is an essential and well-realized fact that an effective economic policy formulation requires a better understanding of various interconnections in the economy, including the nexus among renewable energy production (dependent variable), CO2 emissions, and economic growth. The empirical model representing the long-run relationships among these interconnections as variables is given in Equation (1) as follows:
R W i t = π 0 t + π 1 C O 2 i t + π 2 G D P i t + ε i t .
Here, R W t was the renewable energy production at time t, and for the specific country it was represented by i; C O 2 i t was the carbon dioxide emission in kilotons at time t, and for the specific country it was represented by i; G D P i t was the real G D P per capita at time t and for the specific country it was represented as i; and ε i t was the residual at time t and for the specific country it was represented as i. It was assumed that these variables were normally distributed. The long-term beta coefficient for CO2 emissions and economic growth were π 1 and π 2 respectively. Since the study was based on panel data, as such, the long-run panel cointegration specifications applied in previous studies [57,58] were employed. The error term ε t was assumed to be identically distributed. Finally, the signs for π 1 and π 2 were expected to be negative.

3.2. Econometric Methodology

The determination of the long-run relationships among renewable energy production, CO2 emissions, and economic growth was undertaken in this study with the essential steps described as follows. Firstly, the stationarity properties of the panel data set variables were examined using panel unit root tests. When the data was non-stationary, the panel cointegration technique was generally used to test the co-integrating relationships in the variable series. Once the cointegration of the variables was confirmed, the long-run elasticities were estimated using the Fully Modified OLS (also known as FMOLS) test. In the third and final steps, the short- and long-run dynamics of the series were examined using panel error correction models.

3.2.1. Panel Unit Root Tests

The panel unit root tests were performed to analyze the stationarity variable with the null hypothesis of a series having a unit root. It was imperative to detect the issue of spurious correlations. The series was assumed using the intercept, constant, and trend. The equations for the series are provided in the following relationships in Equations (2)–(9) as follows:
Without constant and trend
Y i t = δ Y i t 1 + μ i t .
With Constant
Y i t = α + δ Y i t 1 + μ i t .
With constant and trend
Y i t = α + β T + δ Y i t 1 + μ i t .
H0: = δ = 0 (Unit Root)
H1: = δ 0
After the first differencing (∆) of the series, the stationarity had to be achieved [59]. The most commonly used unit root tests, which are currently in practice, are Levin and Lin (LL), Im–Pesaran–Shin (IPS) and Maddala Wu (MW) [60]. Of the three popular unit root tests, LL has not been used widely in practice due to the unrealistic nature of the hypothesis. The model developed by Im, Pesaran [61] was used in this study as below:
y i , t = β i + γ i y i , t 1 + ε i , t .
For all i = 1, …, N and t = 1, 2, 3, …, T
The study performed four different unit root tests; namely, the Phillips–Perron (PP), Augmented Dicker Fuller (ADF), Levin Liu Chu (LLC) and Im–Pesaran–Shin (IPS). The IPS and LLC were used to complement the widely used ADF and PP tests to arrive at the robust results. Further, in order to choose the optimal lag, the study used the Barlett Kernel Method following [62] for the estimation.

3.2.2. FMOLS Estimator

The Fully Modified Least Square (FMOLS) was developed by Phillips and Hansen [63] in order to administer an optimal co-integrating regression estimation. However, the study used the Pedroni [64] heterogeneous FMOLS estimator for the panel cointegration regression as it has the advantage of correcting endogeneity bias and serial correlation [44]. According to Hamit-Haggar [65], FMOLS is the most suitable technique for the panel, which includes heterogeneous cointegration.
Considering that a panel FMOLS estimator for the coefficient β of model 1 was:
β N T * β = ( i = 1 N L 22 i 2 i = 1 T ( χ i t χ ¯ i t ) 2 )   i = 1 N L 11 i 1 L 22 i 1   ( i = 1 T ( χ i t χ i ¯ ) μ i t T γ i ^ ) ,
where,
μ i t = μ i t L ^ 21 i L ^ 22 i Δ χ i t ,   γ ^ i = Γ ^ 21 i Ω ^ 21 i 0 L ^ 21 i L ^ 22 i   ( Γ ^ 22 i + Ω ^ 22 i 0 ) ,
and L ^ i was the lower triangulation of Ω ^ i .
The Dynamic OLS estimator had the same asymptotic distribution as that of the panel FMOLS estimation derived by Pedroni [66]. Both the DOLS and FMOLS estimations were performed as shown to confirm the consistency of the outcome.

3.2.3. Granger Causality Test

According to the cointegration theory, if the variables are co-integrated, then the short- and long-run equilibrium can be described using an error correction model (ECM). The panel residual cointegration test confirmed that renewable energy production, CO2 emissions, and economic growth had co-integrating relationships. However, the co-integrating relationships were unable to provide information on the direction. Therefore, a panel-based error correction model with error correction representation was used to investigate the short- and long-run causal relationships. The Granger causality test was performed within the Vector Error Correction Model (VECM) framework [67]. The Granger causality test, together with the error correction term (ECT), is stated as follows:
R W i t = 0 + i = 1 p 1 i C O 2 t 1 + i = 1 p 2 i G D P t 1 + i = 1 p 3 i R W t 1 + ρ 1 ϵ t 1 + μ 1 t
C O 2 i t = 0 + i = 1 p 1 i C O 2 t 1 + i = 1 p 2 i G D P t 1 + i = 1 p 3 i R W t 1 + ρ 2 ϵ t 1 + μ 2 t ,
G D P i t = 0 + i = 1 p 1 i C O 2 t 1 + i = 1 p 2 i G D P t 1 + i = 1 p 3 i R W t 1 + ρ 3 ϵ t 1 + μ 3 t ,
where, ∆ and ρ denote the first difference operator and lag structure. The residuals ( μ 1 , μ 2 , μ 3 , μ 4   and   μ 5 ) were assumed to be serially independent with a zero mean and ϵ t 1 was the one period lagged error correction term.

4. Statistical Results

The study used the dataset over the period from 1995 to 2016 extracted from the World Development Indicators (WDI). A total of seven ASEAN countries were selected for the study.
Table 2 provides a summary of the statistics (mean, standard deviation, minimum, and maximum) associated with the CO2 emissions per capita for an individual country with the panel set throughout 1995–2016. The mean value for the CO2 emissions per capita was in the range of between 0.2362 in Myanmar and 9.8729 in Singapore. As regarding the GDP per capita, Myanmar showed the least GDP mean value of 710.8, whereas Singapore achieved the highest GDP per capita of 40,232.7. However, concerning renewable energy production, Myanmar exhibited surplus production with a mean value of 79.87%, whereas Singapore was the least renewable energy producer with only 0.51%.
It was further determined that the mean value of renewable energy production was high in low-income countries, such as Myanmar, followed by middle- and high-income countries. For both the energy variables (CO2 emissions and renewable energy production), it can be conferred that the low-income countries were more volatile with the highest coefficients of variations.
This study investigated the dynamic relationships among renewable energy production, CO2 emissions, and economic growth over the period of 1995–2016 from a panel of seven ASEAN countries. In this context, the EKC hypothesis was employed using panel cointegration estimation methods. In the first step, to tackle homogeneity issues, the study used the unit root test as suggested by [61] for a cointegration modeling process. Once it was confirmed that there was no homogeneity issue and the variables were in the order of interest, a test of the cointegration was examined to know whether the variables were co-integrated or not [58].
The panel unit root tests undertaken in this study are provided in Table 3. The validity of the EKC hypothesis for the ASEAN countries was examined using a bivariate framework. In [68] it was argued that testing for cointegration is crucial to determine the appropriateness of the model, together with verifying the causal relationships. The study employed the Augmented Dickey Fuller (ADF) unit root test to check the integration of each series. Table 3 reports the results of the ADF test at the level and first difference. At the 1% significance level, the study found that there was no stationarity issue for any of the variables. Thus, the study proceeded to examine the presence of cointegration among renewable energy production, CO2 emissions, and economic growth. The results also indicated that the series for each country was not spurious and had a unit root. Thus, it can be concluded that the panel data variables were characterized as I (1) process.
The residual cointegration results are provided in Table 4 as suggested by [64,69]. The statistical results found that the majority of the tests were significant and, therefore, the null hypothesis of having no cointegration was not established. Thus, the variables were co-integrated at significant levels.
Finally, the Pedroni [64] FMOLS estimator was selected to determine the long-run relationships among the constructs. The long-run results of the FMOLS estimation for the model are provided in (Table 5) is considered in this study.
The long-run elasticities were interpreted for all the variables which were expressed in natural logarithms. The study used the FMOLS as a robustness test. The first and second differences of the variables were all stationary as provided in Table 3. The quadratic term of per capita renewable energy production was used to record a possible country-specific non-linear relationship between per capita CO2 emissions and per-capita GDP. The main result confirmed the significant inverse relationship between CO2 emissions and real GDP for countries like Malaysia and Singapore; whereas, there was a positive relationship between CO2 emissions and real GDP for Myanmar. This result indicated that in the long run, the EKC hypothesis was justified. An increase of 1% in CO2 emissions would lead to a decrease in real GDP per capita by 0.08% for Malaysia and 0.11% for Singapore. The results of this study were duly in line with the other literature findings (see for example [1,70]). The results further indicated that the coefficients of renewable energy production were statistically significant and negative, indicating a nonlinear relationship with per capita CO2 emissions and per capita GDP in the sampled ASEAN countries considered in this study.
The inverse U-shaped relationships between per capita renewable energy production and per capita GDP were detected from the sign of the parameters. However, the long-run estimations provided in Table 5 did not provide the direction of causality among the variables. The results also indicated that there were negative relationships between per capita renewable energy production and per capita CO2 emissions for Indonesia, Malaysia, Myanmar, and Vietnam. These results were also supported by the previous literature [46,72]. In the globalization era, with the rapid increase in demand for energy and cleanup of the environment, there is a need for renewable energy sources as an alternative [47].
Next, by employing the FMOLS estimator, proposed by Pedroni [64], and the single equation DOLS estimator, proposed by Phillips and Loretan [73], the U-shaped relationship among renewable energy production, CO2 emissions, and economic growth was supported and realized by the EKC hypothesis. The FMOLS and DOLS results provided in Table 5 show the parameter estimation of the model for interpreting long-run elasticities. Hence, it can be stated that renewable energy production decreased with economic growth, stabilized, and then, gradually increased. The country-specific income-energy elasticities using FMOLS and DOLS confirmed the statistical significance at 5% for the long-run relationships among the variables. Furthermore, the country-specific long-run analysis demonstrated U-shaped curves for three countries, namely, Malaysia, Thailand, and the Philippines. On the other hand, there was no significant relationship found between renewable energy production and economic growth for the four remaining ASEAN countries of this study.
This research also analyzed the results using the Granger causality panel error correction model to identify the direction of the long-run and short-run causalities in the renewable energy production, CO2 emissions, and economic growth nexus and the interactions among them. The error correction model estimation result indicated the presence of unidirectional causality between renewable energy production and CO2 emissions. However, in the applied research, it is obviously of interest to know the response of one variable to an impulse in another variable [74]. From the Granger causality, it was noticed that there were high but negative correlations among renewable energy production, CO2 emissions, and economic growth. This indicated that innovation in renewable energy production would possess high effects on CO2 emissions and economic growth. As such, increasing renewable energy production would gradually decrease the CO2 emissions together with slowly contributing to economic growth in the long run. In the initial stages of renewable energy production, the minor pressure on the GDP may be explained by the additional production cost imposed by the renewable energy sources and their plant setups.
The study explored the causal relationship between the constructs using error correction Granger Causality test for short run Granger causality. The results for Granger causality model (see Table 6) can be summarized as:
(i)
Real GDP per capita does not cause carbon emissions per capita for Myanmar, Thailand, Vietnam, Indonesia, the Philippines, and Singapore except for Malaysia.
(ii)
It was found that renewable energy production Granger causes real GDP per capita for Myanmar, Indonesia, and the Philippines only; whereas it was also found that renewable energy production Granger causes carbon emissions per capita for Myanmar and Vietnam only.
(iii)
There is no causal evidence between carbon emissions per capita and real GDP per capita for all the ASEAN countries; whereas only in Thailand, there was a causal relationship between carbon emissions and renewable energy production.
Therefore, from the overall results, it can be concluded that (1) energy conservation policies have no adverse effect on climate change and GDP growth of the ASEAN countries and (2) controlling carbon emissions has no adverse effect on real GDP per capita of the ASEAN countries. Figure 2 summarizes the interactions among renewable energy production, CO2 emissions, and economic growth developed from the findings provided in Table 6.
The results corroborated the three-way link among renewable energy production, CO2 emissions, and economic growth. Our results suggest that an increase in renewable energy usage and production will diminish CO2 emissions, leading to clean economic growth as per the Granger causality test. Our result rejects the neoclassical assumption that energy is neutral to economic growth. Thus, this study considers renewable energy to be the most critical determinant in the long run to economic growth and vice versa. It is very crucial to take into account the adverse effect of CO2 energy consumption on economic growth in establishing energy conservation policies.

5. Conclusions and Policy Implications

This study examined the cointegration and causal relationships among renewable energy production, CO2 emissions, and economic growth for the ASEAN countries, namely, Malaysia, Myanmar, Thailand, Vietnam, Indonesia, the Philippines, and Singapore for the period 1995–2016. The FMOLS and DOLS analyses were undertaken to examine whether, in the long run, renewable energy production, CO2 emissions, and economic growth were co-integrated or not. The FMOLS results suggest that renewable energy production was positive and significant in relation to real GDP at the 0.001 level for Malaysia (t value of 2.050) and for Myanmar (t value of 2.845), whereas there was a negative and significant relationship between renewable energy production and real GDP for Thailand (t value of −2.505) and the Philippines (t value of −2.710). There was no relationship between renewable energy production and real GDP for Singapore, Indonesia, and Vietnam due to limited renewable energy options. The results of the panel FMOLS and DOLS also provided significant shreds of evidence to support U-Shaped relationships among the long-run renewable energy production, CO2 emissions, and economic growth contrary to the EKC hypothesis. The empirical results from the granger causality test (Table 6) also revealed the substantial negative nexus between renewable energy production and CO2 emissions.
Estimation of a panel error correction model (ECM) was performed in order to define the long-run and short-run causalities. The results from the ECM indicated the presence of short-run unidirectional causality running from renewable energy production to economic growth. Whereas, in the long-run causalities, renewable energy production and CO2 emissions were inversely related, thus confirming that an increase in the usage of renewable energy sources as an alternative to fossil fuels will offset CO2 emissions. Besides, carbon footprints can be reduced, leading to clean energy development and economic growth. The results, therefore, implied that the efficient use of renewable energy would reduce the rate of GHG emissions in the long run.
The precedent literature, as presented in the earlier sections of the study, have generally found a positive relationship between energy consumption and CO2 emissions; however, there is a lack of studies which performed the relationship analysis of renewable energy production and CO2 emissions. As a novelty, this research gap was addressed and found the overall relationship between renewable energy production and CO2 emissions, which came to be negative. The relationship between renewable energy production and CO2 emissions for Malaysia, Thailand, Vietnam, Indonesia, and Singapore were found to be inverse in the short run. This showed that an increase in renewable energy production would lead to a reduction in CO2 emissions. Even though, renewable energy is expensive as compared to fossil fuels or other non-renewable sources, the initiatives to produce and consume more renewable energy should be focused on in developed and developing countries, like in Singapore and Malaysia, to contain climate change by reducing environmental pollution.
The rapid growth in the renewable energy production can be driven by many factors, including cost reduction due of renewable energy technologies, dedicated policy initiatives, better access to energy resources, environmental concerns, and growing energy demand of emerging economies. Effective energy policies, therefore, can play a significant role in providing energy consumption direction and in increasing public awareness. The pedagogical innovation, therefore, suggests accelerating the renewable energy usage campaigns in the high carbon emission countries like Malaysia and Singapore for a more environmentally-friendly and sustainable future. The renewable energy sources like hydropower, solar power, wind energy, biomass, and geothermal energy would significantly condense the pollution and reduce the reliance on fossil fuels, which are the leading causes of the CO2 emissions.
As a practical implication, energy saving and conservation policies can be adopted by the ASEAN countries quickly in order to limit environmental pollution. It is crucial that the ASEAN countries, especially Malaysia and Singapore, implement policies and strategies that ensure continuous economic growth without forsaking the environment. This study recommends that in order to decrease the reliance on fossil fuels, that have impacted the environment adversely, future research should consider and focus on the principles of the circular economy and clean energy development mechanisms integrated with renewable energy technologies.

Author Contributions

All authors contributed to this study. M.W.A.K. and S.K.P. formulated the study design. M.W.A.K., S.K.P., M.I.S. and N.H.M. conceived and designed the research methodology. M.W.A.K., S.K.P., K.S.N.A., M.I.S. and E.S.A. collected and analyzed the data. M.W.A.K., S.K.P. and N.H.M. finalized the paper.

Funding

The authors would like to acknowledge the financial support by Universiti Malaysia Pahang under the FRGS Grant, i.e., RDU170134, for this research work.

Acknowledgments

The authors highly acknowledge the Ministry of Higher Education Malaysia for the Fundamental Research Grant Scheme (FRGS) under grant No. RDU170134 and Universiti Malaysia Pahang for their financial and technical support for completing this research work.

Conflicts of Interest

The authors declare no conflict of interest.

References

  1. Heidari, H.; Katircioglu, S.T.; Saeidpour, L. Economic growth, CO2 emissions, and energy consumption in the five ASEAN countries. Int. J. Electr. Power Energy Syst. 2015, 64, 785–791. [Google Scholar] [CrossRef]
  2. Zhang, X.-P.; Cheng, X.-M. Energy consumption, carbon emissions, and economic growth in China. Ecol. Econ. 2009, 68, 2706–2712. [Google Scholar] [CrossRef]
  3. Mengal, A.; Mirjat, N.H.; Das Walasai, G.; Khatri, S.A.; Harijan, K.; Uqaili, M.A. Modeling of Future Electricity Generation and Emissions Assessment for Pakistan. Processes 2019, 7, 212. [Google Scholar] [CrossRef]
  4. Lean, H.H.; Smyth, R. CO2 emissions, electricity consumption and output in ASEAN. Appl. Energy 2010, 87, 1858–1864. [Google Scholar] [CrossRef]
  5. Chang, C.-C. A multivariate causality test of carbon dioxide emissions, energy consumption and economic growth in China. Appl. Energy 2010, 87, 3533–3537. [Google Scholar] [CrossRef]
  6. Dhakal, S. Urban energy use and carbon emissions from cities in China and policy implications. Energy Policy 2009, 37, 4208–4219. [Google Scholar] [CrossRef]
  7. Fei, L.; Dong, S.; Xue, L.; Liang, Q.; Yang, W. Energy consumption-economic growth relationship and carbon dioxide emissions in China. Energy Policy 2011, 39, 568–574. [Google Scholar] [CrossRef]
  8. Hussain, N. Development of Energy Modeling and Decision Support Framework for Sustainable Electricity System of Pakistan; Mehran University of Eng. & Technology: Jamshoro, Pakistan, 2019. [Google Scholar]
  9. Panayotou, T. Demystifying the environmental Kuznets curve: Turning a black box into a policy tool. Environ. Dev. Econ. 1997, 2, 465–484. [Google Scholar] [CrossRef]
  10. Chandran, V.; Tang, C.F. The impacts of transport energy consumption, foreign direct investment and income on CO2 emissions in ASEAN-5 economies. Renew. Sustain. Energy Rev. 2013, 24, 445–453. [Google Scholar] [CrossRef]
  11. Saboori, B.; Sulaiman, J. CO2 emissions, energy consumption and economic growth in Association of Southeast Asian Nations (ASEAN) countries: A cointegration approach. Energy 2013, 55, 813–822. [Google Scholar] [CrossRef]
  12. Omri, A.; Daly, S.; Rault, C.; Chaibi, A. Financial development, environmental quality, trade and economic growth: What causes what in MENA countries. Energy Econ. 2015, 48, 242–252. [Google Scholar] [CrossRef]
  13. Vilaysouk, X.; Schandl, H.; Murakami, S. Improving the knowledge base on material flow analysis for Asian developing countries: A case study of Lao PDR. Resour. Conserv. Recycl. 2017, 127, 179–189. [Google Scholar] [CrossRef]
  14. IMF. Boiling Point. Finance & Development 2018. Available online: https://www.imf.org/external/pubs/ft/fandd/2018/09/southeast-asia-climate-change-and-greenhouse-gas-emissions-prakash.htm (accessed on 15 July 2019).
  15. Chan, S.K.-L. Dams on a Myanmar—Thai transboundary river: Unequal hydropower exchange model in critical hydropolitical perspective. Int. J. Dev. Issues 2017, 16, 147–160. [Google Scholar] [CrossRef]
  16. Amara, T. Where Will Myanmar’s Energy Come From? Available online: https://thediplomat.com/2017/08/where-will-myanmars-energy-come-from (accessed on 19 January 2019).
  17. Worldbank. World Development Indicators 2016. 2016. Available online: http://documents.worldbank.org/curated/en/805371467990952829/World-development-indicators-2016 (accessed on 19 January 2019).
  18. Chang, T.; Fang, W.; Wen, L.-F. Energy consumption, employment, output, and temporal causality: Evidence from Taiwan based on cointegration and error-correction modelling techniques. Appl. Econ. 2001, 33, 1045–1056. [Google Scholar] [CrossRef]
  19. Karthikeya, B.; Negi, P.S.; Srikanth, N. Wind resource assessment for urban renewable energy application in Singapore. Renew. Energy 2016, 87, 403–414. [Google Scholar] [CrossRef]
  20. Daniel, G.R.; Wang, C.; Berthelsen, D. Early school-based parent involvement, children’s self-regulated learning and academic achievement: An Australian longitudinal study. Early Child. Res. Q. 2016, 36, 168–177. [Google Scholar] [CrossRef]
  21. Karki, S.K.; Mann, M.D.; Salehfar, H. Energy and environment in the ASEAN: Challenges and opportunities. Energy Policy 2005, 33, 499–509. [Google Scholar] [CrossRef]
  22. Schernikau, L. Economics of the International Coal Trade: Why Coal Continues to Power the World; Springer: Berlin/Heidelberg, Germany, 2017. [Google Scholar]
  23. Lee, H.-H.; Bar-Or, R.Z.; Wang, C. Biomass burning aerosols and the low-visibility events in Southeast Asia. Atmos. Chem. Phys. Discuss. 2017, 17, 965–980. [Google Scholar] [CrossRef] [Green Version]
  24. Riahi, K.; Van Vuuren, D.P.; Kriegler, E.; Edmonds, J.; O’Neill, B.C.; Fujimori, S.; Bauer, N.; Calvin, K.; Dellink, R.; Fricko, O.; et al. The Shared Socioeconomic Pathways and their energy, land use, and greenhouse gas emissions implications: An overview. Glob. Environ. Chang. 2017, 42, 153–168. [Google Scholar] [CrossRef] [Green Version]
  25. Mirjat, N.H.; Uqaili, M.A.; Harijan, K.; Das Walasai, G.; Mondal, M.A.H.; Sahin, H. Long-term electricity demand forecast and supply side scenarios for Pakistan (2015–2050): A LEAP model application for policy analysis. Energy 2018, 165, 512–526. [Google Scholar] [CrossRef]
  26. Berardi, U. A cross-country comparison of the building energy consumptions and their trends. Resour. Conserv. Recycl. 2017, 123, 230–241. [Google Scholar] [CrossRef]
  27. Nejat, P.; Jomehzadeh, F.; Taheri, M.M.; Gohari, M.; Majid, M.Z.A. A global review of energy consumption, CO2 emissions and policy in the residential sector (with an overview of the top ten CO2 emitting countries). Renew. Sustain. Energy Rev. 2015, 43, 843–862. [Google Scholar] [CrossRef]
  28. Soytas, U.; Sari, R.; Ewing, B.T. Energy consumption, income, and carbon emissions in the United States. Ecol. Econ. 2007, 62, 482–489. [Google Scholar] [CrossRef]
  29. Ang, J.B. Economic development, pollutant emissions and energy consumption in Malaysia. J. Policy Model. 2008, 30, 271–278. [Google Scholar] [CrossRef]
  30. Ozcan, B.; Tzeremes, P.G.; Tzeremes, N.G. Energy consumption, economic growth and environmental degradation in OECD countries. Econ. Model. 2019. [Google Scholar] [CrossRef]
  31. Acheampong, A.O. Economic growth, CO2 emissions and energy consumption: What causes what and where? Energy Econ. 2018, 74, 677–692. [Google Scholar] [CrossRef]
  32. Jalil, A.; Feridun, M. The impact of growth, energy and financial development on the environment in China: A cointegration analysis. Energy Econ. 2011, 33, 284–291. [Google Scholar] [CrossRef]
  33. Kasman, A.; Duman, Y.S. CO2 emissions, economic growth, energy consumption, trade and urbanization in new EU member and candidate countries: A panel data analysis. Econ. Model. 2015, 44, 97–103. [Google Scholar] [CrossRef]
  34. Dogan, E.; Seker, F. Determinants of CO2 emissions in the European Union: The role of renewable and non-renewable energy. Renew. Energy 2016, 94, 429–439. [Google Scholar] [CrossRef]
  35. Balsalobre-Lorente, D.; Shahbaz, M.; Roubaud, D.; Farhani, S. How economic growth, renewable electricity and natural resources contribute to CO2 emissions? Energy Policy 2018, 113, 356–367. [Google Scholar] [CrossRef]
  36. Begum, R.A.; Sohag, K.; Abdullah, S.M.S.; Jaafar, M. CO2 emissions, energy consumption, economic and population growth in Malaysia. Renew. Sustain. Energy Rev. 2015, 41, 594–601. [Google Scholar] [CrossRef]
  37. Adu, D.T.; Denkyirah, E.K. Economic growth and environmental pollution in West Africa: Testing the Environmental Kuznets Curve hypothesis. Kasetsart J. Soc. Sci. 2018. [Google Scholar] [CrossRef]
  38. Rasli, A.M.; Qureshi, M.I.; Isah-Chikaji, A.; Zaman, K.; Ahmad, M. New toxics, race to the bottom and revised environmental Kuznets curve: The case of local and global pollutants. Renew. Sustain. Energy Rev. 2018, 81, 3120–3130. [Google Scholar] [CrossRef]
  39. Ozatac, N.; Gokmenoglu, K.K.; Taspinar, N. Testing the EKC hypothesis by considering trade openness, urbanization, and financial development: The case of Turkey. Environ. Sci. Pollut. Res. 2017, 24, 16690–16701. [Google Scholar] [CrossRef] [PubMed]
  40. Twerefou, D.K.; Adusah-Poku, F.; Bekoe, W. An empirical examination of the Environmental Kuznets Curve hypothesis for carbon dioxide emissions in Ghana: An ARDL approach. Environ. Socio-Econ. Stud. 2016, 4, 1–12. [Google Scholar] [CrossRef]
  41. Alam, M.M.; Murad, M.W.; Noman, A.H.M.; Ozturk, I. Relationships among carbon emissions, economic growth, energy consumption and population growth: Testing Environmental Kuznets Curve hypothesis for Brazil, China, India and Indonesia. Ecol. Indic. 2016, 70, 466–479. [Google Scholar] [CrossRef]
  42. Al-Mulali, U. The impact of biofuel energy consumption on GDP growth, CO2 emission, agricultural crop prices, and agricultural production. Int. J. Green Energy 2015, 12, 1100–1106. [Google Scholar] [CrossRef]
  43. Omri, A. CO2 emissions, energy consumption and economic growth nexus in MENA countries: Evidence from simultaneous equations models. Energy Econ. 2013, 40, 657–664. [Google Scholar] [CrossRef]
  44. Özcan, B. The nexus between carbon emissions, energy consumption and economic growth in Middle East countries: A panel data analysis. Energy Policy 2013, 62, 1138–1147. [Google Scholar] [CrossRef]
  45. Mi, Z.-F.; Pan, S.-Y.; Yu, H.; Wei, Y.-M. Potential impacts of industrial structure on energy consumption and CO2 emission: A case study of Beijing. J. Clean. Prod. 2015, 103, 455–462. [Google Scholar] [CrossRef]
  46. Saidi, K.; Hammami, S. The impact of CO2 emissions and economic growth on energy consumption in 58 countries. Energy Rep. 2015, 1, 62–70. [Google Scholar] [CrossRef]
  47. Narayan, P.K.; Narayan, S. Carbon dioxide emissions and economic growth: Panel data evidence from developing countries. Energy Policy 2010, 38, 661–666. [Google Scholar] [CrossRef]
  48. Sharma, S.S. Determinants of carbon dioxide emissions: Empirical evidence from 69 countries. Appl. Energy 2011, 88, 376–382. [Google Scholar] [CrossRef]
  49. Jaunky, V.C. The CO2 emissions-income nexus: Evidence from rich countries. Energy Policy 2011, 39, 1228–1240. [Google Scholar] [CrossRef]
  50. Salahuddin, M.; Gow, J.; Ozturk, I. Is the long-run relationship between economic growth, electricity consumption, carbon dioxide emissions and financial development in Gulf Cooperation Council Countries robust? Renew. Sustain. Energy Rev. 2015, 51, 317–326. [Google Scholar] [CrossRef] [Green Version]
  51. Ozturk, I.; Acaravci, A. CO2 emissions, energy consumption and economic growth in Turkey. Renew. Sustain. Energy Rev. 2010, 14, 3220–3225. [Google Scholar] [CrossRef]
  52. Leit, N.C. Economic growth, carbon dioxide emissions, renewable energy and globalization. Int. J. Energy Econ. Policy 2014, 4, 391. [Google Scholar]
  53. Saboori, B.; Sulaiman, J. Environmental degradation, economic growth and energy consumption: Evidence of the environmental Kuznets curve in Malaysia. Energy Policy 2013, 60, 892–905. [Google Scholar] [CrossRef]
  54. Sadorsky, P. Renewable energy consumption, CO2 emissions and oil prices in the G7 countries. Energy Econ. 2009, 31, 456–462. [Google Scholar] [CrossRef]
  55. Long, X.; Naminse, E.Y.; Du, J.; Zhuang, J. Nonrenewable energy, renewable energy, carbon dioxide emissions and economic growth in China from 1952 to 2012. Renew. Sustain. Energy Rev. 2015, 52, 680–688. [Google Scholar] [CrossRef]
  56. Sebri, M.; Ben-Salha, O. On the causal dynamics between economic growth, renewable energy consumption, CO2 emissions and trade openness: Fresh evidence from BRICS countries. Renew. Sustain. Energy Rev. 2014, 39, 14–23. [Google Scholar] [CrossRef]
  57. Arellano, M.; Bond, S. Some Tests of Specification for Panel Data: Monte Carlo Evidence and an Application to Employment Equations. Rev. Econ. Stud. 1991, 58, 277. [Google Scholar] [CrossRef] [Green Version]
  58. Panigrahi, S.K. Economic Value Added and Traditional Accounting Measures for Shareholder’s Wealth Creation. Asian J. Account. Gov. 2017, 8, 125–136. [Google Scholar] [CrossRef]
  59. Perron, P. The Great Crash, the Oil Price Shock, and the Unit Root Hypothesis. Econometrica 1989, 57, 1361. [Google Scholar] [CrossRef]
  60. Hoang, N.T.; McNown, R.F. Panel data unit roots tests using various estimation methods. Univ. Colo. Bull. 2006, 6, 33–66. [Google Scholar]
  61. Im, K.S.; Pesaran, M.; Shin, Y. Testing for unit roots in heterogeneous panels. J. Econ. 2003, 115, 53–74. [Google Scholar] [CrossRef]
  62. Newey, W.K.; West, K.D. A Simple, Positive Semi-Definite, Heteroskedasticity and Autocorrelationconsistent Covariance Matrix; National Bureau of Economic Research: Cambridge, MA, USA, 1986. [Google Scholar]
  63. Phillips, P.C.B.; Hansen, B.E. Statistical Inference in Instrumental Variables Regression with I(1) Processes. Rev. Econ. Stud. 1990, 57, 99. [Google Scholar] [CrossRef]
  64. Pedroni, P. Fully modified OLS for heterogeneous cointegrated panels. In Nonstationary Panels, Panel Cointegration, and Dynamic Panels; Emerald Group Publishing Limited: Bingley, UK, 2001; pp. 93–130. [Google Scholar]
  65. Hamit-Haggar, M. Greenhouse gas emissions, energy consumption and economic growth: A panel cointegration analysis from Canadian industrial sector perspective. Energy Econ. 2012, 34, 358–364. [Google Scholar] [CrossRef]
  66. Pedroni, P. Fully Modified OLS for Heterogeneous Cointegrated Panels and the Case of Purchasing Power Parity; Department of Economics, Indiana University: Bloomington, IN, USA, 1996. [Google Scholar]
  67. Granger, C. Some recent development in a concept of causality. J. Econ. 1988, 39, 199–211. [Google Scholar] [CrossRef]
  68. Perman, R. Cointegration: An Introduction to the Literature. J. Econ. Stud. 1991, 18, 3–30. [Google Scholar] [CrossRef]
  69. Pedroni, P. Panel cointegration: asymptotic and finite sample properties of pooled time series tests with an application to the ppp hypothesis. Econ. Theory 2004, 20, 597–625. [Google Scholar] [CrossRef]
  70. Arouri, M.E.H.; Youssef, A.B.; M’henni, H.; Rault, C. Energy consumption, economic growth and CO2 emissions in Middle East and North African countries. Energy Policy 2012, 45, 342–349. [Google Scholar] [CrossRef]
  71. Kao, C.; Chiang, M.-H.; Chen, B. International R&D Spillovers: An Application of Estimation and Inference in Panel Cointegration. Oxf. Bull. Econ. Stat. 1999, 61, 691–709. [Google Scholar] [Green Version]
  72. Zhang, B.; Wang, Z.; Wang, B. Energy production, economic growth and CO2 emission: Evidence from Pakistan. Nat. Hazards 2018, 90, 1–24. [Google Scholar]
  73. Phillips, P.C.B.; Loretan, M. Estimating Long-Run Economic Equilibria. Rev. Econ. Stud. 1991, 58, 407. [Google Scholar] [CrossRef]
  74. Rossi, E. Impulse Response Functions; Notes for a Lecture on Econometrics; University of Pavia: Pavia, Italy, 2004. [Google Scholar]
Figure 1. (a) Panel data plots of the CO2 emissions per capita for Association of Southeast Asian Nations (ASEAN) countries; (b) Panel data plots of the real GDP (Gross Domestic Product) per capita for ASEAN countries; (c) Panel data plots of renewable energy production in % for ASEAN countries.
Processes 07 00496 g001aProcesses 07 00496 g001b
Figure 2. The long-run relationship between renewable energy production, CO2, and economic growth for ASEAN countries.
Processes 07 00496 g002
Table 1. Summary of empirical relationships among CO2 emissions, energy consumption, and economic growth from 2009 to 2015.
AuthorsVariablesMethodologyCountriesFindings
Saidi and Hammami [46]CO2 emissions, energy consumption, and economic growthPanel data using Generalized Method of moments58 countriesEnergy consumption increased economic growth; CO2 emissions had a negative impact on economic growth
Chandran and Tang [10]Transport energy consumption, foreign direct investment, and CO2 emissionsCointegration and Granger causalityFive ASEAN countriesCO2 emissions were co-integrated only in Malaysia, Indonesia, and Thailand; economic growth contributed to CO2 emissions
Jalil and Feridun [32]Growth, energy and financial development, and CO2 emissionsAutoregressive Distributed Lag (ARDL)ChinaIncome, trade openness, and energy consumption were able to determine CO2 emissions
Narayan and Narayan [47]CO2 emissions and economic growthPanel dataDeveloping countriesIndividual countries showed that CO2 emissions had fallen over the long run
Sharma [48]Trade openness, per capita GDP, and energy consumptionDynamic panel modeling69 countriesTrade openness, per capita GDP, and energy consumption had positive effects on CO2 emissions
Jaunky [49]CO2 emissions and incomeVECMRich countriesUnidirectional causality from the real per capita GDP to per capita CO2 emissions
Salahuddin, Gow [50]Economic growth, electricity consumption, CO2 emissions, and financial developmentDynamic OLS, fully modified OLS and dynamic fixed effect modelGulf countriesElectricity consumption and economic growth stimulated CO2 emissions; there was no causal link between financial development and CO2 emissions
Ozturk and Acaravci [51]CO2 emissions, energy consumption, and economic growthARDL Cointegration testEuropeThere was a positive long-run elasticity between CO2 emissions and economic growth
Leit [52]Economic growth, CO2 emissions, renewable energy, and globalizationGMM, Granger causality and ECMPortugalCO2 emissions and renewable energy were positively related to economic growth
Saboori and Sulaiman [53]CO2 emissions, energy consumption, and economic growthARDL and VECMASEANThere was a nonlinear relationship between CO2 emissions and economic growth; bi-directional Granger causality between energy consumption and CO2 emissions
Sadorsky [54]Renewable energy consumption, CO2 emissions, and oil pricesCointegrationG7 countriesGDP and CO2 emissions were major drivers of renewable energy consumption
Table 2. Descriptive statistics for CO2 emissions, real GDP, and renewable energy production.
CountriesMeanS.D.MinimumMaximum
Panel A: CO2 emissions per capita
Malaysia6.7137671.088024.7639978.530658
Myanmar0.2362770.0639110.160970.4166
Thailand3.6101620.5904262.6680984.62186
Vietnam1.2082860.5391940.4040572.205355
Indonesia1.6241090.4011521.0412462.55975
Philippines0.9224080.1037280.7709061.235657
Singapore9.8729342.7432374.34260615.39236
Panel A: Real GDP per capita
Malaysia2.9899363.881041−9.655757.445581
Myanmar8.6051252.9892864.27481412.68542
Thailand2.7483663.755799−8.7340467.047772
Vietnam5.3487931.1054533.2136797.758815
Indonesia5.3487931.1054533.2136797.758815
Philippines2.9047492.096575−2.744965.903121
Singapore3.0048724.330412−5.49105913.21649
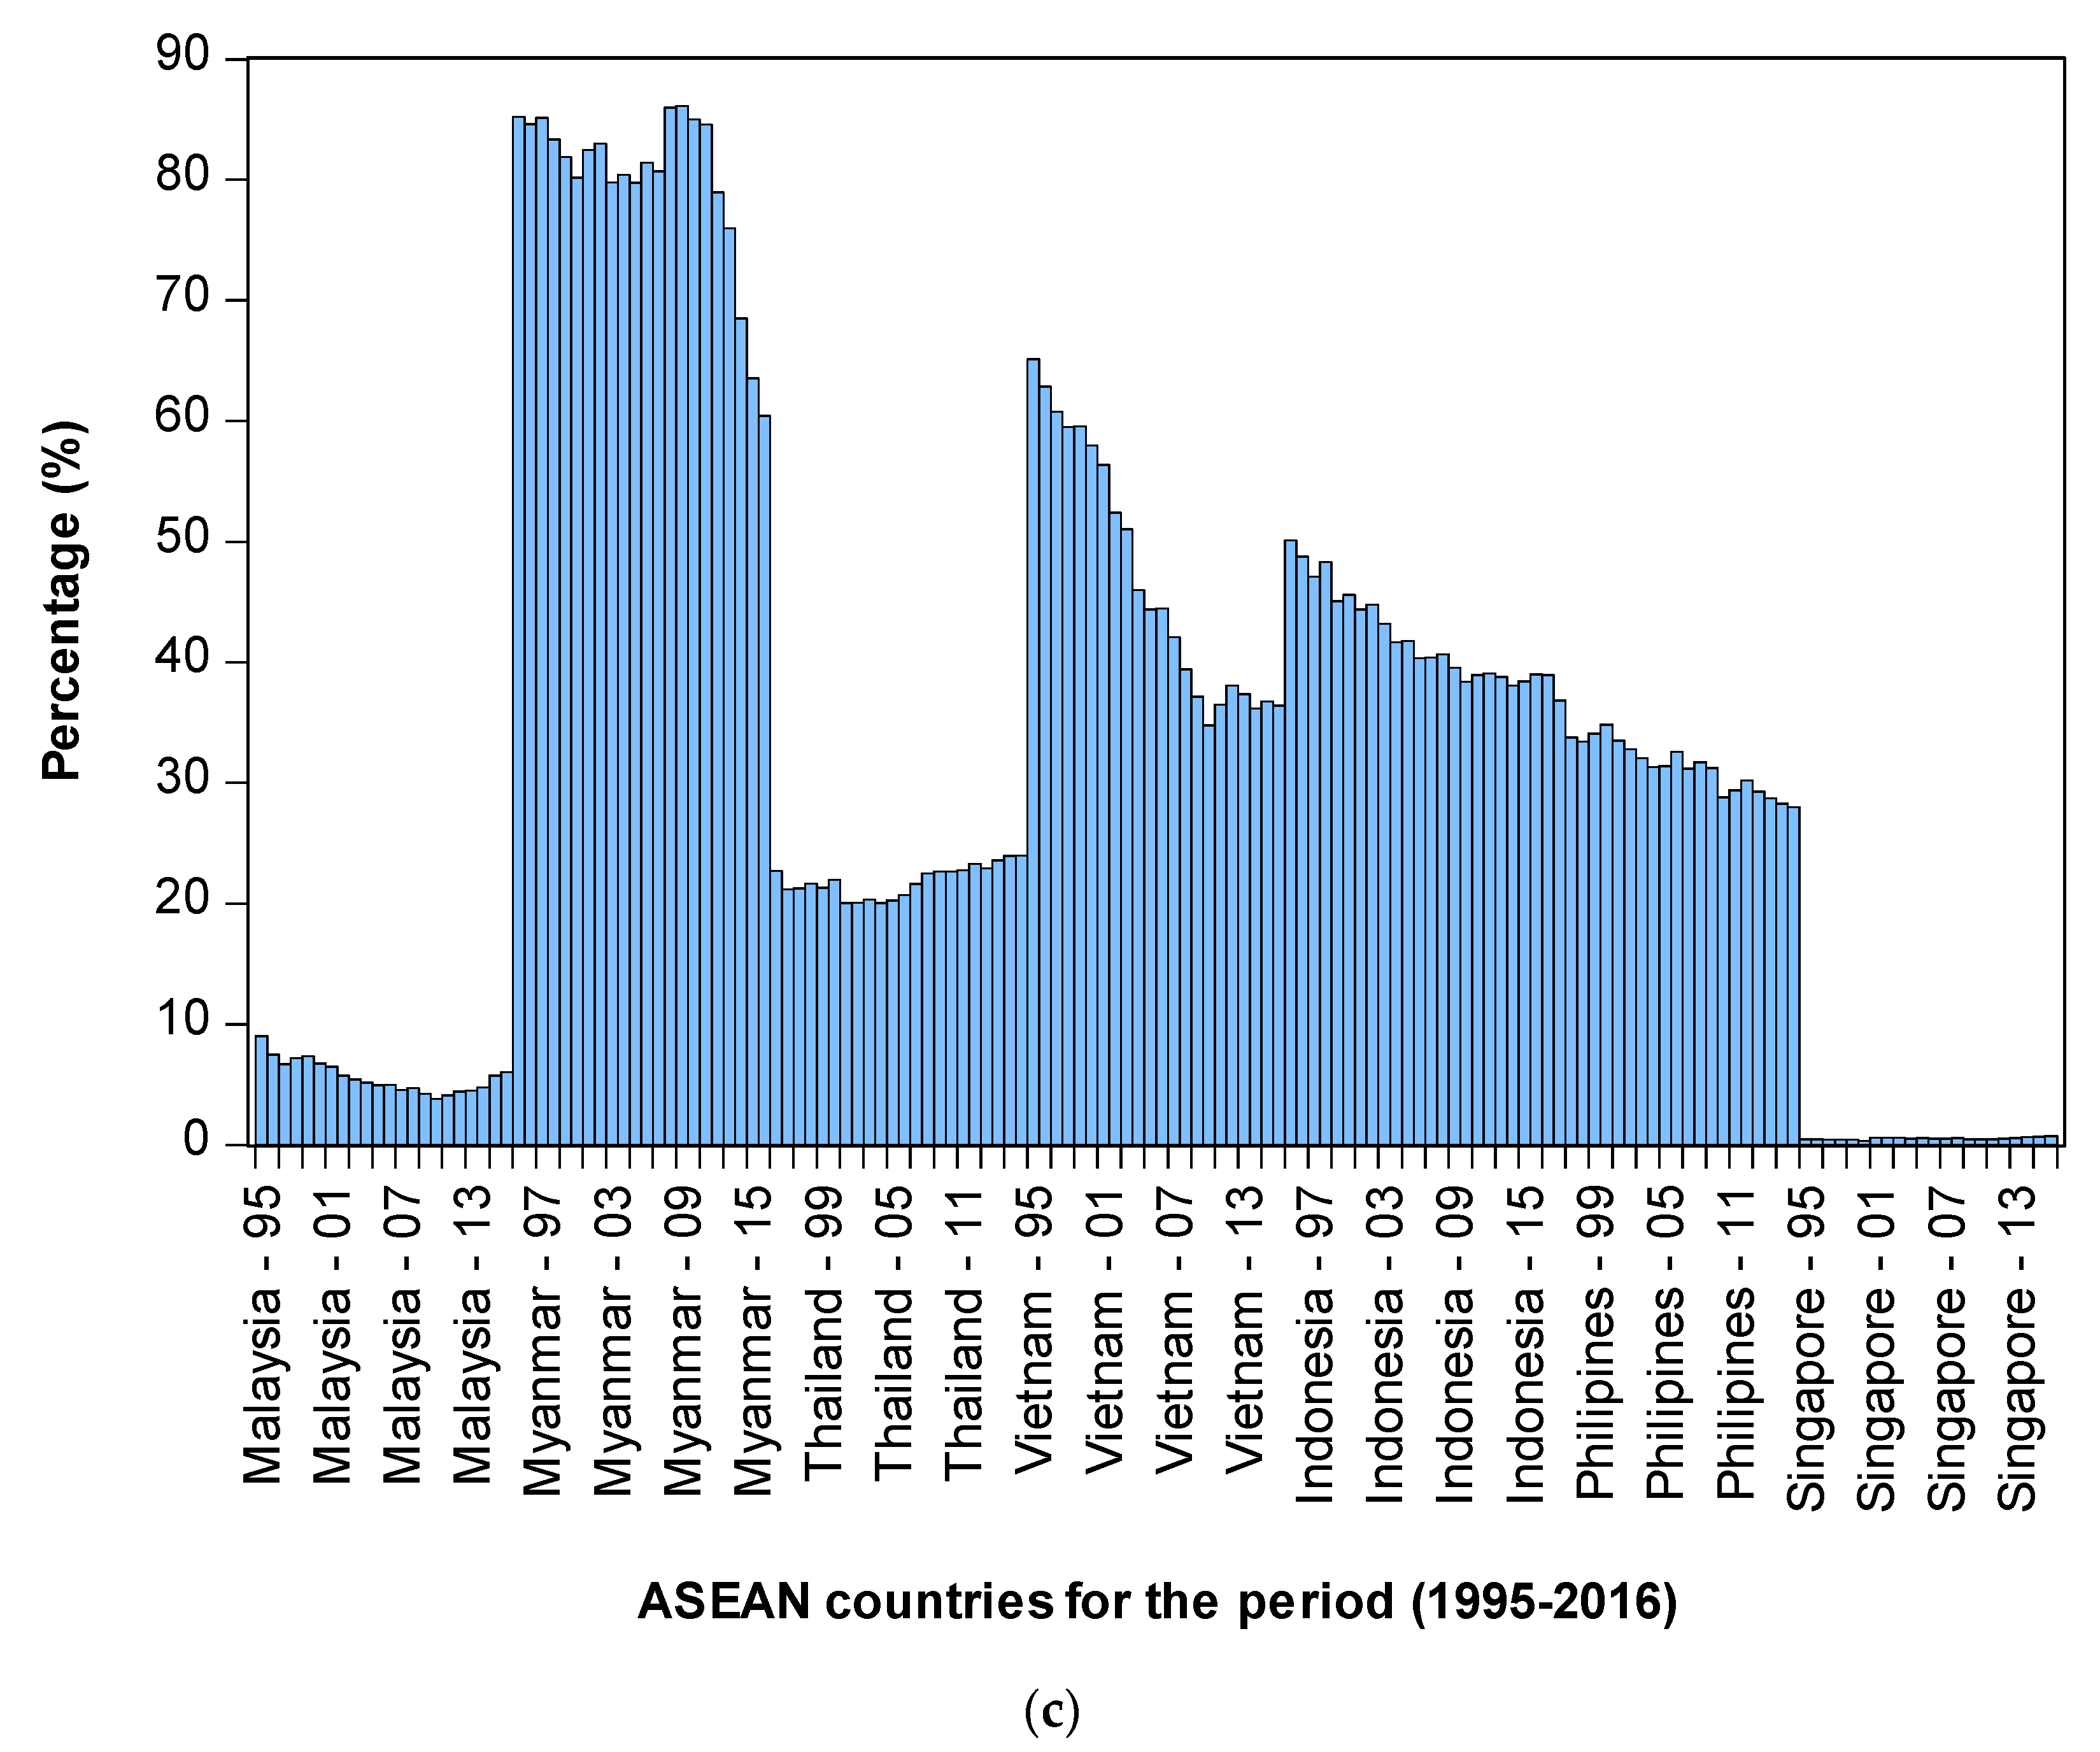
Panel A: Renewable energy production
Malaysia5.6382531.3409743.8190429.029613
Myanmar79.871856.99704160.453286.11957
Thailand21.882861.30561620.0246724.0143
Vietnam47.0624610.4487934.795965.12578
Indonesia42.383113.7895338.0661450.09815
Philippines31.938192.78407928.003438.942
Singapore0.5173750.0889520.3251190.715843
Note: S.D., CO2, GDP stand for standard deviation, per capita carbon dioxide emissions, and per capita real GDP. Data period was 1995–2016 for the ASEAN countries.
Table 3. Panel unit root test results for ASEAN countries.
Unit Root Methods
CountryVariablesPPADF
LevelFirst DifferenceLevelFirst Difference
MalaysiaRenewable−3.004−3.885 ***−1.404−3.815 ***
CO2 emissions0.151−5.004 ***0.159−3.644 ***
GDP−8.489 ***−12.199 ***−5.327 ***−6.260 ***
MyanmarRenewable0.846−2.801 **1.500−2.778 ***
CO2 emissions−1.599−8.669 ***−1.802−6.060 ***
GDP−1.476−3.675 ***−1.433−3.719 ***
ThailandRenewable−0.731−5.439 ***−0.733−5.405 ***
CO2 emissions−1.509−4.928 ***−1.509−4.925 ***
GDP−3.727 ***−9.767 ***−3.721 ***−5.707 ***
VietnamRenewable−1.829−3.219 **−1.932−3.219 **
CO2 emissions1.308−4.078 ***0.575−6.373 ***
GDP−3.039 **−3.863 ***−2.961 *−3.857 ***
IndonesiaRenewable−3.245 **−6.827 ***−2.704 **−6.827 ***
CO2 emissions−1.222−7.289 ***−1.427−4.845 ***
GDP−3.039 **−3.863 ***−2.961 *−3.857 ***
PhilippinesRenewable−2.577−6.491 ***−2.500−5.772 ***
CO2 emissions1.461−3.720 ***1.143−3.857 ***
GDP−3.399 **−14.868 ***−3.399 **−5.788 ***
SingaporeRenewable−1.206−5.487 ***−1.308−5.487 ***
CO2 emissions−1.717−5.414 ***−1.792−4.871 ***
GDP−7.688 ***−13.506 ***−4.692 ***−6.483 ***
Note: *** denotes the significance level at 1%. stands for first difference, ADF—Augmented Dicker Fuller.
Table 4. Residual cointegration test.
StatisticsWithin DimensionsStatisticsBetween Dimensions
Valuep-Value Valuep-Value
Panel v-Statistic1.264 *0.006
Panel rho-Statistic−1.4210.922Group rho-Statistic2.5340.994
Panel PP-Statistic−4.961 *0.000Group PP-Statistic−1.985 **0.023
Panel ADF-Statistic−5.060 *0.000Group ADF-Statistic−2.323 **0.010
Note: the selection of Lag was based on the Akaike Information Criterion (AIC). The null hypothesis was that the variables were not co-integrated. * and ** denote the significance levels at 1% and 5%, respectively.
Table 5. Long-run elasticity results (dependent variable: renewable energy production).
FMOLS EstimationDOLS Estimation
CountryGDPCO2 EmissionsCountryGDPCO2 Emissions
Malaysia1.653 b−0.593 bMalaysia2.006 b−1.359 b
(2.050)(−0.912)(2.684)(−2.232)
Myanmar0.092 b−0.126 aMyanmar0.064 b−0.027 a
(2.845)(−1.845)(4.678)(−0.723)
Thailand0.549−0.393Thailand0.337−0.699
(−2.001)(−2.505)(−1.183)(−2.504)
Vietnam0.193 a−0.579Vietnam1.049 a−1.164
(−0.37)(−2.990)(−1.639)(−5.833)
Indonesia−0.251 a−0.217Indonesia−0.485 a−0.092
(−1.254)(−2.515)(−2.290)(−0.394)
Philippines−0.392−0.042Philippines0.592−0.288
(−2.710)(−0.703)(−2.031)(−3.332)
Singapore0.18−0.163 bSingapore−2.856−0.619 b
(0.233)(−0.904)(−2.164)(−2.638)
Notes: a, b, and c indicate the significance levels at 1%, 5%, and 10%, respectively. Intercepts and linear trends are included in the regressions. Barlett Kernel with a fixed bandwidth of 6 was used following [71]. Figures in the parentheses are the t-statistics. FMOLS—fully modified ordinary least square; DOLS—dynamic ordinary least square; GDP—gross domestic product.
Table 6. Results of panel Granger causality test identifying long-run relationships between CO2 emissions, real GDP, and renewable energy production for ASEAN countries.
Short-Run Granger Causality
Country Country
MalaysiaVariable∆GDP∆RNW∆CO2IndonesiaVariable∆GDP∆RNW∆CO2
∆GDP10.4554.229 **∆GDP110.30 **1.177
∆RNW0.25210.937∆RNW4.367 *10.902
∆CO20.3581.0831∆CO20.7310.8491
MyanmarVariable∆GDP∆RNW∆CO2PhilippinesVariable∆GDP∆RNW∆CO2
∆GDP10.6350.417∆GDP11.2202.115
∆RNW22.83 **13.055 *∆RNW4.590 *12.627
∆CO20.7882.0921∆CO21.2131.0641
ThailandVariable∆GDP∆RNW∆CO2SingaporeVariable∆GDP∆RNW∆CO2
∆GDP12.5370.583∆GDP11.6631.745
∆RNW1.10210.691∆RNW0.12410.285
∆CO21.92121.59 **1∆CO22.9880.4531
VietnamVariable∆GDP∆RNW∆CO2
∆GDP120.61 **1.068
∆RNW1.35913.319 *
∆CO21.1900.1211
Note: The t-statistics are provided in the parentheses, respectively. *, **, and *** denote the significance levels at 1%, 5%, and 10%, respectively. ∆ denotes change; GDP stands for the gross domestic product; RNW stands for renewable; CO2 stands for carbon emissions.

