Research on Ecological Efficiency for the Remanufacturing Process Considering Optimization and Evaluation


College of Machinery and Automation, Wuhan University of Science and Technology, Wuhan 430000, China
*
Author to whom correspondence should be addressed.
Processes 2019, 7(9), 567; https://0-doi-org.brum.beds.ac.uk/10.3390/pr7090567
Submission received: 20 July 2019
/
Revised: 23 August 2019
/
Accepted: 23 August 2019
/
Published: 28 August 2019
(This article belongs to the Special Issue Energy, Economic and Environment for Industrial Production Processes)
Abstract
:The ecological efficiency (EE) of the remanufacturing process occupies an important position in the whole index system of remanufacturing because it will directly affect the economic and environmental benefits of remanufacturing. Therefore, in order to study the EE of the remanufacturing process, a method is proposed to optimize and evaluate the EE of the remanufacturing process. In this method, firstly, the original remanufacturing sub-schemes of used components are designed according to the extracted fault characteristics; secondly, a set of optional process schemes are integrated by using directed graph (DG) to reduce the process schemes; thirdly, the objective function of EE is established, and then an ant colony algorithm with elite strategy (ES-ACO) is proposed to optimize the process schemes. After obtaining the optimal value of EE, the quality coefficient of used components can be calculated, and then numerical simulations (NS) are used to analyze the correlation between the quality coefficient and the optimized EE, after that, polynomial function fitting (PFF) is applied to construct the evaluation model of EE oriented to the quality coefficient, then, the evaluation model is utilized to analyze the range of quality coefficient of used components suitable for remanufacturing under cost constraints. Finally, the feasibility of this method is verified by the example of the used lathe spindle remanufacturing; and the case study shows that in the optimization phase, ES-ACO can not only optimize the process schemes but also has better performance than ACO; in the evaluation stage, the probability of deviation of the evaluation function established by using PFF is 5%, meeting the small probability event. (i.e., the occurrence of very low-frequency events), that is, the accuracy of the evaluation meets the requirements.
1. Introduction
At present, more than 60% of the traditional old machine tools have been used for more than 10 years in China. Eighty percent of the in-service construction machinery has exceeded their shelf life and about 800 million tons of solid waste are generated every year [1]. Since remanufacturing can maximize the development and utilization of the value contained in waste resources and reduce the environmental hazards of plenty of scrapped products, it has aroused widespread concern in academia and relevant industry.
The traditional remanufacturing process was more concerned about whether the used components can produce more economic benefits through remanufacturing [2,3,4,5]. However, as the ecological problems become more and more serious in China, simply evaluating the remanufacturing process with the goal of economic benefits does not meet the requirements of ecological civilization construction. Although the literature [6,7,8] achieved the goal of simultaneously optimizing the economic benefits and environmental benefits of remanufacturing through multi-objective optimization, they used the expert scoring method when dealing with multi-objective functions, which undoubtedly had a great impact on the objectivity of remanufacturing system. So is there a single goal of remanufacturing that can take into account both economic benefits and environmental impacts? The basic principle of remanufacturing ecological efficiency (EE) was to balance the economic benefits and environmental impacts, and effectively integrate the sustainable development goals on the macro scale into the development planning and management of micro (such as enterprises) and meso (such as industry) [9]. Hence, if remanufacturing EE is set as the research goal, it can not only avoid the subjectivity of multi-objectives, but also consider remanufacturing economic and environmental benefits at the same time.
Based on the importance of remanufacturing EE research, many scholars have studied it at different levels. Literature [10] found that the remanufacturing process was more eco-efficient than the manufacturing process; Huisman et al. proposed a newly developed concept of EE, which took into account a series of technical, logistics, economic and policy issues [11]; Quariguasi-Frota-Neto et al. investigated whether remanufacturing will reduce environmental impact by analyzing the relative EE of the remanufacturing of personal computers and mobile phones [12]. Deng et al. identified the key factors affecting the EE of remanufacturing based on the theory of fuzzy DEMATEL (decision making trial and evaluation laboratory) [13]. Liu et al. established a competition decision model based on EE and considered that the remanufacturer, with a cost advantage, can enjoy a lower product price and a higher manufacturing profit [14].
There was no doubt that these scholars have made useful attempts to study the EE of remanufacturing, such as the fuzzy DEMATEL theory, competitive decision model, etc. But the literature did not clearly define, quantify and evaluate the remanufacturing EE, nor use it as an evaluation index to guide the remanufacturing process schemes optimization. In fact, compared with the previous qualitative analysis of EE, the quantification, evaluation and optimization of EE play a decisive role in maximizing the EE of enterprises, because it directly affects the reconditioning process of remanufacturing. Based on this, the EE of the remanufacturing process is studied from two aspects of optimization and evaluation.
In the optimization stage, the EE of remanufacturing is defined and quantified firstly; secondly, the optional process schemes are designed by fault characteristics analysis and directed graph (DG), and then the process scheme with the optimal EE is obtained by using a suitable algorithm. At present, ant colony algorithm (ACO) is widely used in the remanufacturing process scheme optimization. Compared with other optimization algorithms, ACO has the advantages of self-organization, positive feedback and robustness. For example, in literature [15], two ACOs were used to solve the displacement flow shop scheduling problem with the goal of minimizing the completion time. Su et al. used ACO to optimize the assembly model for the remanufacturing of construction machinery [16]. Ma et al. used ACO to solve the problem of remanufacturing mixed economic batches with limited inventory capabilities [17]. Undoubtedly, these studies have made valuable attempts to apply ACO to single-objective optimization, but as a global optimization algorithm, ACO also has some shortcomings, such as long search time, being trapped in a local optimum and the stagnation phenomenon. In order to overcome these shortcomings, elite ant strategy is introduced to form a new algorithm (ES-ACO). ES-ACO introduces elite ant strategy in the update pheromone phase of ACO. This strategy can adjust the pheromone concentration of the algorithm to enhance the global search ability of the algorithm, which makes the algorithm more advantageous in solving quality and iteration speed, such as shortening the search time, effectively avoiding the occurrence of local optimum and stagnation. In view of these theoretical merits of ES-ACO, ES-ACO is applied as the algorithm for the process scheme optimization. At the same time, in order to demonstrate the advantages of ES-ACO, ACO is set as a comparison algorithm to detect the performance of ES-ACO.
In the evaluation stage, the quality coefficient of the used components is calculated based on the fault characteristics information, and then the evaluation model of the optimized EE oriented to the quality coefficient is constructed by numerical simulations (NS) and polynomial function fitting (PFF). At the same time, the cost factor is considered to obtain the quality range of the used components that can be remanufactured.
From the previous studies, it can be found that one of the difficulties in the study of the EE of the remanufacturing process is the lack of a reasonable method, which can optimize and evaluate EE. There are four following innovations in this paper: (1) Designing alternative process schemes. The initial process sub-schemes are generated based on the fault characteristics, and then a set of process schemes are integrated by DG. (2) Using ES-ACO to optimize single objective function. The objective function of EE is established, and then ES-ACO is used to find the process scheme with the optimal EE. (3) Correlation analysis. The correlation between quality coefficient and the optimized EE is analyzed by using NS. (4) Polynomial function fitting. The functional relationship between the quality coefficient and the optimized EE is established, and then the quality range of used components suitable for remanufacturing under cost constraints is determined.
2. Theoretical Framework for Research on Remanufacturing Process EE
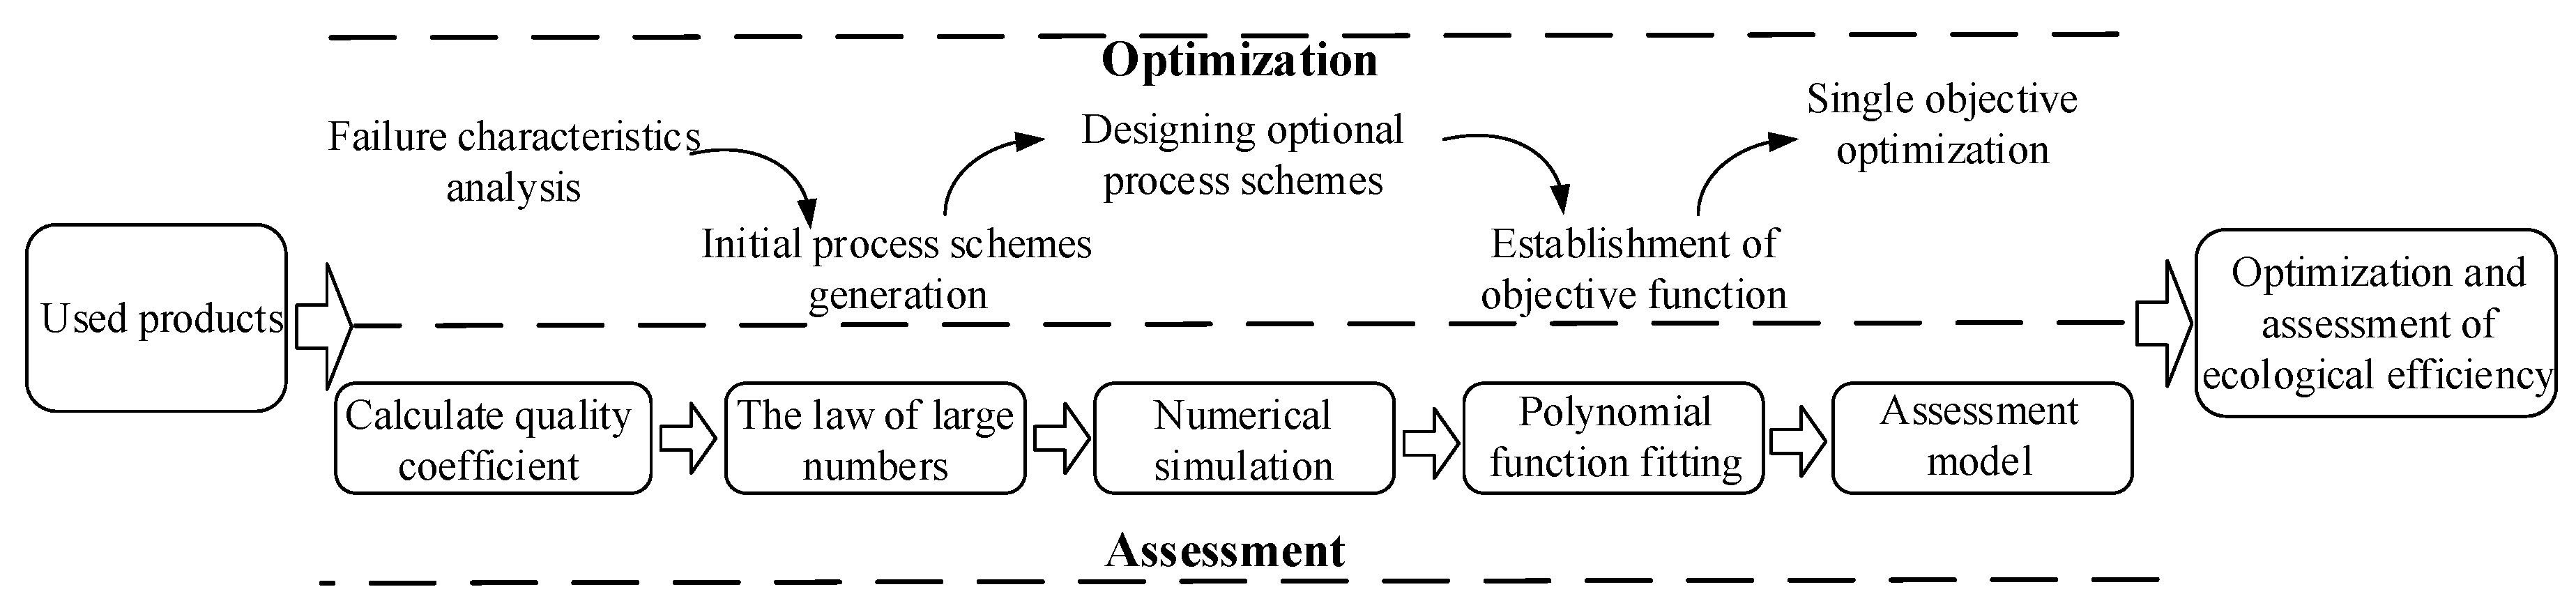
The purpose of the research on the EE of the remanufacturing process is to optimize and evaluate the EE of the remanufacturing process. The theoretical framework is shown in Figure 1 below.
According to Figure 1, the research on the EE of the remanufacturing process can be divided into two parts: (1) Optimization of EE for the remanufacturing reconditioning process. (2) Constructing an evaluation model of the optimized EE.
2.1. Remanufacturing EE Optimization Study Oriented to the Remanufacturing Reconditioning Process
This section is divided into four parts: (1) Generation of initial process sub-schemes; (2) design of optional remanufacturing process schemes; (3) establishment of optimization objective function and constraint function; and (4) obtaining the process scheme with the optimal EE by optimizing the process schemes.
2.1.1. Generation of Initial Process Sub-Schemes Based on Fault Characteristics
After the used components have been cleaned, engineers and technicians can use relevant instruments to obtain the fault characteristics of the used components. After obtaining the fault characteristic information of the used components, the evaluation information shown in Table 1 below can be used to determine the initial reconditioning process sub-plans of the used components. For example, if the used component has the following three fault characteristics (wear , corrosion , deformation ), then the initial process sub-plans of the used component are grinding→cold welding→electroplating, slotting→grinding→mending and heat treatment→straightening→annealing.
2.1.2. Optional Process Schemes Design Based on Directed Graph
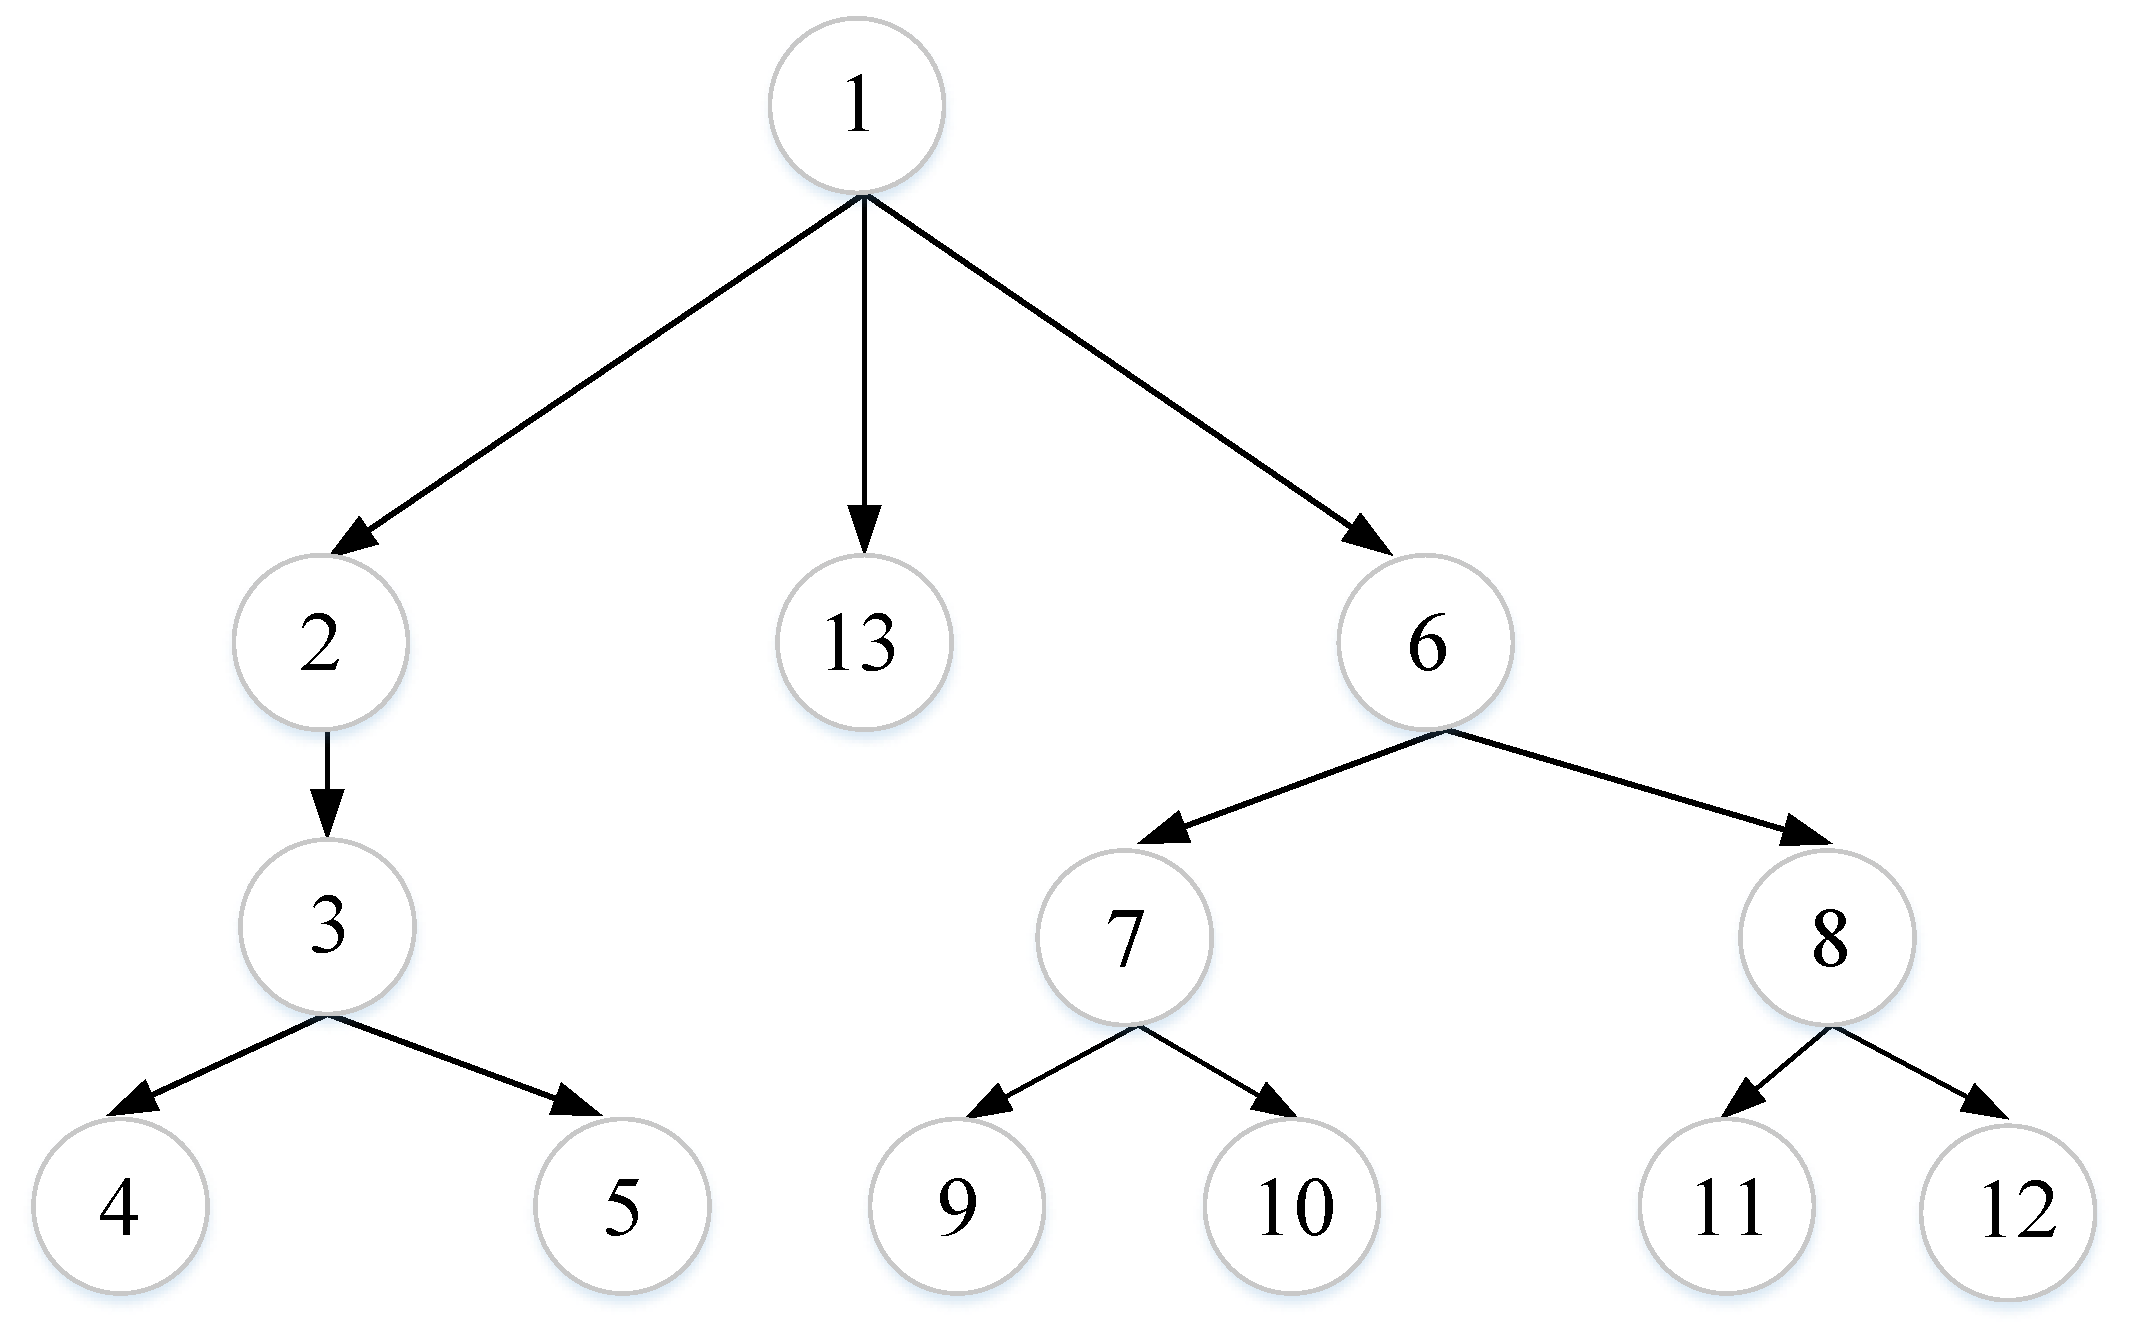
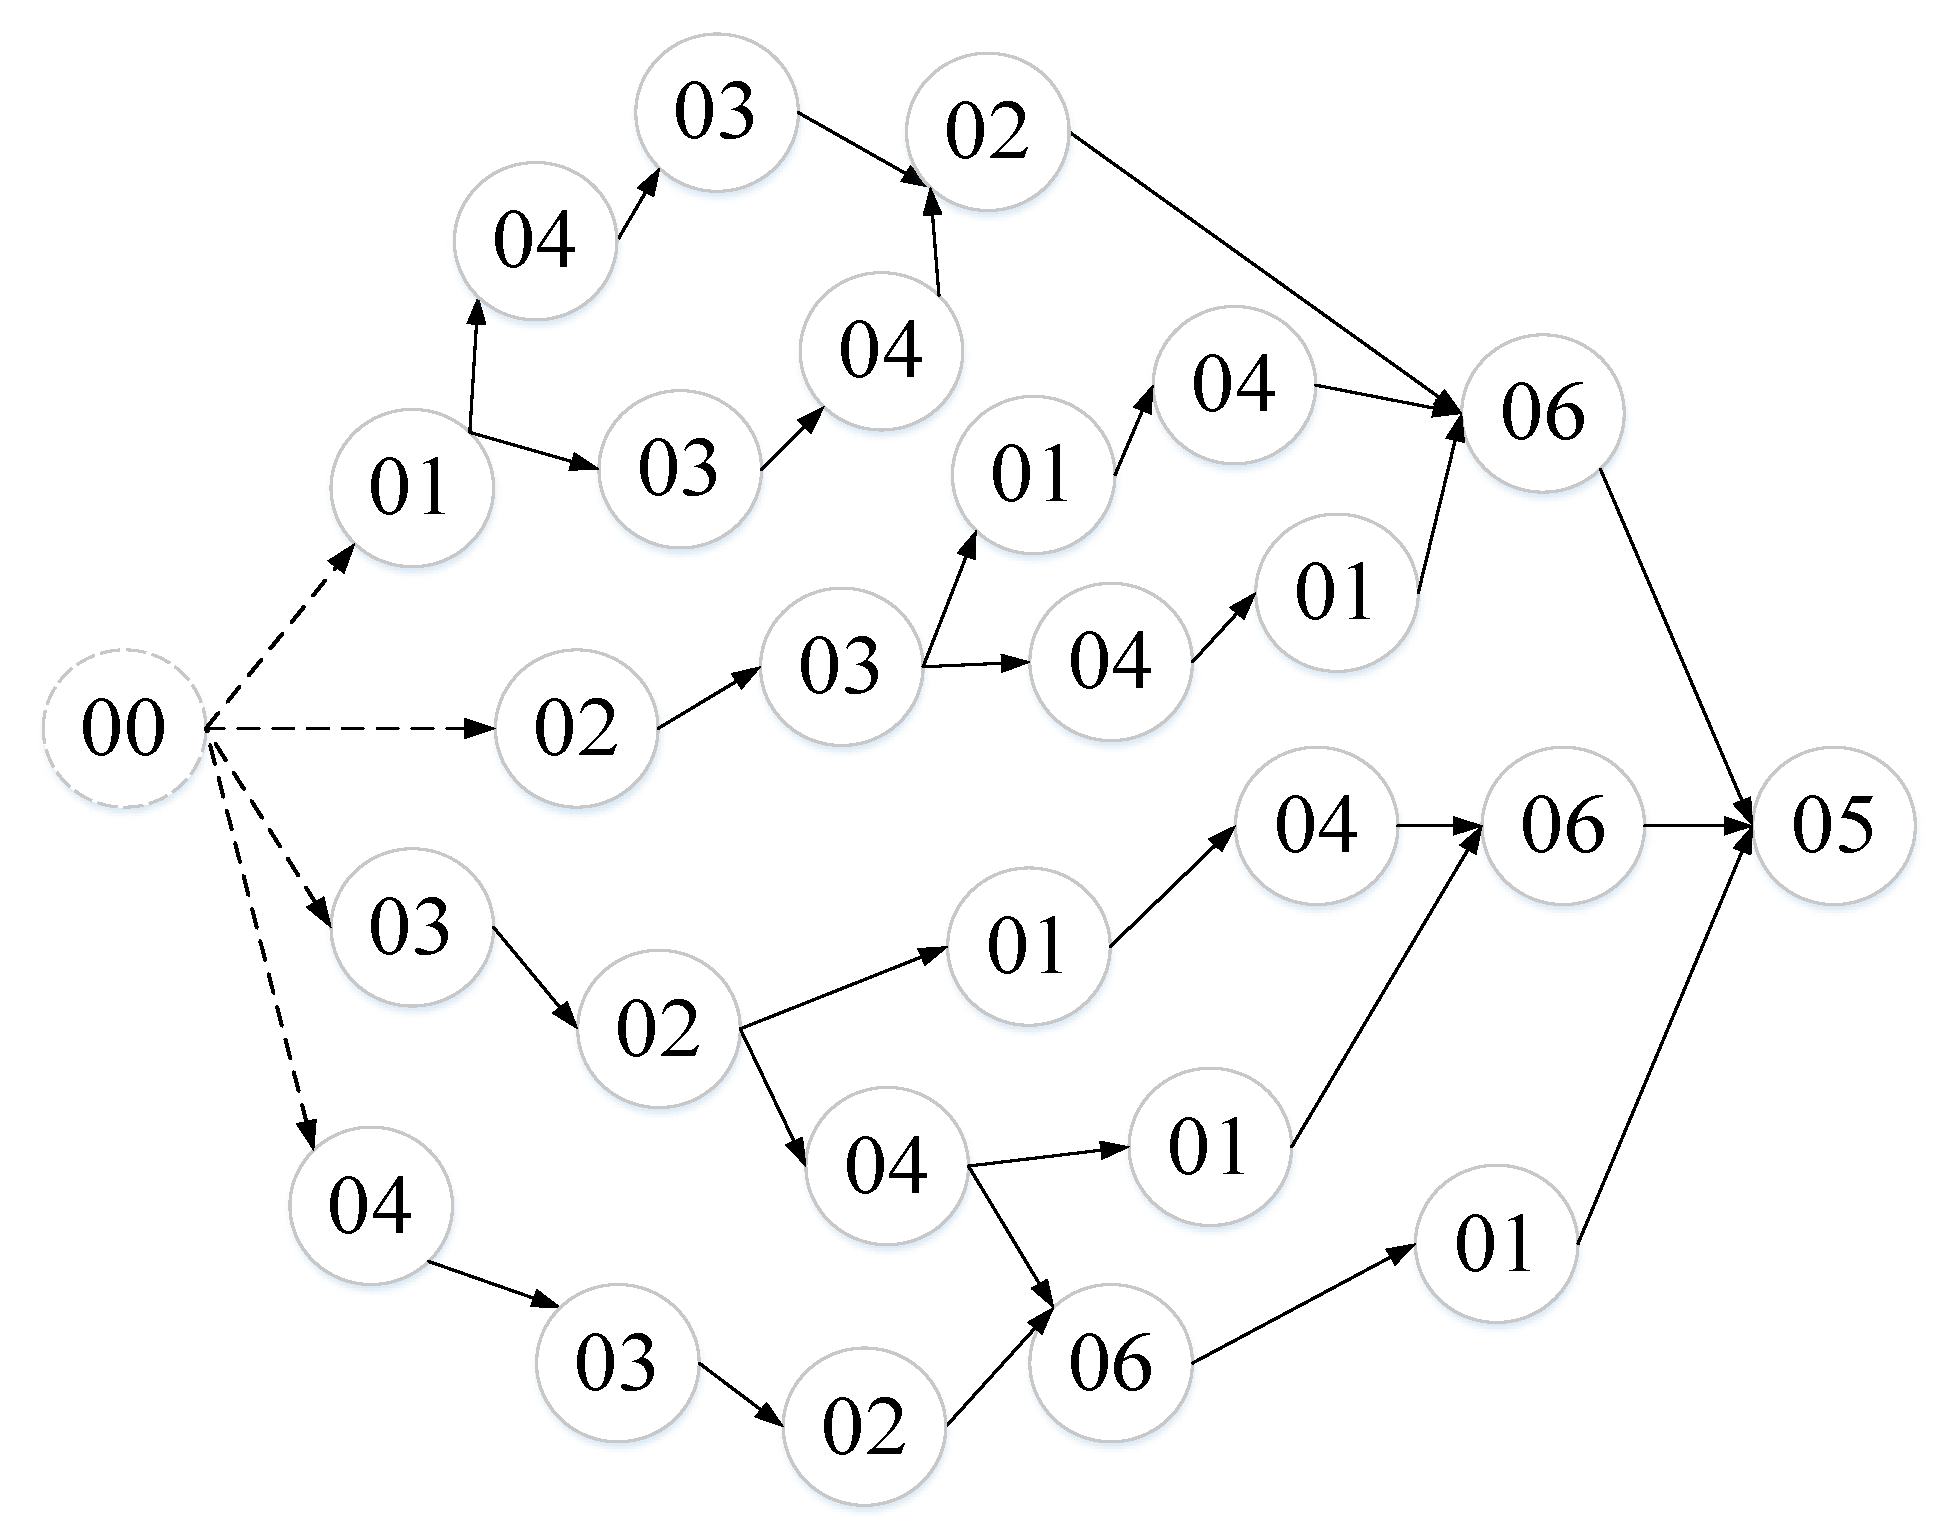
Once the initial remanufacturing sub-schemes are obtained, then the DG can be used to design the optional process schemes. DG is a two-dimensional metadata structure consisting of two vertices (see Figure 2). Through the structure of DG, the priority relationship of each process can be clearly described [19]. Therefore, in order to design a set of suitable remanufacturing process schemes quickly, a DG with process scheme constraints is established. The simplified process schemes are obtained by removing the process schemes that do not satisfy the process constraints through full-topology sorting and sub-topology sorting. The simplified process schemes are shown in Figure 2 below.
Figure 2 contains seven remanufacturing process schemes, for example, process scheme 1→2→3→5. Process operations (e.g., surfacing, cold-welding) are represented by numbers (e.g., 1, 2), and the arrow connections between numbers indicate the processing sequence of different process operations.
2.1.3. Establishment of Object Function and Constraint Function
After obtaining the optional process schemes, the objective function and constraint function of ES-ACO can be constructed. Before establishing the objective function and constraint function, some research hypotheses are introduced as follows:
- (1)
- The conversion time of the two adjacent mechanical equipment is not considered.
- (2)
- The idle energy consumption of mechanical equipment is ignored.
- (3)
- The machining capacity of the equipment for used products is constant.
- (4)
- The cost of manpower is determined by the machining time of equipment.
- (5)
- The environmental impact of engineers and technicians is ignored.
Establishment of Objective Function
Literature [20] pointed out that EE not only needed to provide products or services that met human demands but can also gradually reduce the environmental impact (EI) and resource consumption of products or services, and then defined EE as follows: The value of products or services per unit EI. By combining the features of remanufacturing, this paper defines the EE of remanufacturing as the remanufacturing’s manufacturing value of unit EI. From this definition, before constructing the EE function, the manufacturing value function and the EI function needed to be constructed first. After that, the corresponding constraint function is established according to the constraint condition of the objective function.
(1) Manufacturing Value Function Construction
The manufacturing value of remanufacturing can be expressed in terms of profit [21], and it can be expressed in terms of the price of remanufactured products minus the price of returned used components and the cost of reconditioning processes. In addition, the cost of reconditioning processes can be made up of machine processing cost and manpower cost [22]. Therefore, the manufacturing value of remanufacturing can be calculated by Formula (1) below.
where , , and respectively represent the manufacturing value of remanufacturing, the price of remanufactured products, the manpower cost and the returned price of used components; indicates the i-th process procedure cost per unit time; and indicate the total time to complete all process procedures and the operation time of the i-th process procedure respectively.
(2) EI Function Construction
EI can be expressed by many indicators, among which carbon emissions are commonly recognized indicators, and have been widely used in the EI evaluation of various engineering problems [23,24,25,26]. Therefore, the EI of reconditioning process of used components can be expressed by carbon emissions. Remanufacturing carbon emissions can be expressed as the product of the energy consumption of the reconditioning process and the carbon emission factor. The energy consumption of remanufacturing is caused by processing equipment and auxiliary equipment (e.g., pillars and fixtures). So as to simplify the calculation procedure, the energy consumption of auxiliary equipment is ignored. Hence, the EI of remanufacturing can be calculated by Formula (3) below.
where and represent the environmental impact and carbon emission factor respectively, indicates the processing power of the i-th process procedure.
(3) EE Objective Function Establishment
Based on previously established manufacturing value function, EI function and the definition of EE, the EE objective function can be established as follows.
Establishment of the Constraint Function
Under normal circumstances, if the remanufacturing reconditioning process is carried out normally, then the processing equipment must be in a reliable operation state, and the operation of the equipment can be reflected by the processing power of the equipment. So the constraint function can be shown below.
where denotes the maximum power of equipment of the i-th processing procedure in a reliable state, and denotes the corresponding minimum power.
2.1.4. Optimization of the Remanufacturing Process Scheme Based on ES-ACO
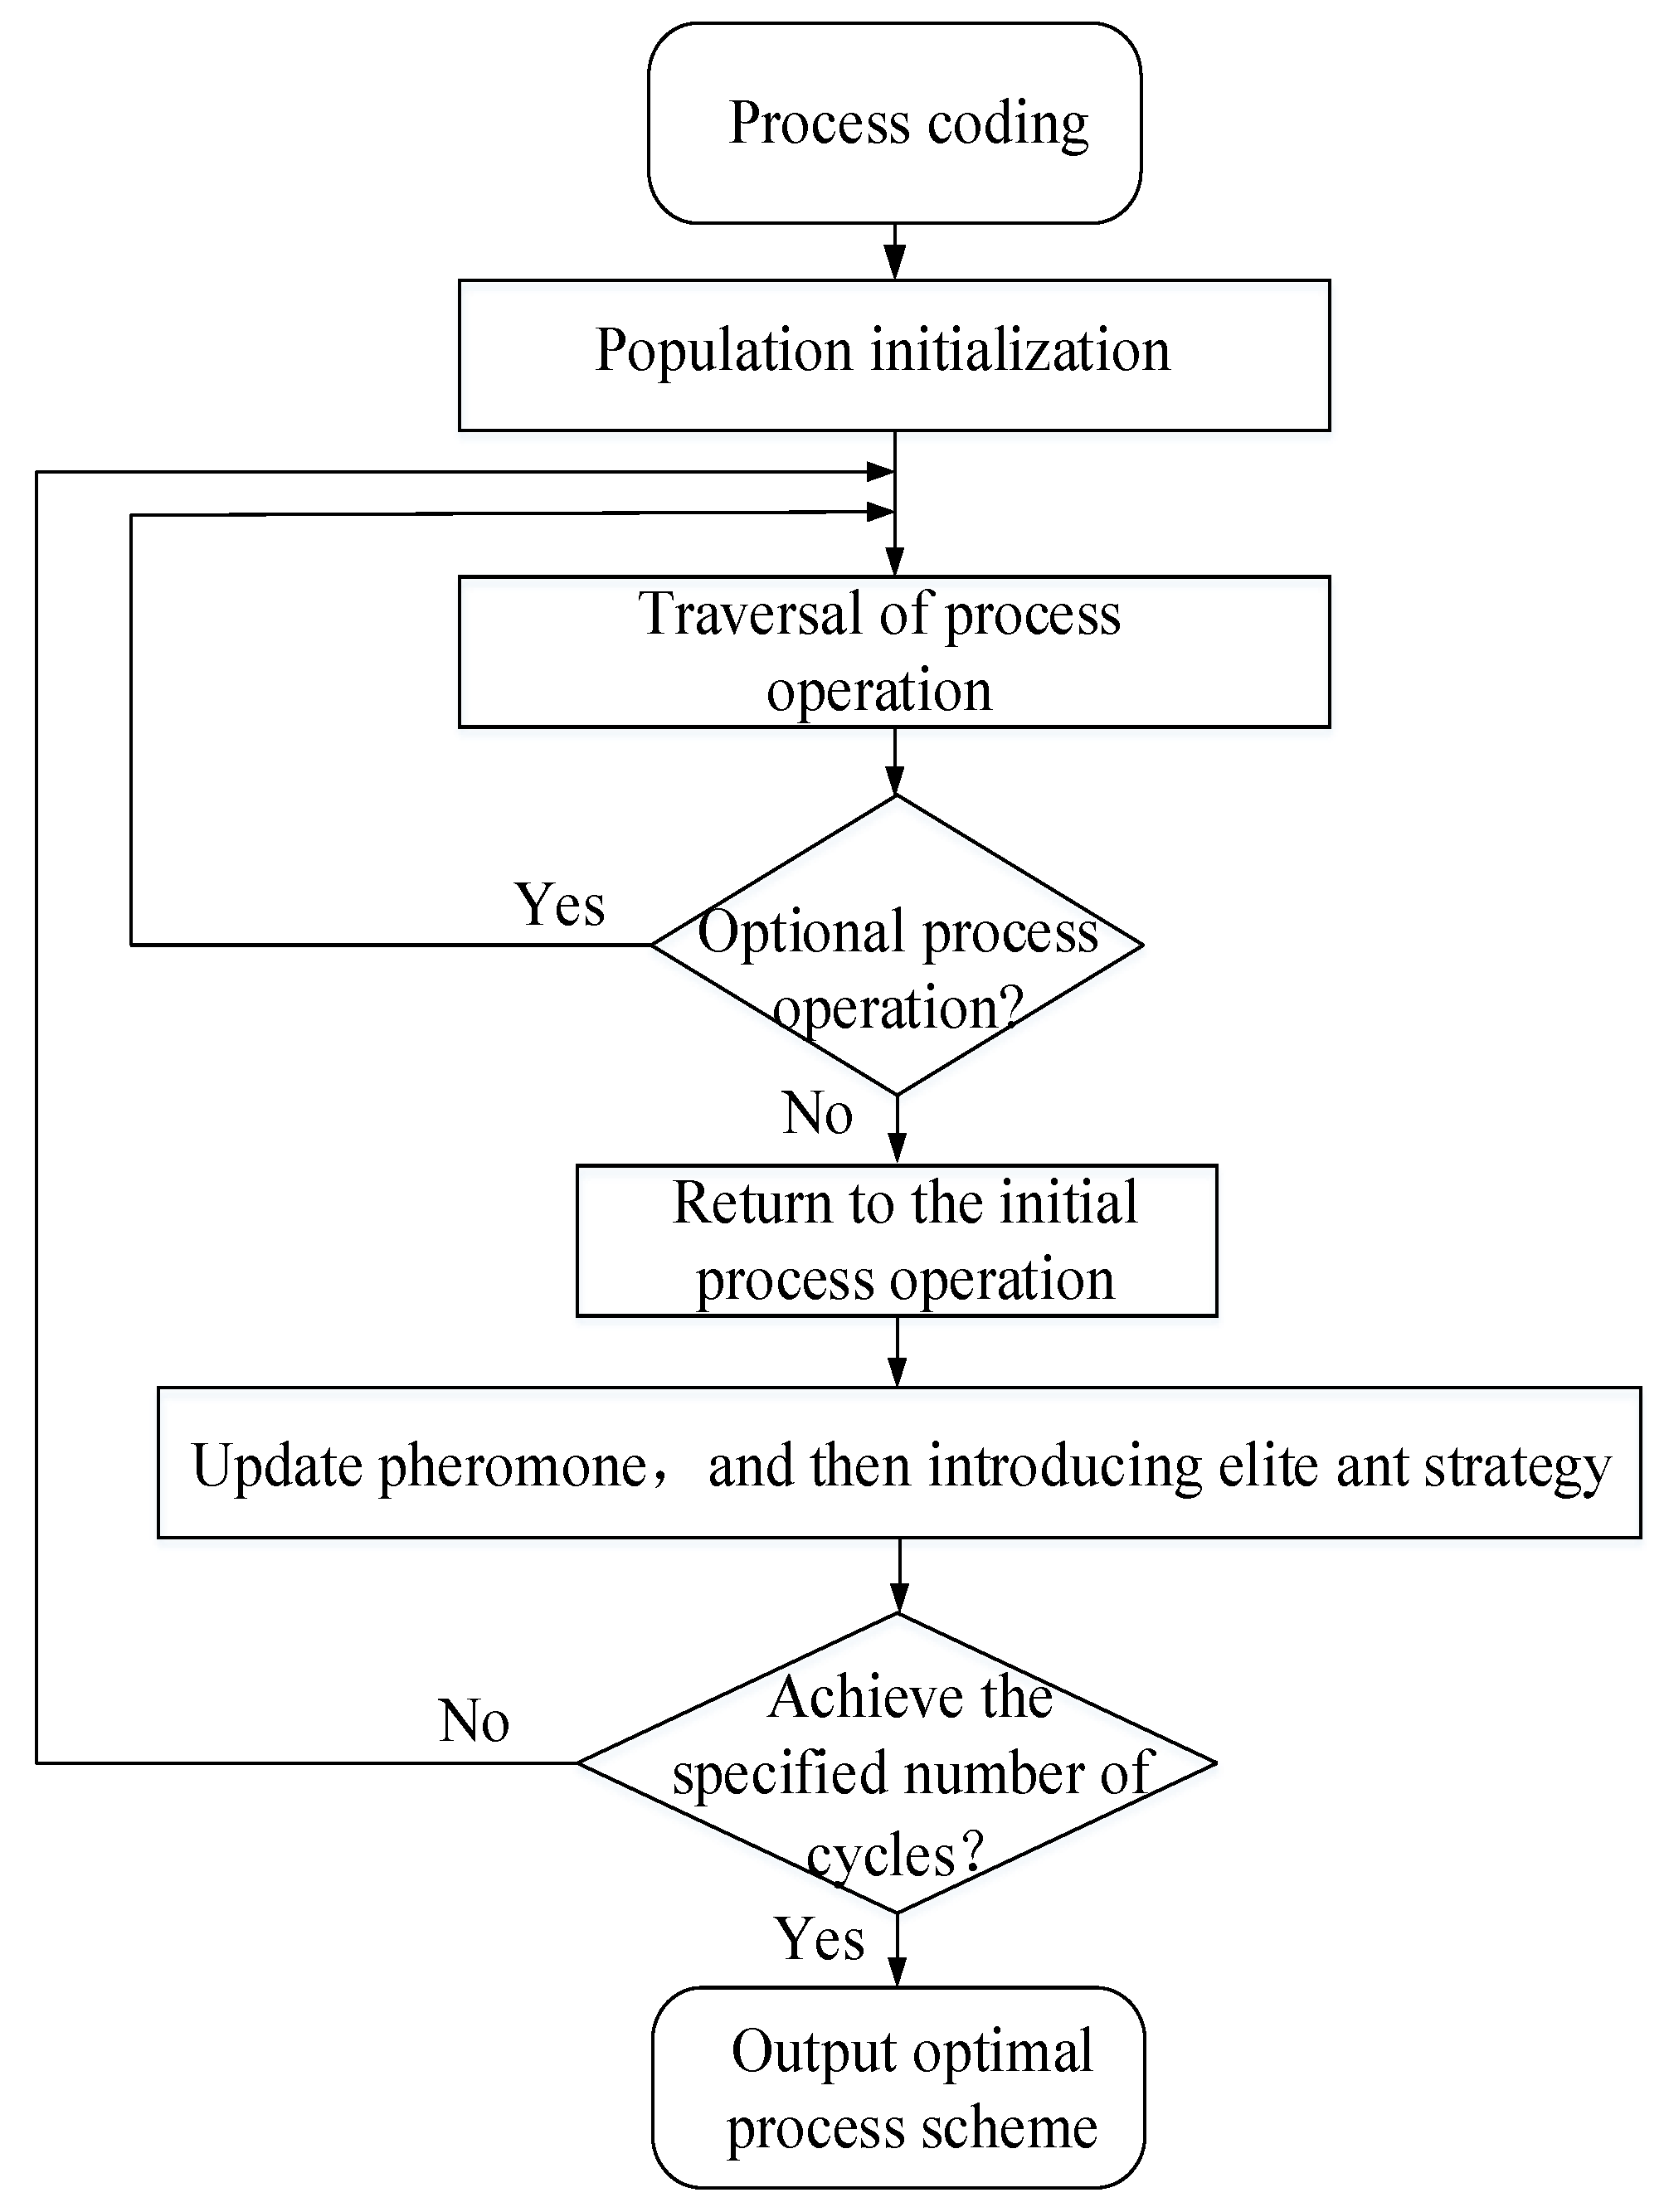
Once the optional remanufacturing process schemes and objective function are obtained, ES-ACO can be used to optimize the process schemes. The specific process of using ES-ACO to optimize remanufacturing process schemes is shown in Figure 3 below.
- (1)
- Process coding: The reconditioning process operations are coded with binary-coded digits, such as grinding number: 0001, cold welding number: 0010.
- (2)
- Population Initialization: A population composed of ants is generated randomly, and ant decides the direction of transfer according to the amount of information on each process scheme during its movement. The population size represents the optimal range of the remanufacturing process schemes. At the initial time, the information on each process scheme is equal, namely .
- (3)
- Traversal of process operation: Ant colony completes the traversal of process operation from initial process operation by probability . represents the probability of ant transferring from process operation to process operation (e.g., grinding→cold welding) during the n-th () iteration, amongwhere represents the next process operation which ant can choose. Different from the actual ant colony, the artificial ant colony system has a dynamic memory function, so () will adjust dynamically with the evolution process. represents the expected degree of transferring from process operation to process operation ; and represent the weights of the influence of and on the transfer probability of process operation, respectively.
- (4)
- Update pheromone: In each iteration, the ant colony traverses all the process operations of each process scheme and updates the pheromones of all process schemes, namely:where represents the volatilization coefficient of pheromone.
- (5)
- Introducing elite ant strategy: In each iteration, the ant with the optimal objective function value (i.e., EE value) obtains additional pheromone, namely:where represents the amount of information that the k-th ant stays between process operations in this cycle; represents the amount of information increment on the process path in this cycle, represents the objective function value of the k-th ant.
- (6)
- Determine whether the specified number of cycles has been reached: If so, stop the cycle and output the optimal objective function value, or else return to the third step.
While ES-ACO is applied to optimize the process schemes, the ACO is set as a comparison algorithm to verify the effectiveness of the proposed algorithm. Apart from the step of introducing an elite ant strategy, other specific implementation processes of ACO are the same as those of ES-ACO. As a comparative experiment, the parameters setting and operating environment of ACO are set as the same as the proposed ES-ACO.
2.2. EE Evaluation Study of Remanufacturing Oriented to Quality Uncertainty
After obtaining the optimized EE in the last section, the functional relationship between the quality coefficient of used components and the optimized EE can be constructed. This section is divided into three parts:
- (1)
- The calculation of the quality coefficient of used components. In this step, firstly, the probability distributions of fault characteristics of used components are obtained by using the method found in Section 2.1.1; secondly, the relative processing difficulty of different fault characteristics of a certain type of the used component is determined by the analytic hierarchy process (AHP). Then, the quality coefficient of used components is calculated based on the probability distribution of fault characteristics and the relative processing difficulty.
- (2)
- Correlation analysis. The law of large numbers is used to verify that running lots of stochastic data can make the quality coefficient and the optimized EE form a one-to-one mapping relationship, and then NS is utilized to run lots of stochastic data to obtain the numerical simulation curve of the quality coefficient and the optimized EE.
- (3)
- Polynomial function fitting. PFF is applied to fit the numerical simulation curve of quality coefficient and the optimized EE, after that, the fitting accuracy is checked; then, the range of quality coefficient of used components suitable for remanufacturing is obtained by considering the cost factor.
2.2.1. Calculation of the Quality Coefficient
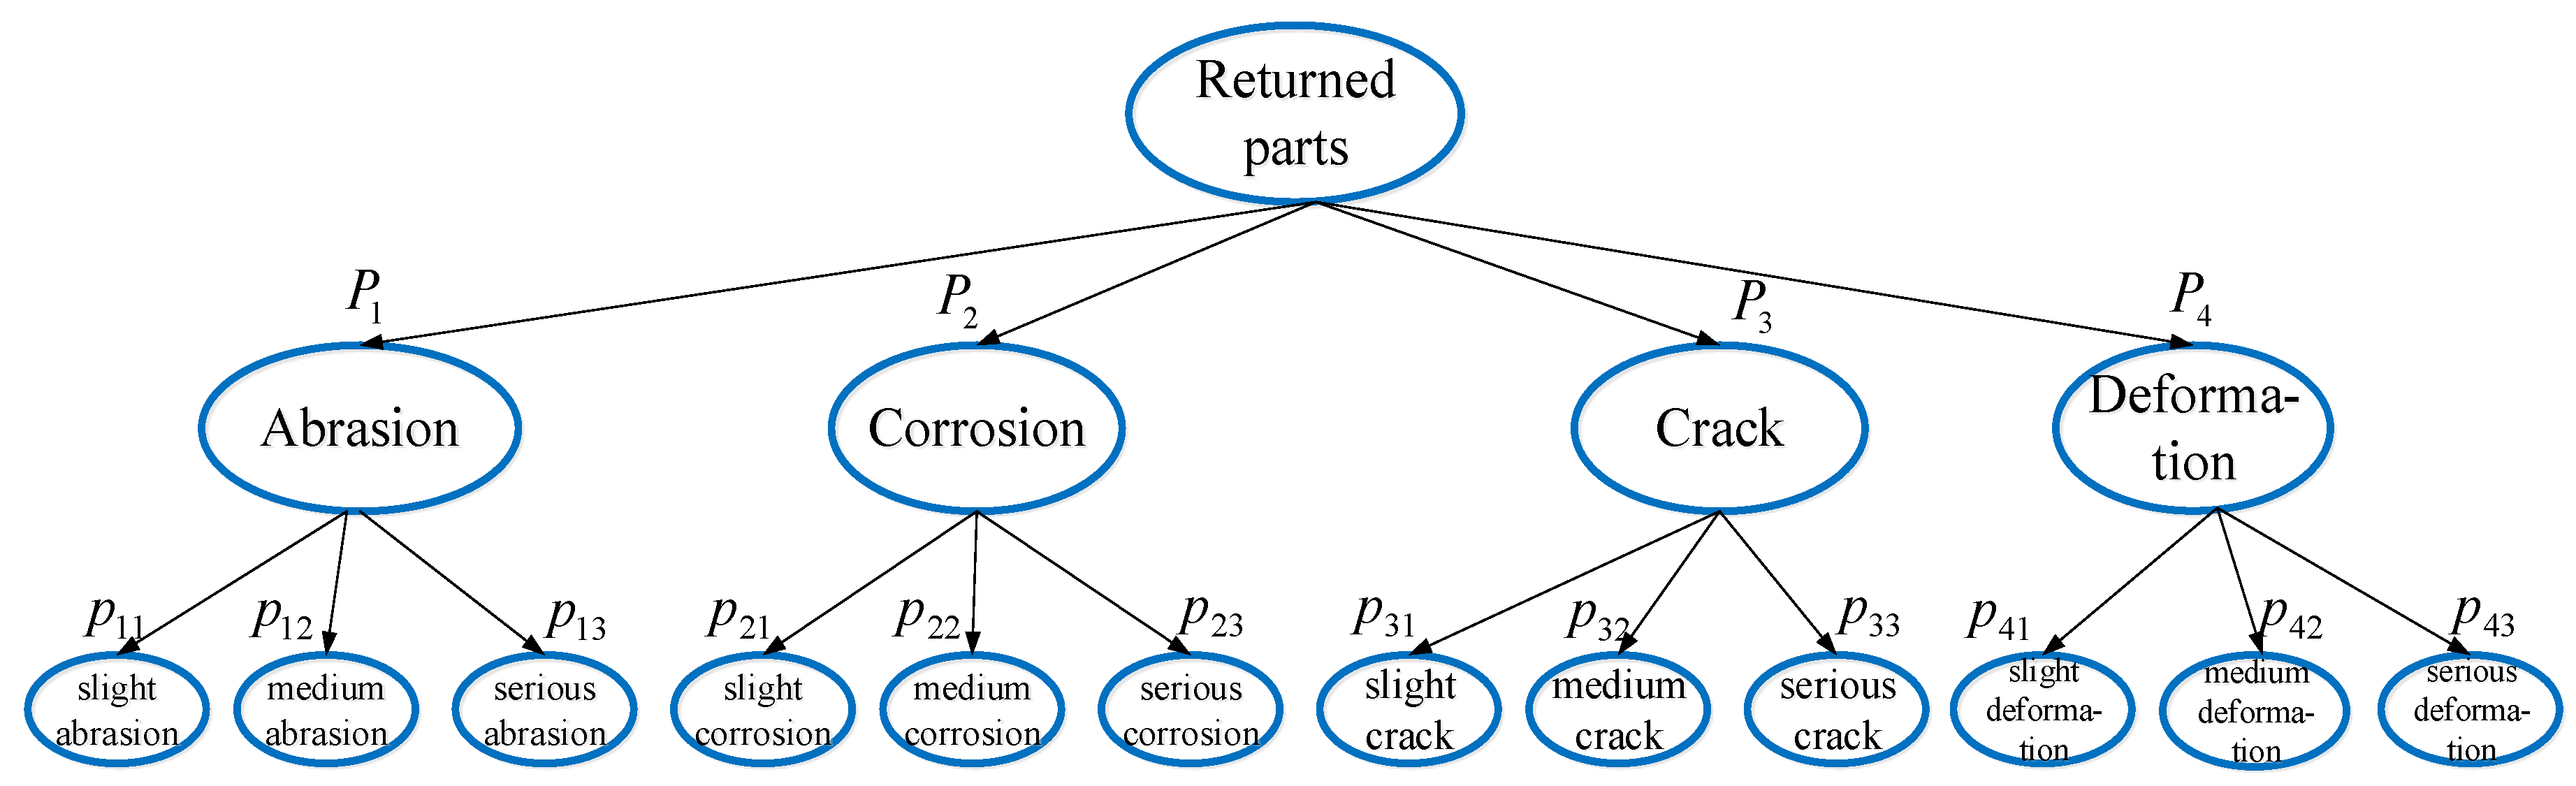
Once the failure features of the used components have been determined in Section 2.1.1, the quality coefficient of the used components can be calculated. It can be seen from Table 1 that in a used component, there may be multiple damaged parts with the same failure form and failure degree. Therefore, the total number of failure locations of used components is set as , and the number of failure locations of wear, corrosion, crack and deformation is set as , , and , respectively. , and respectively denote the number of failure locations of slight wear, moderate wear and severe wear. Similarly, , , ; , , ; and , , denote the number for failure locations of other three failure forms. In order to better describe the number for failure locations of used components. Matrix is used to express the distribution of the number for failure locations of used components.
Once the of the used components is determined, the probability distribution of the failure locations of the used components can be obtained, which is represented by matrix . The failure locations distribution condition of used components is shown in Figure 4.
Once the probability distribution of the failure locations is determined, it is necessary to analyze the relative processing difficulty of each failure feature. Here, the relative processing difficulties ; ; and of the four failure forms of used components (namely, wear, corrosion, crack and deformation) are obtained by the analytic hierarchy process (AHP). Similarly, the relative processing difficulties of different failure degrees of wear failure are represented by , , ; , , ; , , and , , respectively indicate the relative processing difficulty of different failure degrees of the other three failure forms (i.e., corrosion failure, crack failure and deformation failure). The matrix is used to indicate the relative processing difficulties of the failure features of the used component.
Therefore, the quality coefficient of used components can be expressed by the following Formula (14):
2.2.2. Correlation Analysis
Once the quality coefficient of used components and the optimized EE are obtained, the correlation between them needs to be analyzed. From Formula (14), is determined by , namely, if the structure of is determined, then will be uniquely determined; on the contrary, a certain may correspond to different . Therefore, the law of large numbers is introduced to solve this problem.
It can be known from the law of large numbers that if the test is repeated several times under the condition of constant testing, then the frequency of the random event approximates its probability [27], that is, when the number of trials is close to infinity, the structure of corresponding to the becomes uniquely determined. So, when the sample size is large enough, the structure of the matrix and the corresponding EE will be determined. Therefore, in order to establish a one-to-one mapping relationship between and , more than 1000 arbitrary data points are run by MATLAB R2016b software (The MathWorks, Natick, MA, US) to get the uniform distribution of the optimized EE with , namely, . Then, the numerical simulation curve model of the optimized EE varying with is obtained by using approximation as .
2.2.3. Polynomial Function Fitting
Once the numerical simulation curve model of the optimized EE changing with is obtained, a reasonable mathematical function is needed to express this correspondence, that is, if a value is given, then the corresponding EE value can be obtained by this mathematical function. Polynomial function fitting, also known as polynomial curve fitting, is a representation of the existing data into a mathematical equation through mathematical methods [28]. The purpose of the fitting is to obtain a continuous function that matches the known data. Namely:
where denotes the highest number of fitting, represents the constant portion, and represents the EE evaluation function. The evaluation accuracy is automatically generated by MATLAB software according to different numerical simulation models and fitting times. At the same time, because of the particularity of remanufactured products, in general, only when the cost of remanufactured products is less than 50% of the corresponding new products can enterprises make a profit [29]. Therefore, it is necessary to screen out the quality range of used components that meet the cost constraints.
3. Case Study
A lathe spindle refers to the spindle that drives the workpiece or tool to rotate on the lathe. However, due to the heavy load and fast wear of the lathe spindle, the lathe spindle is prone to fatigue corrosion, plastic deformation and other failures. The price of the new lathe spindle is generally higher, so in order to reduce losses, enterprises will choose to remanufacture the used lathe spindle in most cases. So, the effectiveness of the proposed method is verified by taking the remanufacturing of a factory’s commonly used lathe spindle as an example.
3.1. Optimization of the Remanufacturing Process for a Used Lathe Spindle
3.1.1. Design of Optional Process Schemes
After cleaning and testing, the failure features of the used lathe spindle were extracted as follows: Free surface wear 0.7 mm, surface electrochemical corrosion 0.12 mm and free surface crack 0.6 mm. According to the process sub-schemes information in Table 1, The first three process sub-schemes are: p1: Grinding→cold welding→electroplating, p2: Slotting→accurate grinding→cold welding, p3: Cold welding→mending→electroplating. To facilitate description, repetitive process operations in the three sub-process schemes are eliminated and all remaining process operations are represented by the numbers in the Table 2 below.
A total of 720 (6 factorial) integrated process schemes will be generated without considering constraints after the initial process sub-schemes are obtained. According to typical process constraints and sequence constraints, these process schemes can be reduced to eight, which can be represented by DG as shown in Figure 5 below. The eight process schemes in Figure 5 are shown in Table 3 below.
Once the optional remanufacturing process schemes of the used lathe spindle are obtained, ES-ACO can be utilized to select a process scheme with the best EE. can be known from literature [30]. The parameters of ES-ACO are set as follows: , , , . Where , , and the machine information for remanufacturing are provided by a remanufacturing factory. The machine information is shown in Table 4 below. At the same time, for adapting to the running of ES-ACO, the processing operations mentioned above are binary coded as shown in Table 5 below.
3.1.2. Results and Discussion of Process Optimization Stage
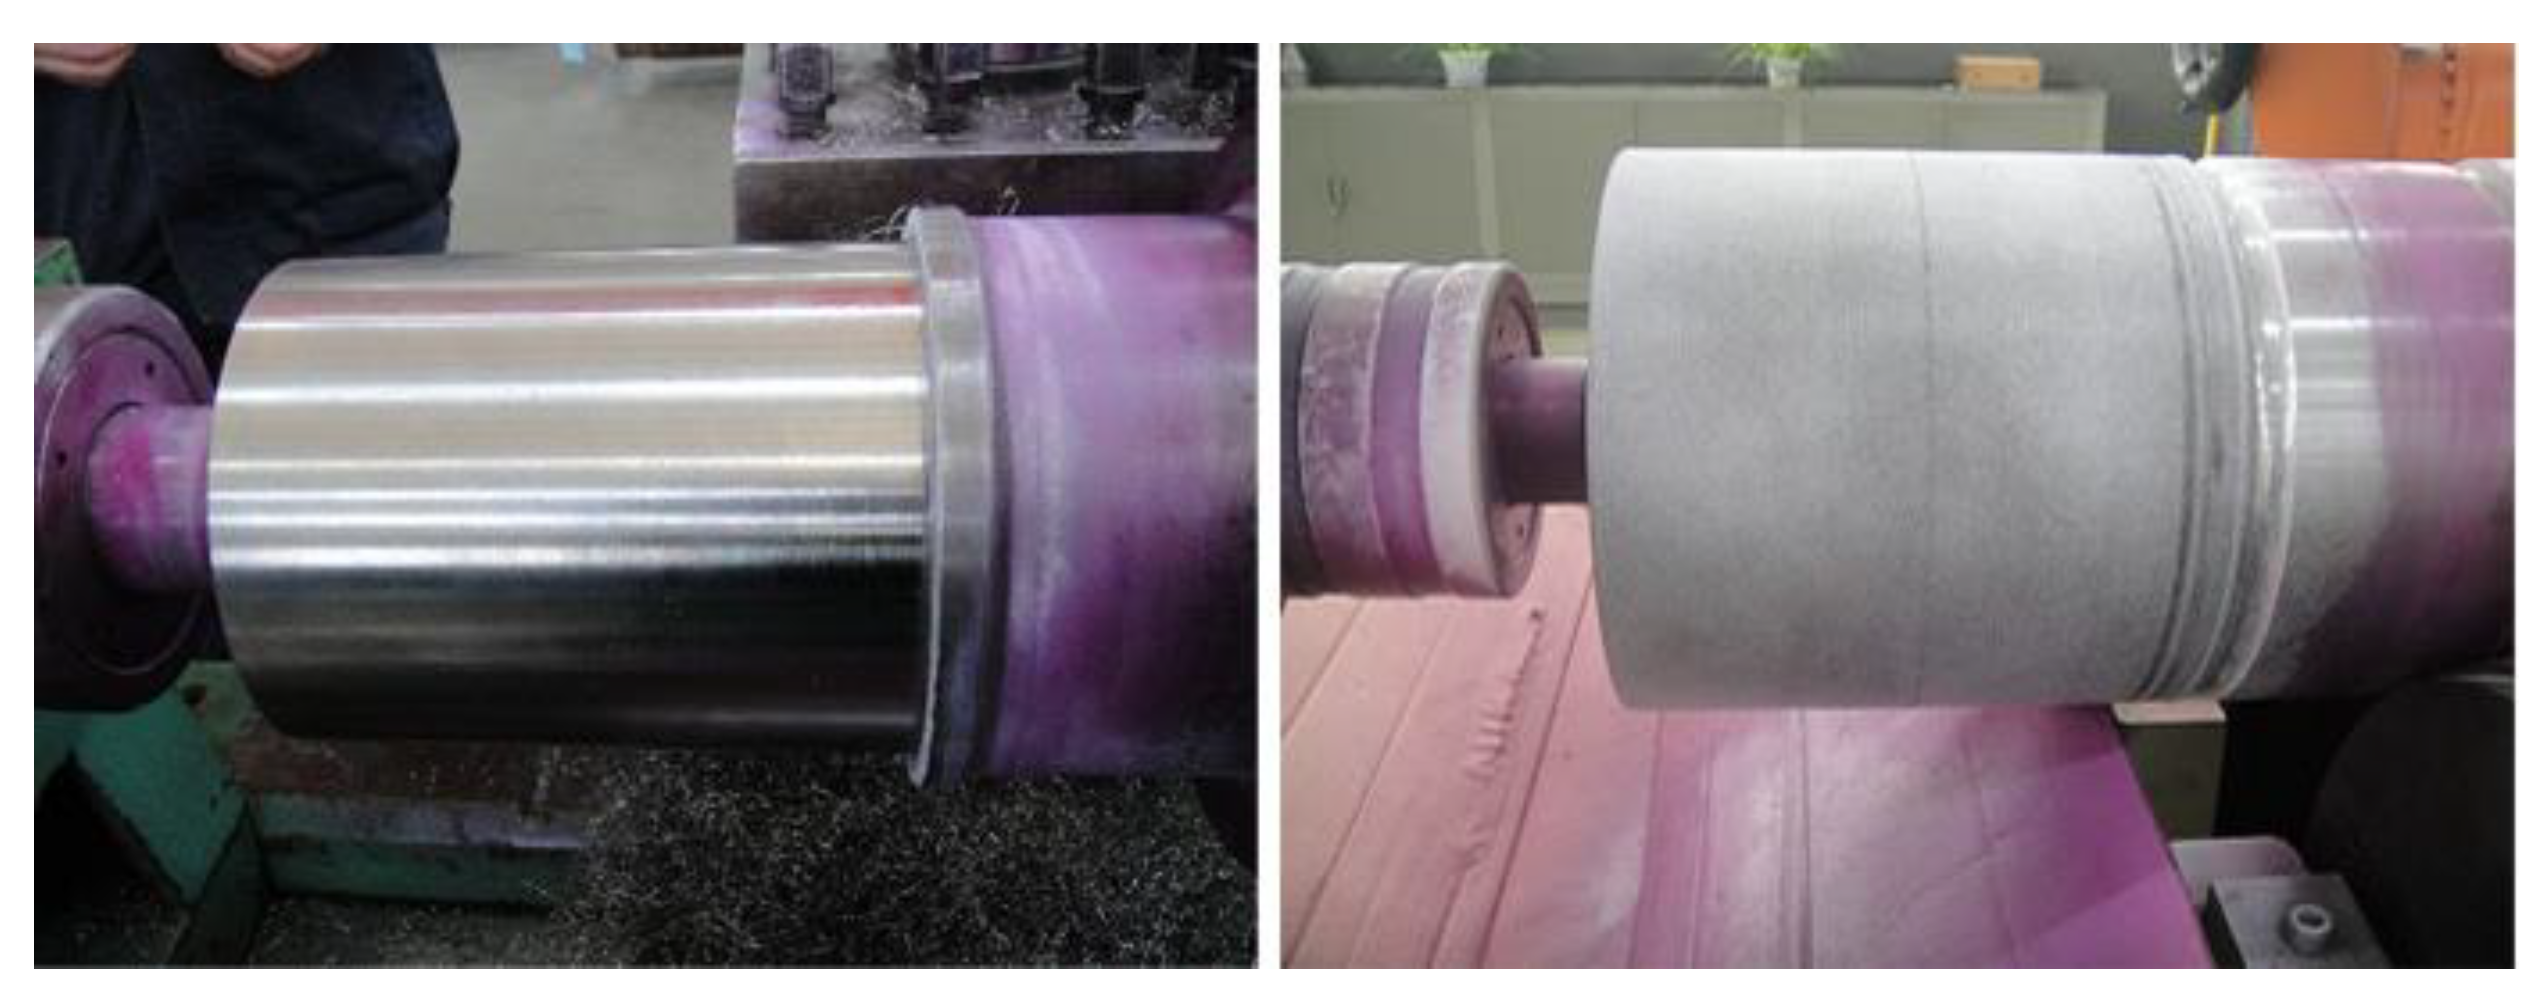
According to the parameter settings of ES-ACO and the optimization model of remanufacturing process schemes mentioned above, ES-ACO is run to get the optimal process scheme, whose specific information is shown in Table 6 and Table 7. The pictures of the used lathe spindle before and after reconditioning are shown in Figure 6 below.
According to the definition of remanufacturing EE, the EE is determined by and EI of remanufacturing. If remanufacturers want to achieve better EE, the usual way is to improve V and reduce EI. Among the four factors affecting , recycling costs and selling prices are constants depending on the market, so only the machine processing cost and manpower cost are needed to be discussed. Table 7 shows that the manpower cost (175.12 RMB) is much higher than the machine processing cost (20.97 RMB). For this type of used lathe spindles, engineers and technicians need to spend a lot of time to select the optimal remanufacturing process scheme, which leads to higher manpower cost. Using the method proposed in this paper can quickly and automatically generate the optimal process scheme, which effectively reduces the manpower cost of remanufacturing, thereby improving . In terms of EI, as shown in Table 4, Table 6 and Table 7, EI depends on the processing time of the machine. The optimal process scheme generated by the proposed method can effectively reduce the machine processing time, thereby reducing EI. In addition, it can be seen from Figure 6 that the performance of the used lathe spindle can be effectively restored by the optimal process scheme generated in this paper.
3.1.3. Comparative Analysis of Optimization Results
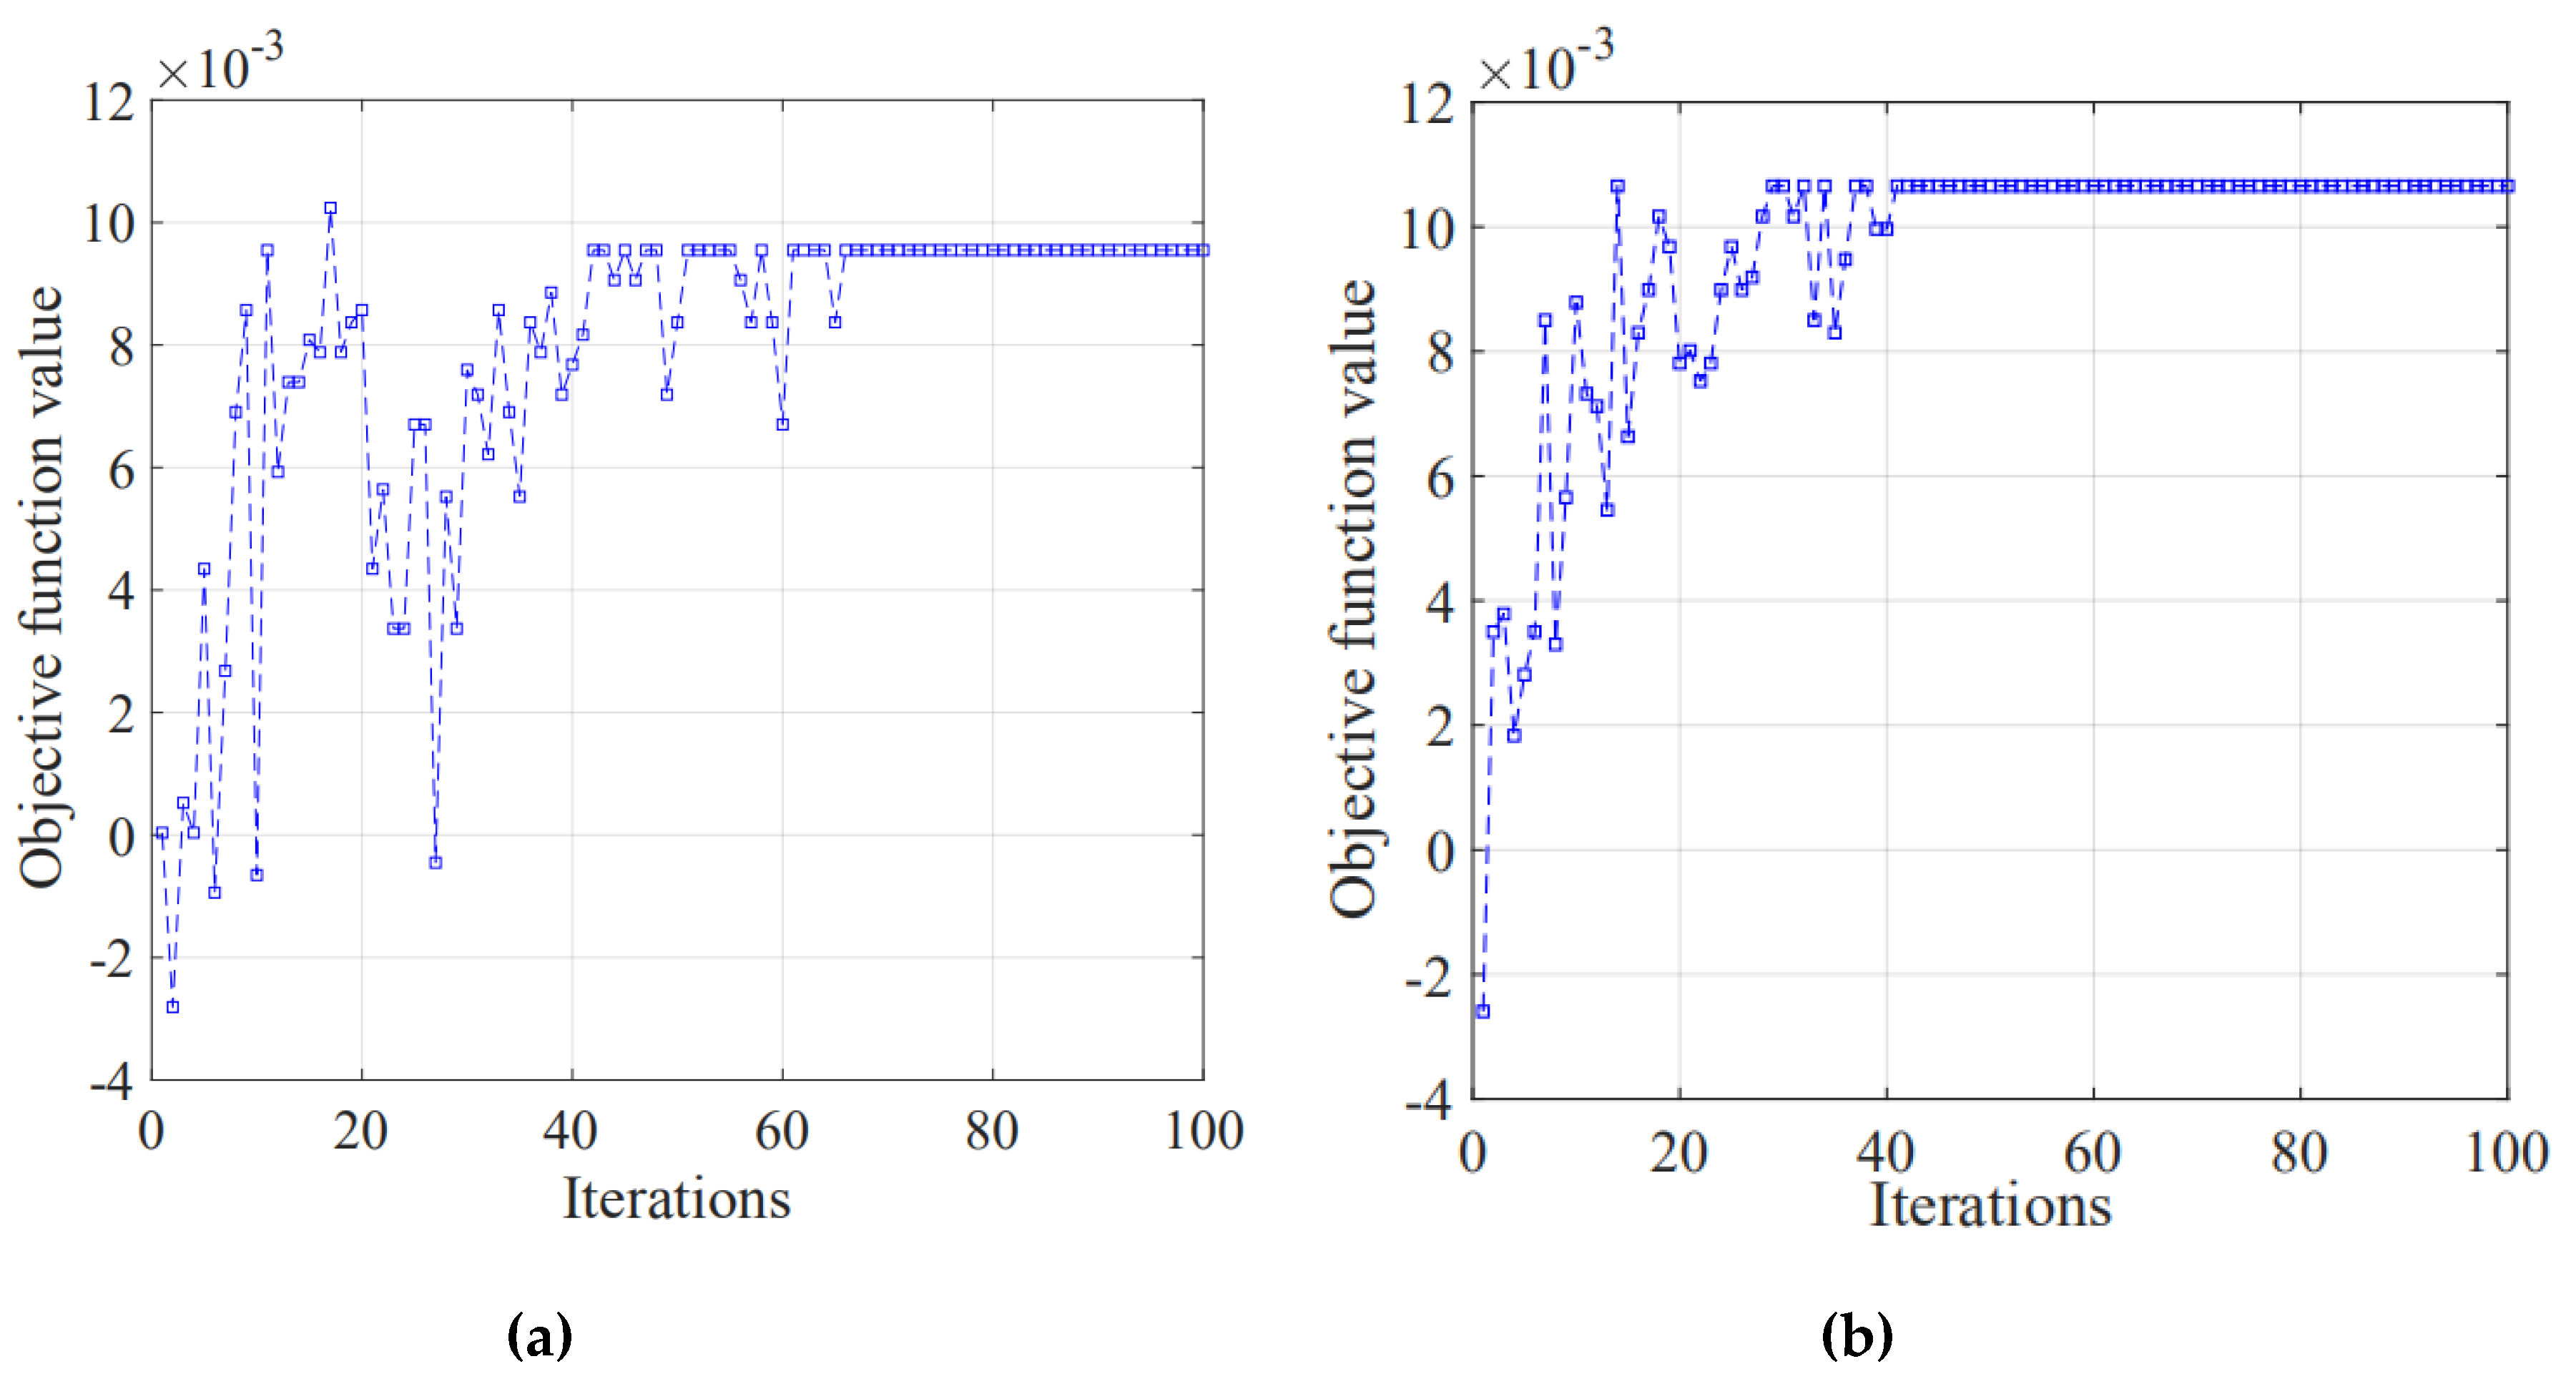
So as to give prominence to the merits of ES-ACO in solving speed and quality, the ACO is set as the comparative algorithm. The experimental results of these two algorithms are shown in Table 8, and the iterative optimization process is shown in Figure 7a,b. The two algorithms are run on the same PC (Hewlett-Packard (Chongqing) Co., LTD, Shapingba district, Chongqing, China) with MATLAB R2016b. The operating parameters of ACO are set according to the proposed ES-ACO. As shown in Figure 7a,b, both ACO and ES-ACO can achieve better convergence results. However, the global optimal value of ACO is significantly lower than that of ES-ACO. In addition, the average global optimal value of ACO fluctuates uncertainly, while ES-ACO remains relatively stable, and the solution set of the optimal solution is better than that of ACO.
So, it can be seen that compared with ACO, ES-ACO solves faster and the fluctuation of the optimal solution is more stable. But, in order to better demonstrate the effectiveness of the experiment, the experiment is repeated eight times. Generally, the quality and speed of the algorithm can be measured by the optimal global extremum, the worst global extremum and the average global extremum [31,32], so the three kinds of data obtained in these eight groups of experimentation are extracted and listed in Table 9. By comparing the optimal global extremum and the worst global extremum in Table 9, ACO and ES-ACO maintain the stability of the solution, but the average global extremum of ACO tends to decline, while ES-ACO keeps constant, and both the optimal and the worst solution sets are better than ACO. This is because elite ant strategy adds additional pheromones to elite ants in the process of ant colony iteration to improve the global search ability of ACO. This strategy improves the convergence speed and stability of ES-ACO. Therefore, the optimization results show that ES-ACO is a more suitable algorithm of remanufacturing process schemes optimization.
3.2. EE Evaluation of the Used Lathe Spindle Remanufacturing
3.2.1. EE Evaluation Results
After obtaining the optimized EE of the used spindle, the quality coefficient of the used lathe spindle can be calculated by the method shown in Section 2.2.1. Once the optimized EE and quality coefficient of the used lathe spindles are obtained, the numerical simulation model of them can be obtained by using the method in Section 2.2.2.
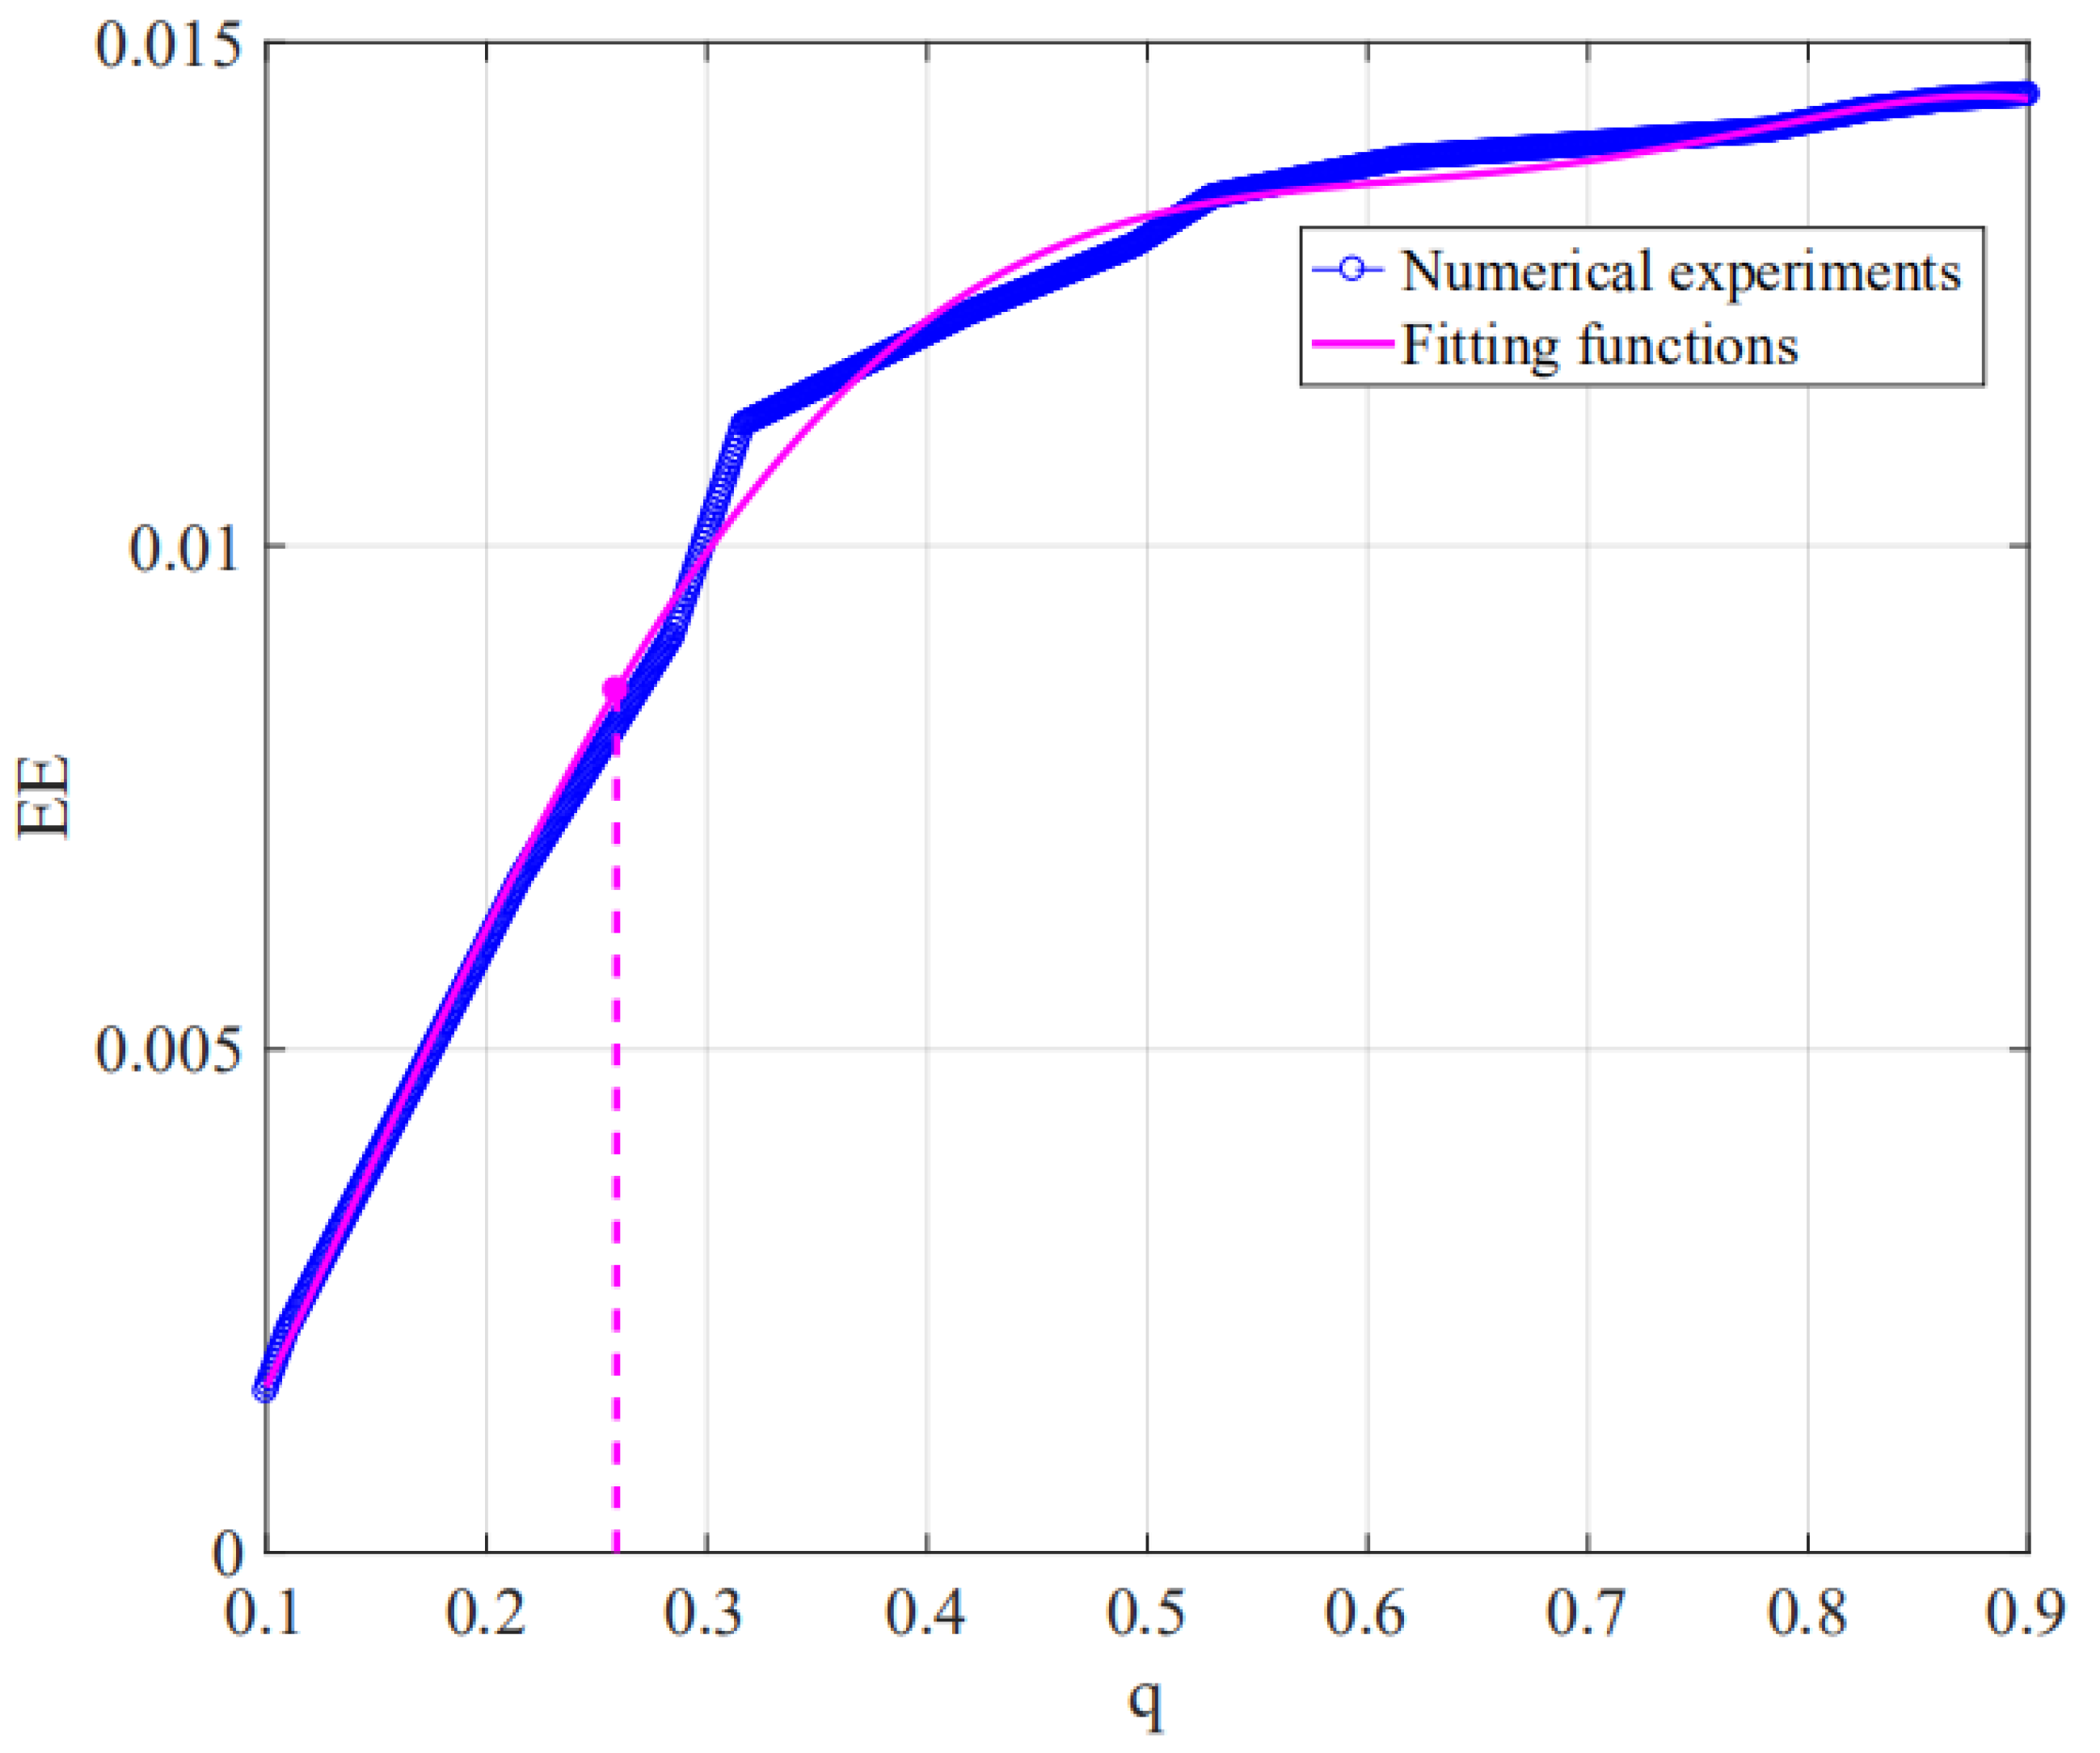
Here, in order to avoid extreme cases, the effective range of of all data points is set to [0.1, 0.9]. Figure 8 shows the numerical simulation curve and its corresponding polynomial function fitting curve, which are obtained by running MATLAB R2016b software on the same PC. The fitting parameters and fitting function (i.e., evaluation functions) are shown in the following Formulas (17) and (18), respectively. The accuracy of evaluation (confidence interval) of fitting function reaches 95%, and the optimized EE of remanufacturing can be evaluated by using as the input of Formula (18).
3.2.2. Discussion of Evaluation Stage
From the previous section, it can be seen that the evaluation accuracy of the evaluation function is 95%, which means that the probability of the evaluation error is 5%, which belongs to the small probability event, so the generated evaluation function is reasonable.
At the same time, the cost of this kind of new lathe spindle manufactured by the factory is 600 RMB; so according to the previous theory, only when the remanufacturing cost of this type of used Lathe spindle is less than 300 RMB, this type of used lathe spindle remanufacturing will be worthwhile. Therefore, according to the optimization theory in Section 2.1 and Formula (18), the critical can be calculated and the solution is 0.26. So, when is less than 0.26, due to the serious damage, no remanufacturing is made for cost reasons.
4. Conclusions
A research method of remanufacturing process EE considering optimization and evaluation is proposed. In this method, firstly, a process scheme with the optimal EE is obtained by failure characteristics analysis, DG and ES-ACO. After that, the evaluation model of the optimized EE is obtained by calculating the quality coefficient, correlation analysis and PFF. Meanwhile, the quality range of used components suitable for remanufacturing is calculated under cost constraints. Finally, the validity of the proposed method is validated by the example of the remanufacturing of commonly used lathe spindles.
Generally, studying the remanufacturing EE can better reflect the production demands of enterprises than other indicators (such as cost and time). For the used components to be remanufactured, the evaluation method proposed in this paper can be used to evaluate the optimal remanufacturing EE value; based on this value, the company can theoretically make decisions on whether or not to remanufacture these used components. Then, once the used components for remanufacturing have been identified, the optimization method proposed in this paper can be applied to optimize the remanufacturing process to achieve the best EE. At the same time, in order to avoid excessive pursuit of EE and neglect the profit of remanufacturing, the quality range of used components suitable for remanufacturing is theoretically screened from the perspective of cost constraints. However, other process attributes of used components (except for failure characteristics), such as material features and surface hardness, will also affect EE of remanufacturing process. How to comprehensively consider these process attributes to analyze EE should be the attention of future research.
Author Contributions
Conceptualisation, H.P., Z.J. and H.W.; investigation and experiment, H.P., Z.J. and H.W.; writing—original draft H.P., Z.J. and H.W.; writing—review and editing, Z.J. and H.W.
Funding
This research was funded by Hubei Provincial Department of Education (D20181102).
Conflicts of Interest
The authors declare no conflict of interest.
References
- Xu, B.S. Innovation and development of remanufacturing with Chinese characteristics for a new era. J. China Surf. Eng. 2018, 31, 1–6. [Google Scholar] [CrossRef]
- Ma, F.; Zhang, H.; Hon, K.K.B.; Gong, Q. An optimization approach of selective laser sintering considering energy consumption and material cost. J. Clean. Prod. 2018, 199, 529–537. [Google Scholar] [CrossRef]
- Anand, A.; Bansal, G.; Agarwal, M.; Aggrawal, D. Remanufacturing: An industrial strategy for economic benefits. Diagn. Tech. Ind. Eng. 2018, 137–155. [Google Scholar] [CrossRef]
- Liao, H.; Deng, Q.; Shen, N. Optimal remanufacture up to strategy with uncertainties in acquisition quality, quantity, and market demand. J. Clean. Prod. 2019, 206, 987–1003. [Google Scholar] [CrossRef]
- Cai, W.; Li, L.; Jia, S.; Liu, C.; Xie, J.; Hu, L. Task-oriented energy benchmark of machining systems for energy-efficient production. Int. J. Precis. Eng. Manuf.-Green Tech. 2019, 1–14. [Google Scholar] [CrossRef]
- Jiang, Z.; Ding, Z.; Zhang, H.; Cai, W.; Liu, Y. Data-driven ecological performance evaluation for remanufacturing process. Energy Convers. Manag. 2019, 198, 111844. [Google Scholar] [CrossRef]
- Wang, H.; Jiang, Z.; Zhang, H.; Wang, Y.; Yang, Y.; Li, Y. An integrated MCDM approach considering demands-matching for reverse logistics. J. Clean. Prod. 2019, 208, 199–210. [Google Scholar] [CrossRef]
- Cai, W.; Liu, C.; Lai, K.H.; Li, L.; Cunha, J.; Hu, L. Energy performance certification in mechanical manufacturing industry: A review and analysis. Energy Convers. Manag. 2019, 186, 415–432. [Google Scholar] [CrossRef]
- Li, L.; Huang, H.; Zhao, F.; Xiang, Z.; Lu, Q.; Wang, Y.; Liu, Z.; Sutherland, J.W. Variations of energy demand with process parameters in cylindrical drawing of stainless steel. J. Manuf. Sci. Eng. 2019, 141. [Google Scholar] [CrossRef]
- Kerr, W.; Ryan, C. Eco-efficiency gains from remanufacturing: A case study of photocopier remanufacturing at Fuji Xerox Australia. J. Clean. Prod. 2001, 9, 75–81. [Google Scholar] [CrossRef]
- Huisman, J.; Stevels, A.L.N.; Stobbe, I. Eco-efficiency considerations on the end-of-life of consumer electronic products. IEEE Trans. Electron. Packag. Manuf. 2004, 27, 9–25. [Google Scholar] [CrossRef]
- Quariguasi-Frota-Neto, J.; Bloemhof, J. An Analysis of the Eco-Efficiency of Remanufactured Personal Computers and Mobile Phones. Prod. Oper. Manag. 2012, 21, 101–114. [Google Scholar] [CrossRef]
- Deng, Q.; Liu, X.; Liao, H. Identifying critical factors in the eco-efficiency of remanufacturing based on the fuzzy DEMATEL Method. Sustainability 2015, 7, 15527–15547. [Google Scholar] [CrossRef]
- Liu, G.F.; Liu, W.X.; Zhang, S.B. Competition decision making model of manufacturers remanufacturing based on Eco-efficiency. Ind. Eng. Manag. 2016, 21, 16–21. [Google Scholar] [CrossRef]
- Rajendran, C.; Ziegler, H. Ant-colony algorithms for permutation flowshop scheduling to minimize makespan/total flowtime of jobs. Eur. J. Oper. Res. 2004, 155, 426–438. [Google Scholar] [CrossRef]
- Su, B.; Huang, X.M.; Ren, Y.H.; Wang, F.; Xiao, H.; Zheng, B. Research on selective assembly method optimization for construction machinery remanufacturing based on ant colony algorithm. J. Mech. Eng. 2017, 53, 60–68. [Google Scholar] [CrossRef]
- Ma, Y.; Huang, L.; Su, S. Ant colony algorithm for solving capacitated lot-sizing problem with remanufacturing. Comput. Appl. Softw. 2011, 28, 96–99. [Google Scholar] [CrossRef]
- Jiang, Z.; Jiang, Y.; Wang, Y.; Zhang, H.; Cao, H.; Tian, G. A hybrid approach of rough set and case-based reasoning to remanufacturing process planning. J. Intell. Manuf. 2019, 30, 19–32. [Google Scholar] [CrossRef]
- Khazaee, A.; Ebrahimzadeh, A.; Babajaniferemi, A. Classification of patients with MCI and AD from healthy controls using directed graph measures of resting-state fMRI. Behav. Brain Res. 2017, 322, 339–350. [Google Scholar] [CrossRef] [Green Version]
- Kuosmanen, T.; Kortelainen, M. Measuring eco-efficiency of production with data envelopment analysis. J. Ind. Ecol. 2010, 9, 59–72. [Google Scholar] [CrossRef]
- Ma, X.; Li, Y.; Zhang, X.; Wang, C.; Li, Y.; Dong, B.; Gu, Y. Research on the ecological efficiency of the Yangtze River Delta region in China from the perspective of sustainable development of the economy-energy-environment (3E) system. Environ. Sci. Pollut. Res. 2018, 25, 29192–29207. [Google Scholar] [CrossRef] [PubMed]
- Jiang, Z.; Zhou, T.; Zhang, H.; Wang, Y.; Cao, H.; Tian, G. Reliability and cost optimization for remanufacturing process planning. J. Clean. Prod. 2016, 135, 1602–1610. [Google Scholar] [CrossRef]
- Liao, H.; Deng, Q. A carbon-constrained EOQ model with uncertain demand for remanufactured products. J. Clean. Prod. 2018, 199, 334–347. [Google Scholar] [CrossRef]
- Liao, H.; Deng, Q.; Wang, Y.; Guo, S.; Ren, Q. An environmental benefits and costs assessment model for remanufacturing process under quality uncertainty. J. Clean. Prod. 2018, 178, 45–58. [Google Scholar] [CrossRef]
- Liao, H.; Shi, Y.; Liu, X.; Shen, N.; Deng, Q. A non-probabilistic model of carbon footprints in remanufacture under multiple uncertainties. J. Clean. Prod. 2019, 211, 1127–1140. [Google Scholar] [CrossRef]
- Liao, H.; Deng, Q. EES-EOQ model with uncertain acquisition quantity and market demand in dedicated or combined remanufacturing systems. Appl. Math. Model. 2018, 64, 135–167. [Google Scholar] [CrossRef]
- Lambert, G.; Paquette, E. The law of large numbers for the maximum of almost Gaussian log-correlated fields coming from random matrices. Probab. Theory Relat. Fields 2019, 173, 157–209. [Google Scholar] [CrossRef]
- Samadi, F.; Woodbury, K.A.; Beck, J.V. Evaluation of generalized polynomial function specification methods. Int. J. Heat Mass Transf. 2018, 122, 1116–1127. [Google Scholar] [CrossRef]
- Ijomah, W.L.; Mcmahon, C.A.; Hammond, G.P.; Newman, S.T. Development of design for remanufacturing guidelines to support sustainable manufacturing. Robot. Comput. Integr. Manuf. 2007, 23, 712–719. [Google Scholar] [CrossRef]
- Yu, S.; Wei, Y.M.; Guo, H.; Ding, L. Carbon emission coefficient measurement of the coal-to-power energy chain in China. Appl. Energy 2014, 114, 290–300. [Google Scholar] [CrossRef]
- Cai, W.; Lai, K.H.; Liu, C.; Wei, F.; Ma, M.; Jia, S.; Jiang, Z.; Lv, L. Promoting sustainability of manufacturing industry through the lean energy-saving and emission-reduction strategy. Sci. Total Environ. 2019, 665, 23–32. [Google Scholar] [CrossRef] [PubMed]
- Wang, J.F.; Liu, J.H.; Zhong, Y.F. A novel ant colony algorithm for assembly sequence planning. Int. J. Adv. Manuf. Technol. 2005, 25, 1137–1143. [Google Scholar] [CrossRef]
Figure 1.
The theoretical framework for the study of the remanufacturing process for ecological efficiency (EE).
Figure 1.
The theoretical framework for the study of the remanufacturing process for ecological efficiency (EE).

Figure 2.
Remanufacturing process schemes design based on a directed graph (DG).

Figure 3.
Optimization framework with an ant colony algorithm with elite strategy (ES-ACO).

Figure 4.
The failure locations distribution condition of used components.

Figure 5.
Integration of remanufacturing process schemes based on DG.

Figure 6.
The used lathe spindles before and after reconditioning.

Figure 7.
Convergence curve of (a) ACO and (b) ES-ACO.

Figure 8.
Numerical simulations (NS) and polynomial function fitting (PFF) curves of EE and for the used lathe spindles.
Figure 8.
Numerical simulations (NS) and polynomial function fitting (PFF) curves of EE and for the used lathe spindles.


Table 1.
Failure characteristics evaluation information of used components [18].
Table 1.
Failure characteristics evaluation information of used components [18].
| Damage Forms | Damage Conditions | Damage Degree Evaluation | Reconditioning Process Schemes |
|---|---|---|---|
| Abrasion | Slight | Grinding→electroplating | |
| Medium | Grinding→cold welding→electroplating | ||
| Serious | Direct replacement | ||
| Corrosion | Slight | Slotting→grinding→mending | |
| Medium | Slotting→accurate grinding→cold welding | ||
| Serious | Direct replacement | ||
| Crack | Slight | Cold welding→electroplating | |
| Medium | Cold welding→mending→electroplating | ||
| Serious | Direct replacement | ||
| Deformation | Slight | Grinding→straightening | |
| Medium | Heat treatment→straightening→annealing | ||
| Serious | Direct replacement |
Note: respectively indicates the amount of wear, corrosion depth, crack length and amount of bending.
Table 2.
Numbering information for reconditioning process operations.
| Process Operations | Grinding | Cold Welding | Electroplating | Slotting | Accurate Grinding | Mending |
|---|---|---|---|---|---|---|
| No. | 01 | 02 | 03 | 04 | 05 | 06 |
Table 3.
Remanufacturing process schemes information in Figure 5.
Table 3.
Remanufacturing process schemes information in Figure 5.
| No. | Process Schemes | No. | Process Schemes |
|---|---|---|---|
| P1 | 01→04→03→02→06→05 | P5 | 03→02→01→04→06→05 |
| P2 | 01→03→04→02→06→05 | P6 | 03→02→04→01→06→05 |
| P3 | 02→03→04→01→06→05 | P7 | 03→02→04→06→01→05 |
| P4 | 02→03→01→04→06→05 | P8 | 04→03→02→06→01→05 |
Table 4.
Machine information related to a used lathe spindle remanufacturing.
| Machine Number | Machine Name | Machine Type | Manufacturer | Power (Kw) | Cost (RMB/h) |
|---|---|---|---|---|---|
| M1 | Precision water grinder | RT-4080 | Dongguan Rongtian Precision Machinery Co., LTD | 14 | 12 |
| M2 | Intelligent precision welding machine | CS-1200 | Shanghai Chengsen Mechanical & Electrical Co., LTD | 4.6 | 2.8 |
| M3 | High precision electroplating polishing machine | GP55 | Wuxi Yuling Photoelectric Equipment Co., LTD | 3.5 | 3.5 |
| M4 | Automatic slotting machine | K3836 | Xingtai Changyuan Machinery Manufacturing Factory | 4.9 | 3.8 |
Table 5.
Binary coded information for process operations.
| Operations | Grinding | Cold Welding | Electroplating | Slotting | Accurate Grinding | Mending |
|---|---|---|---|---|---|---|
| No. | 01 | 02 | 03 | 04 | 05 | 06 |
| Code | 0001 | 0010 | 0011 | 0100 | 0101 | 0110 |
Table 6.
The remanufacturing process scheme with the optimal EE of the used lathe spindle by ES-ACO.
Table 6.
The remanufacturing process scheme with the optimal EE of the used lathe spindle by ES-ACO.
| No. | Machine Number | Processing No. | Processing Code | Processing Operation | Processing Time (min) | Processing Energy (KWh) |
|---|---|---|---|---|---|---|
| 1 | M2 | 02 | 0010 | cold welding | 50 | 3.83 |
| 2 | M1 | 03 | 0011 | electroplating | 40.5 | 9.45 |
| 3 | M4 | 04 | 0100 | slotting | 51 | 4.17 |
| 4 | M3 | 01 | 0001 | grinding | 46 | 2.68 |
| 5 | M2 | 06 | 0110 | mending | 49 | 3.76 |
| 6 | M3 | 05 | 0101 | accurate grinding | 40 | 2.33 |
Table 7.
The relevant parameters values corresponding to the optimal process scheme.
| /RMB | Total | Total | EE | ||||
|---|---|---|---|---|---|---|---|
| Machine Processing Cost | Manpower Cost | Returned Cost | Selling Price | Machine Processing Carbon Emission | |||
| 20.97 | 175.12 | 50 | 492 | 246 | 22,942.5 | 22,942.5 | 0.01072 |
Table 8.
The optimization results of ACO and ES-ACO.
| Algorithms | Process Schemes | Maximum Iterations | Optimal EE Values |
|---|---|---|---|
| ACO | 03→02→04→06→01→05 | 66 | 0.00965 |
| ES-ACO | 02→03→04→01→06→05 | 41 | 0.01072 |
Table 9.
Experimental results of repeated experiments.
| Algorithm | ACO | ES-ACO | ||||
|---|---|---|---|---|---|---|
| Experiment No. | Optimal Global Extremum | Worst Global Extremum | Average Global Extremum | Optimal Global Extremum | Worst Global Extremum | Average Global Extremum |
| 1 | 0.00965 | −0.0028 | 0.00895 | 0.01072 | −0.0026 | 0.01071 |
| 2 | 0.00965 | −0.0028 | 0.00874 | 0.01072 | −0.0026 | 0.01071 |
| 3 | 0.00965 | −0.0028 | 0.00862 | 0.01072 | −0.0026 | 0.01071 |
| 4 | 0.00965 | −0.0028 | 0.00857 | 0.01072 | −0.0026 | 0.01071 |
| 5 | 0.00965 | −0.0028 | 0.00854 | 0.01072 | −0.0026 | 0.01071 |
| 6 | 0.00965 | −0.0028 | 0.00851 | 0.01072 | −0.0026 | 0.01071 |
| 7 | 0.00965 | −0.0028 | 0.00849 | 0.01072 | −0.0026 | 0.01071 |
| 8 | 0.00965 | −0.0028 | 0.00848 | 0.01072 | −0.0026 | 0.01071 |
© 2019 by the authors. Licensee MDPI, Basel, Switzerland. This article is an open access article distributed under the terms and conditions of the Creative Commons Attribution (CC BY) license (http://creativecommons.org/licenses/by/4.0/).
Share and Cite
MDPI and ACS Style
Peng, H.; Jiang, Z.; Wang, H. Research on Ecological Efficiency for the Remanufacturing Process Considering Optimization and Evaluation. Processes 2019, 7, 567. https://0-doi-org.brum.beds.ac.uk/10.3390/pr7090567
AMA Style
Peng H, Jiang Z, Wang H. Research on Ecological Efficiency for the Remanufacturing Process Considering Optimization and Evaluation. Processes. 2019; 7(9):567. https://0-doi-org.brum.beds.ac.uk/10.3390/pr7090567
Chicago/Turabian StylePeng, Hong, Zhigang Jiang, and Han Wang. 2019. "Research on Ecological Efficiency for the Remanufacturing Process Considering Optimization and Evaluation" Processes 7, no. 9: 567. https://0-doi-org.brum.beds.ac.uk/10.3390/pr7090567
Note that from the first issue of 2016, this journal uses article numbers instead of page numbers. See further details here.