Numerical Simulation Study of Heavy Oil Production by Using In-Situ Combustion

1
School of Petroleum Engineering, Northeast Petroleum University, Daqing 163000, China
2
Key Laboratory of Tectonics and Petroleum Resources (China University of Geosciences), Ministry of Education, Wuhan 430074, China
*
Author to whom correspondence should be addressed.
Processes 2019, 7(9), 621; https://0-doi-org.brum.beds.ac.uk/10.3390/pr7090621
Submission received: 17 July 2019
/
Revised: 26 August 2019
/
Accepted: 27 August 2019
/
Published: 14 September 2019
(This article belongs to the Special Issue Chemical Process Design, Simulation and Optimization)
Abstract
:An in-situ combustion method is an effective method to enhance oil recovery with high economic recovery rate, low risk, fast promotion and application speed. Currently, in-situ combustion technique is regarded as the last feasible thermal recovery technology to replace steam injection in the exploitation of bitumen sands and heavy oil reservoirs. However, the oil-discharging mechanism during the in-situ combustion process is still not clearly understood. In this paper, the in-situ combustion process has been numerically simulated based on the Du 66 block. The effect of production parameters (huff and puff rounds, air injection speed, and air injection temperature) and geological parameters (bottom water thickness, stratigraphic layering, permeability ratio, and formation thickness) on the heavy oil recovery have been comprehensively analyzed. Results show that the flooding efficiency is positively correlated with the thickness of the bottom water, and negatively correlated with the formation heterogeneity. There exist optimum values for the oil layer thickness, huff and puff rounds, and air injection speed. And the effect of air injection temperature is not significant. The results of this paper can contribute to the understanding of mechanisms during in-situ combustion and the better production design for heavy oil reservoirs.
1. Introduction
1.1. Research Status
In-situ combustion technique is also called the inner layer combustion or fire-flooding, which is one kind of enhanced oil recovery (EOR) technology developed in 1930s. There are mainly two ways for in-situ combustion: Dry combustion and wet combustion [1,2]. A lot of studies have been conducted to study the characteristics of these two combustion modes. Wilson and Root proposed relevant calculation formulas through dry forward combustion and wet forward combustion experiments and discussed the main influencing factors [3]. Alexander et al. studied the effect of original oil saturation on the combustion efficiency [4]. Chleh and Gates proposed the methods for estimating the minimum required air flow to maintain oil combustion [5,6]. Thomas proposed a more mature energy conservation equation for the fired oil layers [7]. Parrish et al. conducted a forward wet combustion test, discussed the influencing factors of various parameters, and provided a design method for wet combustion [8]. Penberthy et al. have proposed a relationship between temperature and crude oil saturation distribution, material balance, air demand and oxygen concentration near the combustion front [9]. Garon et al. carried out inverse combustion experiments and discussed the related influencing factors [10]. Suat and Mustafa conducted in-situ combustion technique on Turkish heavy oil reservoirs [11]. In the dry combustion experiment, as the API (A measure of the density of petroleum and petroleum products developed by the American Petroleum Institute.) of the crude oil decreases, the fuel consumption rate becomes faster. In wet combustion, the higher the air-water ratio, the fuel consumption will decrease. Burger published a research report on the fired oil layer and proposed the oxygen demand calculation formula and the ignition time equation [12].
Besides the in-situ combustion technique, there are another two commonly used EOR technologies: Steam assisted gravity drainage (SAGD) and the polymer flooding. SAGD is a cutting-edge technology to improve the recovery of heavy oil, super heavy oil, and high condensate oil. SAGD technology can greatly increase oil recovery [13,14]. Polymer flooding technology is representative of the tertiary oil recovery stage. Through the application of polymer flooding, more supporting techniques can be studied to improve the sweep volume of the injection agent and the recovery factor of the tertiary oil recovery stage [15,16]. In China, in-situ combustion experiments were carried out in Xinjiang, Yumen, Shengli and Fuyu oilfields from 1958 to 1976. Since 1993, Shengli oilfield has listed the burning reservoir as a key pilot experimental project and six field experiments have been carried out [17]. However, due to the limitation of technical conditions, only dry combustion experiments have been carried out, and no wet combustion experiments have been carried out. Since 1999, based on the experience of dry combustion experiments, laboratory research on wet combustion has been carried out, and some achievements have been achieved. In 2001, Cai et al. carried out wet combustion experiments on heavy oil in the Hekou oilfield by using physical simulation technology [18]. The effect of the parameters on the reservoir performance under wet spontaneous combustion was studied, such as fuel consumption, apparent hydrogen-carbon atom ratio, combustion front propulsion speed, and air requirement. The results show that wet combustion can recover heat more effectively than dry combustion. It reduces fuel consumption and air consumption, and also improves oil recovery. In 2005, Guan et al. provided a method to determine the reservoir ignition temperature through laboratory tests [19]. The method was adopted in the Zheng 408 block of the Shengli oilfield, and the ignition temperature was successfully determined to be about 370 °C. Jiang et al. used a combination of physical modeling and numerical simulation to systematically study the mechanism of oil displacement in low-permeability reservoirs [20].
Due to the complexity in the process of in-situ combustion, it is difficult to summarize the general laws of thermal oil displacement in the fired oil layer by relying only on limited combustion experiments. In this case, the numerical simulation method is becoming more important. The numerical simulation of the in-situ combustion reservoir is more complex and difficult than steam injection. Frequent changes of chemical reactions and phase states greatly increase the number of governing equations. Thus, the relatively perfect numerical simulation technique of in-situ combustion appears later than steam injection. The development of the numerical simulation of in-situ combustion reservoir is from one-dimensional to two-dimensional and three-dimensional. The phase number is generally three-phase (gas, oil, water) or four-phase (gas, oil, water, and solid). In addition the nature of reservoir rocks and fluids, the consideration of gravity and capillary force make the numerical simulation of in-situ combustion more complex. Currently, there are some commercial numerical simulators which are suitable for various thermal recovery methods. Through numerical simulation, Bottia et al. found that the delayed ignition indicates high probability to get a spontaneous ignition. Furthermore the distance at which at which ignition occurs can be modified by the air injection rate [21]. Rahnema et al. found that the oil displacement is mainly driven by gravity drainage through the experiment and numerical simulation. Vigorous combustion was observed at the early stages near the heel of the injection well [22]. Pei et al. studied the effect of nitrogen injection on the effectiveness of in-situ conversion process by numerical simulation [23]. Nesterov et al. found that the activation energy of the light fraction in the oil is the most significant factor which affects the possibility of ignition through numerical simulation [24]. However, the effect of production and geological parameters on the heavy oil reservoir production with in-situ combustion has not been systematically studied in previous research.
For the Du 66 block, the fire-flooding is the main development method since 2011. However, with the expanding scale of fire-flooding pilot test in the Du 66 block and the influence of reservoir heterogeneity, there are some problems, such as the difference of the combustion state between the thin interbedded layers, the serious overlap of fire-flooding line in thick interbedded layers, the uneven spread of fire line and the unclear understanding of the combustion state, which affect the efficiency of in-situ combustion. In order to reveal the mechanisms of multi-layer in-situ combustion and understand the characteristics of multi-layer fire wave, and also determine the main factors affecting the oil recovery of the Du 66 block, it is necessary to carry out the numerical simulation study of in-situ combustion in the Du 66 block.
In this paper, the numerical simulation method was used to study the influence of production parameters and geological parameters on the fire-flooding efficiency based on the Du 66 block in the Shuguang oilfield. The rest of this paper is organized as follows: Section 2 presents the geological background of the studied field; Section 3 is the construction process of the geological model; Section 4 shows the results and analysis.
1.2. Geological Background
The Du 66 block of the Shuguang oilfield is structurally located in the northwest of the Shuguang oilfield in the middle part of the western slope of the Western Sag of the Liaohe fault basin. The development target stratum in this area is the Dujiatai reservoir in the upper fourth member of the Shahejie Formation of Paleogene. Up to 2000, the proven oil-bearing area in this area was 9.41 km2, and the petroleum geological reserve was 5935.2 × 104 t.
The top surface structure of the Dujiatai oil layer in the Du 66 block of the Shuguang Oilfield is generally a monoclinic structure under the slope background, which is inclined from the northwest to the southeast. The dip angle of the stratum is generally 5° ~ 10°. Reservoir lithology is mainly conglomerate sandstone and unequal-grained sandstone with medium sorting deviation, belonging to medium-high porosity and medium-high permeability reservoirs. The oil layer is mainly composed of a thin to medium–thick layer and the reservoir type is layered edge water reservoir. The density of crude oil at 20 °C is 0.9001–0.9504 g/cm3, and the viscosity of ground degassed crude oil at 50 °C is 325–2846 mPa·s, which is ordinary heavy oil.
(1) Formation characteristics
The Dujiatai oil layer in the Du 66 block is located in the front of a large fan-delta developed under the condition of slow water inflow. The sand bodies in the upper strata are very well developed. The average thickness of the Du II-1 sandstone is 12.5 m, and that of the Du I-2 sandstone is 6.5 m. The interlayers are relatively well developed with a maximum thickness of 44 m, generally 0.6–20 m. However, the development of different oil layers is different, and the distribution characteristics are also quite different. The maximum thickness of the interlayers from the upper layer to the Du 0 layer is 21.7 m, generally 10 m to 20 m. And the average thickness is 16.3 m. The lithology is brown–gray mudstone and the undeveloped areas of sandstone are often interbedded with oil shale, dolomitic limestone, and brown–grey mudstone. The porosity of the upper layer is generally 15% to 25%, with an average of 20.7%. The permeability is generally 200 to 1200 mD, with an average of 920.6 mD, which is a typical medium–high porosity and medium–high permeability reservoir. The oil layer group division and oil layer thickness statistics of the Du 66 block have been listed in Table 1.
(2) Development characteristics
The Du 66 block was developed in 1985 with a square well pattern. The current well spacing is 100 m after secondary infilling adjustment. The main development mode is in-situ combustion in the upper layer and steam huff and puff in the lower layer. Four development stages can be classified. The first stage is from 1985 to 1989, which can be called the production stage. The annual oil production rises to 45 × 104 t; the oil recovery rate rises to above 1.0%; the stage production rate is 4.4%. The second stage is from 1989 to 1999, which can be called the stable production stage. The annual oil production is more than 45 × 104 t, the oil recovery rate is more than 1.0%, and the stage recovery degree is 13.1%. The third stage is from 1999 to 2005, which can be called the stage of decline in production. The annual oil production drops rapidly, from 45 × 104 t to 16 × 104 t, and the oil recovery rate drops below 0.5%. The fourth stage is from June 2005 to the present, which is called the in-situ combustion development stage. With the continuous expansion of the scale of fire-flooding, the well opening rate has increased from 23.5% to 87.5%. The daily oil production of the single well has increased from 0.7 t/d to 3.2 t/d. The formation pressure has increased from 1.3 MPa to 3 MPa, and the annual oil production has rebounded, reaching more than 20 × 104 t, which means that the oil production by fire-flooding accounts for 80% of the block production.
However, with the expanding scale of the in-situ combustion pilot test in the Du 66 block and the influence of the reservoir heterogeneity, there are some problems, such as the difference of combustion state between the thin interbedded reservoirs, the serious overlap of fire-flooding line in thick interbedded reservoirs, the uneven spread of fire line and the unclear understanding of the combustion state, which affect the efficiency of fire-flooding and the oil recovery. In order to reveal the development mechanisms of the in-situ combustion and better understanding the characteristics of the multi-layer fire wave and determine the main factors affecting the efficiency of fire-flooding, it is necessary to carry out the simulation study of in-situ combustion in the Du 66 block.
2. Materials and Methods
The burning oil layer was a complex chemical process. On the basis of experimental research, this paper reproduced the whole process of the formation and migration of the oil-wall by numerical simulation, and analyzed the changes of temperature, composition content and crude oil characteristics in different stages. Thus, the characteristics of the oil-wall in fired oil layer could be revealed. At the same time, the influencing factors of the in-situ combustion process could be analyzed through sensitivity analysis on the production and geological parameters, which could provide the basis for the preliminary screening of the in-situ combustion reservoir and the production design of the target reservoirs.
(1) Modeling parameters
The preparation of the data was the basis of the reservoir modeling. Based on the study of the formation structure, sedimentary microfacies, and parameter interpretation, the data of wells, layers, and reservoir were collected and sorted. The grid step size was 10 m × 10 m and a 3-dimensional geological model was established for the working area. The total number of grids was 22 × 21 × 25 = 11,550.
(2) Modeling area
The modeling area was 46,200 m2. Nine vertical wells were modeled: 46-x38p, 46-g37p, 46-g36p, 46-038p, 46-036p, 46-g38p, 45-37p, 45-36p, 46-037AI. Among them, 46-037AI was the injection well, and the remaining 8 wells were production wells.
(3) Construction model
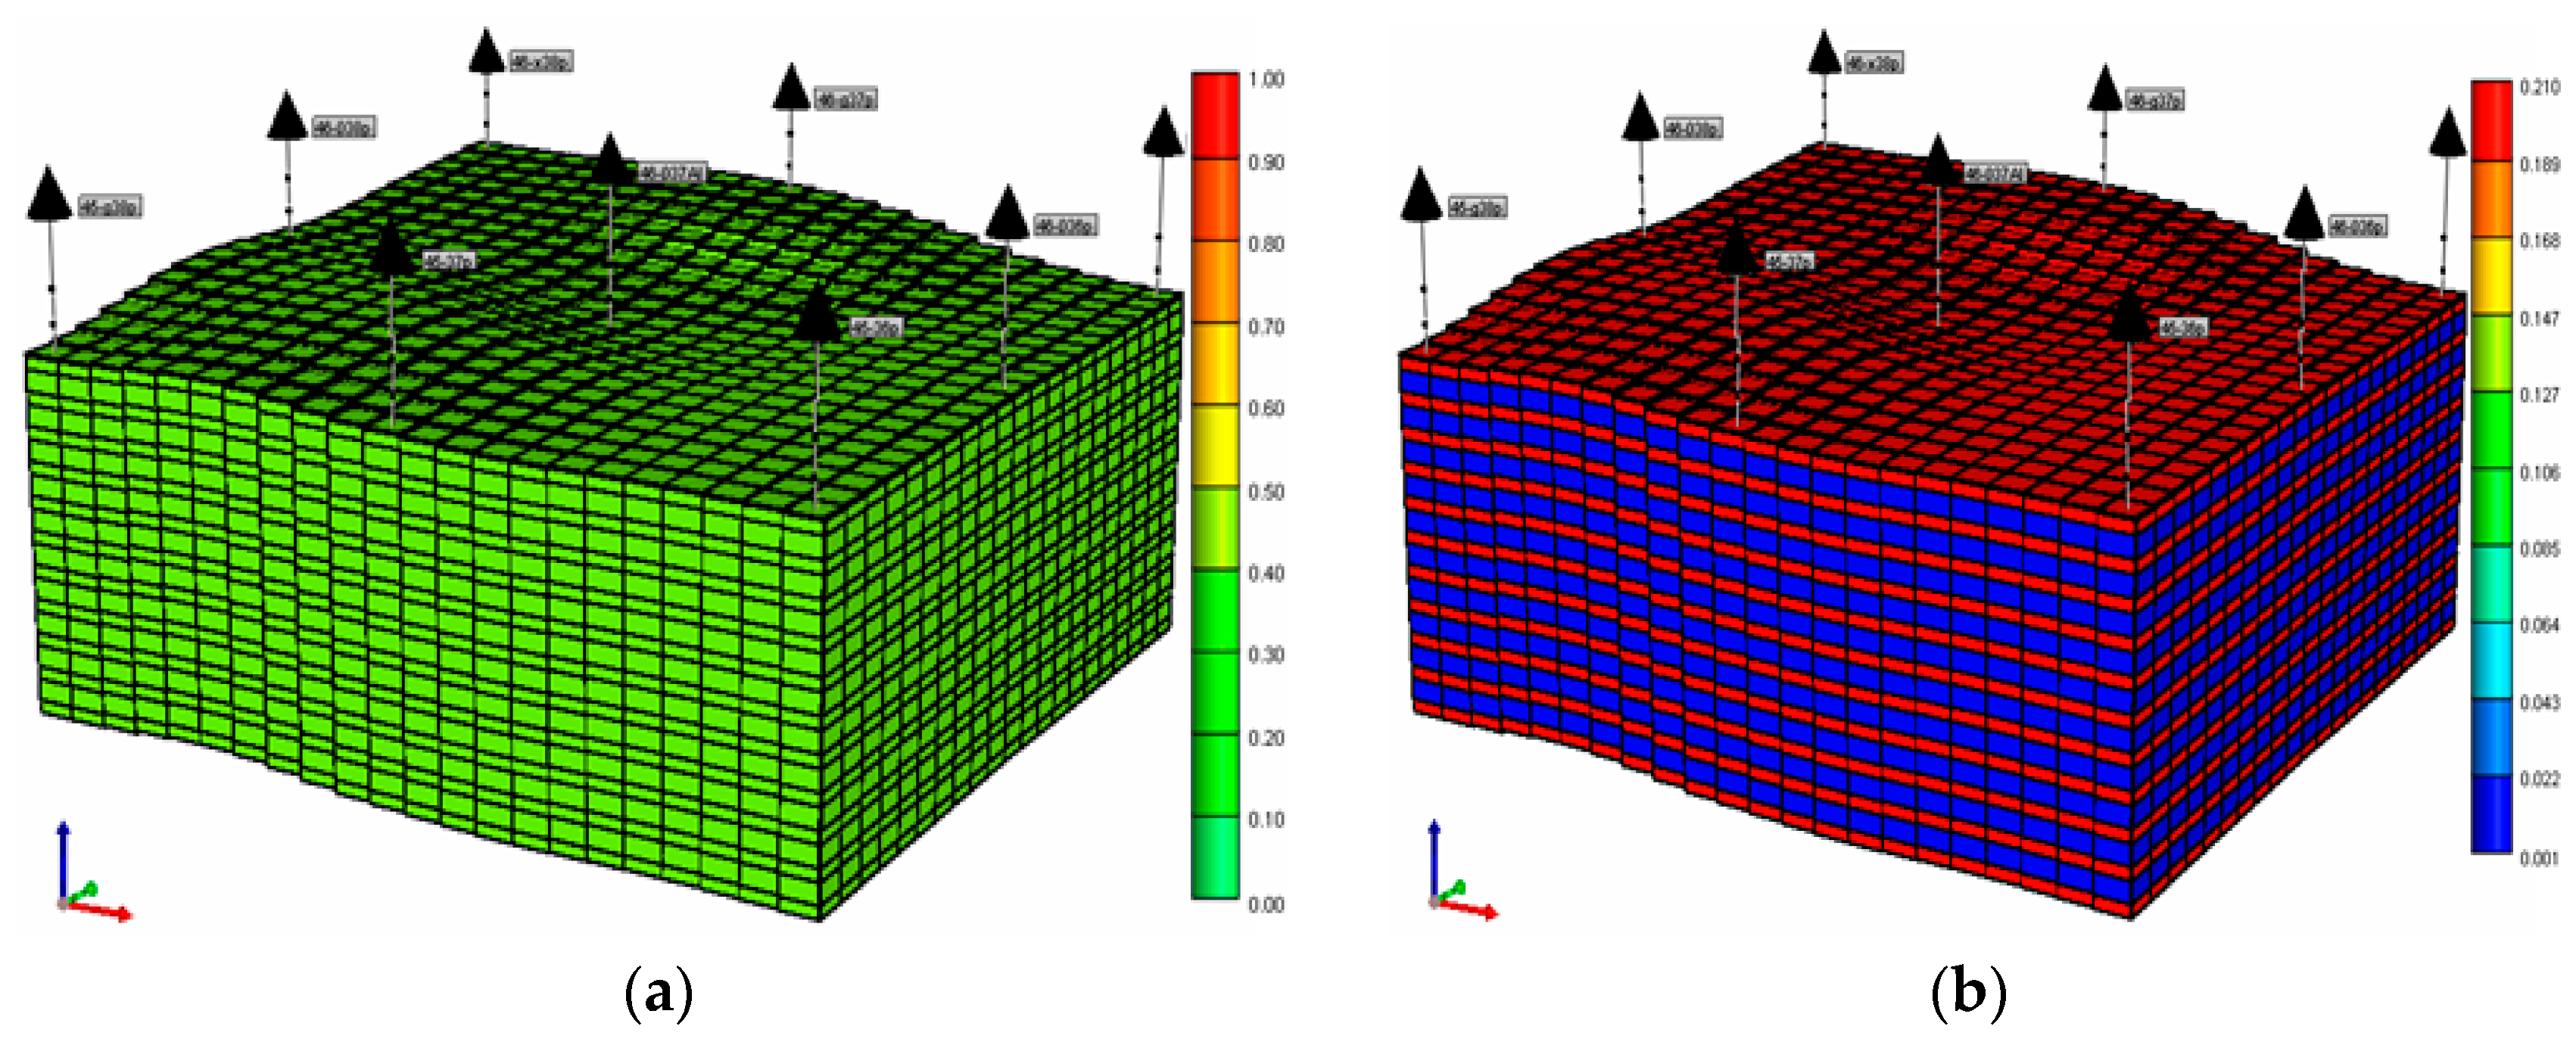
The anti-nine-point well network with the size of 220 × 210 m was adopted in this study and the development method was in-situ combustion. The Du 66 block was inclined from the northwest to the southeast, and the dip angle of the stratum was generally 5°~10°, which can truly reflect the changing trend of the stratum. The injection well was located in the center of the block, and the production wells were distributed at the corners of the block. The 3-dimensional distribution of the original oil saturation and porosity has been shown in Figure 1. From the oil saturation model of the Du 66 block (Figure 1a), the oil saturation was evenly distributed, and the initial oil saturation was 0.69 in average. From the porosity model of the Du 66 block (Figure 1b), there were 25 layers in the stratum. The porosity of the odd layers was 0.21, and the porosity of the even layers was 0.0013. The porosity was evenly distributed in the transverse direction.
3. Results
3.1. Formation Conditions of Oil Wall
3.1.1. Ventilation Intensity
From the simulation results, when the ventilation intensity of the injection well was less than 0.55 m3/(d.m2), the formation would not form oil-wall and fire-wall. In addition, the combustion leading edge temperature was lower than 220 °C, showing a low temperature oxidation state. At the end of the production, the maximum temperature of the formation was less than 220 °C. The highest temperature zone existed at the injection well. And there was no tendency to advance to the production well and no fire wall was formed. In the simulation, the pressure difference between the injection and production well was 7.4 MPa, which means the injection well pressure was much higher than the production well. It can be found that if the ventilation intensity and oxygen was not enough, it was difficult to maintain the fuel supply and the formation oxidation reaction. It can be concluded that the air injection speed should be increased to maintain stable combustion and meet the development of the in-situ combustion.
3.1.2. Original Oil Saturation
From the simulation results, when the original oil saturation of the local layer was less than 30%, the formation will not form oil-wall. At the end of production, the maximum temperature of the formation was less than 340 °C, and the highest temperature zone existed at the injection well end. In addition, there was no tendency to advance to the production well. Therefore, no fire wall was generated. It can be found that if the original oil saturation of the formation was too low, which was not conducive to the formation of the oil-walls. The formation of oil-walls was closely related to the geological conditions of the reservoirs.
3.2. Effect of Production Parameters
In this section, we analyzed the effect of the production parameters (huff and puff rounds, air injection speed, and air injection temperature) on the formation of oil-wall and the efficiency of in-situ combustion. Here, we chose different huff and puff rounds (1, 2, 3, 4, 5, 6, 7 rounds), different air injection speeds (1000 m3/day, 2000 m3/day, 3000 m3/day, 5000 m3/day), different air injection temperatures (20 °C, 60 °C, 80 °C, 100 °C). Based on the simulation results, optimal production parameters were obtained.
3.2.1. Huff and Puff Rounds
Here, we only changed the air huff and puff rounds and kept other the conditions the same to analyze the effect of the huff and puff rounds (one to seven rounds). The bottom pressure of the injection well was kept as 20 MPa; the steam temperature was 270 °C (543.15 K); the steam dryness was 0.70; the injection air temperature was 20 °C (298.15 K); the numerical simulation was carried out for 20 years. Comparison of the production indicators (recovery degree, cumulative oil production, gas-oil ratio, and gas production rate) under different huff and puff rounds are shown in Figure 2.
Dynamic production indicators under different huff and puff rounds have been listed in Table 2. It can be seen that the recovery degree and the cumulative oil production increased with the increase of the huff and puff rounds. However, the relative increase in the yield after five rounds of huff and puff was the most obvious. The more huff and puff rounds, the later the time the inject air burns the formation, and the longer the gas breakthrough the formation. In addition, it could be found that the gas-to-oil ratio was proportional to the huff and puff rounds. For one round huff and puff, the gas-oil-ratio still rose with time and was unstable. However, for other rounds, the ratio of gas to oil increased to the maximum and then gradually decreased and became stable.
The characteristic parameters of the oil-walls under different huff and puff rounds have been listed in Table 3. As can be found from Table 3, when the number of huff and puff rounds increased, the later the oil-wall was generated. The initial formation position was closer to the production well. The time when the thickness of the oil-wall reached a maximum was also delayed. As the huff and puff rounds increased, the formation water saturation increased and the width of the oil-wall gradually narrowed and the average saturation of the oil-wall decreased. In addition, it can be found that the pressure gradient in the oil-wall was generally high. The pressure gradient increased with the increase of the huff and puff rounds. The migration speed of the oil-wall also accelerated. This was because the oil-wall saturation was reduced and the resistance was reduced, which was conducive to the migration of the oil-wall.
The characteristic parameters of the fire-wall under different huff and puff rounds have been listed in Table 4. As can be found from Table 4, after five rounds of huff and puff, the combustion front had the highest temperature, which was up to 710 °C. In addition, the combustion under this condition had the best effect. The position of the fire-wall under different rounds was almost the same. Therefore, the huff and puff rounds will affect the temperature of the fire-wall.
The temperature change of the firing front and oil saturation change under different huff and puff rounds have been shown in Figure 3a,b, respectively. As can be found from previous figures and tables, after five rounds of huff-and-puff, the increase of the recovery degree and cumulative oil production were the most obvious. In addition, the temperature of combustion front was the highest, and the gas appearing time in the production well was also the latest. Therefore, for this study, five rounds of huff-and-puff was more conducive to in-situ combustion and the formation of oil-walls.
3.2.2. Air Injection Speed
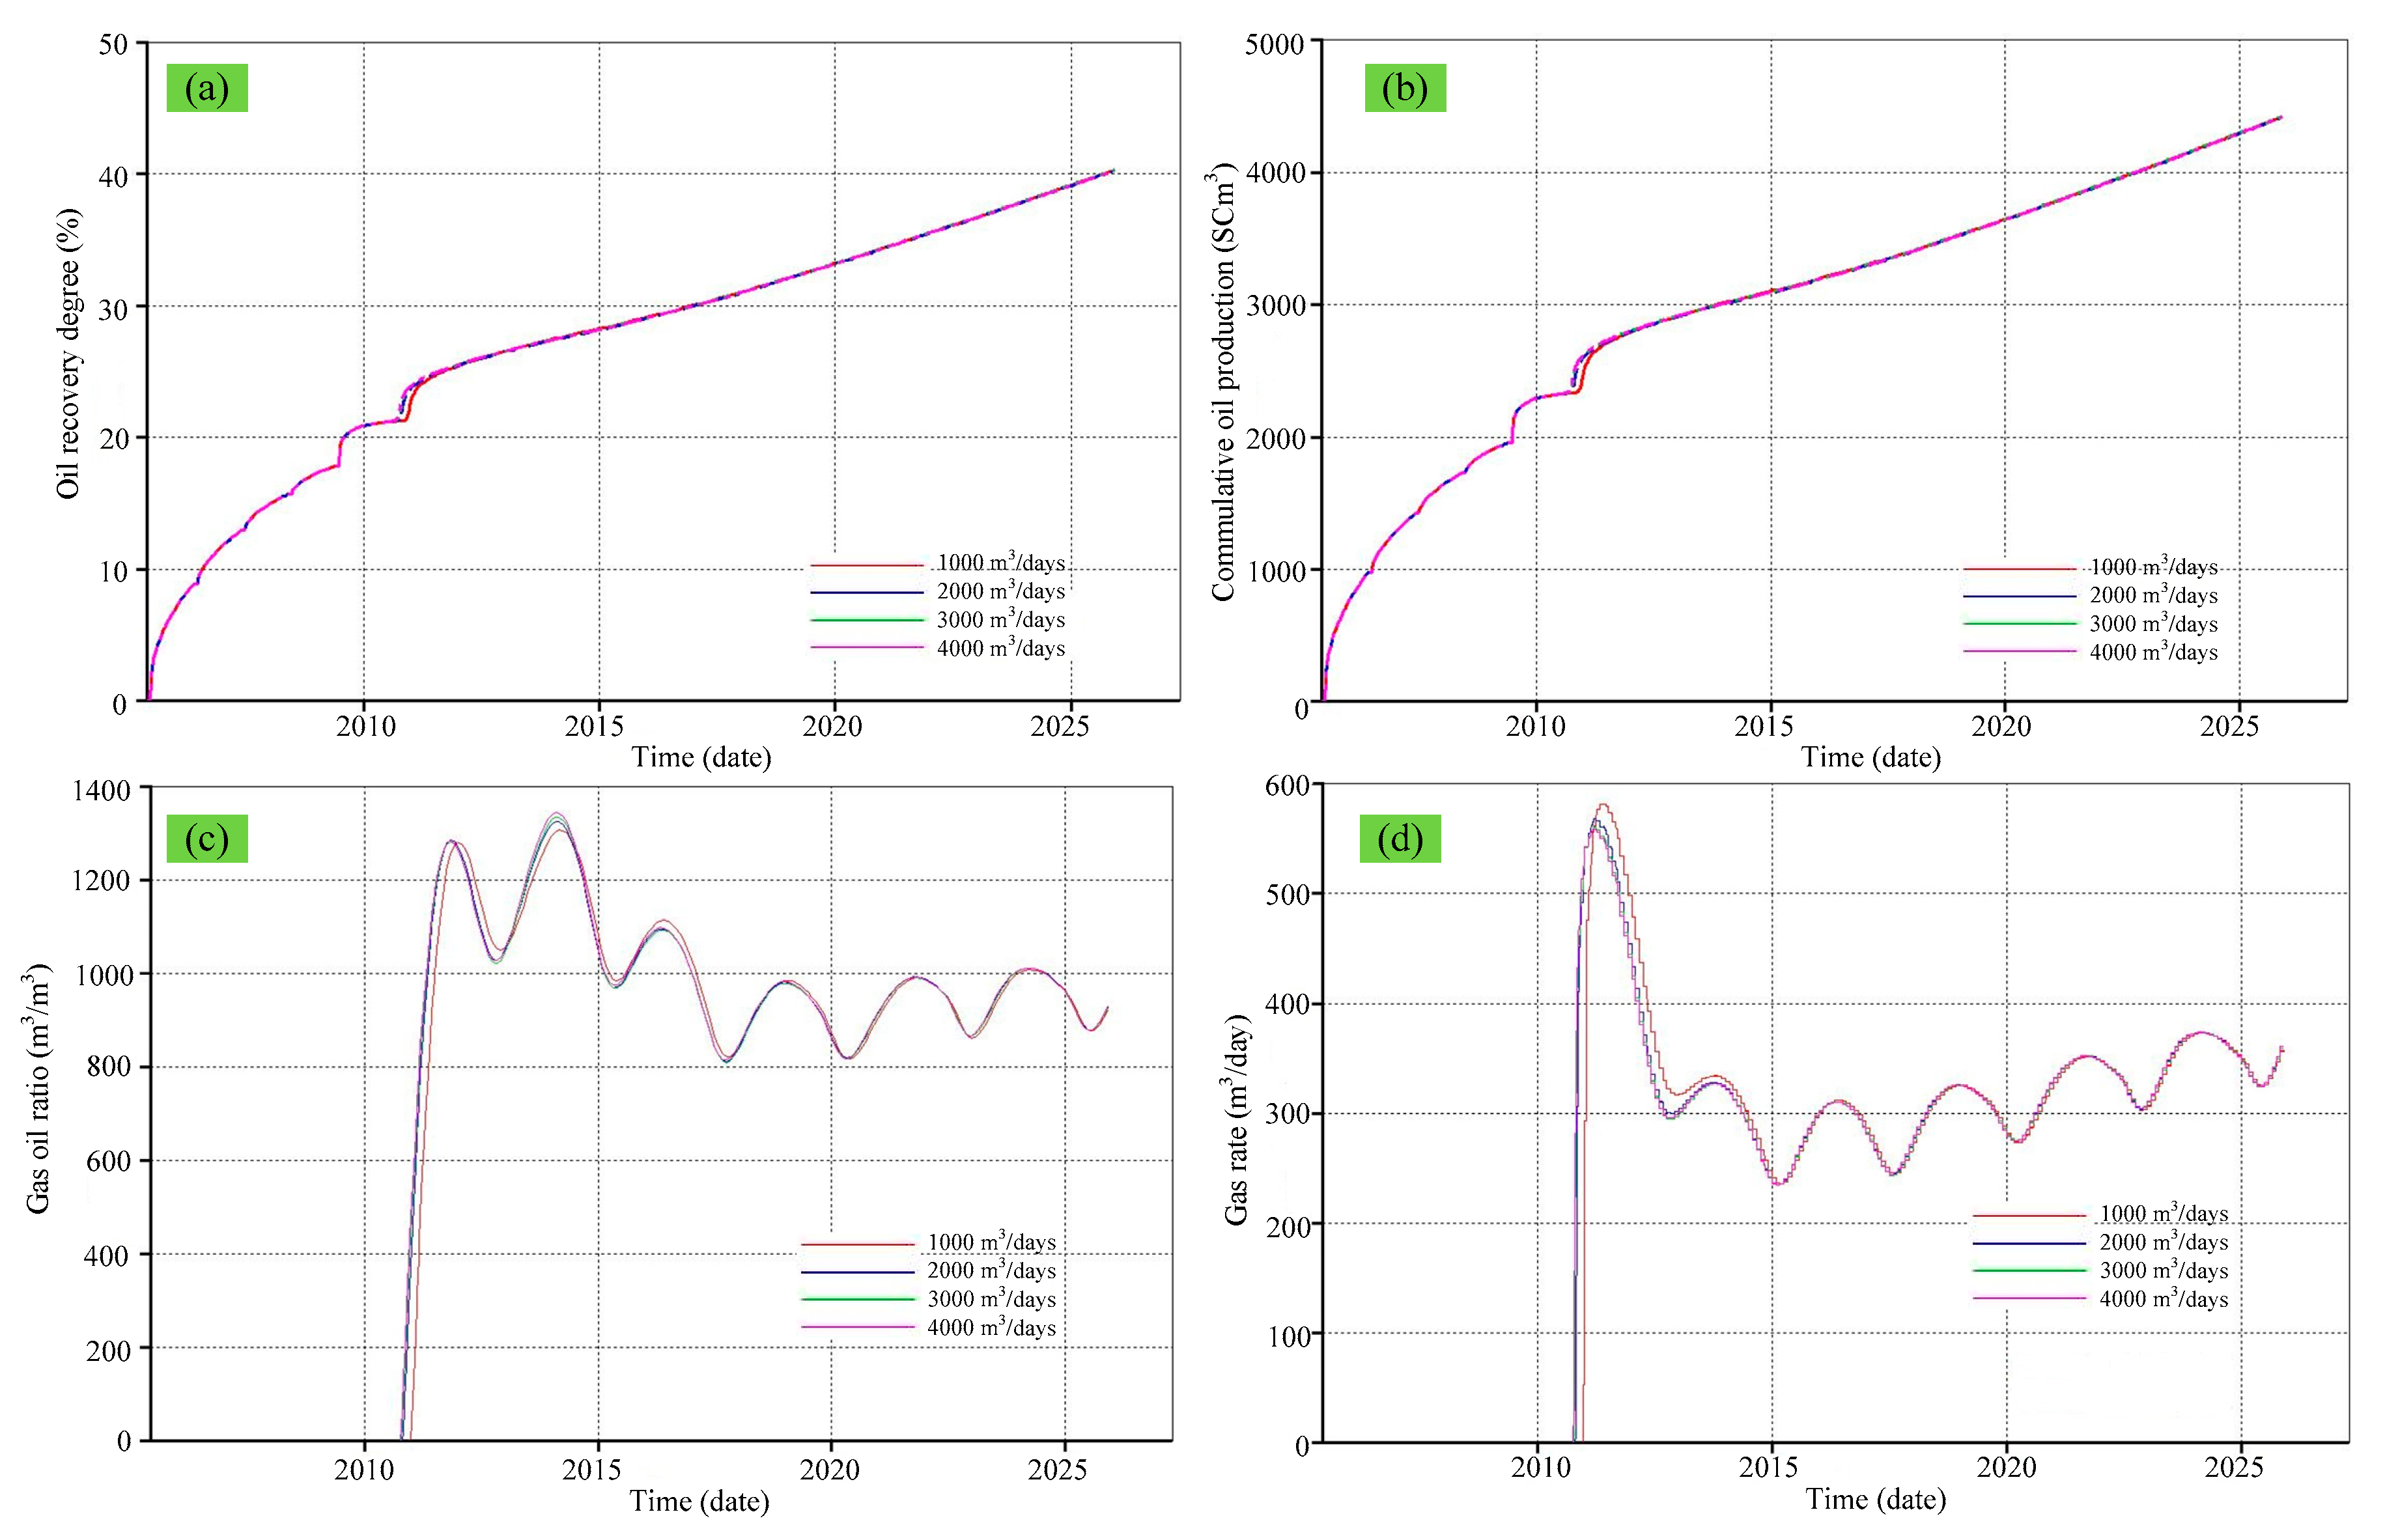
Based on previous analysis, here we set the huff-and-puff round as five in this section of study. We chose different air injection speeds for comparison, which were 1000 m3/d, 2000 m3/d, 3000 m3/d, and 5000 m3/d, respectively. Comparison of production indicators (recovery degree, cumulative oil production, gas-oil ratio, and gas production rate) under different air injection speeds are shown in Figure 4.
The dynamic production index under different air injection speeds have been listed in Table 5. As can be found from Table 5, at the end of the huff and puff, the recovery degree was approximately the same. At the end of the fire-flooding, the recovery degree and cumulative oil production had no significant difference for the four air injection conditions. When the daily air injection volume was 3000 m3, the recovery degree was the best (40.33%). The cumulative oil production was also the highest (4422.87 m3). The higher the air injection speed, the larger the air injection amount, the shorter the gas breakthrough time, and the higher the gas-oil ratio was.
The characteristic parameters of oil-wall under different air injection speeds have been listed in Table 6. As can be found from Table 6, when the air injection speed increased, the formation time of oil-wall was shortened and the oil saturation was easy to reach the peak. When the air injection speed was 3000 m3/day, the average oil saturation value was the highest, and the peak value was higher than other situations. The air injection speed had almost no effect on the migration length of the oil-wall. However, the migration speed of the oil-wall was proportional to the air injection speed.
The characteristic parameters of fire wall under different air injection speeds have been list in Table 7. As can be found from Table 7, the daily air injection has no significant effect on the temperature of the fire wall. The temperature of the combustion front for all situations is about 700 °C.
The temperature change of the firing front and oil saturation change under different air injection speeds have been shown in Figure 5a,b respectively. As can be found from previous figures and tables, we can conclude that the air injection speed had little effect on the fire wall. However, it had significant effect on the oil-wall. The daily injection volume of air was 3000 m3, which was conducive to the in-situ combustion and formation of oil-wall.
3.2.3. Air Injection Temperature
Here, we set the huff and puff rounds as five and the air injection speed was 3000 m3/day based on a previous study. We changed the air injection temperature to 20 °C (298.15 K), 60 °C (333.15 K), 80 °C (353.15 K), and 100 °C (373.15 K) for comparative analysis. Comparison of production indicators (recovery degree, cumulative oil production, gas-oil ratio, and gas production rate) under different air injection temperatures are shown in Figure 6.
The dynamic production index under different air injection temperatures have been listed in Table 8. As can be found from Table 8, the air injection temperature had little effect on the recovery degree and the cumulative oil production. The gas appearance time in the production well and the gas-oil ratio were almost the same at different air injection temperatures.
The characteristic parameters of the oil-wall under different air injection temperatures have been listed in Table 9. As it can be found from Table 9, the air injection temperature had no effect on the formation time of the oil-wall. The oil saturation at the initial moment of the oil-wall formation was almost the same. When the air injection temperature was 80 °C, the peak of oil saturation was the highest, and the pressure gradient of the corresponding oil-wall was the largest. The effect of the air injection temperature on the migration length and speed of oil-wall was also negligible.
The characteristic parameters of the fire wall under different air injection temperatures have been listed in Table 10. As can be found from Table 10, the temperature at the front of the combustion increased if the air injection temperature increased. When the temperature increase was small, the variation of the fire wall migration velocity was also small.
The temperature change of the firing front and the oil saturation change under different air injection temperatures have been shown in Figure 7a,b, respectively. As can be found from previous figures and tables, when the huff and puff rounds was five and the air injection speed was 3000 m3/day, the features of the oil-wall were obvious and the fire-flooding efficiency was good. The temperature of the injected air had little effect on the in-situ combustion and oil recovery.
3.3. Effect of Geological Parameters on oil-walls
3.3.1. Bottom Water Thickness
When the bottom water was present in the reservoir, different bottom water thicknesses (0 m, 100 m, 200 m, 360 m) were simulated to analyze the influence of the bottom water on the characteristic parameters of the oil-wall. Comparison of the production indicators (recovery degree, cumulative oil production, gas-oil ratio, and gas production rate) under different bottom water thickness are shown in Figure 8.
The dynamic production indicators under different bottom water thicknesses have been listed in Table 11. As can be found from Table 11, with the increase of the thickness of the bottom water, the oil recovery degree and the accumulated oil production were increasing; the gas appearance time in production well was almost the same; and the peak of gas-oil ratio decreased.
The characteristic parameters of oil-wall with different bottom water thickness have been listed in Table 12. As can be found from Table 12, when the thickness of the bottom water was 360 m, the characteristics of the oil-wall were the most obvious: The average oil saturation, oil saturation peak, oil-wall average width, oil-wall migration length, oil-wall pressure gradient, oil-wall migration speed, and oil-wall average temperature were the highest. This was because the bottom water could provide the driving force and assisted the migration of the oil-wall.
The characteristic parameters of the fire wall under different bottom water thickness fire walls have been listed in Table 13. As can be found from Table 13, when the thickness of the bottom water was 200 m, the temperature of the combustion front reached 672 °C, and the average pressure of the fire wall was the highest. Therefore, the fire wall advanced faster and promoted the formation of the oil-wall.
In summary, the presence of the bottom water in the formation will increase the efficiency of in-situ combustion and improve oil recovery. The greater the thickness of the bottom water, the stronger the force of water flooding is.
3.3.2. Stratigraphic Layering
Stratigraphic layering (SL) was also an important geological parameter which affected reservoir production. The positive SL meant that the permeability of the upper layer was less than the lower layer. The negative SL means that the permeability of upper layer was higher than the lower layer. If the permeability of the upper and lower layer was the same, it could be called “No SL”, which also meant that the reservoir was vertically homogenous. In this study, the positive and negative SL models were established, respectively (average permeability is 1000 mD), for the positive SL case, the top layer permeability (600 mD) was lower than the bottom layer permeability (1400 mD). For the negative SL case, the top layer permeability (1400 mD) was higher than the bottom layer permeability (600 mD). Comparison of the production indicators (recovery degree, cumulative oil production, gas-oil ratio, and gas production rate) under different stratigraphic layering are shown in Figure 9.
The dynamic production indicators under different stratigraphic layering (SL) have been listed in Table 14. As can be found from Table 14, the influence of the SL on the recovery degree and cumulative oil production of the reservoir was: no SL > positive SL > negative SL. The positive SL case had the earliest gas appearance in the production well and the no SL case had the latest gas appearance in the production well. It can be seen that the more homogenous of the reservoir, the better the oil recovery for the in-situ combustion scenario.
3.3.3. Permeability Ratio
Based on a previous study, here we considered the reservoir to be the positive stratigraphic layering case. The effect of the permeability ratio on the formation oil-wall and oil recovery was analyzed, considering the four different permeability ratios: 1, 5, 10, 100. Comparison of the production indicators (recovery degree, cumulative oil production, gas-oil ratio, and gas production rate) under different permeability ratio are shown in Figure 10.
The dynamic production indicators under different permeability ratios have been listed in Table 15. As can be found from Table 15, the greater the permeability ratio, the lower the recovery degree and the cumulative oil production, which means that the permeability difference was not conducive to in-situ combustion. The larger the permeability ratio was, the earlier the gas appeared in the production well. The gas-oil ratio also increased at the end of production.
The characteristic parameters of the oil-wall with different permeability ratios have been listed in Table 16. As can be found from Table 16, the oil saturation peak, average oil saturation, and oil-wall migration length, oil-wall pressure gradient, oil-wall migration speed, and the oil-wall average temperature were the highest for the case with a permeability ratio equal to one. This means that the greater the permeability ratio (the difference in permeability), the more unstable the oil-wall was. When the permeability ratio was larger than 10, there was no oil-wall formed in the relatively low permeability layers. The oil layers were mainly formed in the middle and lower layers.
The characteristic parameters of the fire wall under different permeability ratios have been listed in Table 17. As can be found from Table 17, the greater the difference in permeability, the faster the rate of the fire wall propulsion. However, the breakthrough of the fire wall in one direction was not conducive to the formation of oil-walls and also damaged to the oil recovery.
In summary, the permeability ratio had an important influence on the formation of the oil-wall. When the formation permeability was uniform, the condition for the oil-wall formation was the best.
3.3.4. Formation Thickness
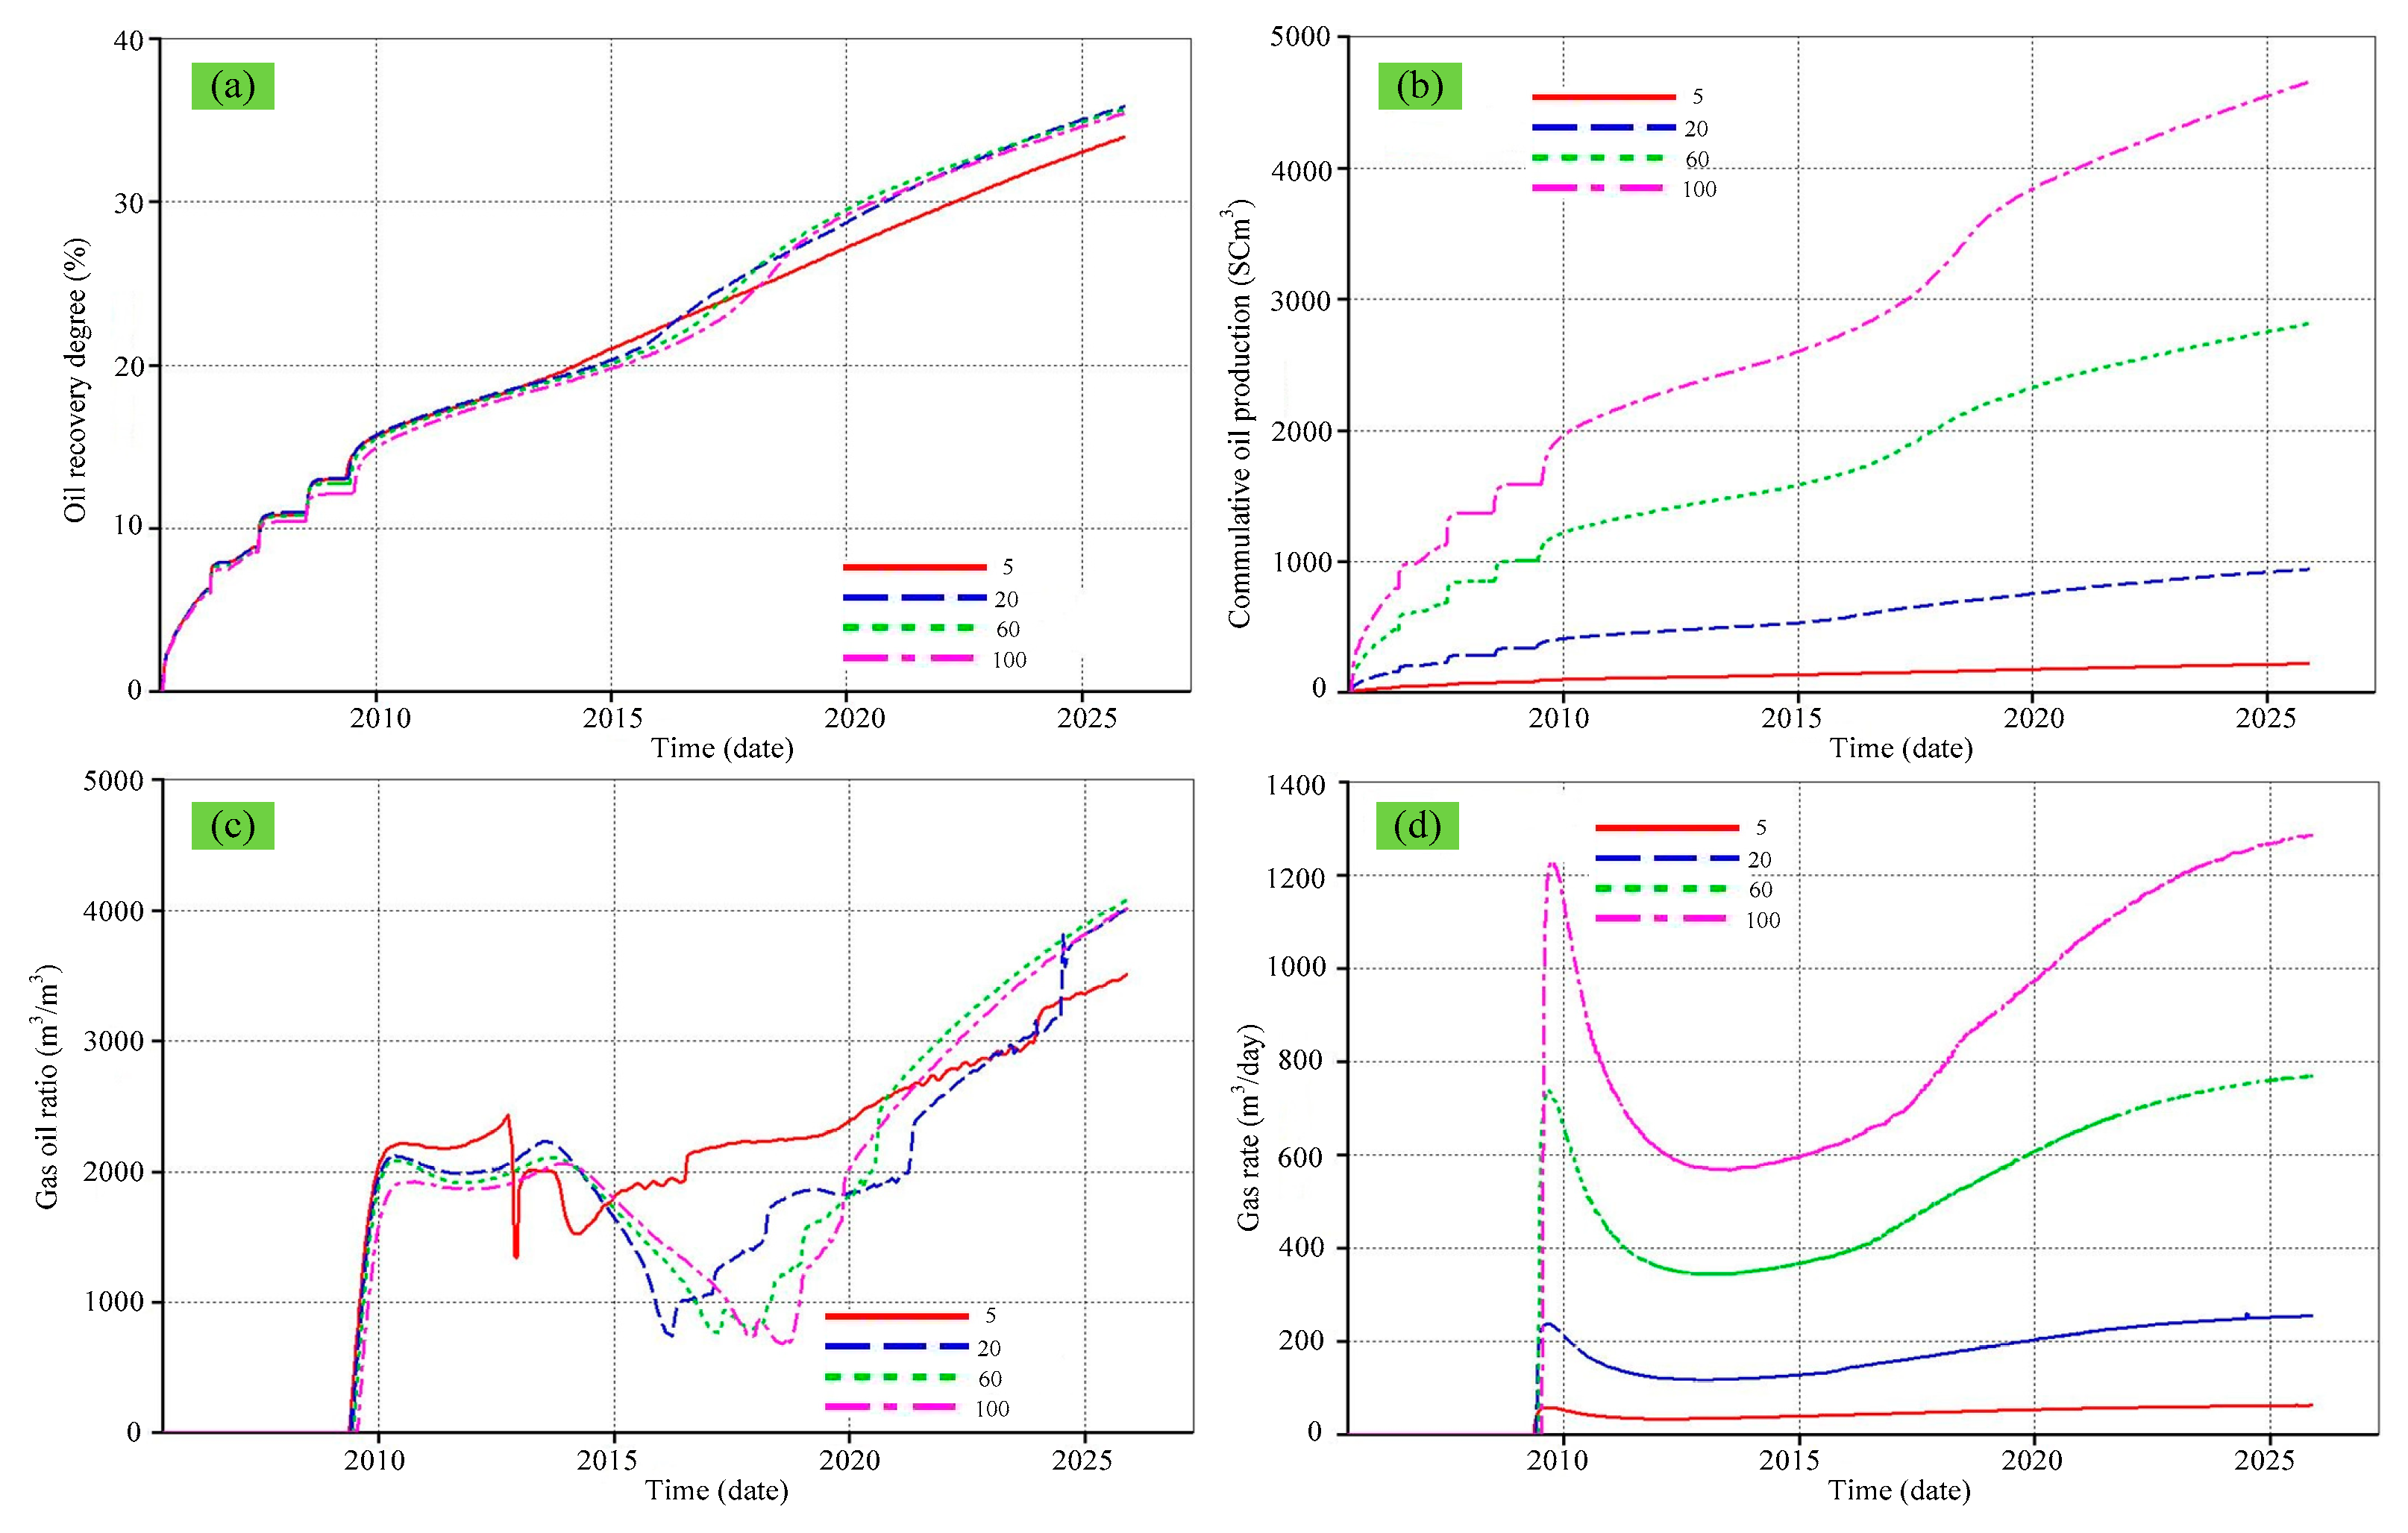
In order to improve the calculation accuracy, the grid was encrypted. The plane grid step size was 1 m × 5 m, and the total number of grids was 220 × 1 × 5 = 1100. Comparison of the production indicators (recovery degree, cumulative oil production, gas-oil ratio, and gas production rate) under different formation thickness are shown in Figure 11.
The dynamic production indicators under different formation thickness have been listed in Table 18. As can be found from Table 18, the cumulative oil production increased with the formation thickness. This was because when the formation thickness increased, the reserve increased. When the formation thickness was 20 m, the oil recovery degree was the highest. With formation thickness increased, the gas appearance time in production well appeared later. The peaks of the gas-oil ratio showed an opposite trend.
The characteristic parameters of the oil-wall with different formation thickness have been listed in Table 19. As can be found from Table 19, the oil-wall formation time was the same for the four cases. When the formation thickness was 100 m, the oil-wall had highest oil saturation. The features of the oil-wall were more obvious. The oil-wall migration speed is the highest.
The characteristic parameters of the fire wall under different formation thickness have been listed in Table 20. As can be found from Table 20, the average temperature of the fire wall, the distance between the fire wall and the oil-wall, and the fire wall propulsion speed were negatively related with the formation thickness. For formations with too small thickness, the heat loss during the fire propulsion process will be relatively large, which may cause the combustion temperature to be very low. Under this situation, the fire will be extinguished, and the in-situ combustion will fail. In summary, the formation thickness had a great influence on the characteristics of the oil-wall and the fire wall. Combining above analysis, it can be concluded that the best option for in-situ combustion in this study was when the formation thickness was 20 m.
4. Conclusions
- Oil saturation and ventilation strength are the basic conditions for the formation of the oil-walls. The appropriate ventilation intensity is required to form an effective fire line, which can greatly reduce the viscosity of crude oil and enhance the fluidity of crude oil.
- The effect of production parameters (huff and puff rounds, air injection speed, and air injection temperature) and geological parameters (bottom water layer thickness, stratigraphic layering, permeability ratio, and formation thickness) on the efficiency of in-situ combustion and oil recovery have been analyzed.
- Through numerical simulation results, the optimum value of huff and puff round and air injection speed has been obtained. The temperature of the injected air has little effect on the in-situ combustion and oil recovery.
- With the increase of the thickness of the bottom water, the oil recovery degree and the accumulated oil production increasing, formation heterogeneity has a negative effect on oil recovery and formation of the oil-wall. A too thin layer is not suitable for in-situ combustion.
Author Contributions
This is a joint work and the authors were in charge of their expertise and capability: Z.Y. contributed to the conceptualization and methodology and data analysis; S.H. for writing and revision; H.L. for manuscript revision.
Funding
This research received no external funding.
Conflicts of Interest
The authors declare no conflict of interest.
References
- Kok, M. Progress and recent utilization trends in petroleum recovery: Steam injection and in-situ combustion. Energy Sources 2012, 34, 2253–2259. [Google Scholar] [CrossRef]
- Samimi, A.; Karimi, G. In-situ combustion process, one of IOR methods livening the reservoirs. Pet. Coal 2010, 52, 342–354. [Google Scholar]
- Wilson, L.; Root, P. Cost comparison of reservoir heating using steam or air. J. Pet. Technol. 1966, 18, 233–239. [Google Scholar] [CrossRef]
- Alexander, J.; Martin, W.; John, N. Factors affecting fuel availability and composition during in-situ combustion. J. Pet. Technol. 1962, 14, 1154–1164. [Google Scholar] [CrossRef]
- Cheih, C. State-of-the-art review of fireflood field projects (includes associated papers 10901 and 10918). J. Pet. Technol. 1982, 34, 19–36. [Google Scholar] [CrossRef]
- Gates, C.; Ramey, H. A method for engineering in-situ combustion oil recovery projects. J. Pet. Technol. 1980, 32, 285–294. [Google Scholar] [CrossRef]
- Thomas, G. A study of forward combustion in a radial system bounded by permeable media. J. Pet. Technol. 1963, 15, 1145–1149. [Google Scholar] [CrossRef]
- Parrish, D.; Craig, F. Laboratory study of a combination of forward combustion and waterflooding the cofcaw process. J. Pet. Technol. 1969, 21, 753–761. [Google Scholar] [CrossRef]
- Penberthy, W.; Ramey, H. Design and operation of laboratory combustion tubes. SPE J. 1965, 6, 183–190. [Google Scholar] [CrossRef]
- Garon, A.; Kumar, M.; Lau, K. A laboratory investigation of sweep during oxygen and air fireflooding. SPE Reserv. Eng. 1986, 1, 565–574. [Google Scholar] [CrossRef]
- Suat, B.; Mustafa, V. In-situ combustion laboratory studies of Turkish heavy oil reservoirs. Fuel Process. Technol. 2001, 74, 65–79. [Google Scholar]
- Burger, J. Spontaneous ignition in an oil reservoir. SPE J. 1976, 16, 73–81. [Google Scholar] [CrossRef]
- Zeinab, Z.; Farouq, S. Analytical modelling of steam chamber rise stage of steam-assisted gravity drainage (SAGD) process. Fuel 2018, 233, 732–742. [Google Scholar]
- Amirian, E.; Fedutenko, E.; Yang, C. Artificial neural network modeling and forecasting of oil reservoir performance. In Applications of Data Management and Analysis; Springer: Cham, Switzerland, 2018; pp. 43–67. [Google Scholar]
- Lee, Y.; Lee, W.; Jang, Y. Oil recovery by low-salinity polymer flooding in carbonate oil reservoirs. J. Pet. Sci. Eng. 2019, 181, 106211. [Google Scholar] [CrossRef]
- Fedutenko, E.; Nghiem, L.; Yang, C. Artificial neural network modeling of compaction dilation data for unconventional oil reservoirs. Soc. Pet. Eng. 2019. [Google Scholar] [CrossRef]
- Zhang, X.; Lin, C.; Gu, L. Application and outlook of in-situ combustion for developing heavy oil reservoir. In Proceedings of the 4th International Conference on Sensors, Mechatronics and Automation (ICSMA 2016), Zhuhai, China, 12–13 November 2016. [Google Scholar]
- Cai, W.; Xie, Z.; Wang, W. Experimental study of wet combustion. Spec. Oil Gas Reserv. 2000, 8, 81–85. [Google Scholar]
- Guan, W.; Wu, S.; Wang, S. Physical simulation of in-situ combustion of sensitive heavy oil reservoir. In Proceedings of the Asia Pacific Oil Gas Conference Exhibition, Dubai, UAE, 4–6 December 2007. [Google Scholar]
- Jiang, Y.; Zhang, Y.; Liu, S. Displacement mechanisms of air injection in low permeability reservoirs. Pet. Explor. Dev. 2010, 37, 471–476. [Google Scholar]
- Bottia, H.; Aguillon, M.; Lizcano, H. Numerical modeling on in-situ combustion process in the chichimene field: Ignition stage. J. Pet. Sci. Eng. 2017, 154, 462–468. [Google Scholar] [CrossRef]
- Rahnema, H.; Barrufet, M.; Mamora, D. Combustion assisted gravity drainage – experimental and simulation results of a promising in-situ combustion technology to recover extra-heavy oil. J. Pet. Sci. Eng. 2017, 154, 513–520. [Google Scholar] [CrossRef]
- Pei, S.; Wang, Y.; Zhang, L. An innovative nitrogen injection assisted in-situ conversion process for oil shale recovery: Mechanism and reservoir simulation study. J. Pet. Sci. Eng. 2018, 171, 507–515. [Google Scholar] [CrossRef]
- Nesterov, I.; Shapiro, A.; Stenby, E. Numerical analysis of a one-dimensional multicomponent model of the in-situ combustion process. J. Pet. Sci. Eng. 2013, 106, 46–61. [Google Scholar] [CrossRef]
Figure 1.
Three-dimensional distribution of the initial oil saturation and porosity. (a) Initial oil saturation distribution; (b) porosity distribution.
Figure 1.
Three-dimensional distribution of the initial oil saturation and porosity. (a) Initial oil saturation distribution; (b) porosity distribution.

Figure 2.
Comparison of the production indicators under different huff and puff rounds. (a) Recovery degree; (b) cumulative oil production; (c) gas-oil ratio; and (d) gas production rate.
Figure 2.
Comparison of the production indicators under different huff and puff rounds. (a) Recovery degree; (b) cumulative oil production; (c) gas-oil ratio; and (d) gas production rate.

Figure 3.
The temperature change of the firing front and oil saturation change under different huff and puff rounds. (a) Temperature change of the firing front; (b) oil saturation change.
Figure 3.
The temperature change of the firing front and oil saturation change under different huff and puff rounds. (a) Temperature change of the firing front; (b) oil saturation change.

Figure 4.
Comparison of production indicators under different air injection speeds. (a) recovery degree; (b) cumulative oil production; (c) gas-oil ratio; and (d) gas production rate.
Figure 4.
Comparison of production indicators under different air injection speeds. (a) recovery degree; (b) cumulative oil production; (c) gas-oil ratio; and (d) gas production rate.

Figure 5.
The temperature change of the firing front and oil saturation change under different air injection speeds. (a) temperature change of the firing front; (b) oil saturation change.
Figure 5.
The temperature change of the firing front and oil saturation change under different air injection speeds. (a) temperature change of the firing front; (b) oil saturation change.

Figure 6.
Comparison of production indicators under different air injection temperatures. (a) Recovery degree; (b) cumulative oil production; (c) gas-oil ratio; and (d) gas production rate.
Figure 6.
Comparison of production indicators under different air injection temperatures. (a) Recovery degree; (b) cumulative oil production; (c) gas-oil ratio; and (d) gas production rate.

Figure 7.
The temperature change of the firing front and oil saturation change under different air injection temperatures. (a) Temperature change of the firing front; (b) oil saturation change.
Figure 7.
The temperature change of the firing front and oil saturation change under different air injection temperatures. (a) Temperature change of the firing front; (b) oil saturation change.

Figure 8.
Comparison of the production indicators under different bottom water thickness. (a) recovery degree; (b) cumulative oil production; (c) gas-oil ratio; and (d) gas production rate.
Figure 8.
Comparison of the production indicators under different bottom water thickness. (a) recovery degree; (b) cumulative oil production; (c) gas-oil ratio; and (d) gas production rate.

Figure 9.
Comparison of production indicators under different stratigraphic layering. (a) Recovery degree; (b) cumulative oil production; (c) gas-oil ratio; and (d) gas production rate.
Figure 9.
Comparison of production indicators under different stratigraphic layering. (a) Recovery degree; (b) cumulative oil production; (c) gas-oil ratio; and (d) gas production rate.

Figure 10.
Comparison of production indicators under different permeability ratio. (a) recovery degree; (b) cumulative oil production; (c) gas-oil ratio; and (d) gas production rate.
Figure 10.
Comparison of production indicators under different permeability ratio. (a) recovery degree; (b) cumulative oil production; (c) gas-oil ratio; and (d) gas production rate.

Figure 11.
Comparison of production indicators under different oil layer thickness. (a) Recovery degree; (b) cumulative oil production; (c) gas-oil ratio; and (d) gas production rate.
Figure 11.
Comparison of production indicators under different oil layer thickness. (a) Recovery degree; (b) cumulative oil production; (c) gas-oil ratio; and (d) gas production rate.


Table 1.
Oil layer group division and oil layer thickness statistics of the Du 66 block.
| Development Layer | Oil Layer Group | Sandstone Group | Small Layer | Oil Layer Thickness (m) | |
|---|---|---|---|---|---|
| General | Average | ||||
| Upper system | I | I1 | 1–2 | 1.0–11.8 | 6.5 |
| I2 | 3–5 | 1.4–8.2 | 4.8 | ||
| I3 | 6–9 | 1.8–12.5 | 6.7 | ||
| Lower system | II | II1 | 10–13 | 2.5–14.6 | 8.4 |
| II2 | 14–16 | 1.7–9.4 | 3.5 | ||
| II3 | 17–20 | 2.1–15.8 | 9.1 | ||
| III | III | 21–30 | 1.5–11.6 | 4.9 | |
| total | 3 | 7 | 30 | 24–62 | 44.5 |
Table 2.
Dynamic production indicators under different huff and puff (HP) rounds.
| Sweep Round | Cumulative Steam Injection (m3) | End of Production (%) | The Degree of Recovery at the End of the Fire Drive (%) | Production Oil (m3) | See the Gas Time (days) | Gas to Oil Ratio Peak m3/(m3) |
|---|---|---|---|---|---|---|
| 1 | 14,000 m3 | 6.69 | 35.28 | 3869.43 | 770 | 984.84 |
| 2 | 28,000 m3 | 11.57 | 36.85 | 4029.53 | 1010 | 1019.57 |
| 3 | 42,000 m3 | 14.82 | 37.63 | 4115.76 | 1330 | 1158.95 |
| 4 | 56,000 m3 | 17.32 | 38.05 | 4173.21 | 1680 | 1300.2 |
| 5 | 70,000 m3 | 20.87 | 40.30 | 4419.19 | 2030 | 1306.69 |
| 6 | 84,000 m3 | 23.72 | 42.04 | 4610.94 | 2400 | 1311.4 |
| 7 | 98,000 m3 | 26.24 | 43.08 | 4713.31 | 2755 | 1349.99 |
Table 3.
Characteristic parameters of oil-wall under different huff and puff rounds.
| Rounds | 1 | 2 | 3 | 4 | 5 | 6 | 7 | |
|---|---|---|---|---|---|---|---|---|
| Condition | ||||||||
| Oil-wall formation time (days) | 810 | 1030 | 1340 | 1620 | 2010 | 2450 | 1980 | |
| Oil saturation peak | 0.6351 | 0.6387 | 0.6397 | 0.6427 | 0.6484 | 0.6356 | 0.6321 | |
| Average oil saturation | 0.6043 | 0.6051 | 0.6113 | 0.6131 | 0.6101 | 0.6017 | 0.6168 | |
| Oil-wall average width (m) | 50 | 42 | 38 | 33 | 30 | 30 | 25 | |
| Oil-wall pressure gradient (kPa/m) | 66.47 | 66.39 | 65.67 | 59.31 | 54.32 | 54.11 | 52.56 | |
| Oil-wall migration speed (m/day) | 0.01702 | 0.01703 | 0.01707 | 0.01733 | 0.01739 | 0.01835 | 0.01843 | |
| Oil-wall average temperature (°C) | 88 | 82 | 80 | 77 | 75 | 71 | 70 | |
Table 4.
Characteristic parameters of the fire-wall under different huff and puff rounds.
| Rounds | 1 | 2 | 3 | 4 | 5 | 6 | 7 | |
|---|---|---|---|---|---|---|---|---|
| Condition | ||||||||
| Average temperature of the fire wall (°C) | 650 | 685 | 704 | 689 | 710 | 702 | 676 | |
| The distance between the fire wall and the oil-wall (m) | 100 | 110 | 100 | 100 | 90 | 110 | 115 | |
| Fire wall propulsion speed (m/day) | 0.034 | 0.034 | 0.035 | 0.036 | 0.037 | 0.036 | 0.035 | |
Table 5.
Dynamic production index under different air injection speeds.
| Air Injection Speed (m3/day) | End of Production (%) | The Degree of Recovery at the End of the Fire Drive (%) | Production Oil (m3) | See the Gas Time (days) | Gas to Oil Ratio Peak (m3/m3) |
|---|---|---|---|---|---|
| 1000 | 19.87 | 40.30 | 4419.19 | 2030 | 1306.69 |
| 2000 | 19.52 | 40.26 | 4416.50 | 1970 | 1324.52 |
| 3000 | 19.99 | 40.33 | 4422.87 | 1950 | 1334.53 |
| 5000 | 19.64 | 40.28 | 4417.90 | 1945 | 1344.23 |
Table 6.
Characteristic parameters of oil-wall with different air injection speed.
| Injection Speed (m3/day) | 1000 | 2000 | 3000 | 5000 | |
|---|---|---|---|---|---|
| Condition | |||||
| Oil-wall formation time (days) | 2010 | 1945 | 1855 | 1830 | |
| Oil saturation peak | 0.6245 | 0.6278 | 0.6315 | 0.6310 | |
| Average oil saturation | 0.6043 | 0.6051 | 0.6131 | 0.6113 | |
| Oil-wall average width (m) | 45 | 30 | 33 | 33 | |
| Oil-wall migration length (m) | 95 | 95 | 95 | 95 | |
| Oil-wall pressure gradient (kPa/m) | 54.32 | 61.16 | 62.32 | 62.15 | |
| Oil-wall migration speed (m/day) | 0.01639 | 0.01683 | 0.01726 | 0.01778 | |
| Oil-wall average temperature (°C) | 68 | 71 | 69 | 70 | |
Table 7.
Characteristic parameters of different air injection velocity fire wall.
| Injection Speed (m3/day) | 1000 | 2000 | 3000 | 5000 | |
|---|---|---|---|---|---|
| Condition | |||||
| Average temperature of the fire wall (°C) | 693 | 704 | 698 | 705 | |
| The distance between the fire wall and the oil-wall (m) | 90 | 90 | 90 | 90 | |
| Fire wall propulsion speed (m/day) | 0.037 | 0.037 | 0.036 | 0.036 | |
Table 8.
Dynamic production index under different air injection temperatures.
| Air Injection Temperature (m3/day) | The Recovery Degree at the End of HP (%) | The Recovery Degree at the End of the In-Situ Combustion (%) | Cumulative Oil Production (m3) | Gas Appearance Time (days) | Gas to Oil Ratio Peak (m3/m3) |
|---|---|---|---|---|---|
| 20 | 20.93 | 40.33 | 4422.87 | 1950 | 1334.53 |
| 60 | 20.96 | 40.35 | 4425.47 | 1950 | 1327.20 |
| 80 | 20.98 | 40.35 | 4425.61 | 1950 | 1323.63 |
| 100 | 21.05 | 40.37 | 4427.83 | 1950 | 1319.35 |
Table 9.
Characteristic parameters of oil-wall under different air injection temperatures.
| Injection Temperature °C | 20 | 60 | 80 | 100 | |
|---|---|---|---|---|---|
| Condition | |||||
| Oil-wall formation time (days) | 1855 | 1855 | 1855 | 1855 | |
| Oil saturation peak | 0.6389 | 0.6387 | 0.6401 | 0.6337 | |
| Average oil saturation | 0.6101 | 0.6101 | 0.6151 | 0.6150 | |
| Oil-wall average width (m) | 30 | 32 | 25 | 33 | |
| Oil-wall migration length (m) | 95 | 95 | 95 | 95 | |
| Oil-wall pressure gradient (kPa/m) | 62.32 | 62.50 | 67.89 | 67.82 | |
| Oil-wall migration speed (m/day) | 0.01739 | 0.01713 | 0.01786 | 0.01778 | |
| Oil-wall average temperature (°C) | 69 | 71 | 72 | 74 | |
Table 10.
Characteristic parameters of the fire wall under different air injection temperatures.
| Injection Temperature °C | 20 | 60 | 80 | 100 | |
|---|---|---|---|---|---|
| Condition | |||||
| Average temperature of the fire wall (°C) | 693 | 708 | 711 | 715 | |
| The distance between the fire wall and the oil-wall (m) | 110 | 110 | 110 | 110 | |
| Fire wall propulsion speed (m/day) | 0.03064 | 0.03071 | 0.03089 | 0.03085 | |
Table 11.
Dynamic production indicators under different bottom water thicknesses.
| Bottom Water Thickness (m) | The Recovery Degree at the End of HP (%) | The Recovery Degree at the End of the In-Situ Combustion (%) | Cumulative Oil Production (m3) | Gas Appearance Time (days) | Gas to Oil Ratio Peak (m3/m3) |
|---|---|---|---|---|---|
| 0 | 21.37 | 40.24 | 4242.16 | 2007 | 1355.89 |
| 100 | 22.96 | 43.14 | 4698.07 | 2007 | 1268.41 |
| 200 | 25.28 | 45.84 | 4895.55 | 2006 | 1222.14 |
| 360 | 27.04 | 46.37 | 5191.22 | 2005 | 1209.71 |
Table 12.
Characteristic parameters of oil-wall under different bottom water thickness.
| Bottom Water Thickness (m) | 0 | 100 | 200 | 360 | |
|---|---|---|---|---|---|
| Condition | |||||
| Oil-wall formation time (days) | 1720 | 1704 | 1704 | 1707 | |
| Oil saturation peak | 0.5096 | 0.5110 | 0.5123 | 0.5126 | |
| Average oil saturation | 0.5020 | 0.5076 | 0.5098 | 0.5106 | |
| Oil-wall average width (m) | 8 | 8 | 8 | 10 | |
| Oil-wall migration length (m) | 150 | 160 | 160 | 170 | |
| Oil-wall pressure gradient (kPa/m) | 241 | 256 | 263 | 273 | |
| Oil-wall migration speed (m/day) | 0.026 | 0.028 | 0.030 | 0.034 | |
| Oil-wall average temperature (°C) | 70.2 | 70.5 | 70.6 | 71.8 | |
Table 13.
Characteristic parameters of the fire wall under different bottom water thickness.
| Bottom Water Thickness (m) | 0 | 100 | 200 | 360 | |
|---|---|---|---|---|---|
| Condition | |||||
| Average temperature of the fire wall (°C) | 665 | 662 | 672 | 669 | |
| The distance between the fire wall and the oil-wall (m) | 100 | 80 | 90 | 80 | |
| Fire wall propulsion speed (m/day) | 0.00263 | 0.00261 | 0.00271 | 0.00261 | |
Table 14.
Dynamic production indicators under different stratigraphic layering (SL).
| Stratigraphic Layering | The Recovery Degree at the End of HP (%) | The Recovery Degree at the End of the In-Situ Combustion (%) | Cumulative Oil Production (m3) | Gas Appearance Time (days) |
|---|---|---|---|---|
| No SL | 21.51 | 52.84 | 4298.27 | 1785 |
| Positive SL | 21.43 | 52.79 | 4314.16 | 1758 |
| Negative SL | 21.30 | 52.17 | 4310.24 | 1773 |
Table 15.
Dynamic production indicators under different permeability ratio.
| Permeability Ratio | The Recovery Degree at the End of HP (%) | The Recovery Degree at the End of the In-Situ Combustion (%) | Cumulative Oil Production (m3) | Gas Appearance Time (days) |
|---|---|---|---|---|
| 1 | 21.92 | 52.89 | 4325.81 | 1785 |
| 5 | 21.50 | 52.71 | 4309.40 | 1773 |
| 10 | 21.38 | 52.43 | 4295.58 | 1760 |
| 100 | 20.38 | 49.17 | 4016.40 | 1754 |
Table 16.
Characteristic parameters of oil-wall with different permeability ratio.
| Permeability Ratio | 1 | 5 | 10 | 100 | |
|---|---|---|---|---|---|
| Condition | |||||
| Oil-wall formation time (days) | 1670 | 1670 | 1670 | 1670 | |
| Oil saturation peak | 0.5178 | 0.5042 | 0.5115 | 0.5068 | |
| Average oil saturation | 0.5092 | 0.5023 | 0.5059 | 0.5041 | |
| Oil-wall average width (m) | 25 | 25 | 20 | 15 | |
| Oil-wall migration length (m) | 175 | 170 | 170 | 170 | |
| Oil-wall pressure gradient (kPa/m) | 111.42 | 90.51 | 60.13 | 75.60 | |
| Oil-wall migration speed (m/day) | 0.030 | 0.0292 | 0.0292 | 0.0292 | |
| Oil-wall average temperature (°C) | 72 | 70 | 70 | 69 | |
Table 17.
Characteristic parameters of fire wall under different permeability ratio.
| Permeability Ratio | 1 | 5 | 10 | 100 | |
|---|---|---|---|---|---|
| Condition | |||||
| Average temperature of the fire wall (°C) | 897 | 954 | 987 | 1005 | |
| Fire wall propulsion speed (m/day) | 0.0082 | 0.0088 | 0.0089 | 0.0092 | |
Table 18.
Dynamic production indicators under different formation thickness.
| Formation Thickness (m) | The Recovery Degree at the End of HP (%) | The Recovery Degree at the End of the In-Situ Combustion (%) | Cumulative Oil Production (m3) | Gas Appearance Time (days) | Gas to Oil Ratio Peak (m3/m3) |
|---|---|---|---|---|---|
| 5 | 15.55 | 33.91 | 223.26 | 1443 | 2431.45 |
| 20 | 15.76 | 35.77 | 939.86 | 1460 | 2232.01 |
| 60 | 15.66 | 35.52 | 2813.19 | 1475 | 2107.74 |
| 100 | 14.85 | 35.36 | 4642.90 | 1502 | 2058.66 |
Table 19.
Characteristic parameters of oil-wall with different formation thickness.
| Oil Layer Thickness m | 5 | 20 | 60 | 100 | |
|---|---|---|---|---|---|
| Condition | |||||
| Oil-wall formation time (days) | 1349 | 1349 | 1349 | 1349 | |
| Oil saturation peak | 0.5065 | 0.5083 | 0.5137 | 0.5246 | |
| Average oil saturation | 0.5029 | 0.5066 | 0.5070 | 0.5082 | |
| Oil-wall average width (m) | 5 | 5 | 5 | 5 | |
| Oil-wall migration length (m) | 31 | 61 | 61 | 66 | |
| Oil-wall pressure gradient (kPa/m) | 240.27 | 107.56 | 184.59 | 254.24 | |
| Oil-wall migration speed (m/day) | 0.078 | 0.0629 | 0.045 | 0.0863 | |
| Oil-wall average temperature (°C) | 72.5 | 71.77 | 71.73 | 71.77 | |
Table 20.
Characteristic parameters of fire wall under different formation thickness.
| Thickness (m) | 5 | 20 | 60 | 100 | |
|---|---|---|---|---|---|
| Condition | |||||
| Average temperature of the fire wall (°C) | 816.15 | 799.3 | 790.5 | 782.1 | |
| The distance between the fire wall and the oil-wall (m) | 31 | 29 | 26 | 24 | |
| Fire wall propulsion speed (m/day) | 0.00415 | 0.00382 | 0.00371 | 0.00367 | |
© 2019 by the authors. Licensee MDPI, Basel, Switzerland. This article is an open access article distributed under the terms and conditions of the Creative Commons Attribution (CC BY) license (http://creativecommons.org/licenses/by/4.0/).
Share and Cite
MDPI and ACS Style
Yang, Z.; Han, S.; Liu, H. Numerical Simulation Study of Heavy Oil Production by Using In-Situ Combustion. Processes 2019, 7, 621. https://0-doi-org.brum.beds.ac.uk/10.3390/pr7090621
AMA Style
Yang Z, Han S, Liu H. Numerical Simulation Study of Heavy Oil Production by Using In-Situ Combustion. Processes. 2019; 7(9):621. https://0-doi-org.brum.beds.ac.uk/10.3390/pr7090621
Chicago/Turabian StyleYang, Zhao, Shuang Han, and Hongji Liu. 2019. "Numerical Simulation Study of Heavy Oil Production by Using In-Situ Combustion" Processes 7, no. 9: 621. https://0-doi-org.brum.beds.ac.uk/10.3390/pr7090621
Note that from the first issue of 2016, this journal uses article numbers instead of page numbers. See further details here.