Analyses for Synthesis Gas from Municipal Solid Waste Gasification under Medium Temperatures

1
Key Laboratory of Energy Thermal Conversion and Control of Ministry of Education, School of Energy and Environment, Southeast University, Nanjing 210096, China
2
Jiangsu Frontier Electric Power Technology Co., Ltd., Nanjing 211102, China
*
Author to whom correspondence should be addressed.
Processes 2020, 8(1), 84; https://0-doi-org.brum.beds.ac.uk/10.3390/pr8010084
Submission received: 13 December 2019
/
Revised: 2 January 2020
/
Accepted: 6 January 2020
/
Published: 8 January 2020
(This article belongs to the Special Issue Processes for Bioenergy and Resources Recovery from Biowaste)
Abstract
:Municipal solid waste (MSW) gasification could be a novel method that shows the various advantages over traditional MSW treatments in China. Other research concluded that MSW gasification was operating by the assistant heat, and the gasification may occur under medium temperature. So, this study is aimed to investigate MSW gasification and pyrolysis behavior and analyze the syngas evolution and reaction mechanism. The MSW samples were collected in daily life and the experiments were carried out in a fixed tubular reactor below 650 °C. The effects of medium temperature and oxygen content on syngas quality were elucidated in depth. The results have shown that temperature can promote the syngas quality in the range of 550–650 °C, because the increasing temperature strengthens the reaction rate. The oxygen content should be controlled in a certain range, or oxidation reactions will be more prominent during gasification. The optimal gasification condition in this study was obtained at 650 °C and an oxygen concentration of 1.25%, the combustible gas yield and the lower heating value (LHV) of syngas of this condition were 0.296 L/g and 10.98 kJ/L, respectively. This study provides insights for MSW gasification under medium temperature, and a practical gasification system can be designed under a certain condition.
1. Introduction
Rapid population growth and economic development have led to serious environmental problems in recent years, such as enormous solid waste generation and pollutant discharge, negatively impacting the quality of life. The amount of national municipal solid waste (MSW) transportation in 2017 reached an astonishing 210 million tons in China, maintaining an annual growth rate of 6% in the past five years [1]. Therefore, the harmless treatments of MSW have been particularly significant and urgent.
Traditional MSW disposal treatments, such as landfill, incineration, composting, recycling, and others, have various drawbacks. For instance, the disposal period of landfill is long and it takes up too much available space, which is not suitable as a long-term solution [2,3], composting and recycling are inefficient and the handling capacity is limited, and other methods need to be developed [4]. Although incineration can efficiently recover energy of solid waste and reduce the weight and volume of MSW, the pollutants, e.g., NOx, HCl, dioxins, and heavy metals, still restrict its development [3,5]. Gasification is defined as the process of converting material into gaseous, liquid, and solid products in the atmosphere of partial oxygen through thermochemical reactions, and the biogas is the most widely used product [6]. With the development and application of gasification, a gasification method suitable for MSW has emerged [7], which has produced less dioxins and pollutant emissions.
In the past few years, a number of studies have begun to investigate the novel waste-to-energy (WtE) treatments: pyrolysis (no oxygen) and gasification (partial oxygen). Then, MSW gasification was tested in various facilities, such as a semi-industrial fluidized bed plant [8,9], a “two-step” facility [10], a downdraft gasifier [11], a fixed bed gasifier [12], and a pilot plasma furnace [13], and all of the MSW gasification research was operated above 700 °C, and even higher in the plasma [13]. The research in Reference [14] has indicated that the economic and environmental performances of MSW gasification had some advantages, and MSW gasification can also be operated commercially. The best example is MSW gasification commercial power plants in Japan [10], where the carbon conversion was higher than 91.7% and the concentration of heavy metals and dioxins were lower than the limits.
The classification of MSW has been implemented in China since 2010, thus the composition of MSW was more complex. The high content of kitchen residue and moisture are not suitable for MSW gasification at high temperature. However, the pilot applications or demonstration plants of MSW gasification have not yet been reported in China to date. Meanwhile, several basic research studies have proceeded to investigate the thermal characteristics and pyrolysis/gasification performance of MSW. The thermogravimetry (TG) research of typical MSW components has been studied in depth [15,16,17,18]. Twenty-six typical wastes were classified into six types by cluster classification from thermogravimetric experiments [15]. Given the thermogravimetric analysis, the thermal characteristics and kinetics parameters of MSW components were clear. Additionally, the MSW gasification needed a more comprehensive study: tests should be carried out on various scales to obtain enough results. Four different waste materials were gasified separately in a fixed-bed reactor between 700 and 900 °C [19]. Liu et al. used a two-stage fluidized bed to investigate the effects of temperature (700 to 900 °C) on syngas quality [20]. Dong et al. investigated pyrolysis and gasification of simulated MSW in a fluidized bed reactor between 550 and 850 °C [21]. Reforming technology, such as catalytic gasification [22,23] and steam gasification [24], were used to obtain better syngas, and the experiments were also carried out over 750 °C. The H2 and CO yields were largely improved by the catalysts, because the tar cracking reaction was promoted under the catalyst [22,23]. However, it should be observed that in the research listed above [20,21,22,23,24,25], conducted at high temperatures, there was little discussion about MSW gasification at medium temperature (below 700 °C). The study in Reference [26] indicated that the chamber stabilized above 1000 °C by burning liquefied petroleum gas (LPG), and temperature fluctuated between 600 and 800 °C during the MSW gasification, but it still needed to burn syngas for maintaining the gasification temperature. It is difficult to stabilize at high temperature without assistant heat when the auto-thermal gasification is proceeding. The heavy metals (Cu, Cd, Pb) will volatilize to the syngas under high temperature [27]. So, the investigations of MSW pyrolysis and gasification under medium temperatures are particularly important.
However, these previous studies primarily focused on thermal characteristics of MSW typical components and MSW gasification under high temperatures. Demonstration pilot gasifiers for biomass were built and successfully operated [28,29] and the fluidized gasifier operated steadily in the range of 650–700 °C, otherwise the gasification was uncontrollable and shut down rapidly. Little efforts have been made so far in revealing gasification of MSW at medium temperatures. In this study, the MSW sample was collected in daily life, the major components were rice, used paper, fallen leaves, polyethylene (PE), and others, then the experiments were performed in a fixed tubular reactor. The MSW gasification was carried out below 650 °C, lower than other studies; meanwhile, the syngas evolution was recorded, and the variation of syngas and the mechanism were discussed. Common gasification indexes (gas composition, combustible gas yield, the lower heating value (LHV) of syngas, and energy efficiency) were introduced to assess the gas quality, and the energy efficiency was calculated by the counter-balance method, which was a novel attempt. The study aims to get the effects of medium temperature and oxygen content on syngas quality of MSW gasification. The main advances include: exploring the feasibility of medium temperature (550 to 650 °C) gasification, analyzing the syngas evolution and the interaction between MSW composition, evaluating the syngas quality, and obtaining an optimal gasification condition.
2. Experiment
2.1. Material
MSW consists of different kinds of waste, including kitchen residue, plastic, waste-paper, old clothes, biomass, glass, rubber, etc., and some of them have combustible fractions. The average physical composition in recent years was extracted by a statistical analysis (Supplemental Material). Therefore, we prepared the MSW samples based on the average value of the composition (the average value was in Table S1), rice was used to represent kitchen residue, polyethylene (PE) and polyvinyl chloride (PVC) represented plastic, fallen leaves and rice husk were the biomass which were easy for us to obtain, and about 5 wt% of non-combustible waste was replaced by leaves and paper. So, the composition of the simulated MSW is rice (58 wt%), used office paper (15 wt%), polyethylene (PE) and polyvinyl chloride (PVC) (15 wt%), textile (3 wt%), fallen leaves and rice husk (6 wt%), and bottom ash from households (3 wt%). The samples were not dried, and we wanted to conduct experiments with the as-received samples. After grinding the hard-crude materials and cutting the soft materials (used paper and textile), the waste was then well blended.
The proximate analysis was analyzed according to the Chinese national standard GB/T 28731-2012, and the values of moisture, ash, volatile matter, and fixed carbon were 11.71 wt%, 6.89 wt%, 73.79 wt%, and 7.61 wt%, respectively. The ultimate analysis (elemental analyzer) data was C 40.7%, H 6.48%, O 33.16%, N 0.76%, and S 0.2% (wt% on as-received basis), and the LHV was 20.8 MJ/kg.
2.2. Experiment Procedure
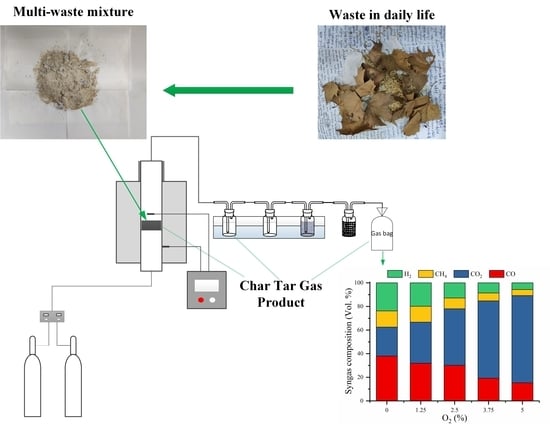
Figure 1 is the schematic diagram of the experimental facility. A lab-scale fixed bed tubular reactor (Botaoyuan factory, Nanjing, China) was employed in this study. A quartz tube with an inner diameter of 40 mm was used as a gasification chamber. Two K-type thermocouples were connected with the temperature controller. One was placed above the sample to monitor the real-time temperature inside the tube, and the other was used to control the temperature of the heating reactor. The upper part of the quartz tube and the gas outlet pipe were equipped with a heating tape for keeping the temperature above 240 °C, which prevented tar condensing in the gas pipe. The simulated MSW of 3 g was fed into the reactor for every experiment after several preliminary trials. The gasifying agent (carrier gas), controlled by a mass flowmeter, was simulated by nitrogen (Nanjing Shangyuan Industrial gas plant, Nanjing, China) and 5% O2/N2 (Nanjing Shangyuan Industrial gas plant, Nanjing, China) mix gas, thus the oxygen content was determined by the oxygen concentration of the carrier gas. Syngas was purified and dried by flowing though the gas clean system (the substances in impinge bottles from the left were: isopropanol (Chengdu Chron chemical CO., Ltd., Chengdu, China), water, silica gel (Suzhou Longhui desiccant Co., Ltd., Suzhou, China), and activated carbon (Chengdu Chron chemical CO., Ltd., Chengdu, China)), arranged at the tail of the facility. Then, syngas was collected in gas bags for examining.
There existed a temperature gradient through the quartz tube, the difference of temperatures between the inner and the outer tube was nearly 94 °C. It should be clear that the inner tube temperatures were set to 550, 600, and 650 °C, and the heating rate of the reactor was 30 °C/min. After calculation and initial tries, N2 was used for the pyrolysis condition and 5% was the maximum oxygen concentration. An oxygen concentration series of 0%, 1.25%, 2.50%, 3.75%, and 5.00% in the carrier gas was selected. The pressure of the gas cylinder outlet and syngas outlet were 0.15 MPa and 0.1 MPa, respectively. When the temperature of the inner tube rose to 130 °C, syngas began to collect into gas bags and the experimental time lasted for 3 h. After each experiment, solid residue was collected to weigh the unreacted component and gas volumes were recorded in a gas meter. To ensure the independence and reliability of the experimental data, each experiment was duplicated three times under the same conditions.
2.3. Analysis Method
The main syngas composition was CO, CH4, CO2, and H2 [7,11,25,28], which were analyzed by an ecom J2KN Pro gas analyzer (Ecom GmbH, Iserlohn, Germany) in the present study, and the total gas volumes were obtained by integral calculation. A further devolatilization test was conducted for the solid residue in an elevator furnace (Yixing Feida electric furnace Co., Ltd., Yixing, China) at 900 °C. The liquid product was captured into the isopropanol solution (Chengdu Chron chemical CO., Ltd., Chengdu, China) located in an ice bath. The impinge bottles were washed with ethanol (Chengdu Chron chemical CO., Ltd., Chengdu, China), and then the isopropanol solution and washing liquid were mixed. The liquid mixture underwent a standard rotary evaporation process (80 °C, 0.03 MPa) until the mass didn’t change. Finally, the tar weight was calculated from the mass difference of the bottle before and after evaporation.
3. Results and Discussion
The experimental conditions and the results of products yield are summarized in Table 1, and it is clear that temperature and oxygen content are the crucial factors during MSW gasification. Therefore, how temperature and oxygen content affected the gasification are discussed here, and also, the effects of temperature and oxygen content on product yield and syngas composition are analyzed in detail. It is worth noting that the acid gas emission, such as HCl, SO2, and other pollutants were produced during the gasification. According to the research results [30,31,32], activated carbon performed well in disposing of these pollutants, the acid gas dissolved in water or part of the acid gas was absorbed by the activated carbon. It was believed that the syngas was pure after the gas clean system.
The Waterloo concept is widely recognized during the biomass pyrolysis process [33]. Thermal decomposition of biomass first takes place during the increasing temperature, the product contains syngas, tar, char, and steam, then part of the tar converts into extra char and gas because of the secondary reaction. At last, tar and steam condense at low temperatures and the reactions during the solid waste gasification process are essentially the same as the biomass gasification [7,34]. Because we conducted the experiments by using the as-received samples, the water was not only moisture from the simulated MSW, but also was produced by oxidation reactions. After a standard rotary evaporation at 80 °C, we thought tar remained while water evaporated. However, the aim of this study was to analyze the syngas, tar and char were weighed so as to calculate the energy efficiency, thus the water yield was not tested in this study. From Table 1, it can be observed that higher oxygen concentration negatively impacted the yields of tar and char, which decreased from 0.365 g to 0.142 g and 0.59 g to 0.19 g. The possible explanation would be that char combusted with the increasing oxygen and converted into gas, then, the tar thermal cracking and partial oxidation happened [34,35]. These reactions were promoted by the O2 and high temperature.
3.1. Evolution of Syngas Components
Figure 2 shows the evolution of syngas at 650 °C during MSW pyrolysis. Basically, the syngas evolution of different operating conditions is similar. When the temperature is stable, samples will have enough time to release volatile matter.
Figure 2 suggests that the release of syngas was a slow process, CO was first released and then H2, until the temperature reached 200 °C. The concentrations were continuously increasing to the peak, and the similar trends of CO and H2 were found in Niu’s study [19]. The highest content of the MSW sample was rice, so it was presumed that the decomposition of rice started first, and the pyrolysis characteristic temperature confirmed the inference [36,37]. Likewise, fallen leaves and rice husk (the main composition is hemicellulose) were easy to decompose, and CO and H2 were produced from the decomposition of these components [38]. The thermogravimetric research of typical MSW components revealed that the mass loss of food residue and woody waste begun at 200 °C [37], and the pyrolysis temperature interval for the protein, starch, and hemicellulose, which were 220–500 °C, 269–345 °C, and 225–350 °C respectively [39], meanwhile released CO [15,16]. It should be clear that the release temperature of CO was not affected by the mixture of waste [16,37]. With the temperature increasing, more O content was released from the decomposition of wastes, which led to the decrease of CO. When the temperature exceeded 500 °C, PE and PVC began to decompose [37,39], so a second peak of CO and H2 appeared. The pyrolysis of plastic is the degradation of large molecule polymer, so tar was not produced during the plastic decomposition. Another possible explanation was that the primary tar began to reform into second tar and light gases (CO, CO2) above 500 °C [35].
The peak mass loss rate of typical MSW components occurred after 300 °C [15,17], thus more volatile matter was released. The mechanism for producing CO2 was a homogeneous oxidation and devolatilization process, and there were two explanations for the CO2 increase. O from self-decomposition participated in oxidation reactions, and this resulted from the fact that CO2 was increasing while CO was inhibited. But the production of CO2 was not only relied on the O content of samples, but also from the decarboxylation process during the decomposition. Compared with CO, H2, and CO2, CH4 was the last released gas, and a similar conclusion has been obtained [39], but the trend of CH4 was different, maybe it was caused by the different experiment conditions. The amount of CH4 was still less, meaning that CH4 was more difficult to produce than CO and H2, because CH4 was primarily recognized as a product of pyrolysis [34]. The condition in this study was not beneficial to hydrogasification reactions. The major mass loss of the typical MSW was occurring between 200 and 500 °C [15,16,17], and CO, H2, CH4, and CO2 were released with the fast weight loss rate. After that, syngas was decreasing and the reaction may be finished at these temperatures. On the other hand, tar and char may increase. The trend of syngas in Figure 2 was generally in line with the TG curves of other thermogravimetric research. It can be seen that the mass loss process was influenced by the mixture of different components, but the loss value remained unchanged, so it does seem that there were a few influences on the syngas composition.
When the reactor was cooling down, low concentrations of CO and H2 were still observed, but the concentration continued to decrease, because the mass loss of some components did not finish at 650 °C, and this was still happening in the differential thermogravimetry (DTG) curves of food residue and paper [37]. This can explain why the solid residue still lost mass during pyrolysis at 900 °C, also suggesting that the residue contained unreleased volatile matter (macromolecular hydrocarbons). Compared with other components, CO2 was less under the pyrolysis condition. The main reason was that pyrolysis occurred in the absence of oxygen, and the O used for oxidation reactions only relied on sample self-decomposition. The introduction of O2 could promote oxidation reactions and cause the significant increase of CO2 volume, which is discussed in the next section.
3.2. Effects of Temperature and Oxygen Concentration
The variation of components with temperatures at an oxygen concentration of 1.25% is shown in Figure 3, the dilution of N2 is not considered in the volume fraction of components. It is clear that the combustible components are promoted by a higher temperature, ranging from 550 to 650 °C, because the decomposition reactions during the gasification process are strengthened by increasing temperatures. As the temperature increased, it would favor MSW converting to the syngas, so the gas yield obviously increased, the increase of CO is more prominent than others. There are two possible explanations for the increase in combustible gases (CH4, H2, and CO). First, the extent of secondary reactions, such as decomposition reactions of tars and hydrocarbons, are affected by temperature, second, the partial oxidations (R1, R2) are promoted by the proper O2. These are the main factors for the increase of CO and H2. The reactions of CH4 promotion occur at higher temperatures, so the yield of CH4 in this study is poor. Since the O2 was introduced in gasification, the O derived from the decomposition of partially oxygenated organic compounds was less than the introduction amount and the volume of CO2 increased largely. This phenomenon indicates that the promotion of temperature is more evident than O2 in lower oxygen concentrations. Although there were few studied on MSW gasification under medium temperatures, the trends of the syngas components were similar with MSW gasification research [11,20,21]. The volume fractions of syngas components at 650 °C were in agreement with Dong’s research [21], lower than the pilot gasifier [11], slightly better than that in Liu’ study [20]. The CO yield was less than that found in other research, because the Boudouard reaction R3 occurred above 700 °C, the maximum temperature in this study did not meet the reaction requirement [24,40]. Therefore, the combustible gas can be improved by some treatments, such as catalyst gasification, syngas refinement, etc.
C + ½O2 → CO
CH4 + ½O2 → CO + 2H2
C + CO2 ↔ 2CO
pCxHy → qCnHm + rH2 + xCO + yCH4
A higher temperature has a positive impact on the syngas composition [23], but there is much research about gasification research above 700 °C. The maximum temperature in this study was 650 °C, we wanted to obtain more experience of MSW gasification at medium temperatures. More importantly, the consensus is that Cu is the main catalyst for the formation of dioxins, because HCl converts to Cl2 under the Cu catalysis [41,42], and Cl2 is the crucial factor to the formation of dioxins. Also, the heavy metals, especially Cd and Cu, escaped above 650 °C. Thus, the temperature below 650 °C can reduce the possibility of dioxins production. Moreover, the higher the temperature, the more energy would be consumed by keeping self-heat. Considering the operating experience of the pilot fluidized bed gasifiers [28,29], this study focused on analyses for syngas from MSW gasification under 650 °C. So, in view of these considerations, the upper temperature was set to 650 °C.
In this study, oxygen concentration was selected instead of equivalence ratio (ER) as the influencing factor, because one aim of this study was to find the gas evolution process of MSW gasification. Therefore, the oxygen content can only be varied by oxygen concentration, and then a conversion between oxygen concentration and ER was calculated. The vigorous gasification reactions occurred in the first 30 min, the conversions of ER were 0.195 and 0.75, respectively. This setting was similar to other researchers [21,43].
Figure 4 shows that the volume fraction of gas components changes over oxygen concentration at 650 °C. It is clear to see that the combustible components CO, CH4, and H2 show a similar trend, these gases were consumed by excessive oxidation due to more oxygen content, while the trend of CO2 is the opposite. These results suggest that the gas composition in the syngas can be adjusted by the increasing oxygen content. The volume fraction of CO decreased slowly at lower oxygen concentration then dropped rapidly when oxygen concentration reached over 2.5%. As described previously, CO was a combination of the devolatilization process with partial oxidation [44]. So, the formation of CO was more complicated and affected by the partial oxidation reactions (R1, R2) and water-gas shift reaction (R5). The CH4 maintained the same oxygen concentration of 1.25% and then declined. It was probably attributed to the tar cracking reaction, and the decrease of CH4 was caused by the partial oxidative reforming reaction (R2) [45]. The H2 decreased with the increase in oxygen concentration. The gap of the volume fraction of H2 between temperatures narrowed against the oxygen concentration, because an oxygen concentration of more than 2.5% promoted the H2 oxidation reaction, R6. It was considered that the combustion of H2 (R6) was more likely to happen than the water-gas shift reaction (R5) under a higher oxygen content. Similar conclusions have been reported by other researchers [11,20,43,46]. The trends of the syngas components with oxygen concentration were different from other research [43,46]. It should be noted that the comparison was started from gasification (oxygen centration over 1.25%). The variations of CO and CH4 were in agreement with others [43,46], CO was unchanged with the lower ER then decreased and CH4 was continuously decreasing. The trends of CO2 were similar with Albany’s research [43] and the decrease of H2 agreed with Niu’s study [46].
CO + H2O → CO2 + H2
H2 + ½O2 → H2O
CO + ½O2 → CO2
C + O2 → CO2
CH4 + H2O → CO + 3H2
CH4 + CO2 → 2CO + 2H2
These conclusions were attributed to the increasing O2, which participated in gasification reactions. In accordance with Le Chatelier’s principle, the reaction should forward to the direction of weakening change. The increasing oxygen content stimulated the reactions R1 and R4, so more CO and H2 were produced, but the oxygen content should be controlled in the proper range, otherwise it promotes the oxidation reactions R6, R7, and R8, which led to the different results. The value of H2/CO and the gas volumes were lower than those in other research [25,47]. The reason for this was that the temperature of the research was 800 °C. First of all, high temperature stimulated the production of H2 and CO, such as the decomposition reactions, tar cracking. Second, the Boudouard reaction (R3) and steam reforming reaction (R9) could occur at high temperatures. It should be noted that CH4 was easily converted to CO, H2, H2O, etc., at high temperatures (above 700 °C) [48]. Obviously, CO2 volume was greatly increasing, because the combustion happened more easily in the oxidizing atmosphere, so it appeared as the trends in Figure 4. When oxygen concentration exceeded 2.5%, the effect of temperature became insignificant due to the combustion intensification. Also, the effect of oxygen concentration on gas volume was stronger than that of temperature and higher oxygen concentration made the gap more obvious. Increasing the H2 yield and the value of H2/CO were the major topic, meanwhile, how to reduce the dilution of CO2 and N2 can effectively improve the syngas uses.
3.3. Product Yield and Energy Efficiency
Figure 5 describes the syngas LHV and combustible gas yield as a function of the oxygen concentration and temperature. The syngas LHV was calculated by Equation (1) without N2 dilution and the combustible gas yield was obtained by the addition of CO, CH4, and H2.
where CO, CH4, and H2 are volume fractions of the components.
LHV = 12.6CO + 35.8CH4 + 10.8H2 (kJ/L)
The combustible gas yield at 650 °C rose to its maximum point at an oxygen concentration of 1.25% and then declined, which was different from 550 and 600 °C because CH4 and H2 were consumed at high temperatures, and the CO volume increment was not sufficient to offset the reduction. This trend illustrated that temperature stimulated the oxidation reactions with the higher oxygen content, and it caused the decrease of combustible gas yields. The variation of combustible gas was as discussed above. The maximum combustible gas yield of gasification was 0.296 L/g, which is lower than that found in other research [11,24,25,44]. The results revealed that low combustible gas yields were obtained in high oxygen concentrations, this was not suitable for producing syngas from gasification. The highest combustible gas yield should be attained at the range of oxygen concentration of 1.25%–2.5%, and the corresponding conversion ER range was approximately 0.19–0.38, which was basically consistent with other research [43,49]. Because of the dilution of CO2, the LHV of syngas was dropping. The maximum combustible gas heating value was 15 kJ (without any dilution) and the syngas LHV of this condition (including CO2) was 10.98 kJ/L, which was produced under an oxygen concentration of 1.25% and a temperature of 650 °C. Obviously, the conversion LHV of syngas (including N2 and CO2) was lower than the 4–6 MJ/NM3 mentioned in other literature [21,26]. It was attributed to the less combustible gas yield and more CO2 yield.
We attempted to use the product of combustible gas yield and syngas LHV as a new index, considering the heating value, combustible gas fraction, and MSW mass comprehensively. According to the calculation, the maximum value of 3.26 kJ/g was obtained from the condition of 650 °C and 1.25% oxygen concentration, and it was also the maximum combustible gas heating value condition.
The energy utilization efficiency was calculated by Equation (2), which was a counter-balance method and consulted from the equation of the carbon conversion ratio in the literature [10]. The following three reasons can illustrate why we chose the counter-balance method. First, it was difficult to measure the energy consumed by combustion during gasification. Second, C2 hydrocarbons were not tested. The last one is that all forms of sensitive heat can add together.
where Etar and Echar are the chemical energy contained in unreacted tar and residue char, respectively.
The unconsumed energy during the gasification process (the chemical energy of unburned char and condensed tar) is obtained from the calculation. Then, the energy utilization efficiency of MSW in the process is calculated by the difference. The difference of energy efficiency between this study and others is the inclusion of consumed energy and the tar heating value. Tar was not used in this study, and the aim was to obtain syngas quality from MSW gasification at medium temperatures, thereby excluding the tar heating value.
The variation of energy efficiency as a function of the oxygen concentration is shown in Figure 6. The energy efficiency exceeded 70% (at 650 °C) where the oxygen concentration was larger than 2.5%. The condition of maximum combustible gas yield was selected as the optimum instead of the highest LHV of syngas because the highest LHV was obtained at pyrolysis, and the most tar and char were produced, and syngas yield was not satisfactory. More importantly, pyrolysis needs an external heat to take place, thus the economic performance of pyrolysis is poor, and it is difficult to expand on a larger scale. After an appropriate method to separate CO2, this maximum combustible gas yield condition shows great advantages and is considered to be the optimal one. Even in the best gasification condition, the energy efficiency and gas carbon conversion were also 63.6% and 46.8% respectively, but lower than in other literature [11]. Based on the results, the optimum operating condition for producing syngas from gasification in this study was achieved at a temperature of 650 °C and an oxygen concentration of 1.25%.
Technically, oxygen content is negatively correlated with gas quality (combustible gas yield) in a certain range, but positive with furnace temperature during gasification, and all of them keep a dynamic equilibrium. The higher oxygen content the less LHV of syngas will be obtained and the syngas is hard improve by refining. When the gasification occurs at low temperatures, the syngas can be refined by catalysts or other additives [20,23,44,50]. The refined syngas can be used in internal combustion engines or civil uses. According to thermal equilibrium, gasification keeps steady operation under specific conditions. It should be clear that the MSW auto-thermal gasification may not take place under all of the conditions of this study, which will be solved in the future.
The operated MSW gasification plants in other countries show that the MSW gasification has a good economic performance [14]. Now, the research about MSW gasification is focused on high temperatures (above 700 °C or higher) under low ER, but the practical operating temperature of a MSW incineration plant is 900–1000 °C, which means that even if all of the MSW combusts, the temperature fluctuates in the range of 900–1000 °C. So, MSW gasification under low ER at high temperatures can only be carried out with the assistant heat. This is also why there is no relevant application reported in China. In order to achieve the auto-thermal gasification, it has to conduct MSW gasification under medium temperatures (especially under 650 °C). The research of MSW gasification under medium temperatures is particularly significant and this is the significance of this study. However, we have not built the large-scale or pilot MSW auto-thermal gasification facility yet and it will be expanded after obtaining sufficient research results. Although the LHV of syngas and energy efficiency in this study are low, these disadvantages can be improved by refining syngas, and obtaining high LHV syngas is a further aim. The MSW gasification can be conducted in the large-scale fixed bed reactor or fluidized bed under medium temperatures in future studies, using the oxygen-rich air as the gasification agent. Compared with incineration, the products from gasification are abundant and can be used in various applications [3,6,43,51].
4. Conclusions
In this study, syngas from MSW gasification were investigated in a fixed-bed reactor. Here, medium temperature and oxygen concentration were introduced to explore the syngas evolution and syngas quality, which included syngas composition, combustible gas yield, and LHV of syngas. The investigations can be summarized as follows.
It does seem that the influence of different MSW components on the syngas evolution and syngas composition can be ignored. Temperature can promote the syngas quality in the range 550–650 °C, because the increasing temperature strengthens the reaction rate. It was found that the promotion of temperature on syngas quality was more evident than oxygen under lower oxygen concentrations (less than 1.25%). The O2 accelerated the tar cracking and the decomposition of volatiles, and also increased the combustible gas yield. The oxidation reactions were predominant with the increasing oxygen content and this caused the combustion of combustible fractions and larger amounts of CO2. Therefore, oxygen content should be controlled to a certain extent, which was at the range of oxygen concentration of 1.25%–2.5% in this study.
By comprehensive consideration, the optimal operating condition of gasification was obtained at an oxygen concentration of 1.25% and a temperature of 650 °C. Meanwhile, gas carbon conversion and energy efficiency were 46.8% and 63.6%, respectively. The significance of this study was to explore the feasibility of MSW gasification under medium temperatures and obtain adequate results for the application of this concept. It can provide insights for expanding the scale of gasification facilities.
Supplementary Materials
The following are available online at https://0-www-mdpi-com.brum.beds.ac.uk/2227-9717/8/1/84/s1, Table S1: The reference of statistical waste composition in metropolises, China.
Author Contributions
Conceptualization, B.J.; Formal analysis, Q.G. and W.W.; Software, Z.Z.; Writing—Original Draft Preparation, Q.G.; Writing—Review and Editing, Q.G. and W.W.; Supervision, B.J. All authors have read and agreed to the published version of the manuscript.
Funding
This project was supported by the National Key R&D Program of China (2018YFC1901200) and The National Natural Science Foundation of China (51741603).
Conflicts of Interest
The authors declare no conflicts of interest.
References
- China, National Bureau of Statistics. China Statistical Yearbook 2018, 1st ed.; China Statistics Press: Beijing, China, 2018.
- El-Fadel, M.; Findikakis, A.N.; Leckie, J.O. Environmental Impacts of Solid Waste Landfilling. J. Environ. Manag. 1997, 50, 1–25. [Google Scholar] [CrossRef]
- Xu, F.; Wang, B.; Yang, D.; Qiao, Y.; Tian, Y. The steam gasification reactivity and kinetics of municipal solid waste chars derived from rapid pyrolysis. Waste Manag. 2018, 80, 64–72. [Google Scholar] [CrossRef] [PubMed]
- Hoang, A.T.; Bui, X.L.; Pham, X.D. A novel investigation of oil and heavy metal adsorption capacity from as-fabricated adsorbent based on agricultural by-product and porous polymer. Energy Sources Part A Recover. Util. Environ. Effects 2018, 40, 929–939. [Google Scholar] [CrossRef]
- McKay, G. Dioxin characterisation, formation and minimisation during municipal solid waste (MSW) incineration: Review. Chem. Eng. J. 2002, 86, 343–368. [Google Scholar] [CrossRef]
- Gao, Y.; Jiang, J.; Meng, Y.; Yan, F.; Aihemaiti, A. A review of recent developments in hydrogen production via biogas dry reforming. Energy Convers. Manag. 2018, 171, 133–155. [Google Scholar] [CrossRef]
- Arena, U. Process and technological aspects of municipal solid waste gasification. A review. Waste Manag. 2012, 32, 625–639. [Google Scholar] [CrossRef]
- Couto, N.D.; Silva, V.B.; Rouboa, A. Assessment on steam gasification of municipal solid waste against biomass substrates. Energy Convers. Manag. 2016, 124, 92–103. [Google Scholar] [CrossRef]
- Couto, N.D.; Silva, V.B.; Rouboa, A. Thermodynamic Evaluation of Portuguese municipal solid waste gasification. J. Clean. Prod. 2016, 139, 622–635. [Google Scholar] [CrossRef]
- Tanigaki, N.; Manako, K.; Osada, M. Co-gasification of municipal solid waste and material recovery in a large-scale gasification and melting system. Waste Manag. 2012, 32, 667–675. [Google Scholar] [CrossRef]
- Bhoi, P.R.; Huhnke, R.L.; Kumar, A.; Indrawan, N.; Thapa, S. Co-gasification of municipal solid waste and biomass in a commercial scale downdraft gasifier. Energy 2018, 163, 513–518. [Google Scholar] [CrossRef]
- Tańczuk, M.; Junga, R.; Werle, S.; Chabiński, M.; Ziółkowski, Ł. Experimental analysis of the fixed bed gasification process of the mixtures of the chicken manure with biomass. Renew. Energy 2019, 136, 1055–1063. [Google Scholar] [CrossRef]
- Materazzi, M.; Taylor, R. Plasma-Assisted Gasification for Waste-to-Fuels Applications. Ind. Eng. Chem. Res. 2019, 58, 15902–15913. [Google Scholar] [CrossRef]
- Fernández-González, J.M.; Grindlay, A.L.; Serrano-Bernardo, F.; Rodríguez-Rojas, M.I.; Zamorano, M. Economic and environmental review of Waste-to-Energy systems for municipal solid waste management in medium and small municipalities. Waste Manag. 2017, 67, 360–374. [Google Scholar] [CrossRef]
- Zhou, H.; Long, Y.; Meng, A.; Li, Q.; Zhang, Y. Classification of municipal solid waste components for thermal conversion in waste-to-energy research. Fuel 2015, 145, 151–157. [Google Scholar] [CrossRef]
- Zhou, H.; Long, Y.; Meng, A.; Li, Q.; Zhang, Y. Interactions of three municipal solid waste components during co-pyrolysis. J. Anal. Appl. Pyrolysis 2015, 111, 265–271. [Google Scholar] [CrossRef]
- Zhou, H.; Long, Y.; Meng, A.; Li, Q.; Zhang, Y. Thermogravimetric characteristics of typical municipal solid waste fractions during co-pyrolysis. Waste Manag. 2015, 38, 194–200. [Google Scholar] [CrossRef] [PubMed]
- Zhou, H.; Meng, A.; Long, Y.; Li, Q.; Zhang, Y. Interactions of municipal solid waste components during pyrolysis: A TG-FTIR study. J. Anal. Appl. Pyrolysis 2014, 108, 19–25. [Google Scholar] [CrossRef]
- Niu, M.; Huang, Y.; Jin, B.; Wang, X. Oxygen Gasification of Municipal Solid Waste in a Fixed-bed Gasifier. Chin. J. Chem. Eng. 2014, 22, 1021–1026. [Google Scholar] [CrossRef]
- Liu, Z.; Lin, C.; Chang, T.; Weng, W. Waste-gasification efficiency of a two-stage fluidized-bed gasification system. Waste Manag. 2016, 48, 250–256. [Google Scholar] [CrossRef]
- Dong, J.; Chi, Y.; Tang, Y.; Ni, M.; Nzihou, A.; Weiss-Hortala, E.; Huang, Q. Effect of Operating Parameters and Moisture Content on Municipal Solid Waste Pyrolysis and Gasification. Energy Fuel 2015, 30, 3994–4001. [Google Scholar] [CrossRef] [Green Version]
- He, M.; Xiao, B.; Liu, S.; Hu, Z.; Guo, X.; Luo, S.; Yang, F. Syngas production from pyrolysis of municipal solid waste (MSW) with dolomite as downstream catalysts. J. Anal. Appl. Pyrolysis 2010, 87, 181–187. [Google Scholar] [CrossRef]
- Zhang, L.; Wu, W.; Zhang, Y.; Zhou, X. Clean synthesis gas production from municipal solid waste via catalytic gasification and reforming technology. Catal. Today 2018, 318, 39–45. [Google Scholar] [CrossRef]
- Zheng, X.; Ying, Z.; Wang, B.; Chen, C. Hydrogen and syngas production from municipal solid waste (MSW) gasification via reusing CO2. Appl. Therm. Eng. 2018, 144, 242–247. [Google Scholar] [CrossRef]
- Cao, Y.; Fu, L.; Mofrad, A. Combined-gasification of biomass and municipal solid waste in a fluidized bed gasifier. J. Energy Inst. 2019, 92, 1683–1688. [Google Scholar] [CrossRef]
- Lopes, E.J.; Queiroz, N.; Yamamoto, C.I.; Da Costa Neto, P.R. Evaluating the emissions from the gasification processing of municipal solid waste followed by combustion. Waste Manag. 2018, 73, 504–510. [Google Scholar] [CrossRef]
- Nzihou, A.; Stanmore, B. The fate of heavy metals during combustion and gasification of contaminated biomass—A brief review. J. Hazard. Mater. 2013, 256–257, 56–66. [Google Scholar] [CrossRef] [Green Version]
- Pei, H.; Wang, X.; Dai, X.; Jin, B.; Huang, Y. A novel two-stage biomass gasification concept: Design and operation of a 1.5 MWth demonstration plant. Bioresour. Technol. 2018, 267, 102–109. [Google Scholar] [CrossRef]
- Niu, M.; Huang, Y.; Jin, B.; Liang, S.; Dong, Q.; Gu, H.; Sun, R. A novel two-stage enriched air biomass gasification for producing low-tar high heating value fuel gas: Pilot verification and performance analysis. Energy 2019, 173, 511–522. [Google Scholar] [CrossRef]
- Zhang, M.; Feng, G.; Huang, R.; Yin, W.; Qing, X.; Ren, M.; Zhang, S. Removal of dioxin in flue gas from a large-scale MSWI by domestic activated carbon injection. Chin. J. Environ. Eng. 2015, 9, 5531–5536. [Google Scholar]
- Wang, H.; Yuan, B.; Hao, R.; Zhao, Y.; Wang, X. A critical review on the method of simultaneous removal of multi-air-pollutant in flue gas. Chem. Eng. J. 2019, 378, 122155. [Google Scholar] [CrossRef]
- Wang, C.; Xu, J.; Yang, Z.; Zhang, Z.; Cai, Z. A field study of polychlorinated dibenzo-p-dioxins and dibenzofurans formation mechanism in a hazardous waste incinerator: Emission reduction strategies. J. Clean. Prod. 2019, 232, 1018–1027. [Google Scholar] [CrossRef]
- Van de Velden, M.; Baeyens, J.; Brems, A.; Janssens, B.; Dewil, R. Fundamentals, kinetics and endothermicity of the biomass pyrolysis reaction. Renew. Energy 2010, 35, 232–242. [Google Scholar] [CrossRef]
- Gómez-Barea, A.; Leckner, B. Modeling of biomass gasification in fluidized bed. Prog. Energy Combust. Sic. 2010, 36, 444–509. [Google Scholar] [CrossRef]
- Valderrama Rios, M.L.; González, A.M.; Lora, E.E.S.; Almazán Del Olmo, O.A. Reduction of tar generated during biomass gasification: A review. Biomass Bioenergy 2018, 108, 345–370. [Google Scholar] [CrossRef]
- Qiao, Y.; Xu, F.; Xu, S.; Yang, D.; Wang, B.; Ming, X.; Hao, J.; Tian, Y. Pyrolysis Characteristics and Kinetics of Typical Municipal Solid Waste Components and Their Mixture: Analytical TG-FTIR Study. Energy Fuel 2018, 32, 10801–10812. [Google Scholar] [CrossRef]
- Wu, L.; Jiang, X.; Lv, G.; Li, X.; Yan, J. Interactive effect of the sorted components of solid recovered fuel manufactured from municipal solid waste by thermogravimetric and kinetic analysis. Waste Manag. 2020, 102, 270–280. [Google Scholar] [CrossRef]
- Butterman, H.C.; Castaldi, M.J.; Gelix, F.; Borrut, D.; Nicol, F.; Lefebvre, B. Biomass and RDF Gasification Using Ballistic Heating TGA Analysis. Waste Biomass Valoriz. 2014, 5, 607–623. [Google Scholar] [CrossRef]
- Ma, W.; Rajput, G.; Pan, M.; Lin, F.; Zhong, L.; Chen, G. Pyrolysis of typical MSW components by Py-GC/MS and TG-FTIR. Fuel 2019, 251, 693–708. [Google Scholar] [CrossRef]
- Lahijani, P.; Zainal, Z.A.; Mohammadi, M.; Mohamed, A.R. Conversion of the greenhouse gas CO2 to the fuel gas CO via the Boudouard reaction: A review. Renew. Sustain. Energy Rev. 2015, 41, 615–632. [Google Scholar] [CrossRef]
- Zhou, H.; Meng, A.; Long, Y.; Li, Q.; Zhang, Y. A review of dioxin-related substances during municipal solid waste incineration. Waste Manag. 2015, 36, 106–118. [Google Scholar] [CrossRef]
- Shen, H.; Wang, Y.; Chyang, C.; Wang, W.; Lin, G. Effects of Sulfur and Calcium Compounds on Dioxin Reduction in a Fluidized Bed Combustor. Aerosol Air Qual. Res. 2019, 19, 1079–1094. [Google Scholar] [CrossRef]
- Násner, A.M.L.; Lora, E.E.S.; Palacio, J.C.E.; Rocha, M.H.; Restrepo, J.C.; Venturini, O.J.; Ratner, A. Refuse Derived Fuel (RDF) production and gasification in a pilot plant integrated with an Otto cycle ICE through Aspen plus™ modelling: Thermodynamic and economic viability. Waste Manag. 2017, 69, 187–201. [Google Scholar] [CrossRef]
- Hu, B.; Huang, Q.; Buekens, A.; Chi, Y.; Yan, J. Co-gasification of municipal solid waste with high alkali coal char in a three-stage gasifier. Energy Convers. Manag. 2017, 153, 473–481. [Google Scholar] [CrossRef]
- Yang, L.; Ge, X.; Wan, C.; Yu, F.; Li, Y. Progress and perspectives in converting biogas to transportation fuels. Renew. Sustain. Energy Rev. 2014, 40, 1133–1152. [Google Scholar] [CrossRef]
- Niu, M.; Huang, Y.; Jin, B.; Wang, X. Simulation of Syngas Production from Municipal Solid Waste Gasification in a Bubbling Fluidized Bed Using Aspen Plus. Ind. Eng. Chem. Res. 2013, 52, 14768–14775. [Google Scholar] [CrossRef]
- Shayan, E.; Zare, V.; Mirzaee, I. Hydrogen production from biomass gasification; a theoretical comparison of using different gasification agents. Energy Convers. Manag. 2018, 159, 30–41. [Google Scholar] [CrossRef]
- Wang, B.; Albarracín-Suazo, S.; Pagán-Torres, Y.; Nikolla, E. Advances in methane conversion processes. Catal. Today 2017, 285, 147–158. [Google Scholar] [CrossRef] [Green Version]
- Vounatsos, P.; Atsonios, K.; Itskos, G.; Agraniotis, M.; Grammelis, P.; Kakaras, E. Classification of Refuse Derived Fuel (RDF) and Model Development of a Novel Thermal Utilization Concept Through Air-Gasification. Waste Biomass Valorization 2016, 7, 1297–1308. [Google Scholar] [CrossRef]
- Yu, M.; Li, Y.; Fan, Y.; Li, R.; Chi, Y. Gasification Characteristics of Combustible Solid Waste with Additives and Kinetics Study. Waste Biomass Valoriz. 2018, 9, 2571–2578. [Google Scholar] [CrossRef]
- Arena, U.; Di Gregorio, F.; De Troia, G.; Saponaro, A. A techno-economic evaluation of a small-scale fluidized bed gasifier for solid recovered fuel. Fuel Process. Technol. 2015, 131, 69–77. [Google Scholar] [CrossRef]
Figure 1.
Diagram of the experimental facility: (1) gas cylinder, (2) mass flowmeter controller, (3) temperature controller, (4) quartz tube, (5) tubular furnace, (6) thermocouples, (7) heating tape, (8) ice water bath, (9) gas meter.
Figure 1.
Diagram of the experimental facility: (1) gas cylinder, (2) mass flowmeter controller, (3) temperature controller, (4) quartz tube, (5) tubular furnace, (6) thermocouples, (7) heating tape, (8) ice water bath, (9) gas meter.

Figure 2.
Evolution of syngas composition during the pyrolysis process at 650 °C.

Figure 3.
Effects of temperature on syngas composition during gasification.

Figure 4.
Effect of oxygen concentration on gas composition at 650 °C during gasification.

Figure 5.
Effects of temperature and oxygen concentration on syngas LHV and combustible gas yield.

Figure 6.
Effect of temperature and oxygen concentration on energy efficiency.


Table 1.
Gasification operating conditions and product distribution.
| Temperature (°C) | Oxygen Concentration (%) | Product Distribution | ||
|---|---|---|---|---|
| Syngas (L) | Char (g) | Tar (g) | ||
| 550 | 0 | 0.588 | 0.679 | 0.532 |
| 1.25 | 0.948 | 0.615 | 0.496 | |
| 2.5 | 1.224 | 0.489 | 0.410 | |
| 3.75 | 1.615 | 0.347 | 0.322 | |
| 5 | 1.849 | 0.24 | 0.256 | |
| 600 | 0 | 0.77 | 0.639 | 0.431 |
| 1.25 | 1.109 | 0.56 | 0.391 | |
| 2.5 | 1.401 | 0.448 | 0.314 | |
| 3.75 | 1.755 | 0.322 | 0.228 | |
| 5 | 2.007 | 0.216 | 0.167 | |
| 650 | 0 | 0.898 | 0.59 | 0.365 |
| 1.25 | 1.366 | 0.544 | 0.329 | |
| 2.5 | 1.609 | 0.437 | 0.266 | |
| 3.75 | 1.881 | 0.316 | 0.195 | |
| 5 | 2.111 | 0.19 | 0.142 | |
The data in Table 1 is the averages of three duplicated experiments.
© 2020 by the authors. Licensee MDPI, Basel, Switzerland. This article is an open access article distributed under the terms and conditions of the Creative Commons Attribution (CC BY) license (http://creativecommons.org/licenses/by/4.0/).
Share and Cite
MDPI and ACS Style
Gu, Q.; Wu, W.; Jin, B.; Zhou, Z. Analyses for Synthesis Gas from Municipal Solid Waste Gasification under Medium Temperatures. Processes 2020, 8, 84. https://0-doi-org.brum.beds.ac.uk/10.3390/pr8010084
AMA Style
Gu Q, Wu W, Jin B, Zhou Z. Analyses for Synthesis Gas from Municipal Solid Waste Gasification under Medium Temperatures. Processes. 2020; 8(1):84. https://0-doi-org.brum.beds.ac.uk/10.3390/pr8010084
Chicago/Turabian StyleGu, Qinyang, Wei Wu, Baosheng Jin, and Zheng Zhou. 2020. "Analyses for Synthesis Gas from Municipal Solid Waste Gasification under Medium Temperatures" Processes 8, no. 1: 84. https://0-doi-org.brum.beds.ac.uk/10.3390/pr8010084
Note that from the first issue of 2016, this journal uses article numbers instead of page numbers. See further details here.