Article

Characterisation of Bioactive Ingredients in Extracts of Fresh and Dried Coniferous Trees for the Development of Sustainable Packaging Materials

1
Department of Natural Sciences, Institute of Technology, Resource and Energy-Efficient Engineering (TREE), Bonn-Rhein-Sieg University of Applied Sciences, 53359 Rheinbach, Germany
2
Faculty of Agriculture, University of Bonn, 53115 Bonn, Germany
3
Institute of Crop Science and Resource Conservation (INRES), University of Bonn, 53115 Bonn, Germany
*
Authors to whom correspondence should be addressed.
Submission received: 2 October 2020 / Revised: 26 October 2020 / Accepted: 27 October 2020 / Published: 28 October 2020
(This article belongs to the Special Issue Green Sustainable Chemical Processes)

Abstract

:
Background: Coniferous woods (Abies nordmanniana (Stev.) Spach, Abies procera Rehd, Picea abies (L.) H.Karst, and Picea pungens Engelm.) could contain useful secondary metabolites to produce sustainable packaging materials, e.g., by substitution of harmful petrol-based additives in plastic packaging. This study aims to characterise the antioxidant and light-absorbing properties and ingredients of different coniferous wood extracts with regard to different plant fragments and drying conditions. Furthermore, the valorisation of used Christmas trees is evaluated. Methods: Different drying and extraction techniques were applied with the extracts being characterised by determining the total phenolic content (TPC), total antioxidant capacity (TAC), and absorbance in the ultraviolet range (UV). Gas chromatography coupled with mass spectrometry (GC-MS) and an acid–butanol assay (ABA) were used to characterise the extract constituents. Results: All the extracts show a considerably high UV absorbance while interspecies differences did occur. All the fresh and some of the dried biomass extracts reached utilisable TAC and TPC values. A simplified extraction setup for industrial application is evaluated; comparable TAC results could be reached with modifications. Conclusion: Coniferous woods are a promising renewable resource for preparation of sustainable antioxidants and photostabilisers. This particularly applies to Christmas trees used for up to 12 days. After extraction, the biomass can be fully valorised by incorporation in paper packaging.

Graphical Abstract

1. Introduction

The challenges in modern society are characterised by an urgent need to change towards a more sustainable community. One critical issue is the production and waste management of plastic products. Typically, the formulation of plastic products includes stabilising additives that improve properties like antioxidant or antimicrobial stability or photosensitivity, to promote a reasonable product shelf life and to create competitive products. Globally, 336.9 kt antioxidants were produced in 2007 [1]. Most of those stabilisers are synthetic, petrol-based compounds and potentially harmful to the environment and human health, including the common stabilisers butylated hydroxytoluene (BHT) and butylated hydroxyanisole (BHA) [2,3,4]. Antioxidant and antimicrobial properties and absorbance of ultraviolet light (UV) are particularly relevant for stabilisers. Biobased alternatives to such stabilisers are severely underrepresented in research. The development of alternatives based on ecologically favourable biomasses to substitute common plastic packaging is strongly encouraged by the German Environmental Agency [5]. In previous studies, the biomasses of Common Thyme (Thymus vulgaris L.) and the fruits of the European Horse Chestnut (Aesculus hippocastanum L.) have been successfully examined by research groups for such applications [6,7]. The present study focuses on the immense potential of different coniferous woods for ecological additive production and furthermore investigates the suitability of both fresh Christmas trees and dried trees after use by individuals or companies.
Depending on the reference, between 23 and 30 million Christmas trees were sold in Germany in 2019 [8,9]. Those trees consist of 75% Nordmann firs (Abies nordmanniana (Stev.) Spach (AN)), 15% blue spruces (Picea pungens Engelm. (PP)), 3% noble firs (Abies procera Rehd. (AP)), and other species (7%) [8]. In addition to these three species, the present study investigates the Norway spruce (Picea abies (L.) H. Karst (PA)), too. Typically, after failed sale or after usage as a Christmas tree, the biomass is composted or converted into energy [10]. However, direct material use of coniferous trees is promising as some of the critical properties for their use as additives are reported in the literature. In AN leaves, antioxidant compounds like ascorbate and α-tocopherol have been found while the essential oil obtained from the leaves shows considerable antimicrobial effects, including effects against, e.g., different Bacillus cultures, Pseudomonas aeruginosa, Enterobacter aerogenes, and partly against Staphylococcus aureus [11,12,13,14]. Substances with antimicrobial effects can also be found in PA and AP leaves with PA leaf extracts showing a slight antimicrobial effect against S. aureus while essential oil prepared from AP leaves shows strong antimicrobial effects against, e.g., S. aureus as well as different Bacillus, Streptococcus, and Staphylococcus cultures [15,16,17]. Regarding AN, not only the leaves but also the bark includes antioxidant phenolic acids and flavonoids, e.g., catechin isomers and gallic acid [18]. For PA, antioxidants like ascorbate are found in the leaf and bark extracts [19,20].
In the present study, extracts of the aerial parts of the four listed coniferous trees are analysed with regard to their total antioxidant capacity (TAC), total phenolic content (TPC), UV absorbance, and chemical composition. These methods allow assessing the suitability of the extracts for application as biobased stabilisers for packaging materials, as described in the literature [7]. Where applicable, differences between leaves and wood are explored and characterised. Furthermore, the possibility of waste valorisation by obtaining biobased additives from used or un-sold Christmas trees is evaluated. The extraction process is optimised to facilitate possible industrial adaptation.

2. Materials and Methods

2.1. Chemicals and Instrumentation

A Perkin Elmer Lambda 25 dual-beam spectral photometer was used for all photometrical measurements, including total antioxidant capacity (TAC), total phenolic content (TPC), acid–butanol assay (ABA), and the determination of UV absorbance. For the GC-MS analysis, an Agilent 8890 GC system is used, equipped with an Agilent HP-5MS UI column (30 m × 0.25 mm; 0.25 µm film thickness) and coupled with an Agilent 5977B GC/MSD. A laboratory beater (type “Valley”), a sheet forming unit (type “Rapid Köthen”), a universal testing unit, and a thickness gauge unit provided by the company Frank-PTI, Birkenau, Germany, were used for paper preparation and analysis.
2(3)-tert-butyl-4-methoxyphenol (BHA) and dipotassium hydrogen phosphate were purchased from Alfa Aesar (Karlsruhe, Germany), whereas 2,2′-azino-bis(3-ethylbenzthiazoline-6-sulphonic acid) (ABTS), acetic acid, Trolox, N-Methyl-N-(trimethylsilyl)trifluoroacetamide (MSTFA), and 2,6-di-tert-butyl-4-methylphenol (BHT) were purchased from AppliChem GmbH (Darmstadt, Germany), Bernd Kraft (Duisburg, Germany), Cayman chemical Company (Ann Arbor, MI, USA), CS-Chromatographie Service GmbH (Langerwehe, Germany), and ThermoFisher (Waltham, MA, USA), respectively. Ammonium iron (III) sulphate dodecahydrate, butan-1-ol, concentrated hydrochloric acid, hexane, methanol, and acetone were obtained from VWR International, Darmstadt, Germany. Folin–Ciocalteu phenol reagent, hydrogen peroxide, potassium dihydrogen phosphate, sodium hydroxide, and sodium acetate were purchased from Merck KGaA, Darmstadt, Germany.

2.2. Sample Preparation and Extraction

To minimise sampling errors, branches from several, randomly chosen trees of all four species were collected from Hof Große Wöstmann, Rinkerode, Germany. The branches of each species were cut into smaller fragments and stored at −20 °C. As acetone has proven to be the most potent extractant in pre-tests, while resulting in the most comparable results for all species (Figure S1), it was used to prepare all extracts featured in the study. However, a mixture of acetone and water (1:1 (v/v)) could be used in suited future applications as it provides similar antioxidant properties. Moreover, more environmentally friendly solvents are applied in this case.
For the in-house established extraction (“grinding extraction”), 600 mg of the sample material was ground using a ball mill applying liquid nitrogen for cooling. Afterwards, the sample material was extracted with 6 mL acetone before centrifuging. The supernatant was collected, filled up to 10 mL, and filtered.
For the passive extraction applied during extraction optimisation, approx. 600 mg of the sample material was chopped and filled into a vessel. The active ingredients were extracted with 15 mL acetone and stored at room temperature under exclusion of light. After varying periods of storing, the supernatant was collected and filtered.

2.3. Determination of UV Absorbance

The UV/Vis spectra of the different extracts were recorded in the range of 260–800 nm. For these measurements, it was necessary to dilute the extracts to varying extents to meet the instrument’s linear range. The results are given in relative absorbance units (rAU), taking applied dilutions into account. In a previous study, a similar UV/Vis analysis of plant extracts was conducted successfully [7].

2.4. Determination of TAC via ABTS Radical Cation (ABTS•+) Scavenging Capacity Assay (ABTS Assay)

The TAC is determined via a modified ABTS Assay [21]. The assay is performed in accordance with the literature [7]. Discolouration of ABTS radical cations is observed at λ = 660 nm with two blank samples per assay. Results are interpreted with regard to external calibration using Trolox solutions; therefore, the results are given in Trolox equivalents per mg of extracted sample material (mg·Teq·mg−1). Where applicable, the type of sample material is specified by FM (fresh mass) or DM (dried mass).

2.5. Determination of Total Phenolic Content (TPC) via Folin–Ciocalteu Assay

The total phenolic content (TPC) was determined via the Folin–Ciocalteu assay [22,23] and performed in a modified way as described in the literature with the colour change observed at λ = 720 nm [7]. Blank samples are measured at least every 10 samples. For interpretation of the results, an external calibration with gallic acid is prepared; thus, the results are given in gallic acid equivalents (GAE) per mg of extracted sample material (if applicable, specified as FM or DM).

2.6. Acid–Butanol Assay (ABA)

The acid–butanol assay (ABA) is based on the literature and specifically proves the presence of proanthocyanidins [24]. The assay was conducted in a modified way, according to the literature, measuring colour changes at λ = 550 nm [7]. As no calibration is prepared, the ABA results are interpreted in a semi-quantitative way only.

2.7. Gas Chromatography Coupled with Mass Spectrometry (GC-MS)

The GC-MS analysis was conducted to obtain semi-quantitative information on the composition of the coniferous wood extracts. For analysis of polar, non-volatile substances, the extracts were derivatised by mixing 50 µL of extract with 50 µL N-methyl-N-(trimethylsilyl)trifluoracetamide (MSTFA) before incubating the mixture at 80 °C for 15 min, resulting in the hydroxyl groups of the analytes being replaced by trimethylsilyl groups. Then 1 µL of the mixture was injected into the GC-MS apparatus. Afterwards, the oven was heated from an initial 50 °C to 325 °C by applying a heating rate of 10 °C·min−1 before holding the final temperature for 30 min.

2.8. Preparation and Analysis of the Paper Sheets

For the feasibility analysis of the paper packaging prepared from coniferous wood aerial parts after extraction with acetone, different sheets of paper were produced and their thickness, tensile strength, and elongation at break were analysed. The sample material remaining after passive extraction with acetone for 7 days according to Section 3.2.3 was dried at 60 °C until a constant residual moisture was reached. Afterwards, the sample material was ground using a cutting mill and sieved through a 1 mm sieve. For sheet preparation, the milled sample material was mixed with pinewood pulp in water in the ratio of 1:10 (w/w). The mixture was transferred to a laboratory beater until 30 Schopper Riegler degrees (°SR) was reached (determination according to [25]). The resulting pulp was used to prepare sheets with different grammages (60, 80, 120, 200, 300, and 400 g·m−2) and a diameter of 200 mm using a sheet forming unit according to [26]. Afterwards, the thickness of the sheets was assessed, and the tensile strength and elongation at break were analysed [27].

2.9. Statistical Interpretation

Statistical evaluation of the appropriate results was conducted by applying the Games–Howell test (α ≤ 0.05) for comparison of different value groups with regard to significant differences unless otherwise stated. For this purpose, the software IBM SPSS version 26 was used.

3. Results and Discussion

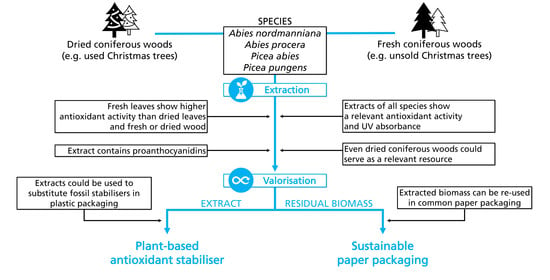
3.1. General Suitability

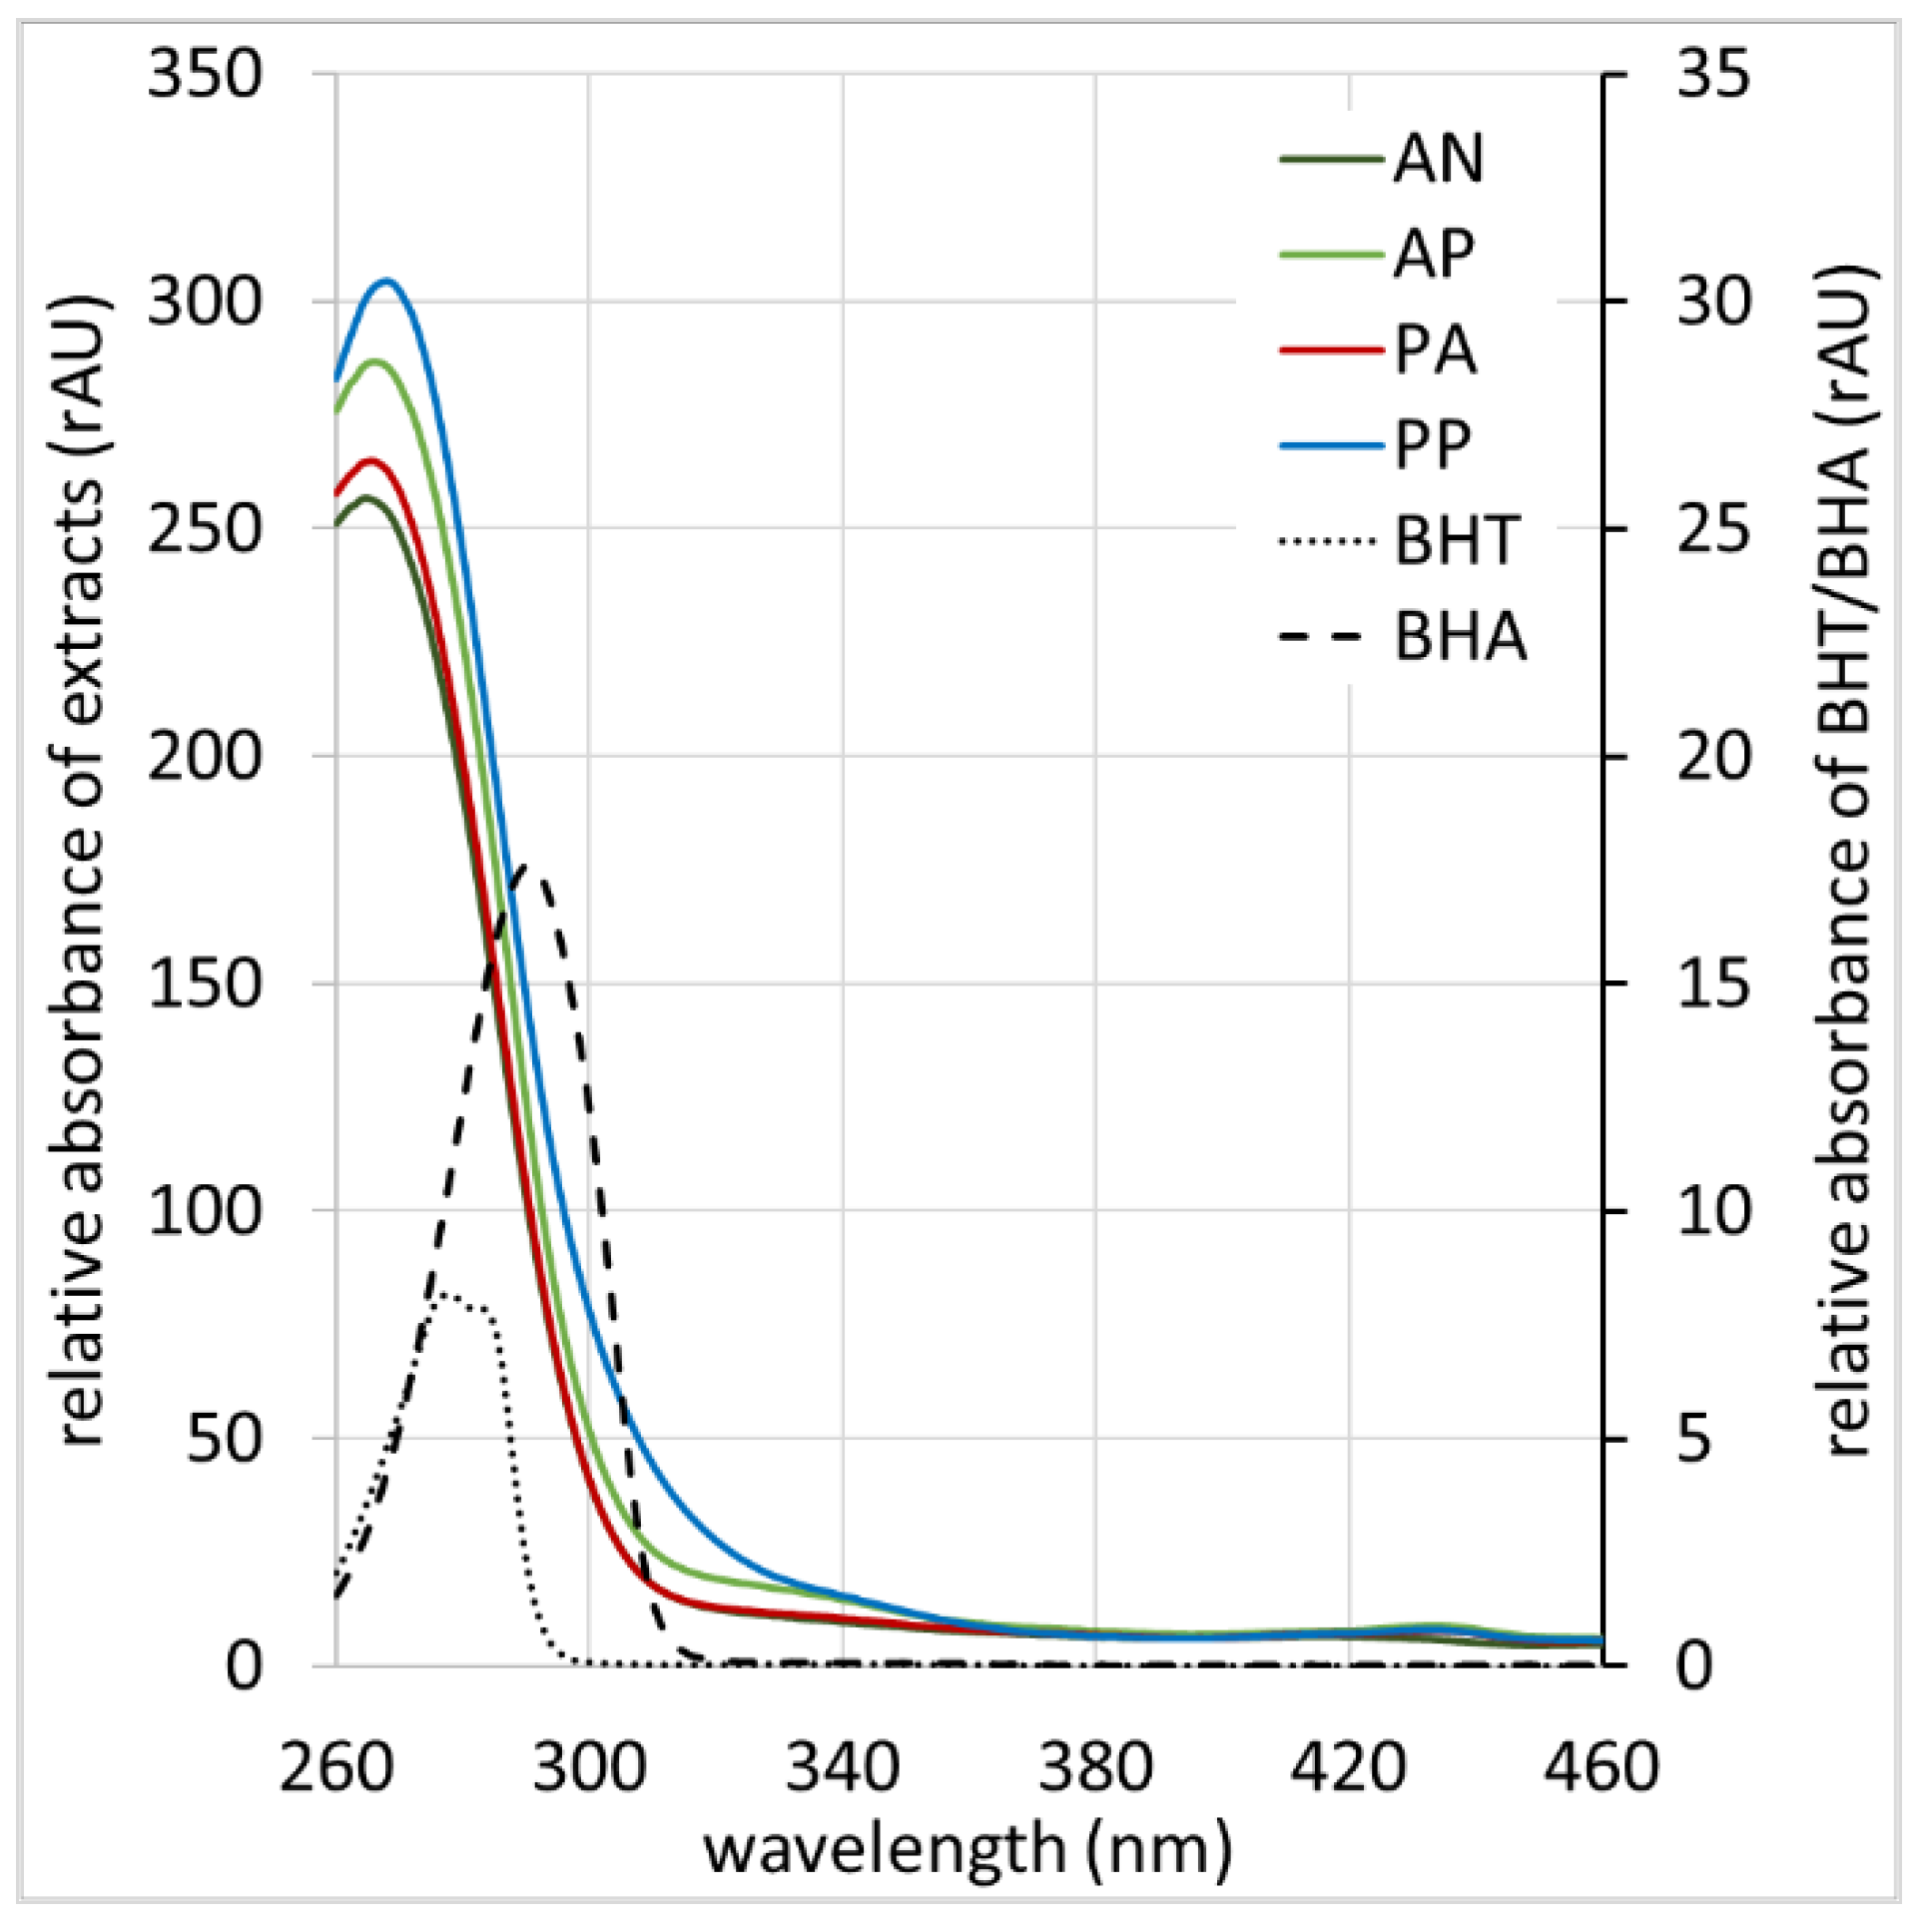
3.1.1. UV/Vis Absorbance
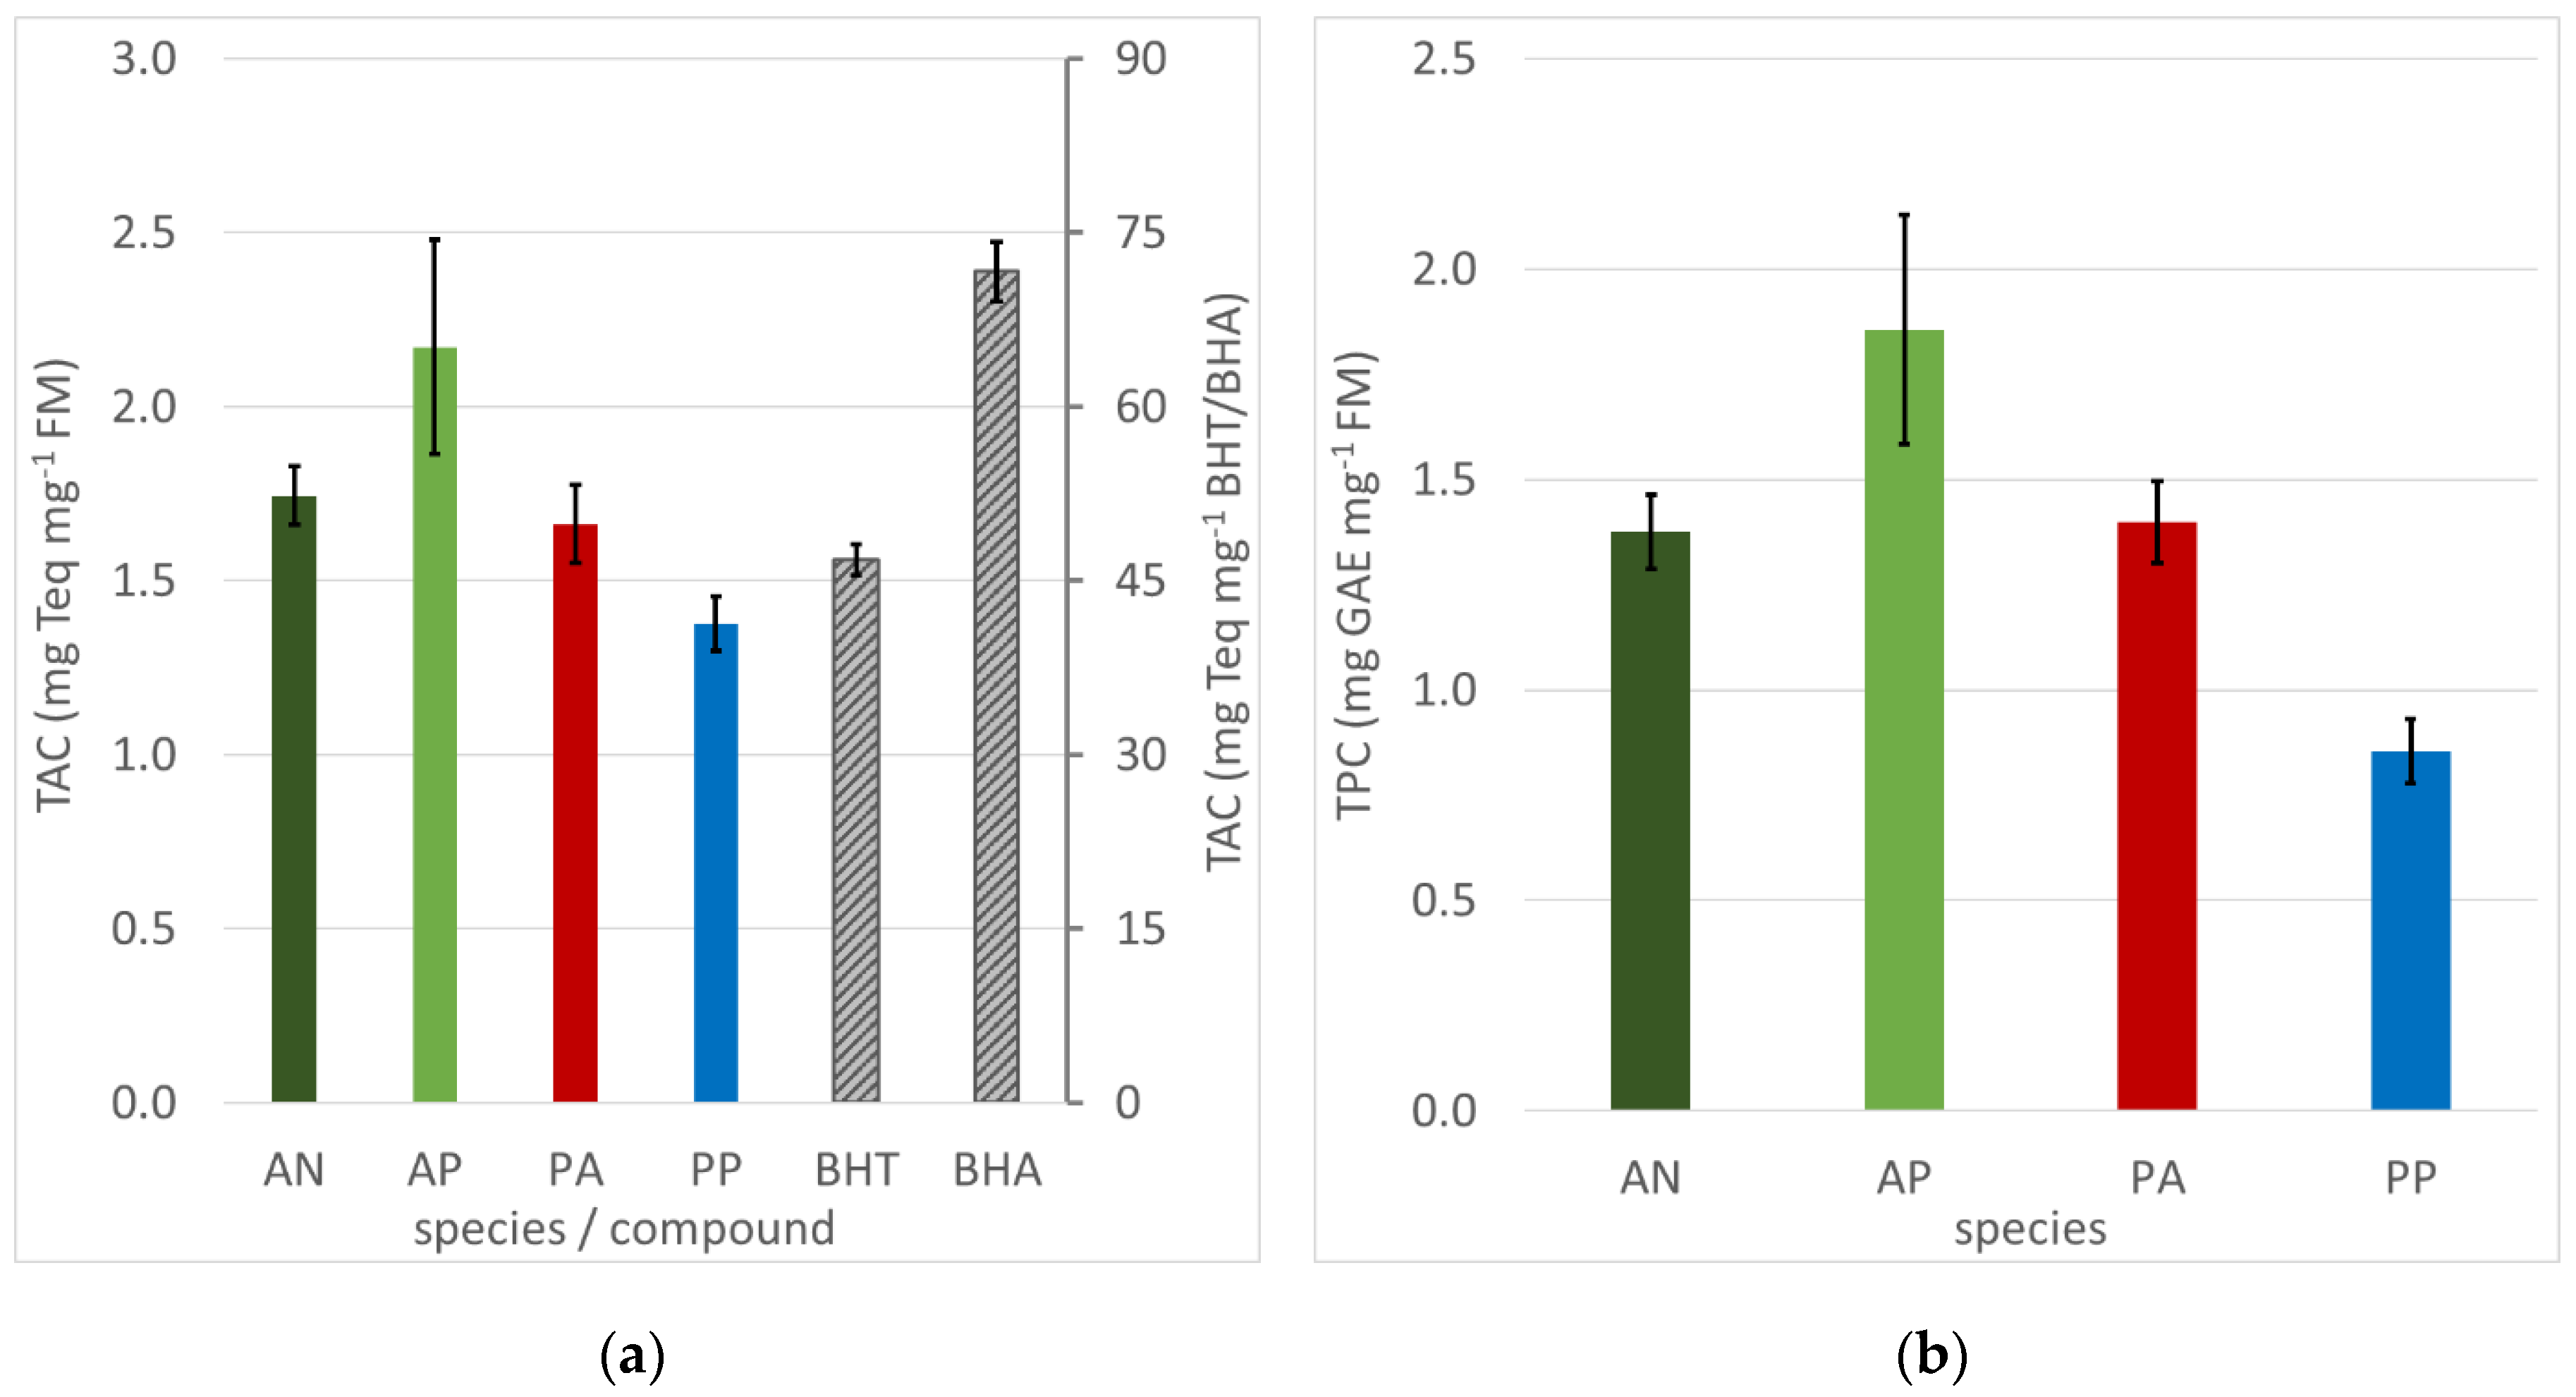
As depicted in Figure 1, all four coniferous wood extracts show an absorbance maximum at approx. 265–270 nm, depending on the wood species. The PP extract shows the highest absorbance with approx. 304 rAU, followed by the AP, PA, and AN extracts with maximum absorbances of 287, 265, and 257 rAU, respectively. The absorbance declines until 350 nm for all four species with all extracts showing little absorbance in the low visible range up to approx. 500 nm and in the range of 655–685 nm. Until a wavelength of 800 nm, no other relevant absorbance is observed and therefore not presented.
All four coniferous wood extracts show a comparable, considerable absorbance in the UV-B and UV-C range, while no relevant absorbance in the visible range is observed. Even the AN extract, which shows a significantly reduced UV absorbance at maximum, is considered a potential worthwhile resource for photostabilisers due to the similar course of all extracts and their comparably minor differences with a factor of approx. 1.2 between the highest and lowest absorbing extracts. Due to the low absorbance in the visible range, the extracts have a limited influence only on the colour of the final product, which is favourable for most applications.
The UV spectra obtained for all wood species is comparable to the ones obtained from Aesculus hippocastanum (AEH) seed coats (maximum of AEH extracts: 275 nm) while showing a reduced maximum relative absorbance (coniferous woods: approx. 257–304; AEH seed coats: approx. 350) [7]. However, the AEH extraction was improved compared to before with respect to plant fractions and extraction duration. Common antioxidant stabilisers BHT and BHA absorb in the UV-B and UV-C range only, showing maxima at 275 and 291 nm, respectively. Thus, a small shift to higher wavelengths can be observed in comparison to coniferous wood extracts. The extracts surpass the maximum absorbance of the BHT and BHA solutions with a concentration of 1.0 g·L−1 by the factors of approx. 33–40 and 15–18, respectively (depending on the coniferous wood species). Therefore, regarding UV absorbance, 1 mL of extracts obtained from popular AN could substitute approx. 33 mg of BHT or 15 mg of BHA; for the most potent UV absorbing coniferous wood, PP, even 40 mg of BHT or 18 mg of BHA could be substituted.

3.1.2. TAC and TPC

As presented in Figure 2a, all four coniferous wood extracts show a relevant TAC with AP extracts appearing to be the most potent ones. While no significant differences are proven between the AN, AP, and PA extracts, the PP extracts show a significantly lower TAC of 1.4 mg·Teq·mg−1 FM. Generally, those interpretations are applicable to TPC results as well apart from the PA and PP extracts not showing a significant difference (Figure 2b). As the extract constituents indicated by the Folin–Ciocalteu assay and the ABTS assay overlap, the TPC results are expected to roughly confirm the results obtained by the TAC determination. A considerable antioxidant effect of the different extracts is supported by the literature as antioxidant compounds like ascorbate and α-tocopherol have been found in PA and AN leaf extracts [12,19].
In comparison, the synthetic antioxidants BHT and BHA in a concentration of 1 g·L−1 show a TAC approx. 30 times higher than the ones of coniferous wood extracts. Thus, approx. 30 mL of extracts could theoretically substitute 1 mg of BHT or BHA for antioxidant stabilisation purposes. However, this comparison is based on extracts prepared to enable analytical comparison instead of optimising the extraction regarding maximum efficiency. For the AEH extracts analysed in a previous study, such an optimisation has been successful while a comparable TAC has been observed for extracts obtained focusing on analytical characterisation [7].
With respect to the UV absorbance results, coniferous wood extracts are thus considered a potentially relevant source of stabilisers for use in plastic products.

3.2. Analysis of Waste Valorisation: Utilisation of Christmas Trees after Private Usage

To evaluate the potential of used indoor Christmas trees as raw material for the ecological production of stabilisers, branches of all four species were placed on trays to prevent unwanted loss of sample material, e.g., by leaves falling off. On these trays, the sample branches were dried at room temperature for various periods up to 32 days. That way, realistic surroundings are applied to the tree branches, resembling a situation of felled Christmas trees set up in a private household without watering. Afterwards, the branches were extracted and analysed.
Due to a considerably reduced outdoor temperature, it is anticipated that the usage of cut outdoor Christmas trees, e.g., set in private yards or in front of public buildings, would result in increased TAC and TPC values, ranging between the ones obtained from the fresh branches extracts and the extracts obtained during this section.

3.2.1. UV/Vis Absorbance
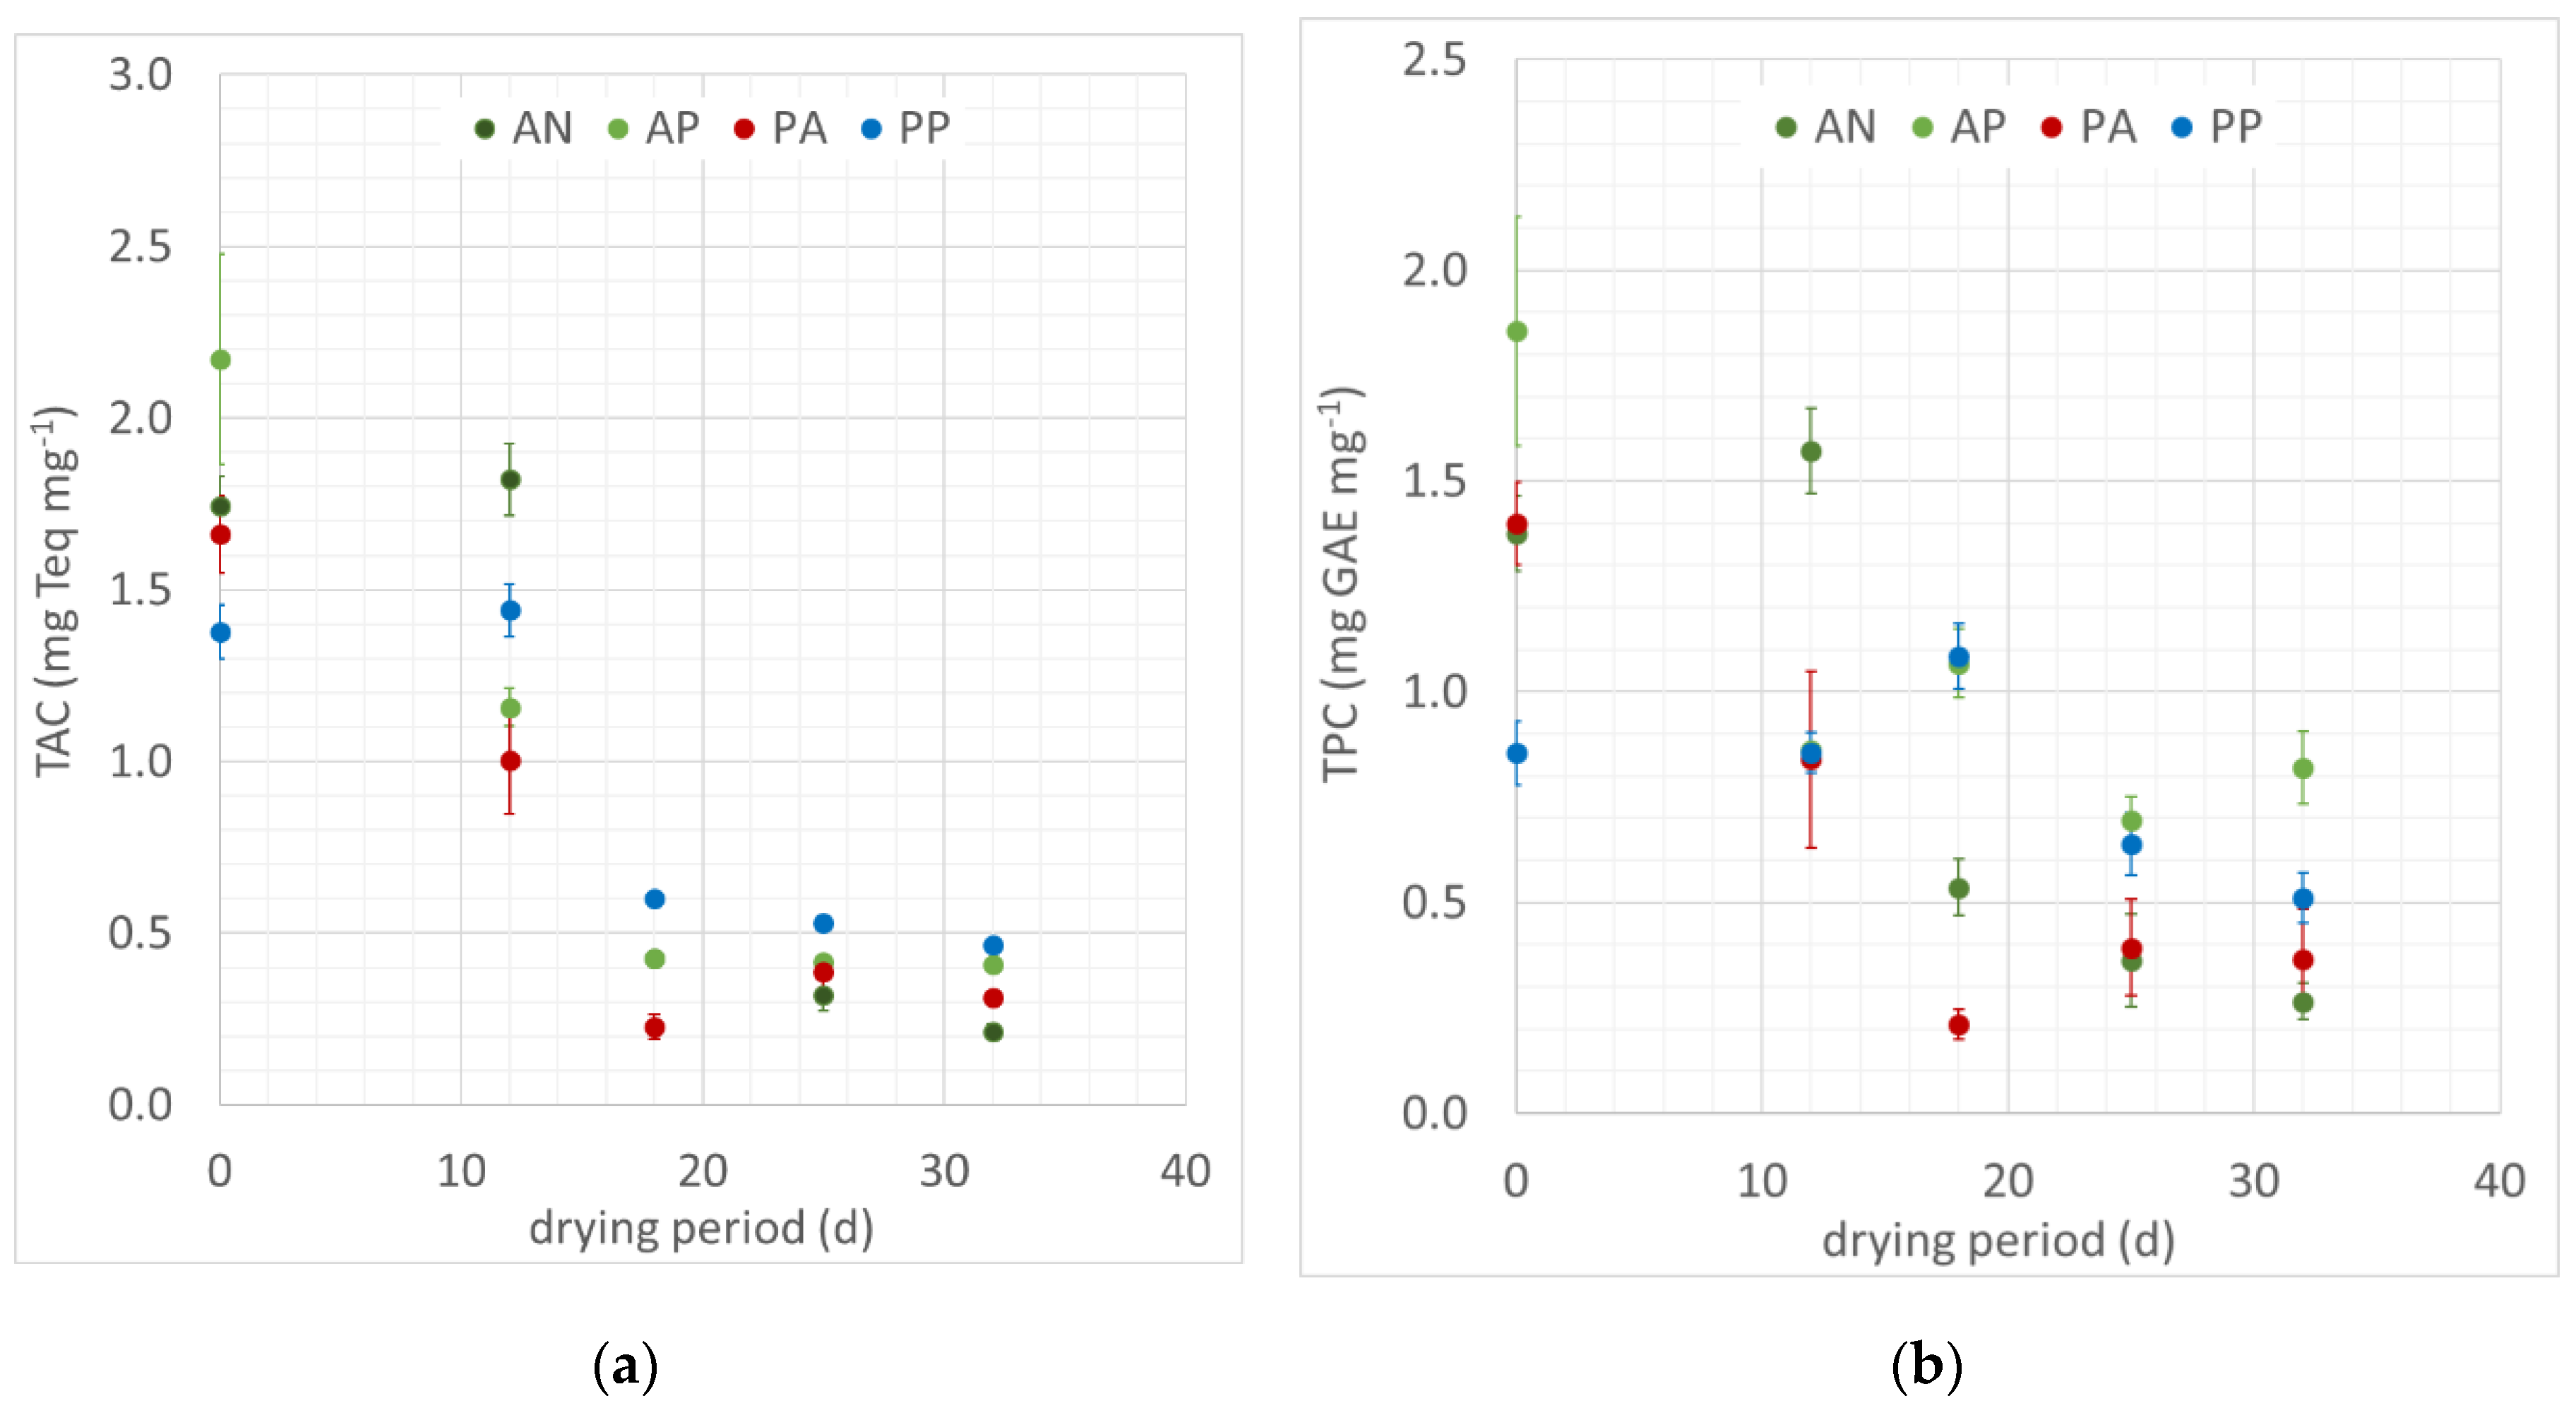
As depicted in Figure 3, all four species show a decreasing UV absorbance over time, starting at a maximum absorbance of 257–304 rAU as discussed before. However, the decrease rate is varying for the different species. While the AN, PA, and PP extracts show a decrease of approx. 50 rAU during the first 12 days of drying, the AP extracts decrease approx. twice as much. For most species, the decrease rate is high at the beginning while slowing down for longer drying periods, resulting in the UV spectra of 25 d extracts and 32 d extracts not significantly differing. However, for the PP extracts, no approximation of UV spectra with longer drying periods is observed. This is supported by the PP extracts of the 25 d and 32 d samples showing a significant difference in maximum absorbance. Generally, the PP extracts show the highest absorbance values of all four species for each drying period. In contrast to other species’ extracts, the PP extracts show a relatively small relative decrease with 57% of the maximum absorbance retained after 32 days of drying (other species’ extracts: 48–50%).
Overall, the PP extracts show the highest UV absorbances after drying the biomass for all tested periods of up to 32 days. PP branches are thus seemingly less prone to loss of UV absorbing substances due to drying. AP branches in contrast are particularly sensitive about drying with regard to UV absorbance as the maximum absorbance of the extracts is considerably lower even after the shortest tested drying period of 12 days.
However, all extracts show a significantly higher UV absorbance than solutions of the synthetic stabilisers BHT and BHA (1.0 g·L−1; UV spectra plotted in Figure 1). Even the least absorbing extracts of the PA branches dried for 32 days, and the analogously produced extracts from AN and AP thus theoretically substitute circa 7.5 mg BHA or 15.0 mg BHT regarding UV absorbance. Therefore, both fresh and dried coniferous wood could serve as a relevant source of photostabilisers.

3.2.2. TAC and TPC

The total antioxidant capacity remains stable for at least 12 days of drying whole AN and PP branches at room temperature, as shown in Figure 4 (statistical evaluation according to Tukey test, α ≤ 0.05). For the AP branches, the TAC values significantly decrease during the first 12 days of drying. The antioxidant capacity drops to a comparably stable minimum of approx. 0.2–0.6 mg·Teq·mg−1 after max. 18 days of drying with relatively small interspecies differences. This trend is clearly observable with TAC and approved by determination of the TPC with small deviations; primarily, the TPC values show a slower decrease over time and a higher scattering of values.
Thus, using fresh biomass for secondary metabolite extraction is preferred as expected. However, a storage at room temperature is acceptable for at least 12 days particularly for AN and PP trees as they do not show a significant decrease in antioxidant capacity during this period. After a maximum of 18 days, all species’ extracts result in a limited amount of antioxidant capacity only, presumably due to oxidative stress occurring during the long-term drying process [28,29]. Thus, watering the ornamental branches or Christmas trees used for extraction of antioxidants could expand the acceptable period of usage prior to extraction.

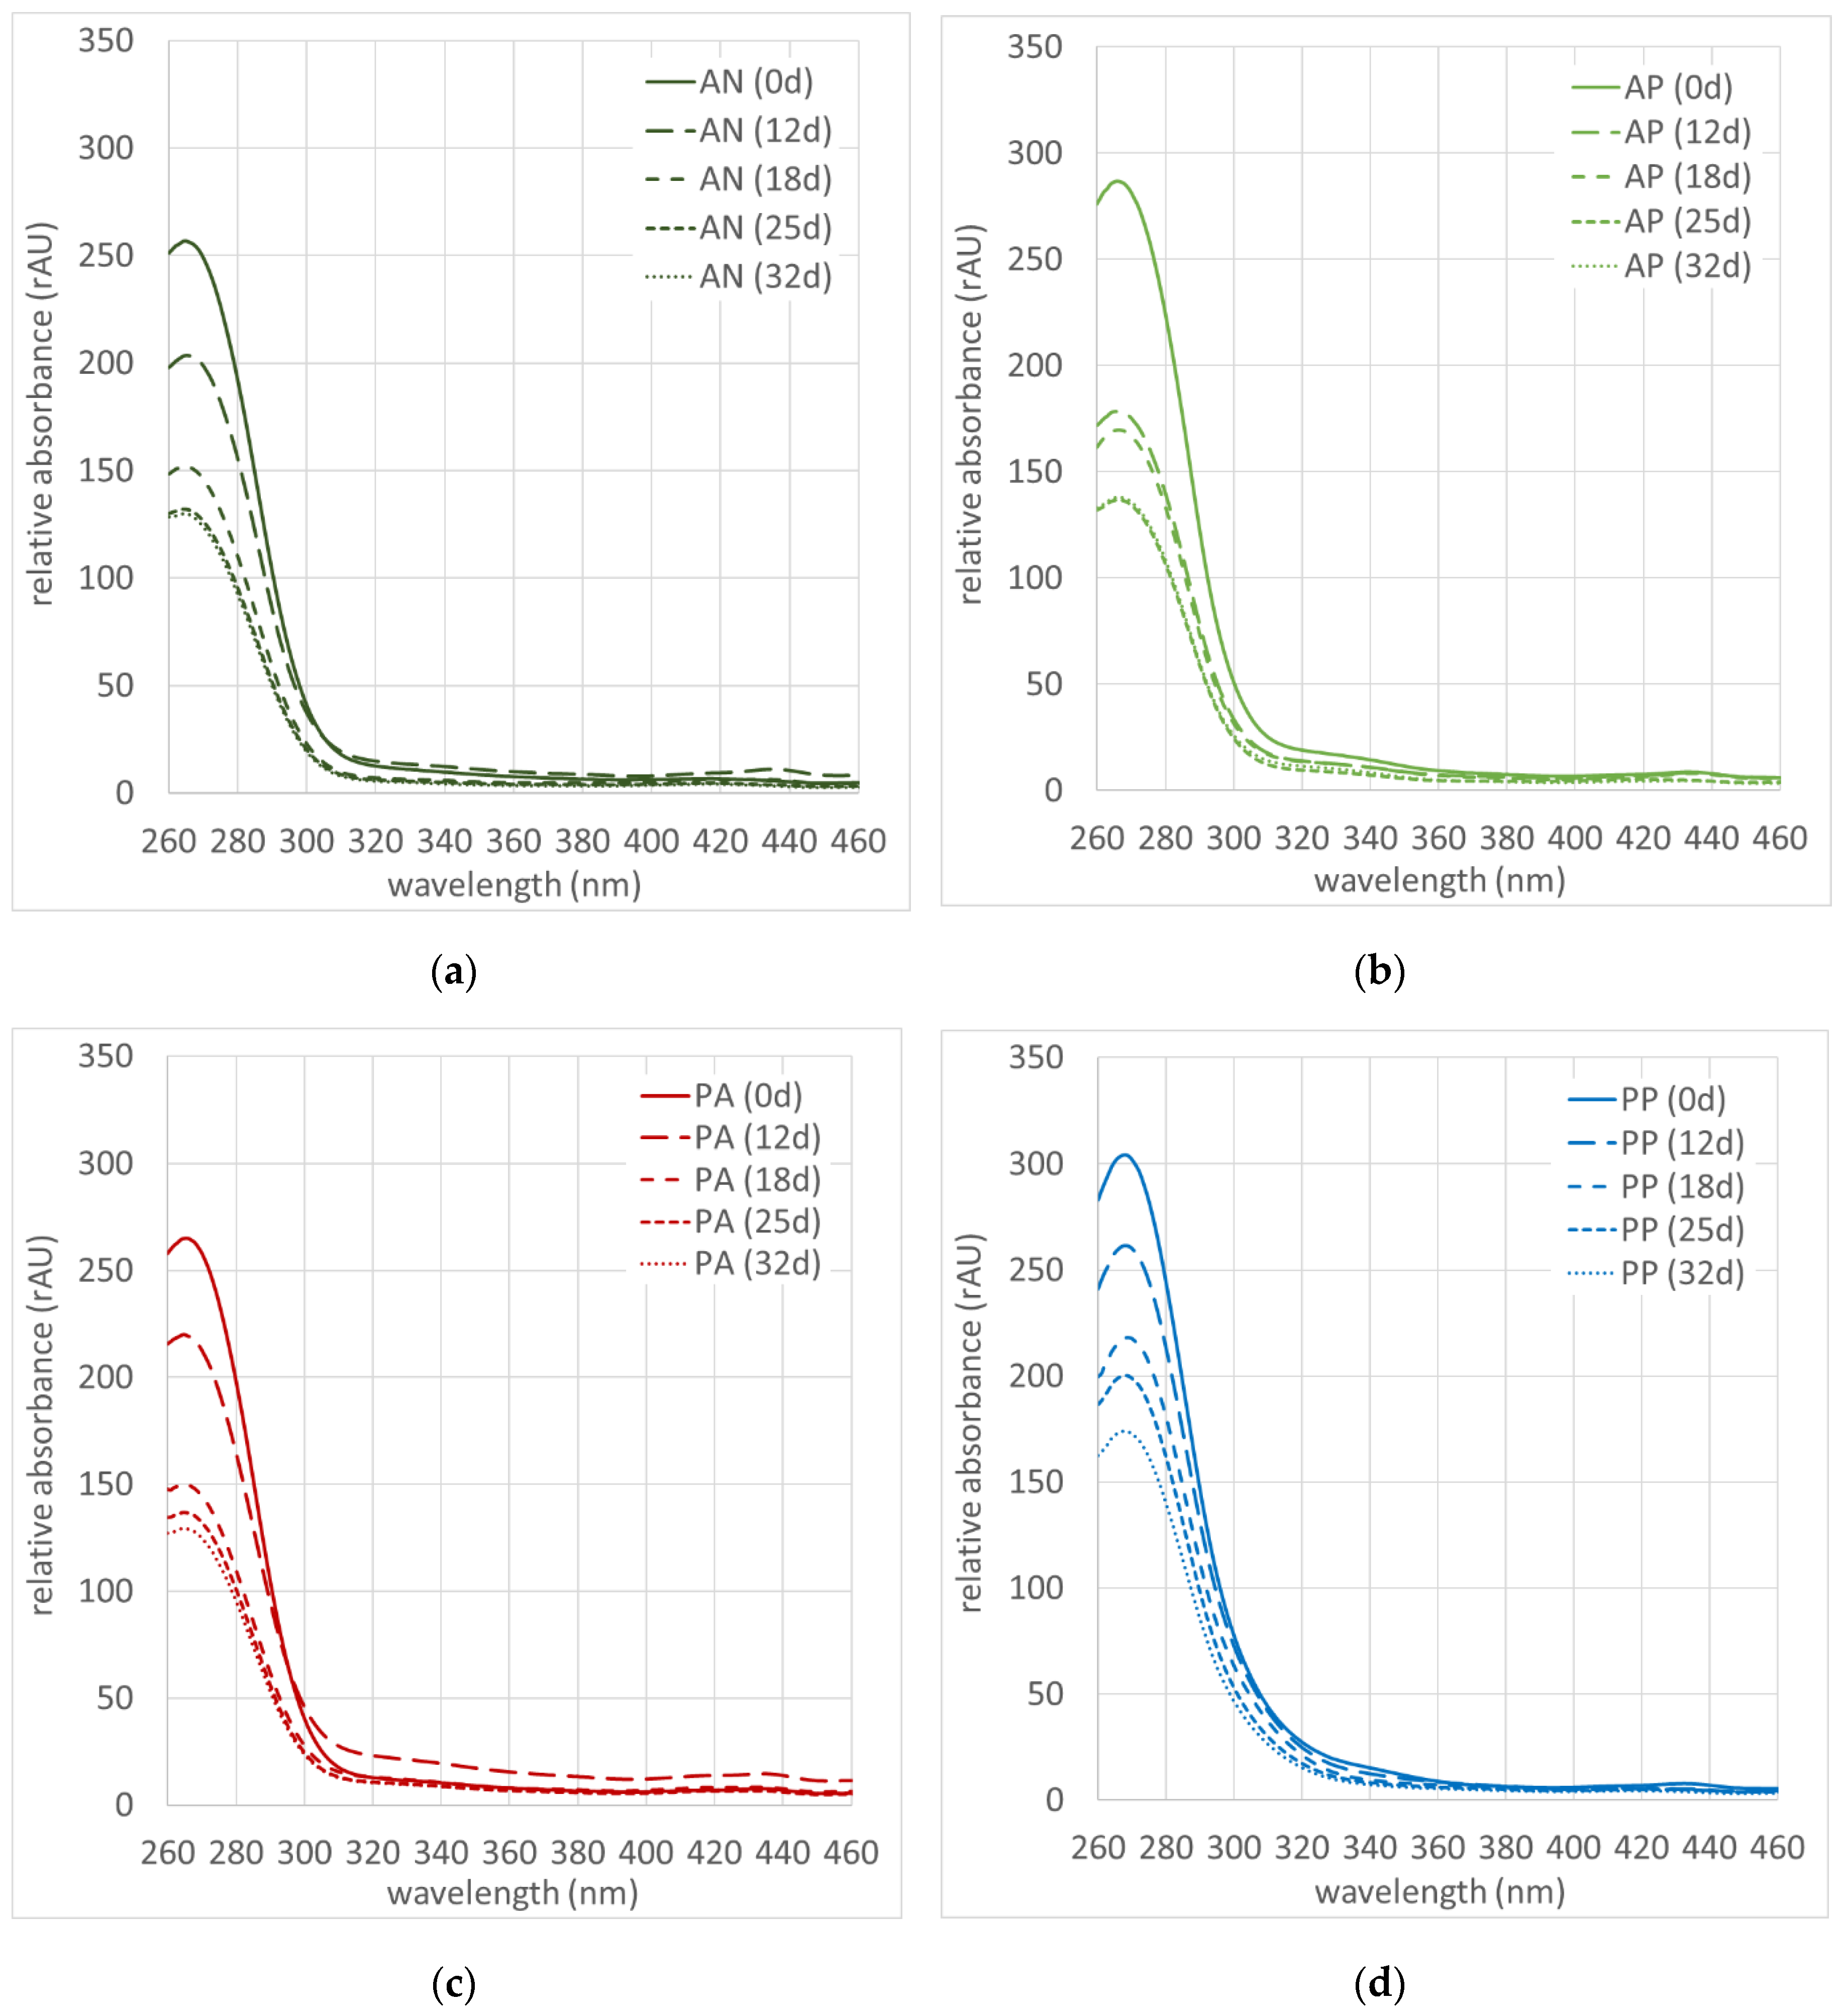
3.2.3. Extraction Optimisation

Additionally, a simplified extraction technique was applied to the coniferous wood samples to evaluate a possible application that is easier to adapt in practice. The most promising yet realistic scenarios of Christmas tree purposes are considered (fresh sample mass and sample mass dried at room temperature for 12 days). For this approach, the biomass is roughly chopped and brought into contact with the solvent for longer time periods of 24 h to 21 days instead of performing the more exact process of conducting analytical cryoextraction on milled samples within several minutes as it is done for prior analyses. To evaluate the extraction outcome, the TAC values were determined in triplicate (Figure S2).
Although the mean values of the individual samples show a scattering that hampers the reasonable interpretation and comparison of individual samples, several trends can be observed. Generally, AP and AN samples show a higher TAC than PA and PP samples when stored for the same period. This applies to both fresh and dried biomass. This general observation is consistent with the findings presented in Figure 2. Especially for species PA and PP, extraction of dried biomass resulted in an increase of approx. 0.3 mg·Teq·mg−1 biomass in comparison to fresh biomass samples. A better extractability of the dried biomass in comparison with the fresh biomass has been described in the literature for other plants [30,31], leading to an enhanced extraction yield. This interpretation is supported by the finding that AP and AN branches lose a higher relative amount of water during the first 12 days of drying than PA and PP branches, resulting in comparatively dry samples. As a general finding for all species, irrespective of the drying conditions, no relevant further increase in TAC is observed after approx. 7–10 days of incubation. These results match the optimum storage period observed for AEH seed coats extracted in a comparable setup [7]. However, TAC values only reach approx. half of the maximum value observed in analytical extraction (Figure 2). This is partly caused by reducing the biomass used for the extraction from approx. 60 mg biomass per mL extractant to approx. 47 mg biomass per mL extractant due to the characteristics of the extraction vessel. However, it is also possible that biochemical degradation of secondary metabolites occurs during the long process, given that the extractant does not prevent such reactions [32]. By using extraction vessels with another geometry, condensing the biomass in the reaction vessel, applying the concept to higher amounts of biomass and extractant, or narrowing the extractant after extraction, the biomass extractant ratio could be increased again, compensating the observed loss of TAC and possibly resulting in a lower extract variability. That way, fresh and dried coniferous wood could become a particularly relevant biomass for sustainable additive production while minimising the workload and energy needed for the process with excellent prospects when it comes to transferring the laboratory work to a larger scale.

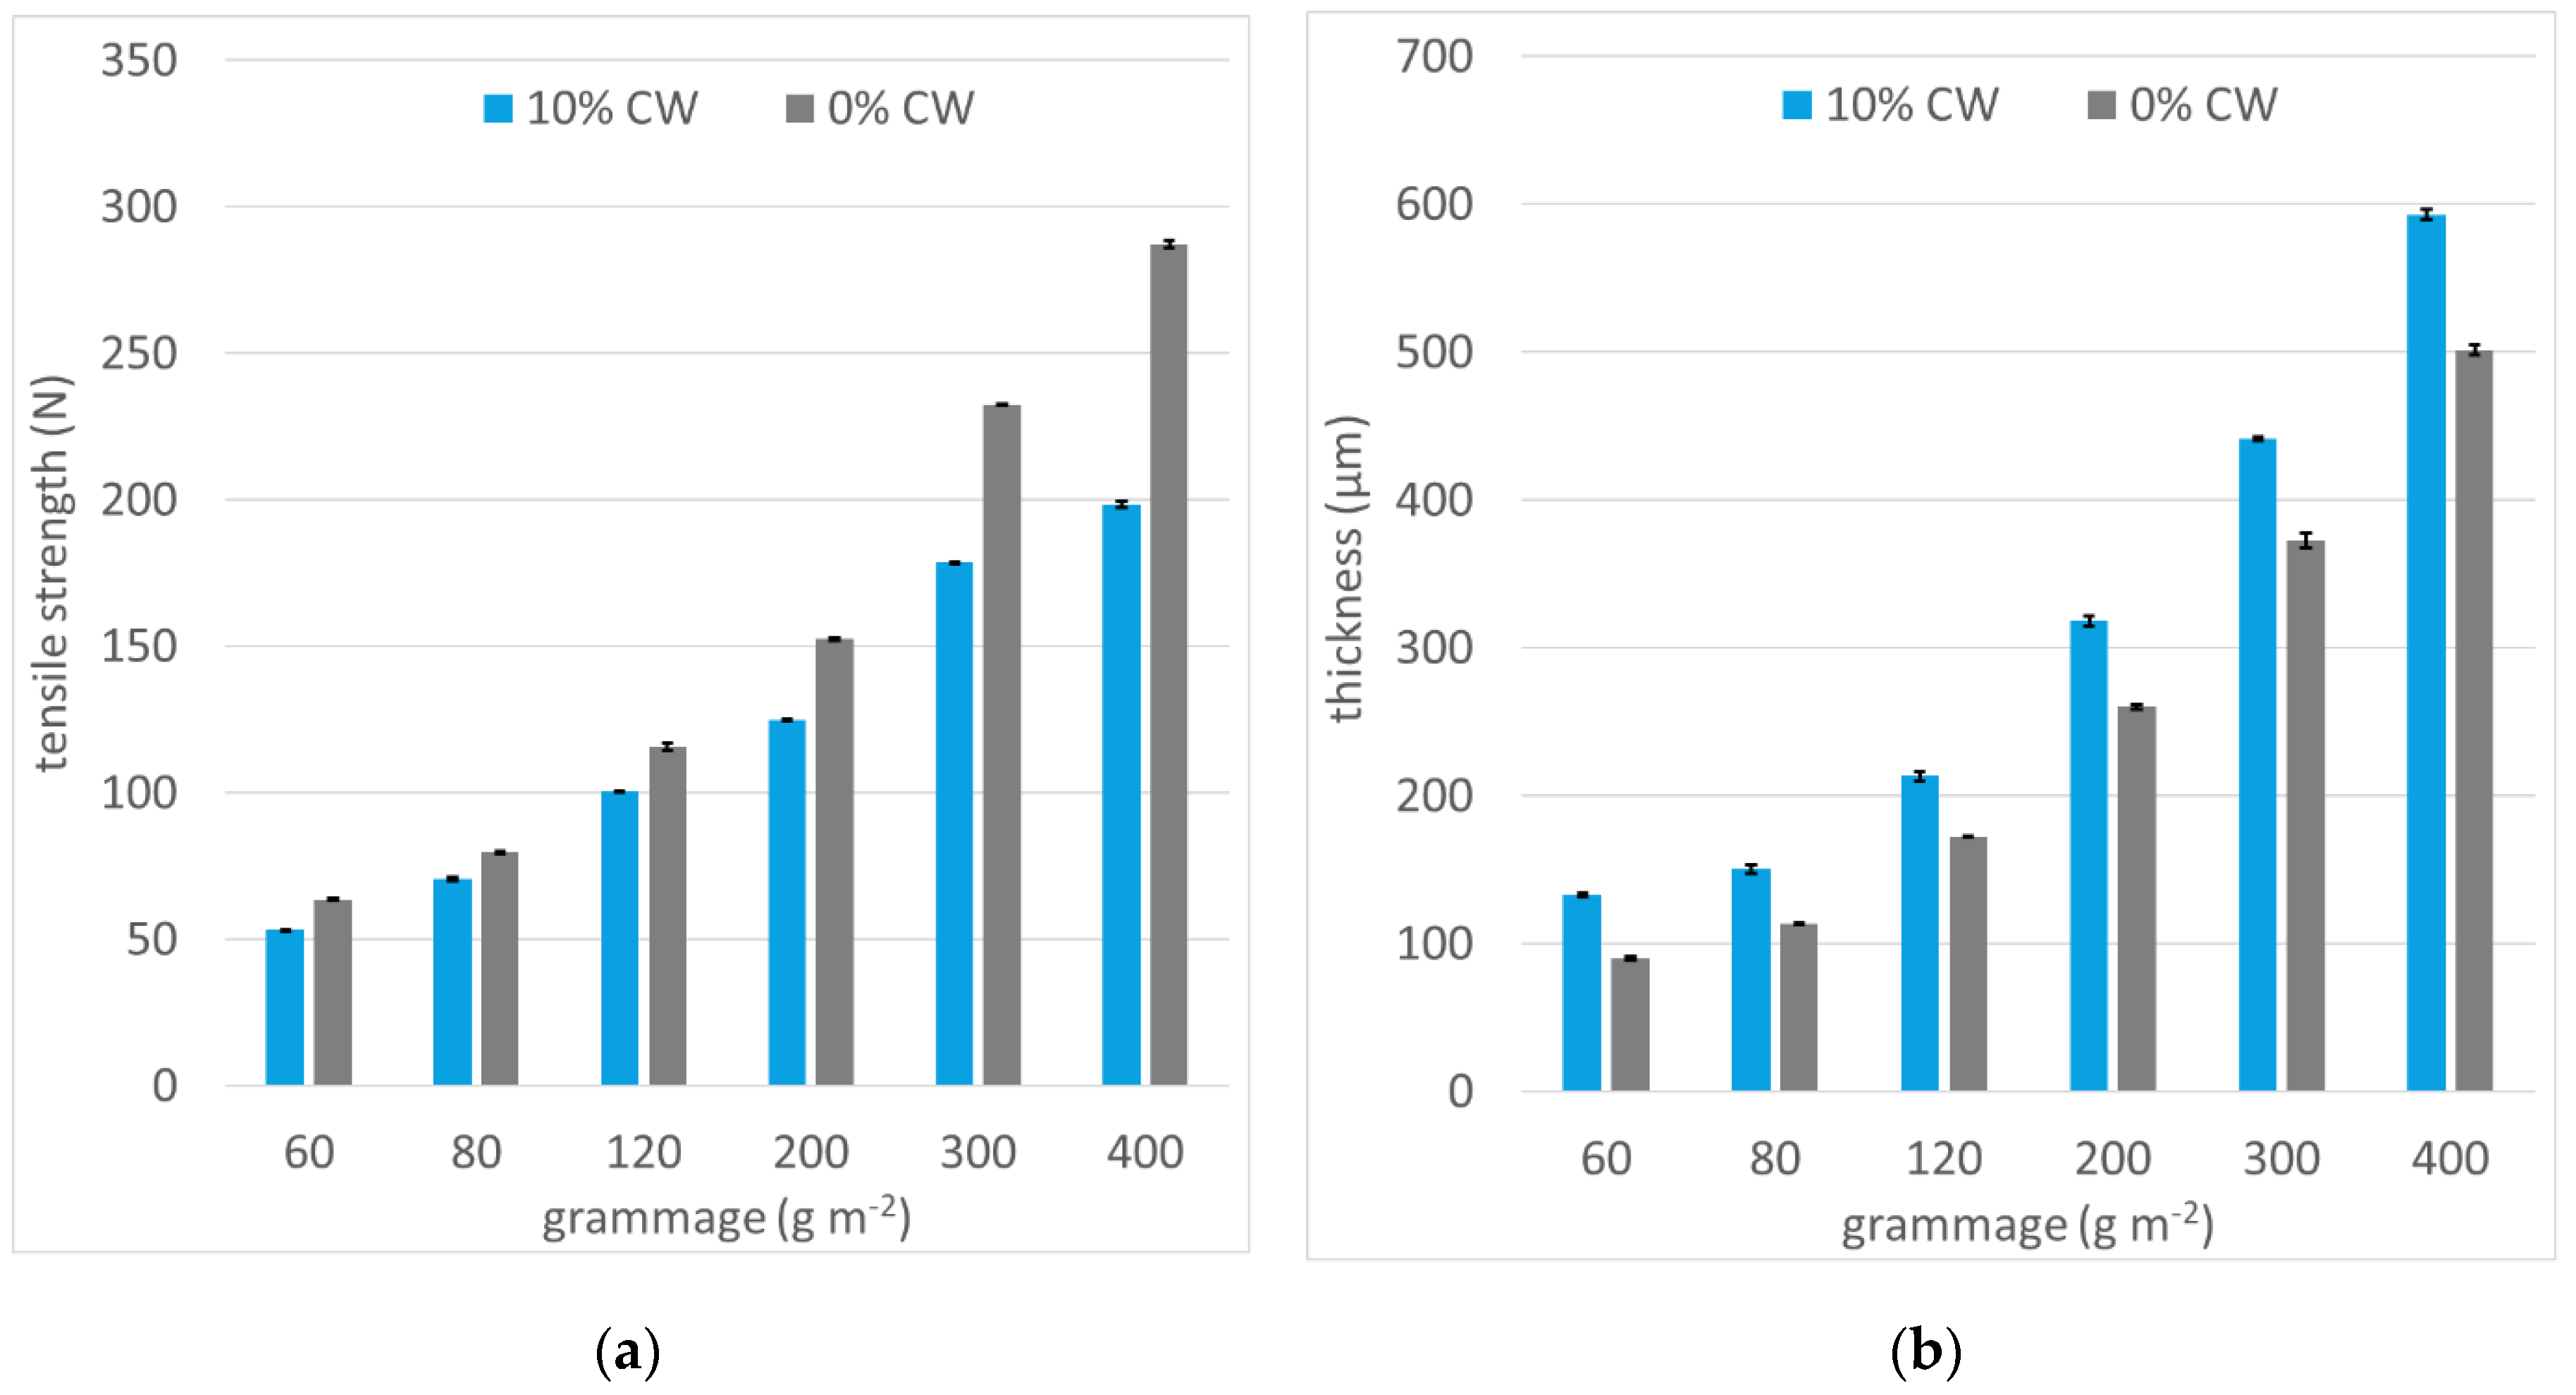
3.2.4. Production of Sustainable Paper Packaging Materials from Extraction Waste Products

To assess the possible application of biomass after extraction for paper production, fresh aerial parts of AN, AP, PA, and PP were roughly chopped, mixed, and extracted with acetone for 7 days based on the method developed in Section 3.2.3. After extraction, the biomass was mixed with pinewood pulp and paper sheets were prepared, resulting in sheets consisting of 10% coniferous wood extraction residuals (10% CW). Additionally, “blank sheets” consisting of 100% pinewood pulp without including any coniferous wood sample biomass were prepared analogically (0% CW).
Both the 10% CW and 0% CW sheets show an elongation at break of approx. 2.4–3.7%. For lower grammages (60–120 g·m−2), both sheet types show a relatively homogeneous elongation of 3.1–3.5% while higher grammage sheets demonstrating a higher scattering with the 10% CW sheets typically showing a lower elongation than the 0% CW sheets. However, these differences appear to be neglectable. The results of the tensile strength and thickness analyses are displayed in Figure 5; the elongation at break is presented in Figure S3.
It can be observed that common cellulose-based 0% CW paper shows a maximum tensile strength of approx. 287 N while the paper prepared with 10% CW shows a decreased maximum tensile strength of approx. 199 N. Generally, 0% CW papers exceed 10% CW papers by approx. 24% on average regarding tensile strength. In contrast to tensile strength, 10% CW papers are considerably thicker than 0% CW papers (approx. 27% on average). Yet, the results of both paper types are comparable as a whole; differences can easily be compensated by choosing another grammage. This application allows a second-grade valorisation of waste materials beyond extraction without major detriments being observed. While the conducted analyses focus on incorporation of 10% residual extraction materials, higher proportions of coniferous woods after extraction could be successfully incorporated as well.

3.3. Characterisation of the Extracts of Different Branch Fractions for Fresh and Dried Masses

In the following, the influence of drying on different branch fractions is evaluated. This is particularly relevant for practical application as the necessity of separating the leaves from the wood for further processing is an important factor for extract preparation. Furthermore, the different fractions are chemically characterised to draw conclusions on the chemical differences of the fractions.
Weight loss correction was not performed during this section as determination of such would have required to interfere with the drying setup by drying leaves and wood separately. Thus, the same mass but a higher amount of biomass is used for extraction of the dried biomass in contrast to the fresh samples without correction. Therefore, the values of the dried biomass extracts in this section are anticipated to be reduced to approx. 52% of the given value (AN: 48%; AP: 50%; PA: 51%; PP: 60%; estimation based on whole branch weight development during the drying process; the actual correction factors regarding specific plant fragments might differ).

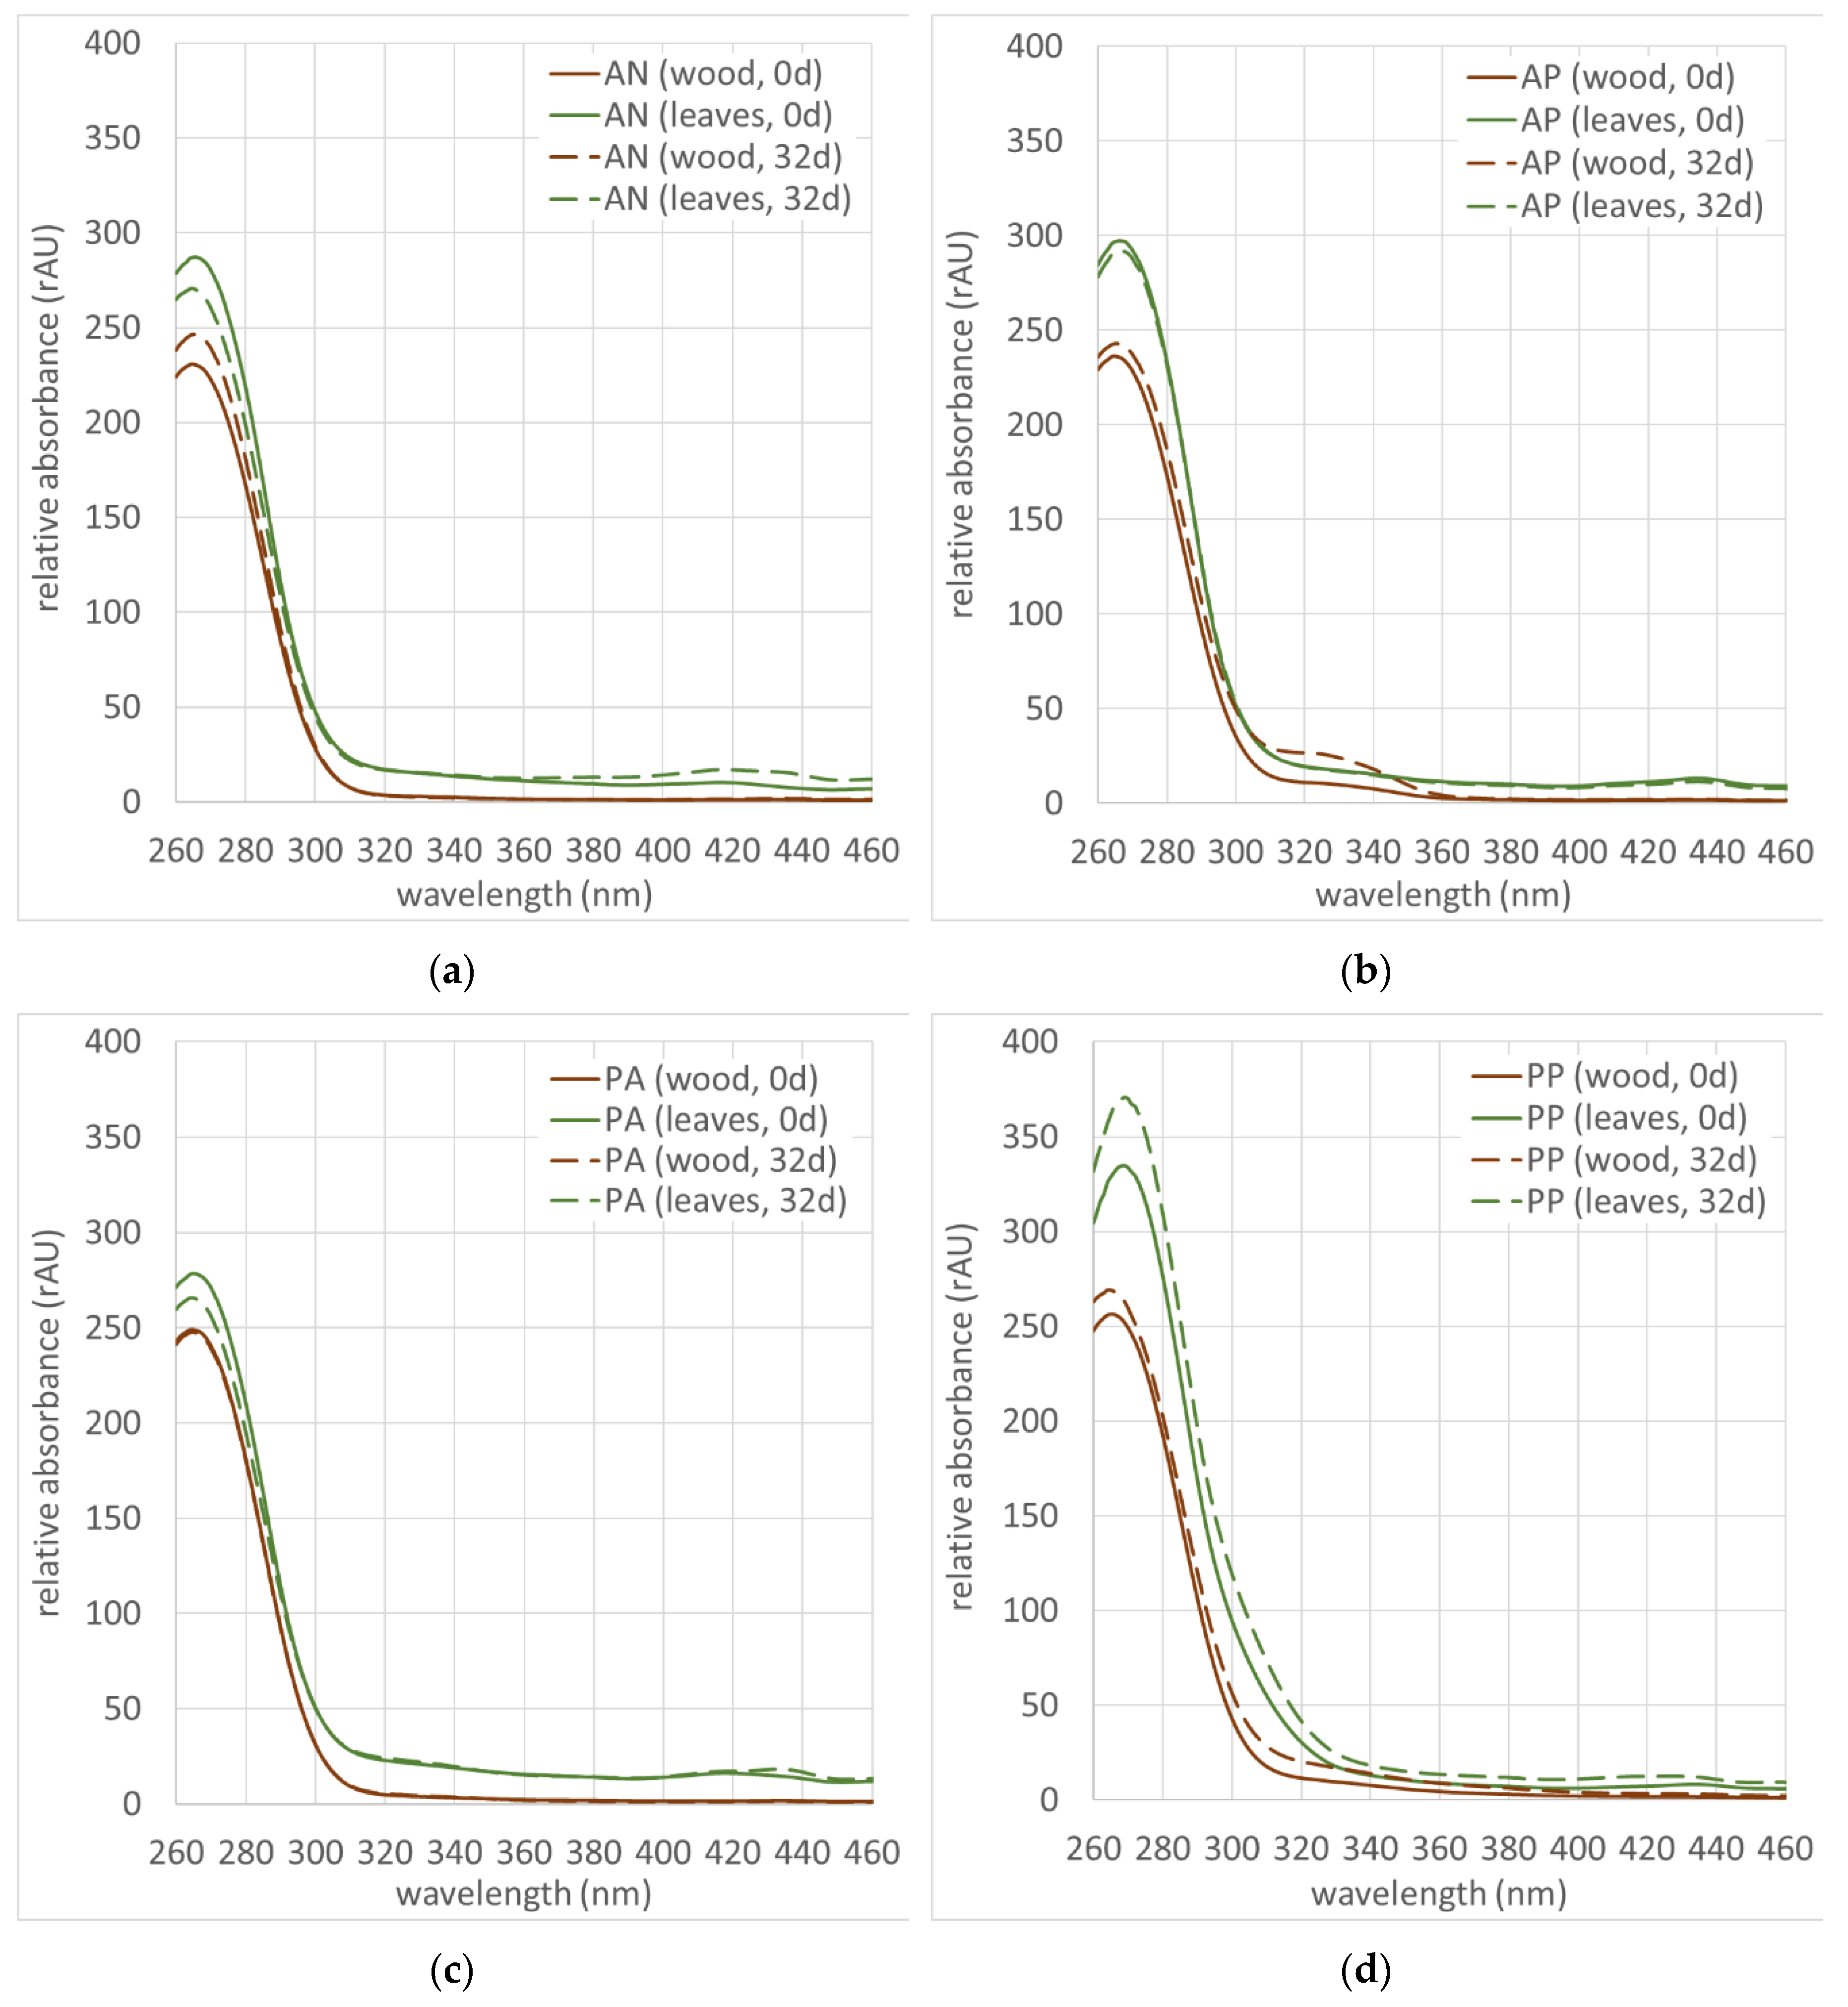
3.3.1. UV/Vis Absorbance
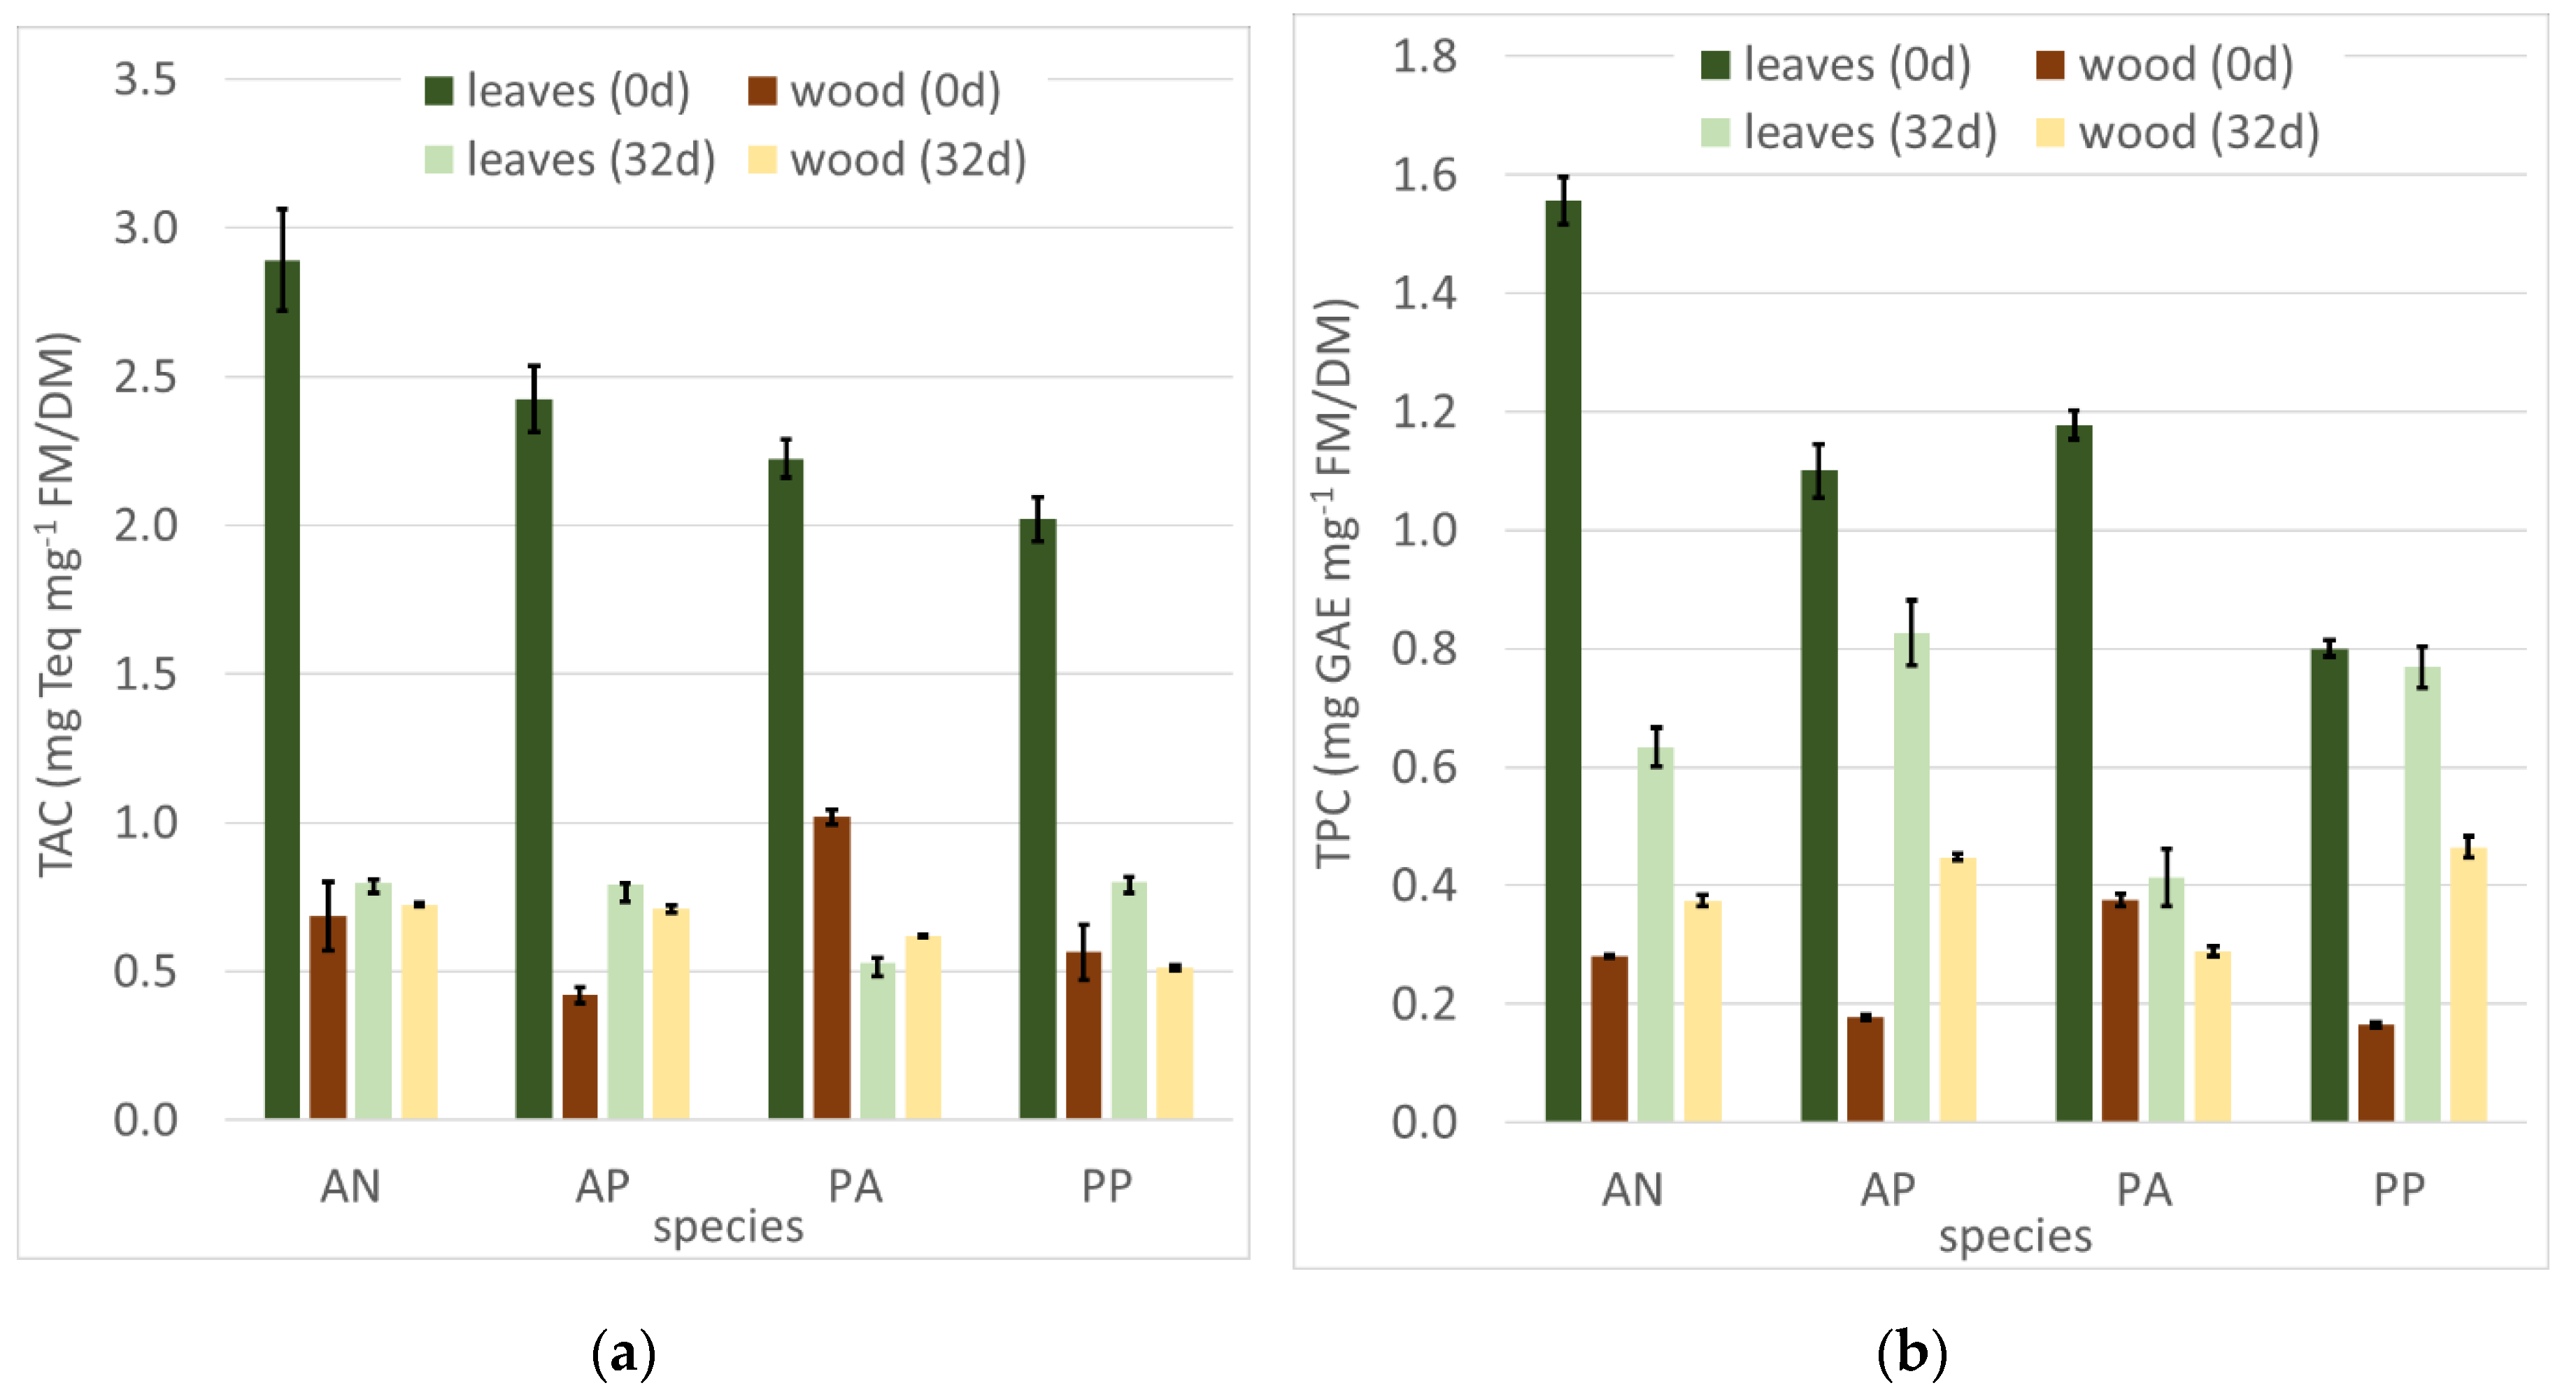
All four species’ fragments and degrees of dryness resulted in comparable UV spectra and show limited absorbance in the visible range, which is thus neglected in further interpretations. As depicted in Figure 6, all extracts show a similar course of UV absorbance also resembling the UV spectra observed for whole branch extracts in Section 3.2.1; however, there are considerable differences in intensities. For all species, a higher absorbance of leaf extracts than of wood extracts can be observed with the intensity scattering around whole branch extracts. This applies to fresh and dried samples. Dried sample extracts seemingly show a UV intensity comparable to fresh biomass extracts without applying a weight loss correction. Thus, a considerable UV absorbance reduction, notably below the UV absorbance values observed for fresh biomass extracts, is anticipated for the dried extracts when performing an appropriate weight correction.
While the AN, AP, and PA spectra are roughly comparable, the PP extracts show the highest absorbance values of all four species, particularly for fresh and dried leaves, thus confirming the high UV absorbances observed before. Due to all extracts showing a similar course of UV absorbance, the presence of the similar UV-active ingredients could be assumed. In comparison to the UV absorbance of the whole branch extracts, the absorbance of the fresh mass extracts of the different fractions scatters around the absorbance of the fresh whole branch extracts for all species. Consistently, the leaf extract is showing a higher absorbance, followed by the whole branch and wood extracts. This applies to dried samples as well when applying correction factors obtained by whole branch drying. Dried sample extracts show a reduced intensity due to loss and degradation of the analyte during drying, as expected. Thus, both fractions seem to be similarly affected by drying with the leaf fraction consistently resulting in a higher UV absorbance than the wood fraction. Following the assumption of the UV absorbance of both fractions being caused by the same ingredient, leaves therefore contain higher amounts of such UV-absorbing compounds.

3.3.2. TAC and TPC

As shown in Figure 7, significant differences, particularly between fresh leaves and other plant fragments, are observed. While extracts prepared from dried wood, fresh wood, or dried leaves show comparably similar TACs of approx. 0.4–1.0 mg·Teq·mg−1 biomass, extracts prepared from fresh leaves result in a significantly higher TAC of approx. 2.0–2.9 mg·Teq·mg−1 biomass. The highest antioxidant potential is reached by fresh AN leaves, followed by the AP, PA, and PP leaves. Leaf extracts are also showing notably higher TPC values than the corresponding wood extracts do; however, the difference between fresh and dried biomasses is less distinct.
The observation of fresh leaves providing the best bioactive characteristics is confirmed by UV absorbance as well as what was discussed before; however, the difference between the leaf and wood extracts are considerably smaller. Again, the dried biomass extracts are not capable of reaching a TAC comparable to the fresh leaf extracts; in case of TAC, this also applies to the fresh wood extracts. The decrease of TAC especially in dried leaf extracts could be caused, e.g., by loss or biochemical degradation of bioactive substances during the comparably long drying period, as it is observed for other plants [32]. For the dried fractions, slightly higher values than expected are observed when comparing the extracts of the fractions or the respective whole aerial part extracts. This effect is presumably caused by the higher relative amount of secondary metabolites after the loss of water during drying.

3.3.3. Further Analyses

For all samples, the presence of proanthocyanidins (PACs) was evaluated based on the specific acid–butanol assay (ABA). As shown in Figure S4, a maximum corrected absorbance of 1.52 is observed for extracts prepared from fresh AN leaves. In general, fresh leaf extracts result in the respective highest absorbance per species, followed by dried leaf extracts for most species excluding PA. Both fresh and dried wood extracts show comparably low absorbances. Excluding particularly low PP fresh and dried wood extracts and AP fresh wood extracts, the obtained absorbances vary between 0.20 and 0.41.
Thus, the presence of PACs is proven at least for the fresh leaves of all four species; the dried AN, AP, and PP leaves are also considered to include a relevant concentration of PACs. Fresh and dried wood as well as PA dried leaves can only be assumed to contain PACs as the observed absorbances are comparably low. It is likely that proof of PACs in the respective fractions could be obtained by preparing extracts with a higher relative sample amount. However, the interpretation of ABA absorbances is limited due to the semi-quantitative characteristics of the assay as absorbance is not only dependent on the concentration of PACs in the sample, but also on the type of PACs contained.
The evaluation of qualitative GC-MS analysis results in several compounds detected for the extracts, including a variety of sugars and other substances (e.g., pinitol, communic acid, and epigallocatechin) of which abietic acid and (+)-catechin have been confirmed by analysing the standard substances in addition to a library comparison (NIST). Abietic acid and dihydroabietic acid are present primarily in fresh and dried leaves and wood of AN and AP, while catechin is present in most biomasses, particularly in leaves. Due to its antioxidant effect [33], the presence of catechin could be part of the reason for the high TAC observed for leaf extracts. A direct correlation of catechin presence and TAC could not be found; however, TAC values could also be linked to oligomeric PACs, which are determined via ABA and, in the simplest case, based on catechin monomers. This is proved by the results of ABA being comparable to the TAC values of the dried and fresh leaves and wood extracts. With some exceptions, extracts with an estimated higher amount of PACs show a higher antioxidant capacity. However, TAC results could also be influenced by further extract constituents that are not detected in GC-MS analysis. The general presence of PACs in coniferous wood is reasonable as they have been confirmed in other wood/wood fractions before, including birchbark and AEH seed coats [7,34]. The similar course of the UV spectra of the extracts based on AEH seed coats and coniferous woods further supports these findings. PACs, as active compounds in plant extracts, are particularly advantageous for the application of extracts as additives in food packaging as they typically are macromolecular compounds and thus less prone to migration. Additionally, they are considered safe for the application in foods by the European Food Safety Authority (EFSA) [35].

4. Conclusions

For all the analysed coniferous wood, a general suitability for use as biobased stabilisers is proven as the basic parameters of antioxidant capacity and UV absorbance are satisfactory. As there are differences between the species, separation is recommended, but not mandatory as the species constantly show comparable results. Coniferous woods are a relevant bioresource particularly due to their wide availability, e.g., as used Christmas trees. Highly bioactive extracts can be prepared at least from biomass that has been used as indoor Christmas trees for 12 days; however, as this study applied particularly hard conditions by using un-watered branches to provide a minimum acceptable duration of use, this period might be expendable. Depending on the specific application, the extractant acetone could be substituted by a mixture of water and acetone (1:1 (v/v)), resulting in comparable antioxidant properties while using more eco-friendly solvents. To exploit the potential of the extracts prepared from such biomasses, further extraction optimisation should be conducted, as described. Additionally, full valorisation of Christmas trees is achieved by incorporating chopped biomass after extraction into paper packaging material, as shown in this pilot trial. Thus, the whole Christmas tree can be utilised to create more sustainable packaging materials by substituting specifically synthesised additives or trees planted for paper production, contributing to the transformation to a circular economy. Upcoming research will include application and migration studies.

Supplementary Materials

The following are available online at https://0-www-mdpi-com.brum.beds.ac.uk/2227-9717/8/11/1366/s1, Figure S1: Total antioxidant capacity (TAC) of aerial part extracts of different coniferous woods using different extractants. Single determination (pretest). Teq: Trolox equivalents, FM: fresh mass, AN: Abies nordmanniana, AP: Abies procera, PA: Picea abies, PP: Picea pungens. Extractants: A: Acetone, W: Water, M: Methanol, mixtures: 1:1 (v/v). Figure S2: Average total antioxidant capacity (TAC) of aerial part extracts (passive extraction) of different coniferous woods in different drying conditions. Results are corrected by weight loss. Measurements in quadruplicate, standard deviations indicated by error bars. Teq: Trolox equivalents, AN: Abies nordmanniana, AP: Abies procera, PA: Picea abies, PP: Picea pungens. (a): fresh biomass; (b): dried biomass (dried at room temperature for 12 days). Figure S3: Average elongation at break of paper sheets with different grammages and compositions. Three repetitions, four measurements per repetition. Standard deviation of mean values per repetition indicated by error bars. CW: share of coniferous wood biomass after passive extraction included in paper sheet. Figure S4: Corrected absorbance of different coniferous wood samples (different species, plant fractions, drying conditions) after conduction of acid-butanol assay. Single determination. 0d: fresh mass, dried for 0 days, 32d: dried mass, dried for 32 days at room temperature, AN: Abies nordmanniana, AP: Abies procera, PA: Picea abies, PP: Picea pungens.

Author Contributions

Conceptualisation, T.H., J.N.F. and M.S.; formal analysis, T.H. and J.N.F.; funding acquisition, R.P. and M.S.; investigation, T.H. and J.N.F.; methodology, T.H., J.N.F., R.P. and M.S.; project administration, R.P. and M.S.; resources, R.P. and M.S.; supervision, R.P. and M.S.; visualisation, T.H.; writing—original draft, T.H.; writing—review and editing, J.N.F. and M.S. All authors have read and agreed to the published version of the manuscript.

Funding

This research was funded by the European Union via the European Regional Development Fund EFRE.NRW, grant number EFRE 0500035.

Acknowledgments

The authors wish to thank Hof Große Wöstmann, Rinkerode, Germany for kindly providing sample materials. This research project was supported by Bonn-Rhein-Sieg University of Applied Sciences, Department of Natural Sciences, the Graduate Institute of Bonn-Rhein-Sieg University and the Institute of Technology, Resource and Energy-efficient Engineering (TREE) of Bonn-Rhein-Sieg University.

Conflicts of Interest

The authors declare no conflict of interest. The funders had no role in the design of the study; in the collection, analyses, or interpretation of data; in the writing of the manuscript, or in the decision to publish the results.

References

  1. Wegmann, A.; Le Gal, A.; Müller, D. Antioxidantien. In Handbuch Kunststoff-Additive, 4., Vollständig Neu Bearbeitete Auflage; Maier, R.-D., Schiller, M., Eds.; Hanser: München, Germany, 2016; ISBN 978-3-446-22352-3. [Google Scholar]
  2. Ito, N.; Fukushima, S.; Tsuda, H. Carcinogenicity and modification of the carcinogenic response by BHA, BHT, and other antioxidants. Crit. Rev. Toxicol. 1985, 15, 109–150. [Google Scholar] [CrossRef] [PubMed]
  3. Kahl, R.; Kappus, H. Toxikologie der synthetischen Antioxidantien BHA und BHT im Vergleich mit dem natürlichen Antioxidans Vitamin E. Z. Lebensm. Unters. For. 1993, 196, 329–338. [Google Scholar] [CrossRef] [PubMed]
  4. Peltzer, M.A.; Wagner, J.; Jiménez, A. Migration study of carvacrol as natural antioxidant in High Density Polyethylene for active packaging. Food Addit. Contam. 2009, 26, 938–946. [Google Scholar] [CrossRef] [PubMed]
  5. Detzel, A.; Kauertz, B.; Derreza-Greeven, C.; Reinhardt, J.; Kunze, S.; Krüger, M.; Fehrenbach, H.; Volz, S. Endbericht Untersuchung der Umweltwirkungen von Verpackungen aus Biologisch Abbaubaren Kunststoffen. 2012. Available online: http://www.uba.de/uba-info-medien/3986.html (accessed on 15 April 2020).
  6. Havelt, T.; Schmitz, M. Identifizierung und Charakterisierung bioaktiver Inhaltsstoffe in Thymian: 8. Tagung Arznei- und Gewürzpflanzenforschung, Bonn. Julius-Kühn-Archiv 2018, 112–114. [Google Scholar] [CrossRef]
  7. Havelt, T.; Brettschneider, S.; Do, X.T.; Korte, I.; Kreyenschmidt, J.; Schmitz, M. Sustainable Extraction and Characterisation of Bioactive Compounds from Horse Chestnut Seed Coats for the Development of Bio-Based Additives. Resources 2019, 8, 114. [Google Scholar] [CrossRef] [Green Version]
  8. Schutzgemeinschaft Deutscher Wald. Weihnachtsbaum in Zahlen und Fakten: Daten zum Weihnachtsbaum 2020. Available online: https://www.sdw.de/waldwissen/weihnachtsbaum/ (accessed on 22 January 2020).
  9. Geismann, U.; Tews, F.; Hauptverband der Deutschen Holzindustrie e.V. Deutsche kaufen in diesem Jahr 29,8 Millionen Weihnachtsbäume. Weihnachtsbaum 2019: Stabile Stückzahlen, Stabile Preise. 2019. Available online: https://www.holzindustrie.de/pressemitteilungen/2926/deutsche-kaufen-in-diesem-jahr-29-8-millionen-weihnachtsbaeume.html (accessed on 21 January 2020).
  10. Knebel, A.; Agentur für Erneuerbare Energien. Weihnachtsbäume Liefern Grüne Energie. 2015. Available online: https://www.unendlich-viel-energie.de/presse/pressemitteilungen/weihnachtsbaeume-liefern-gruene-energie (accessed on 20 January 2020).
  11. Bağcı, E.; Dığrak, M. Antimicrobial Activity of Essential Oils of some Abies (Fir) Species from Turkey. Flavour Frag. J. 1996, 11, 251–256. [Google Scholar] [CrossRef]
  12. Öncel, I.; Yurdakulol, E.; Keleş, Y.; Kurt, L.; Yıldız, A. Role of antioxidant defense system and biochemical adaptation on stress tolerance of high mountain and steppe plants. Acta Oecol. 2004, 26, 211–218. [Google Scholar] [CrossRef]
  13. Weber, P.; Bendich, A.; Schalch, W. Vitamin C and human health--a review of recent data relevant to human requirements. Int. J. Vitam. Nutr. Res. 1996, 66, 19–30. [Google Scholar]
  14. Charles, D.J. Natural Antioxidants. In Antioxidant Properties of Spices, Herbs and Other Sources; Charles, D.J., Ed.; Springer: New York, NY, USA, 2013; pp. 39–64. ISBN 978-1-4614-4309-4. [Google Scholar]
  15. Elmezughi, J.; Shittu, H.; Clements, C.; Edrada-Ebel, R.A.; Seidel, V.; Gray, A. Bioactive natural compounds from Prosopis africana and Abies nobili. J. App. Pharm. Sci. 2013. [Google Scholar] [CrossRef] [Green Version]
  16. Rauha, J.-P.; Remes, S.; Heinonen, M.; Hopia, A.; Kähkönen, M.; Kujala, T.; Pihlaja, K.; Vuorela, H.; Vuorela, P. Antimicrobial effects of Finnish plant extracts containing flavonoids and other phenolic compounds. Int. J. Food Microbiol. 2000, 56, 3–12. [Google Scholar] [CrossRef]
  17. Kartnig, T.; Still, F.; Reinthaler, F. Antimicrobial activity of the essential oil of young pine shoots (Picea abies L.). J. Ethnopharmacol. 1991, 35, 155–157. [Google Scholar] [CrossRef]
  18. Hafizoglu, H.; Holmbom, B. Chemical composition of extractives from Abies nordmanniana. Holz Roh. Werkst. 1995, 53, 273–275. [Google Scholar] [CrossRef]
  19. Polle, A.; Chakrabarti, K.; Schürmann, W.; Rennenberg, H. Composition and Properties of Hydrogen Peroxide Decomposing Systems in Extracellular and Total Extracts from Needles of Norway Spruce (Picea abies L., Karst.). Plant Physiol. 1990, 94, 312–319. [Google Scholar] [CrossRef] [PubMed] [Green Version]
  20. Co, M.; Fagerlund, A.; Engman, L.; Sunnerheim, K.; Sjöberg, P.J.R.; Turner, C. Extraction of antioxidants from spruce (Picea abies) bark using eco-friendly solvents. Phytochem. Analysis 2012, 23, 1–11. [Google Scholar] [CrossRef]
  21. Erel, O. A novel automated direct measurement method for total antioxidant capacity using a new generation, more stable ABTS radical cation. Clin. Biochem. 2004, 37, 277–285. [Google Scholar] [CrossRef]
  22. Singleton, V.; Orthofer, R.; Lamuela-Raventós, R. Analysis of Total Phenols and Other Oxidation Substrates and Antioxidants by Means of Folin-Ciocalteu Reagent. Method. Enzymol. 1999, 299, 152–178. [Google Scholar]
  23. Matthes, A.; Schmitz-Eiberger, M. Polyphenol content and antioxidant capacity of apple fruit: Effect of cultivar and storage conditions. J. Appl. Bot. Food Qual. 2009, 82, 152–157. [Google Scholar]
  24. Hagerman, A.E. Tannin Chemistry. Available online: https://www.users.miamioh.edu/hagermae/ (accessed on 5 February 2018).
  25. DIN EN ISO 5267-1:2000. Pulps-Determination of Drainability-Part 1: Schopper-Riegler Method. Available online: https://standards.iteh.ai/catalog/standards/cen/c1a20a22-23c1-4c6f-b6bb-2441df91b1c5/en-iso-5267-1-2000 (accessed on 1 October 2020).
  26. DIN EN ISO 5269-2:2004. Pulps-Preparation of Laboratory Sheets for Physical Testing-Part 2: Rapid-Köthen Method. Available online: https://www.iso.org/obp/ui/#iso:std:iso:5269:-2:ed-3:v1:en (accessed on 1 October 2020).
  27. ISO 1924-2:2008. Paper and Board-Determination of Tensile Propertie-Part 2: Constant rate of Elongation Method (20 mm/min). Available online: https://www.iso.org/obp/ui/#iso:std:iso:1924:-2:ed-3:v1:en (accessed on 1 October 2020).
  28. Sharma, P.; Dubey, R.S. Drought Induces Oxidative Stress and Enhances the Activities of Antioxidant Enzymes in Growing Rice Seedlings. Plant Growth Regul. 2005, 46, 209–221. [Google Scholar] [CrossRef]
  29. Ramachandra Reddy, A.; Chaitanya, K.V.; Vivekanandan, M. Drought-induced responses of photosynthesis and antioxidant metabolism in higher plants. J. Plant Physiol. 2004, 161, 1189–1202. [Google Scholar] [CrossRef]
  30. Regier, M.; Mayer-Miebach, E.; Behsnilian, D.; Neff, E.; Schuchmann, H.P. Influences of Drying and Storage of Lycopene-Rich Carrots on the Carotenoid Content. Dry. Technol. 2005, 23, 989–998. [Google Scholar] [CrossRef]
  31. Valadez-Carmona, L.; Plazola-Jacinto, C.P.; Hernández-Ortega, M.; Hernández-Navarro, M.D.; Villarreal, F.; Necoechea-Mondragón, H.; Ortiz-Moreno, A.; Ceballos-Reyes, G. Effects of microwaves, hot air and freeze-drying on the phenolic compounds, antioxidant capacity, enzyme activity and microstructure of cacao pod husks (Theobroma cacao L.). Innov. Food Sci. Emerg. 2017, 41, 378–386. [Google Scholar] [CrossRef]
  32. Lewicki, P.P. Effect of pre-drying treatment, drying and rehydration on plant tissue properties: A review. Int. J. Food Prop. 1998, 1, 1–22. [Google Scholar] [CrossRef]
  33. Grzesik, M.; Naparło, K.; Bartosz, G.; Sadowska-Bartosz, I. Antioxidant properties of catechins: Comparison with other antioxidants. Food Chem. 2018, 241, 480–492. [Google Scholar] [CrossRef] [PubMed]
  34. Karonen, M.; Leikas, A.; Loponen, J.; Sinkkonen, J.; Ossipov, V.; Pihlaja, K. Reversed-phase HPLC-ESI/MS analysis of birch leaf proanthocyanidins after their acidic degradation in the presence of nucleophiles. Phytochem. Analysis 2007, 18, 378–386. [Google Scholar] [CrossRef]
  35. Turck, D.; Bresson, J.-L.; Burlingame, B.; Dean, T.; Fairweather-Tait, S.; Heinonen, M.; Hirsch-Ernst, K.; Mangelsdorf, I.; McArdle, H.J.; Naska, A.; et al. Safety of cranberry extract powder as a novel food ingredient pursuant to Regulation (EC) No 258/97. EFSA J. 2017, 15, e04777. [Google Scholar] [CrossRef] [Green Version]
Figure 1. Average UV/Vis absorbance of the aerial part extracts of different coniferous woods displayed on the primary ordinate in relative absorbance units (rAU). Extractions in triplicate; measurements in duplicate. Statistical evaluation of the extracts is based on comparison of the absorbance in the respective maximum according to the Games–Howell test (α ≤ 0.05); significant difference proven for all extract pairs except for AP/PA and AP/PP. Secondary ordinate (black): average UV/Vis absorbance of the BHT and BHA solutions (1.0 g·L−1 in methanol, measurement in triplicate). AN: Abies nordmanniana; AP: Abies procera; PA: Picea abies; PP: Picea pungens; BHT: butylated hydroxytoluene; BHA: butylated hydroxyanisole. BHT/BHA data reproduced from [7].
Processes 08 01366 g001
Figure 2. (a) Average total antioxidant capacity (TAC) of the synthetic antioxidants BHT and BHA and aerial part extracts of different coniferous woods. Primary ordinate: Extracts, given in colour; extractions in triplicate; measurements in duplicate; secondary ordinate: BHT/BHA 1.0 g·L−1 methanol solutions, given in grey, six measurements; data reproduced from [7]. Standard deviation indicated by error bars. Statistical evaluation of the extracts according to the Games–Howell test (α ≤ 0.05); significant difference proven for extract pairs AN/PP, AP/PP, and PA/PP. Teq: Trolox equivalents; FM: fresh mass; AN: Abies nordmanniana; AP: Abies procera; PA: Picea abies; PP: Picea pungens; BHT: butylated hydroxytoluene; BHA: butylated hydroxyanisole. (b) Average total phenolic content (TPC) of the aerial part extracts of different coniferous woods. Extractions in triplicate; measurements in duplicate; standard deviation indicated by error bars. Statistical evaluation of the extracts according to the Games–Howell test (α ≤ 0.05); significant difference proven for extract pairs AN/PP and AP/PP. GAE: gallic acid equivalents; FM: fresh mass; AN: Abies nordmanniana; AP: Abies procera; PA: Picea abies; PP: Picea pungens.
Processes 08 01366 g002
Figure 3. Average UV/Vis absorbance of the aerial part extracts of different coniferous woods displayed in relative absorbance units (rAU) after drying for different periods, given in days (d). Results are corrected by weight loss. Extractions in triplicate; measurements in duplicate. Statistical evaluation of the extracts based on comparison of absorbance in the respective maximum according to the Games–Howell test (α ≤ 0.05). (a): Abies nordmanniana (AN); significant difference proven for all data pairs except for 18 d/25 d and 25 d/32 d. (b): Abies procera (AP); significant difference proven for all data pairs except for 12 d/25 d and 25 d/32 d. (c): Picea abies (PA); significant difference proven for all data pairs except for 0 d/18 d, 12 d/18 d, 18 d/25 d, 18 d/32 d, and 25 d/32 d. (d): Picea pungens (PP); significant difference proven for data pairs 0 d/25 d, 0 d/32 d, and 25 d/32 d.
Processes 08 01366 g003
Figure 4. (a) Average total antioxidant capacity (TAC) of the aerial part extracts of different coniferous woods after drying for different periods, given in days (d). Results are corrected by weight loss. Extractions in triplicate; measurements in duplicate. Standard deviation indicated by error bars. AN (18 d) covered by AP (18 d). Teq: Trolox equivalents; AN: Abies nordmanniana; AP: Abies procera; PA: Picea abies; PP: Picea pungens. (b) Average total phenolic content (TPC) of the aerial part extracts of different coniferous woods after drying for different periods, given in days (d). Results are corrected by weight loss. Extractions in triplicate; measurements in duplicate. Standard deviation indicated by error bars. AP (12 d) covered by PP (12 d). GAE: gallic acid equivalents; AN: Abies nordmanniana; AP: Abies procera; PA: Picea abies; PP: Picea pungens.
Processes 08 01366 g004
Figure 5. (a) Average tensile strength of the paper sheets with different grammages and compositions. Three repetitions, with four measurements per repetition. Standard deviation of the mean values per repetition indicated by error bars. CW: share of coniferous wood biomass after passive extraction included in the paper sheet. (b) Average thickness of the paper sheets with different grammages and compositions. Three repetitions, with ten measurements per repetition. Standard deviation of the mean values per repetition indicated by error bars. CW: share of coniferous wood biomass after passive extraction included in the paper sheet.
Processes 08 01366 g005
Figure 6. Average UV/Vis absorbance of the wood or leaf extracts of the different coniferous woods displayed in relative absorbance units (rAU) after drying for different periods, given in days (d); wavelengths above 460 nm are not shown. Measurements in quadruplicate. (a): Abies nordmanniana (AN); (b): Abies procera (AP); (c): Picea abies (PA); (d): Picea pungens (PP).
Processes 08 01366 g006
Figure 7. (a) Average total antioxidant capacity (TAC) of the leaf or wood extracts of the different coniferous woods based on fresh or dried mass. Measurements in quadruplicate; standard deviation indicated by error bars. Teq: Trolox equivalents; FM/0d: fresh mass; DM/32d: dried mass after drying for 32 days at 21 °C; AN: Abies nordmanniana; AP: Abies procera; PA: Picea abies; PP: Picea pungens. (b) Average total phenolic content (TPC) of the leaf or wood extracts of different coniferous woods based on fresh or dried mass. Measurements in quadruplicate; standard deviation indicated by error bars. GAE: gallic acid equivalents; FM/0d: fresh mass; DM/32d: dried mass after drying for 32 days at 21 °C; AN: Abies nordmanniana; AP: Abies procera; PA: Picea abies; PP: Picea pungens.
Processes 08 01366 g007
Publisher’s Note: MDPI stays neutral with regard to jurisdictional claims in published maps and institutional affiliations.

