Article

Denoising of Hydrogen Evolution Acoustic Emission Signal Based on Non-Decimated Stationary Wavelet Transform

by
Zazilah May
1,2,
Md Khorshed Alam
1,*,
Noor A’in A. Rahman
1,
Muhammad Shazwan Mahmud
3 and
Nazrul Anuar Nayan
2,*
1
Electrical and Electronic Engineering Department, Universiti Teknologi PETRONAS, Seri Iskandar 32610, Perak Darul Ridzuan, Malaysia
2
Electrical Electronics and Systems Department, Faculty of Engineering and Built Environment, Universiti Kebangsaan Malaysia, Bangi 43600, Selangor, Malaysia
3
Mechanical Engineering Department, Universiti Teknologi PETRONAS, Seri Iskandar 32610, Perak Darul Ridzuan, Malaysia
*
Authors to whom correspondence should be addressed.
Submission received: 21 October 2020 / Revised: 4 November 2020 / Accepted: 6 November 2020 / Published: 15 November 2020

Abstract

:
Monitoring the evolution of hydrogen gas on carbon steel pipe using acoustic emission (AE) signal can be a part of a reliable technique in the modern structural health-monitoring (SHM) field. However, the extracted AE signal is always mixed up with random extraneous noise depending on the nature of the service structure and experimental environment. The noisy AE signals often mislead the obtaining of the desired features from the signals for SHM and degrade the performance of the monitoring system. Therefore, there is a need for the signal denoising method to improve the quality of the extracted AE signals without degrading the original properties of the signals before using them for any knowledge discovery. This article proposes a non-decimated stationary wavelet transform (ND-SWT) method based on the variable soft threshold function for denoising hydrogen evolution AE signals. The proposed method filters various types of noises from the acquired AE signal and removes them efficiently without degrading the original properties. The hydrogen evolution experiments on carbon steel pipelines are carried out for AE data acquisition. Simulations on experimentally acquired AE signals and randomly generated synthetic signals with different levels of noise are performed by the ND-SWT method for noise removal. Results show that our proposed method can effectively eliminate Gaussian white noise as well as noise from the vibration and frictional activity and provide efficient noise removal solutions for SHM applications with minimum reconstruction error, to extract meaningful AE signals from the large-scale noisy AE signals during monitoring and inspection.

1. Introduction

Acoustic emission (AE) signal is a phenomenon of transient elastic waves caused by a change in external conditions (stress, temperature, etc.) on the part of a structure [1]. The technique of acquiring and analyzing AE signals to determine the level of internal and external damages in a composite structure is called AE sensor detection technology, which is currently applied for monitoring mechanical and aerospace engineering structure [2,3]. The AE signals are the elastic waves released by energy within a composite material, which can assess the physical phenomena essence of hydrogen-related damage generation (stress corrosion cracking (SCC), hydrogen embrittlement (HE) and hydrogen-induced cracking (HIC)), especially to the metallic structure. Severe hydrogen evolution and absorption may lead to the failure of the structure itself [4,5,6,7]. Since the AE signals are released by many other sources such as vibration, friction and temperature, the actual collected hydrogen evolution AE signals have overlapping frequency bands and weak features under a complex noise background [8]. To provide online detection of hydrogen-related damages, it is essential to extract the AE signal of a corrosion cracking source under a complicated noise background. Thus, the denoising of AE signals during the hydrogen evolution process on the welded structure is the key to acquiring the AE detection of hydrogen evolution-related corrosion cracking.
Several noise-reduction techniques have been explored and used outside the data acquisition system as preprocessing tools in the literature [2,9,10,11]. Fast Fourier Transform (FFT) is one of the most common conventional noise-reduction methods which is usually employed in much commercial AE data acquisition equipment. The FFT represents the AE signals into the time-frequency domain to extract the frequency components and discriminate the unnecessary signals. Though FFT is very effective for noise reduction, it has a low signal resolution, and cannot perform the time domain and frequency domain analysis simultaneously [9]. It is also less suitable for non-stationary and transient signals [9]. On the other hand, wavelet transform (WT) is a linear transformation of a signal in which the fundamental functions are shifted and changed based on the scaling function of a “mother wavelet” [12]. Khamedi et al. in [10] introduced a denoising method named wavelet packet transform (WPT) to eliminate the noise of the AE signals that originated from the fracture events on composite materials. The WPT is an extended model of the conventional wavelet transform, which provides a complete level-to-level resolution for the AE signal. A significant amount of noise reduction of non-stationary signals was achieved using multi-resolution characteristics [2]. Another approach for noise reduction of the AE signal is the Empirical Mode Decomposition (EMD), which decomposes the AE signal into multiple components based on the frequency-amplitude of the signal. By selecting the important components, an amount of noise reduction was performed. However, it does not interpret stationary signals, which often lead to false signals and redundant signals [11]. The work in [2] has been combined with EMD and WPT to denoise the AE signal by enhancing the aliasing mode occurrence. The AE signal for each application is unique and subjective to their nature, including random noise involved. The AE events are a more acoustical active mechanism of hydrogen evolution monitoring because of bubble friction noise along the structure [13]. Various types of noise, including mechanical, external environmental, friction, and Gaussian white noise are usually induced to the AE signals during acquisition. These may hinder discovery of the information from the signals. Thus, the noises should be removed before performing the information-discovery technique.
Several studies have attempted to use the clustering technique as a tool to remove the noise of the hydrogen evolution AE signals [14]. The method managed to classify more than 60% of detected signals as noise with a classification of accuracy around 65%. However, the proposed technique is not considered to be universal for all types of AE data. Another study has also been identified as the useful information of the AE signal from the evolution of gaseous hydrogen events by using statistical procedures [15]. Since an AE signal is a non-linear and non-stationary signal, the conventional noise-reduction methods are based on linear and stationary assumptions which are unable to fully extract the necessary information. The conventional wavelet decomposition can denoise non-stationary signals with multi-resolution characteristics. However, it aims at only a low-frequency signal part which is unable to satisfy both the low- and high-frequency resolutions. The actual hydrogen evolution AE signal under complex background noise has an overlapping high-frequency band and different characteristics of information. Thus, there is a necessity to incorporate a new multi-resolution denoising method to effectively extract the hydrogen evolution AE signals from the complex noise background. In this paper, we propose a non-decimated stationary wavelet transform (ND-SWT) method based on the variable soft threshold function for denoising hydrogen evolution AE signals. The proposed method will concentrate on both low- and high-frequency resolutions and use to suppress the various types of noises from the acquired AE signal efficiently without degrading the original properties.

2. Background Concepts of the Denoising Methods

The fundamentals of the denoising methods that have been adopted in this research are discussed as follows:

2.1. Empirical Mode Decomposition (EMD)

The Empirical Mode Decomposition (EMD) was introduced by Huang et al. [16]. EMD is an adaptive time-frequency decomposition technique using the Hilbert–Huang Transform (HHT) for non-linear and non-stationary time-series data. The main principle of using EMD is to decompose a given time-series signal x ( t ) into a sum of oscillatory functions, called intrinsic mode function (IMF). The IMF can be obtained by using the sifting process. In the EMD, an IMF should satisfy the following two conditions: (i) the difference between the extrema which is the sum of maxima and minima, and the number of zero crossings must be 1; and (ii) the local average or mean from the maxima and minima should be 0. According to the time scale characteristics, the signal is decomposed into several IMFs. The given original signal x ( t ) is decomposed by EMD [2] as in Equation (1):
x t = i = 1 n I M F i t + r n t ,
where I M F i ( t ) represents the series of IMF components and r n ( t ) refers to the residual component. The first IMF retains the high-frequency impact, and it decreases accordingly for the rest of the IMFs until the signal is not smooth. Selecting the good IMFs with high-frequency and residual components, the signal can be reconstructed, which refers to a denoised signal.

2.2. Wavelet Transform (WT)

The wavelet transform (WT) plays a significant role for various SHM applications in the preprocessing of stationary and non-stationary signals. The preprocessing of the signals includes the removal of noises from the signals, detection of abrupt discontinuities, and compression of large amounts of data. This research emphasizes the wavelet denoising method which provides a significant outcome for noise removal for a broad class of signals of varying degrees of smoothness [17] encountered in a diversity of applications. Wavelet denoising method is of a disarming simplicity, yet it achieves many objectives simultaneously, such as removing the noise without significant signal degradation. Wavelet denoising method offers all that we might desire of a technique, from optimality to generality [17].

2.2.1. Discrete Wavelet Transform (DWT)

The DWT is a conventional method of the WT family which discretizes a signal based on downsampling and represents it in a different level of tree-structure manner. The DWT provides an important advantage over the traditional Fourier Transform (FT) method [18]. The DWT transforms a signal into various scales representing different frequency components. At each scale, the position of the WT can be determined as the vital time characteristic that provides the facility to identify the noises and remove them effectively. The general procedures of the DWT-based signal denoising method used in the literature are divided into three steps. Initially, the signal is transformed up to a predefined decomposition level of j to obtain the detail coefficients. Afterwards, the threshold function is performed on the j signal details using different threshold selection rules, either soft or hard threshold functions, by considering a basic noise model. Finally, the signal is reconstructed using the original approximation coefficients of the jth level and the modified detail coefficients of all levels.

2.2.2. Wavelet Packet Transform (WPT)

The WPT is a generalization of wavelet decomposition, which offers better signal preprocessing and analysis functions than the conventional WT methods [2,19]. The WPT introduces the effects of transformation parameters for denoising effect of a signal, such as the effects of mother wavelet, wavelet packet bases, decomposition level, and threshold function selection. The WPT divides the frequency band into multiple decomposition levels and further transforms the high-frequency part that is not subdivided by wavelet analysis. The WPT selects adaptively the corresponding frequency band to match the spectrum characteristic of the signal, which provides better time-frequency resolution. The wavelet packet transforms a signal into the corresponding frequency band components according to the random time-frequency resolution. In wavelet packet analysis, the noise-reduction algorithm of the signal was basically the same as that of the wavelet analysis. The difference is that wavelet packet analysis decomposed the low and high-frequency part at the same time, which had more accurate local analysis ability.

2.2.3. Stationary Wavelet Transform (SWT)

Stationary Wavelet Transform is more flexible in denoising signals compared to the traditional wavelet transform, which is also known as a non-decimated Wavelet Transform. The SWT is slightly different from the standard DWT because of its up-sampling characteristic of filters at various levels [20]. The SWT preserves the invariance property of a translation of the original signal, whereas the translation invariance in DWT is not preserved because of the sub-sampling operations in the pyramidal method. The SWT uses recursively dilated filters instead of sub-sampling operations to divide the bandwidth from one level to another level. There is no requirement to imply a translation of the corresponding wavelet coefficients. The SWT can maintain the same number of coefficients to all levels, while the traditional wavelet transforms lose the coefficients at each level. Thus, the length of approximations and coefficients is the same at each level, which also corresponds with the original signal.

3. Materials and Methods

This section explains the various features and characteristics of the given specimens. The details about the experimental tests for mechanical and AE data acquisition are discussed.

3.1. Hydrogen Evolution System

A portion of a long carbon steel pipe was used in this test. An exposed area approximately 800 mm2 was made on the segmented pipe (artificial defect). The electrolyte used in this work is 3.5 wt.% of sodium chloride. The cathodic hydrogen charging was done by inducing 3.15 A current using power supply at 25 V to create the hydrogen evolution mechanism on the exposed area through the test. The counter electrode (CE) is a stainless-steel rod, which is used to complete the electrochemical system. The schematic diagram in Figure 1 shows the cathodic hydrogen charging setup, attached with the sensors and location of the active area.

3.2. Acoustic Emission Signal Acquisition

AE signals were continuously acquired during the test. Signals were monitored via four channels of data acquisition environmental noise test. The sensors are attached to the specimen using the magnetic clamp. A coupling agent was applied between sensors and the specimen to greatly increase the acoustic energy transmission from specimen to the sensor. The whole system, including sensors, are supplied by Physical Acoustics Corporation (USA). Pencil lead-break procedure was used prior to the data acquisition for calibration and to ensure all the sensors were receiving the optimum amplitude from the lead break. Values for peak definition time (PDT), hit definition time (HDT) and hit lockout time (HLT), threshold value, and sample rate were employed in the acquisition setting, as shown in Table 1. The sensors were positioned at 12, 3, 6, and 9 o’clock relative to the pipe specimen as shown in Figure 1b by following the recommended configuration for the cylinder-type structure.
In this work, R6I-AST sensors are used to acquire the AE signal and provide high-sensitivity data acquisition and data recording components. The sensor specification is summarized in Table 2. The normal (ground-truth) and abnormal (cathodic charging) AE signal data were taken before and during the experiment, respectively. The total duration of charging and data acquisition is approximately 146 s, recorded at a sampling rate of 1 μs per sample. Thus, every AE hit was producing a 1024 line of data points. The data were acquired and recorded by AEwin software, including all the waveform features. The AE features were analyzed and processed using the wavelet packet transform, empirical mode decommission, and other methods.

3.3. Denoising of a Signal Based on ND-SWT

Non-decimated stationary wavelet transform is adopted for denoising signals which are the foundation of the orthogonal wavelet transform. The basic decomposition tree of ND-SWT is presented in Figure 2, where x [ n ] is an original signal with noise, H, and L are the high-pass and low-pass filters as well as c is a constant, D i and A i are the details of coefficients and approximations respectively. This method avoids using decimators because it decreases the length of the approximation and coefficient sequences with the increment of the iteration index in traditional DWT. The ND-SWT uses a series of low-pass and high-pass filters at each iteration level, and the filters are upsampled from the corresponding filters of the previous level. Therefore, the main difference between the SWT and DWT is the filters are upsampled at each decomposition level in SWT instead of sub-sampled. The ND-SWT is an inherently redundant method as each sequence of coefficients contains an equal number of samples as the number of samples in the original signal. For example, the length of the approximations and coefficients is 2 l j , where l = 1 , 2 , , n is the length of the approximations or coefficients, and j is the number of levels.

Basic Steps of a Signal Denoising by ND-SWT

A time-series, non-stationary signal with noise is assumed, and one-dimension signal model is described as in Equation (2).
x l = f t l + ω z l
where f is an unknown function, t l = l / n , z l i i d N 0 , 1 is a Gaussian white noise and ω is a noise level. The ND-SWT-based denoising operations can be performed according to the following steps:
Step-1: Wavelet decomposition process is performed on an original one-dimensional signal with noise. This process is also known as multi-resolution analysis of a signal with noise. The original signal is decomposed into jth levels varying the wavelet scale and each level carries the different frequency components of the signal. At each level of decomposition, the signal is divided into two parts—details of coefficients with high-frequency information of the signal and approximations with low-frequency information of the signal. Hence, more decomposition steps provide the depth frequency information of the signal as in Figure 2. Suppose, A 1 l = < ψ , ϕ 1 , l > and D 1 l = < ϕ , ϕ 1 , l > , where ϕ is the scale function and ψ is the wavelet function. The non-decimated SWT-based wavelet decomposition can be expressed as in Equations (3) and (4).
D j , k = l H j 2 l 2 k D j 1 , l
A j , k = l L j 2 l 2 k A j 1 , l
where A j , k denotes the scale coefficients of the approximation part, D j , k denotes the wavelet coefficients of the details part. H j 2 and L j 2 refer to the interpolation of A j 1 and D j 1 respectively.
Step-2: Threshold functions are performed on the wavelet coefficients at each decomposition level to de-noise the signal without degrading the signal quality. There are two threshold functions, including hard threshold and soft threshold most commonly used in the wavelet transformation-based signal denoising methods [2]. However, one of the main limitations of a hard threshold function is to interrupt the signal continuity and provide a poor smoothness reconstructed signal. On the other hand, the soft threshold function may discard the important characteristics of the decomposed signal resulting may distort the reconstructed signal. Therefore, this paper adopts a dynamic soft threshold function which is computed based on the correlation factor of the wavelet coefficients and it regulates in between 0 to 1, to remove all wavelet coefficients that are greater than or equal to the set threshold value causing the reconstructed signal to be smooth are clean. Different categories of threshold functions are mathematically expressed in Equations (5)–(7).
η d , λ = d d λ 0 d < λ Hard thresholding
η d , λ = s i g n d d λ d λ 0 d < λ Soft thresholding
η d , λ = s i g n d d α λ d λ 0 d < λ 0 α 1 Dynamic soft thresholding
where d is a wavelet coefficient, λ , is a threshold value, and α is the quantified threshold value in between 0 to 1. After applying the ND-SWT, the wavelet coefficients at each decomposition level are the combination of noise-free and noisy characteristics coefficients in the wavelet domain. The noise-free coefficients are coherent and their energy concentration property is a high magnitude of coefficients, whereas the noisy coefficients are incoherent and presented by many coefficients with small magnitudes. Denoising of a signal is complemented by setting the noisy coefficients to near zero or comparatively small while the threshold function is performed.
Step-3: Reconstruction of the decomposed signal. Based on the nth low approximation coefficients and nth high wavelet detail coefficients, the reconstruction process of the decomposed signal is performed. Reconstruction process can be expressed as in Equation (8).
A j 1 , l = 1 2 k L j l 2 k + L j l 2 k 1 A j , k + 1 2 k H j l 2 k + H j l 2 k 1 D j , k
where L j and H j are the dual base of L j and H j respectively.
To evaluate the denoising effect of the reconstructed signal based on ND-SWT, the Root-Mean-Square Error (RMSE), Signal-to-Noise Ratio (SNR), Peak Signal-to-Noise Ratio (PSNR) and cross-correlation evaluation criteria have been used. The definitions with the mathematical expressions are stated as follows:
RMSE: It is used to compute the reconstruction error after denoising a signal which can be calculated by root of the ratio of the total number of samples of a given signal and the mean-square difference between original given signal x ( l ) and denoised signal x ¯ l . The RMSE is defined as follows:
R M S E = 1 n l = 1 n x l x ¯ l 2
SNR: It is a measure that compares the level of a desired signal x ¯ l to the level of signal noise. The SNR is calculated as the ratio of mean signal power to the mean noise power and expressed as follows:
S N R = 10 log 10 l = 1 n x 2 l l = 1 n x ¯ l x l 2
PSNR: It is a measure which can be computed by the ratio between the maximum possible power of a given signal x ( n ) and the power of corrupting signal noise that affects the fidelity of its representation. The PSNR is defined as follows:
P S N R = 20 log 10 max x n R M S E
Cross-Correlation ( x c o r r ) : The similarity between two discrete time sequences is measured. If the value of cross-correlation x c o r r is close to 1, then the cleaned signal and the signal with noise closely resemble each other. The cross-correlation can be expressed as:
x c o r r = E x ¯ n μ x ¯ x n μ x δ x ¯ δ x
where μ x ¯ and μ x are the mean values of the denoised signal x ¯ n and the signal with noise x ( n ) respectively and δ x ¯ and δ x are denoted as the respective standard deviations of that two signals. The operator E ( ) is referred to the statistical expectation or mean function.

4. Results and Discussion

The description of the datasets, simulation environment, and used parameters are presented in this section. Moreover, the performance of the proposed work in denoising AE signals is analyzed based on several performance metrics.

4.1. Datasets and Simulation Setup

The experimental corrosion dataset acquired from hydrogen evolution on the carbon steel pipeline and synthetic datasets with the addition of different levels of Gaussian white noise were used to evaluate the performance of our proposed denoising method. The hydrogen evolution corrosion dataset was collected using four AE sensors deployed on the carbon steel pipeline at 12, 3, 6, and 9 o’clock positioning manner for a duration of approximately 146 s. There is a single type of measurement (AE signal amplitude in mV), which is recorded as waveforms in every microsecond interval, and each waveform duration is one millisecond. Our proposed method has been applied to the first 1000 waveforms of a single AE sensor and a total of 1,024,000 data points. On the other hand, the synthetic datasets were generated randomly with the addition of SNR 5 dB, 10 dB, 15 dB, 20 dB and 25 dB. Each sample was recorded every microsecond and a total of 1 millisecond duration. Apart from this, the simulations on the datasets were carried out using the Matlab environment to evaluate the performance of the proposed method. The three-layer ND-SWT method was adopted to decompose the given datasets based on Shannon entropy structural function. The four different mother wavelets (haar, db, sym and coif) were selected to compute the wavelet coefficients. The threshold function α was varied to remove the unnecessary wavelet coefficients to achieve noise reduction.

4.2. Denoising of Synthetic Datasets Added with Gaussian White Noise Based on ND-SWT

The randomly generated sinusoidal clean signal and the addition of SNR 5 dB, 10 dB, 15 dB, 20 dB and 25 dB Gaussian white noise signals are presented in Figure 3. In the graph, the vertical axis displays the amplitude of a signal, whereas the horizontal axis represents the time. Here, the clean signal is used as a reference signal and our proposed denoising method is applied to the generated noisy signals to evaluate the performance in terms of accuracy in denoising without distorting the original properties of the reference signal. The synthetic clean signal and denoised signals by the ND-SWT are visualized in Figure 4 to observe the effectiveness of the ND-SWT method in denoising different levels of Gaussian white noise. It can be observed that even if there is a small effect on amplitude of the denoised signals only in the case of severe noisy signals, the rest of the properties of the denoised signals are almost similar to the clean signal. The performance comparison among the properties of the clean signal, the properties of the different levels of noisy signals, and the properties of the ND-SWT-based reconstructed denoised signals are presented in Table 3. It can be clearly seen from the table that all properties of the clean signal are influenced by the different levels of Gaussian white noise except the “Max Peak Frequency” property. However, the ND-SWT method suppresses the several degrees of noise effectively and the properties of the reconstructed denoised signals are almost similar to the properties of clean signal. Hence, it can be claimed that the ND-SWT is an effective method in denoising severe noisy signals without degrading the original properties of the signal.

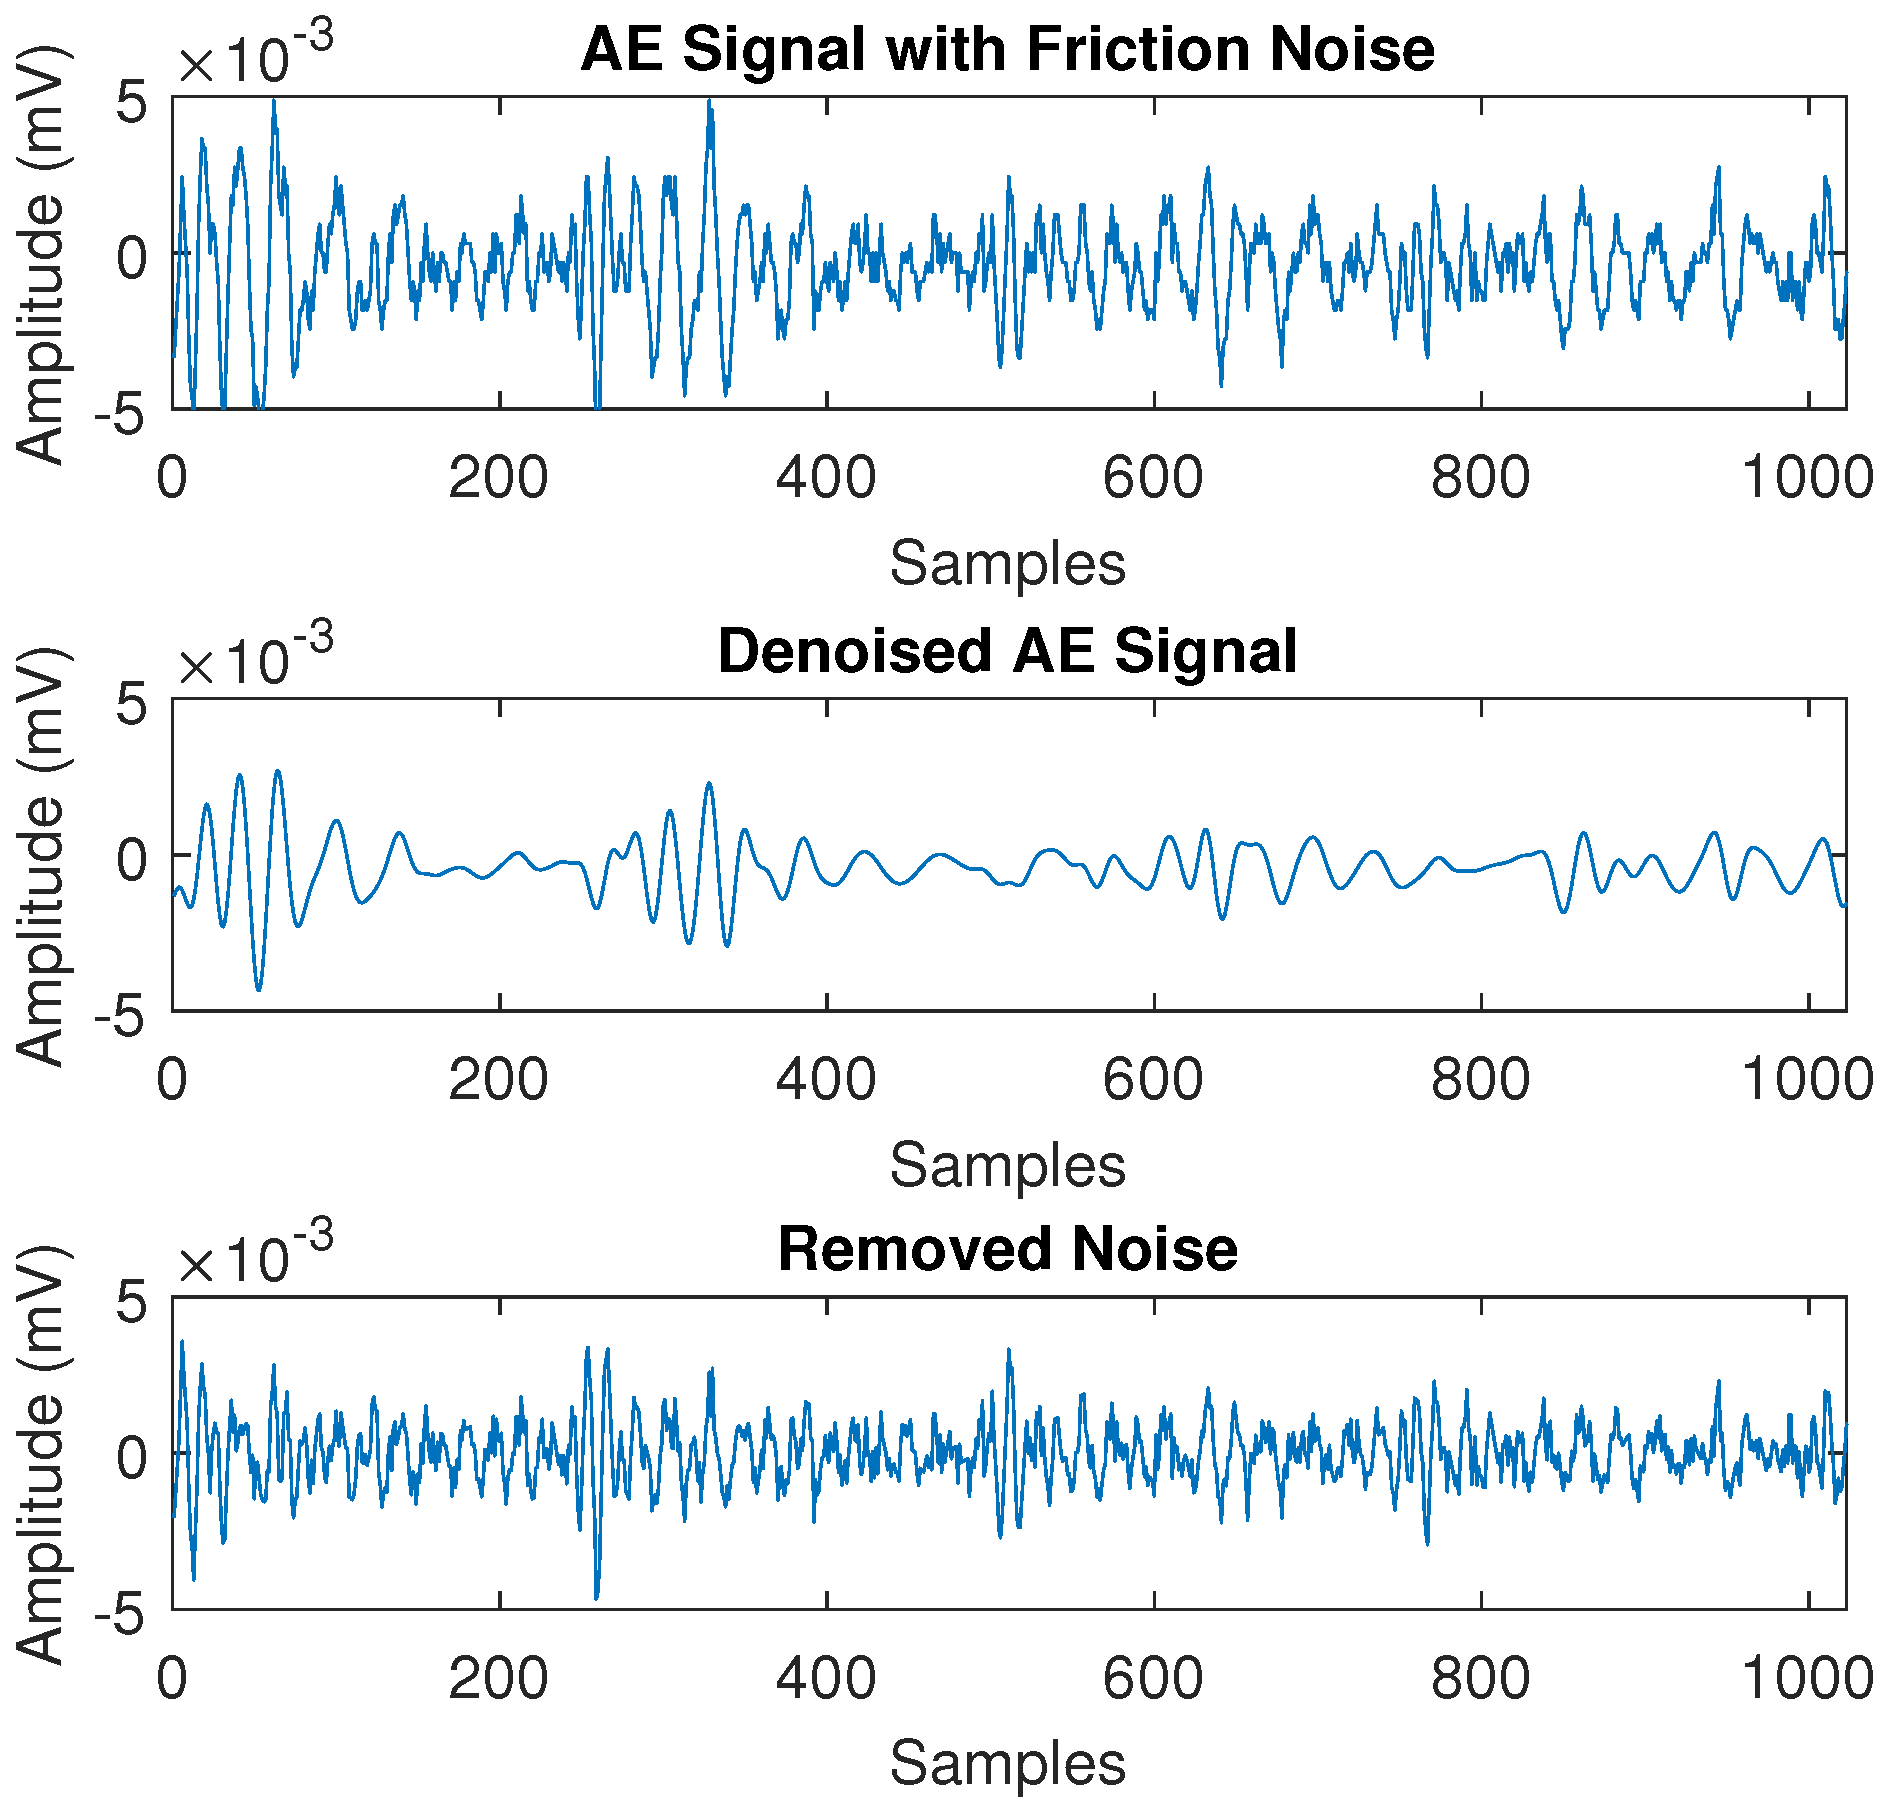
4.3. Denoising of AE Signal Added with Friction Noise Using ND-SWT Method

In this section, the AE signals from frictional source measured by rubbing a plate of steel on the same test specimen and other parameters as mentioned in Section 3.2 to create an external noise during hydrogen evolution activity are extracted. Afterwards, The ND-SWT with coif3 wavelet method is used to suppress the frictional noise of acquired AE signal and evaluate the denoising performance. In Figure 5, a comparison of original frictional noisy AE signal, ND-SWT-based denoised signal and estimated noise are presented. It can be seen from the original AE signal that the AE frictional noise is proportional to the movement pattern and the force applied on the test specimen. The denoised signal in Figure 5 shows that the ND-SWT method effectively eliminates the frictional noise or overlapping frequency properties and retains the necessary hydrogen evolution AE features. Hence, the ND-SWT method can be used for the acquisition of friction noise-free AE signals which provide original frequency components for damage assessment in SHM applications.

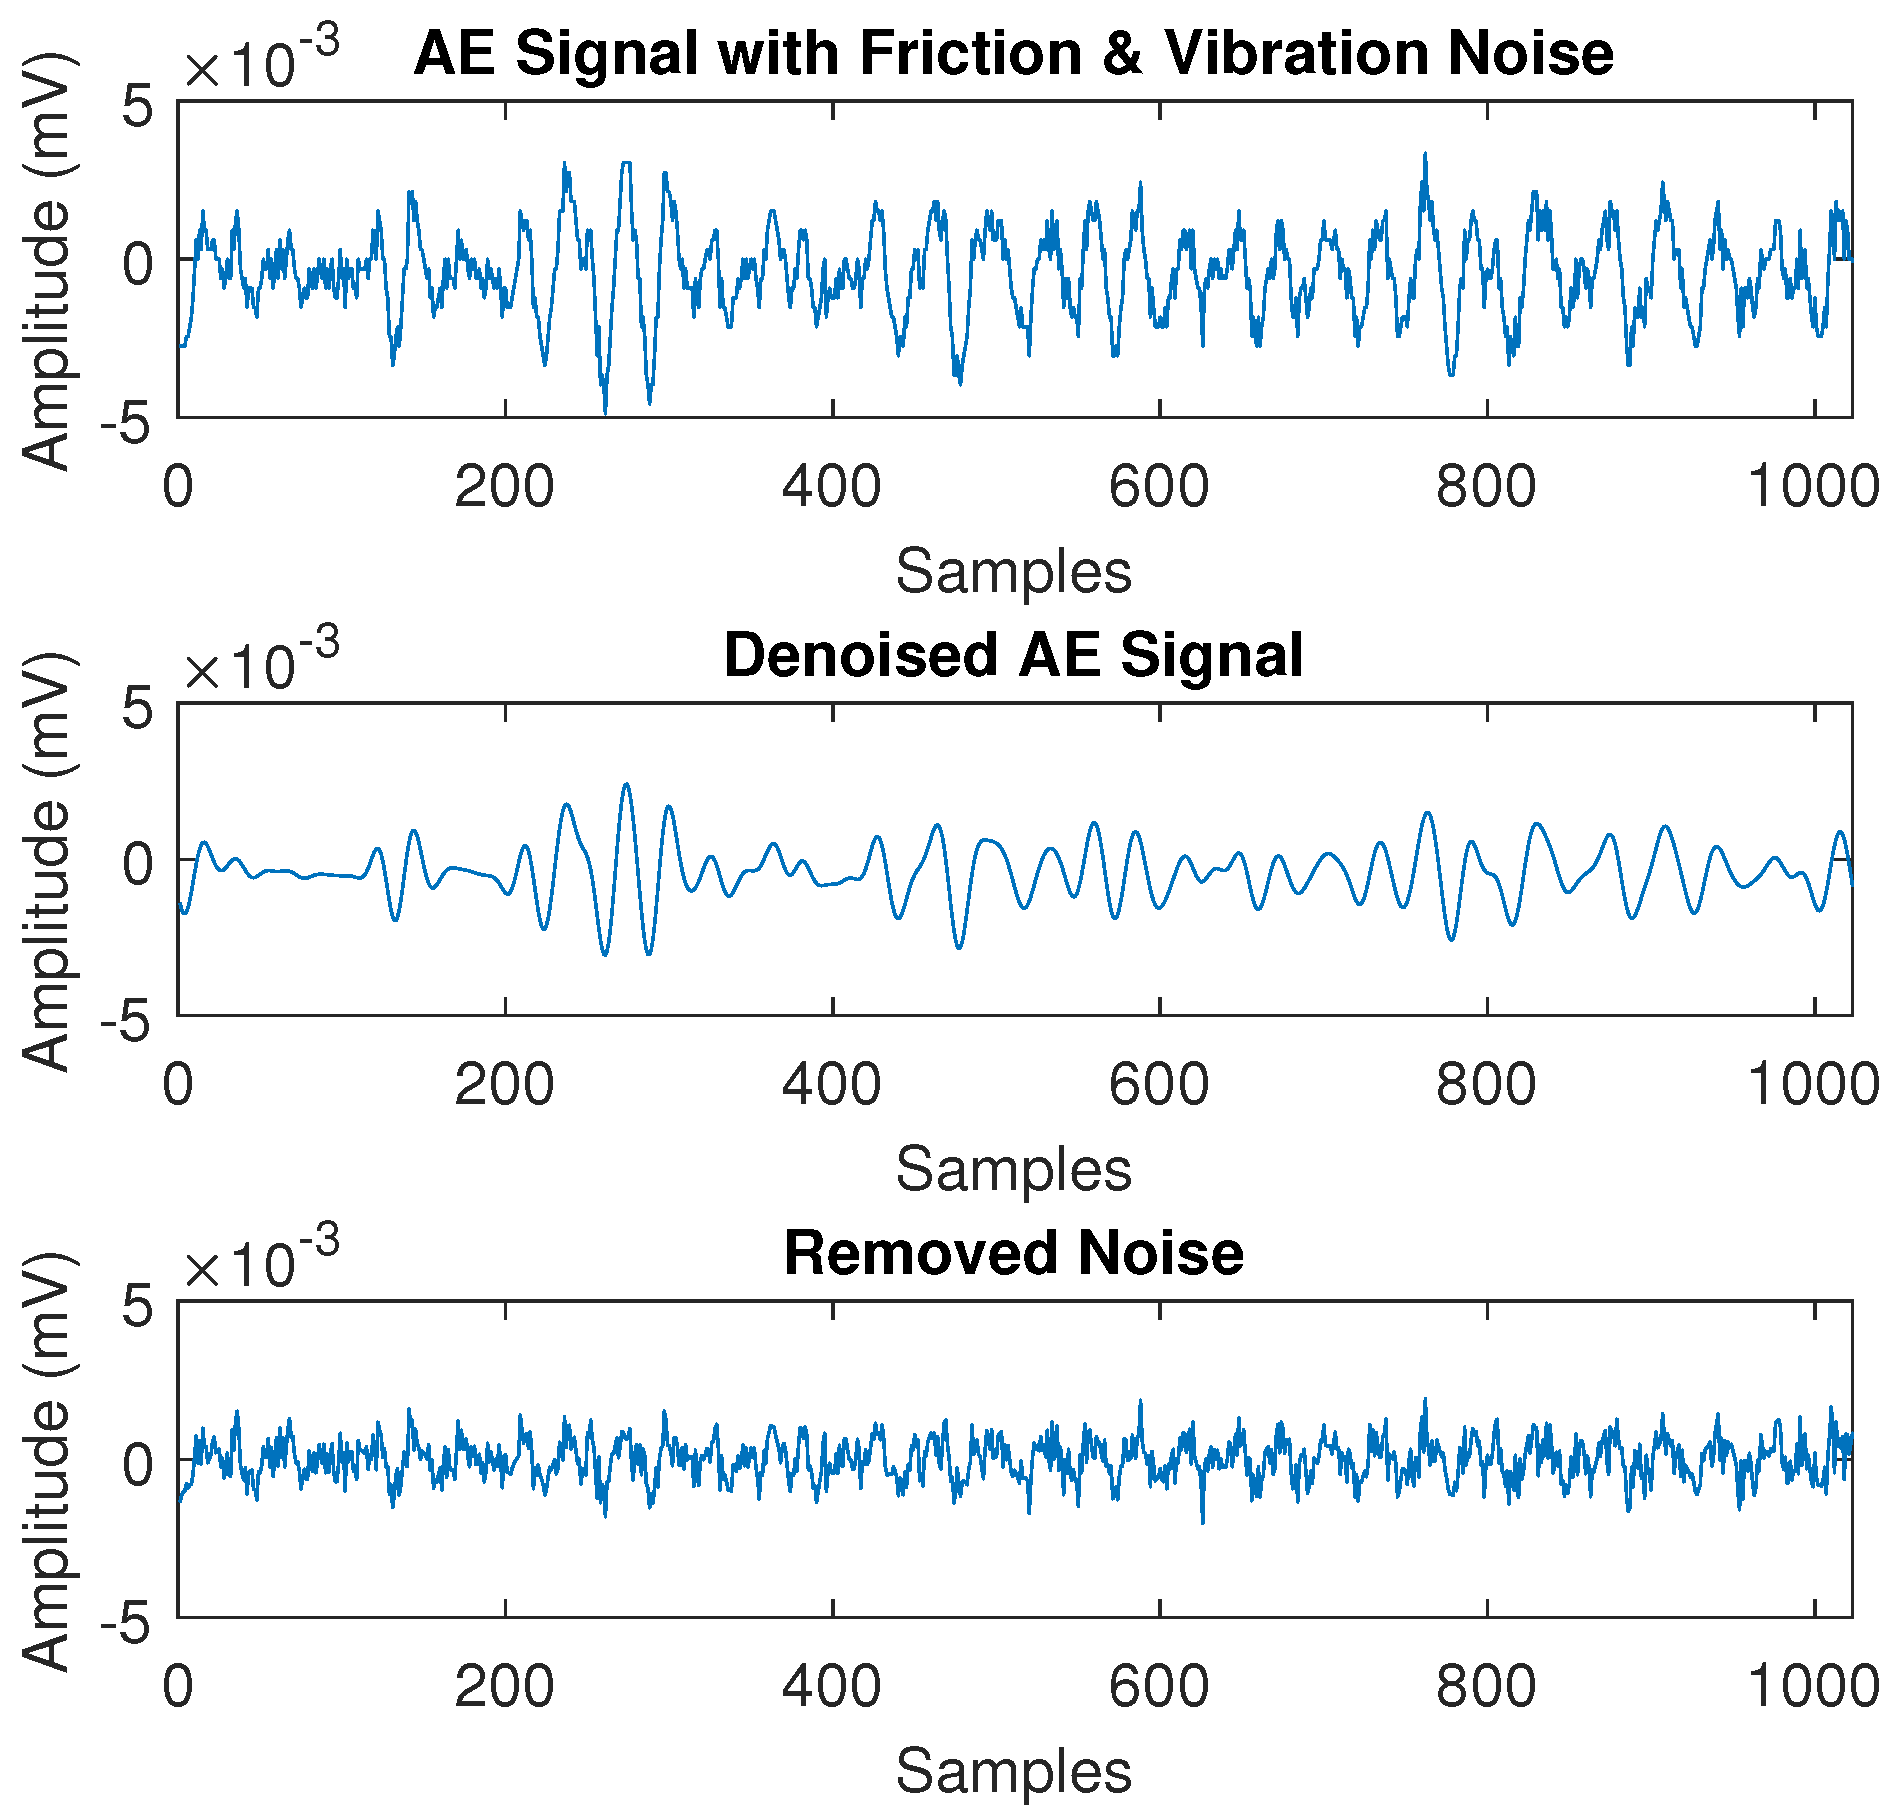
4.4. Denoising of AE Signal Added with Friction and Vibration Noise Using ND-SWT Method

In this section, the AE signals measured on the same test specimen’s other parameters are examined as discussed earlier in Section 3.2 by introducing both the external vibration and frictional and vibration noisy signal. The test specimen is rubbed and knocked randomly along the test specimen during a hydrogen evolution experiment for a certain duration to generate friction and vibration noise. The ND-SWT with coif3 wavelet method is applied to the acquired noisy AE signal for multi-scale decomposition to suppress both noises and evaluated for denoising performance. In Figure 6, a comparison of frictional and vibrational noisy AE signal, ND-SWT-based denoised signal and estimated noise are displayed. It can be seen that each cycle of the original AE signal has a burst type of emission wave which may contain the hydrogen evolution AE features whereas the rest of the signal is dominant with the continuous modulation due to knocking activity. The denoised signal in Figure 6 shows that the ND-SWT method effectively removes both the friction and vibration noise and retains the necessary AE information. Hence, the ND-SWT method can be used not only for removing friction noise but also eliminating vibrational noise of generated AE signals from SHM applications.

4.5. Frequency Spectrum of the Noisy AE Signals and ND-SWT-Based Denoised Signals

In this section, the hydrogen evolution-based normal AE features are explained. Based on the literature in [21], the normal frequency components of an AE signal concentrate the range between 30 kHz to 150 kHz during hydrogen evolution.
This range mainly depends on several bubbles generated during hydrogen evolution and the level of induced potential. Figure 7 shows a comparison of the frequency components for original frictional and vibrational noisy AE signals with the frequency components of the ND-SWT-based denoised AE signals. From Figure 7, it can be seen in the case of original frictional noise that it mainly influences the overlapping frequency band as well as having a small effect on the amplitude. The ND-SWT-based denoised signal contains the original frequency components by removing the overlapping frequency band and unnecessary amplitude. On the other hand, it can be observed that both friction and vibration noises concentrate on both amplitude overlapping frequency band features of AE signal which increases due to these noises. However, the denoised signal by the ND-SWT retains the original frequency components according to the literature by removing the unnecessary frequency bands.

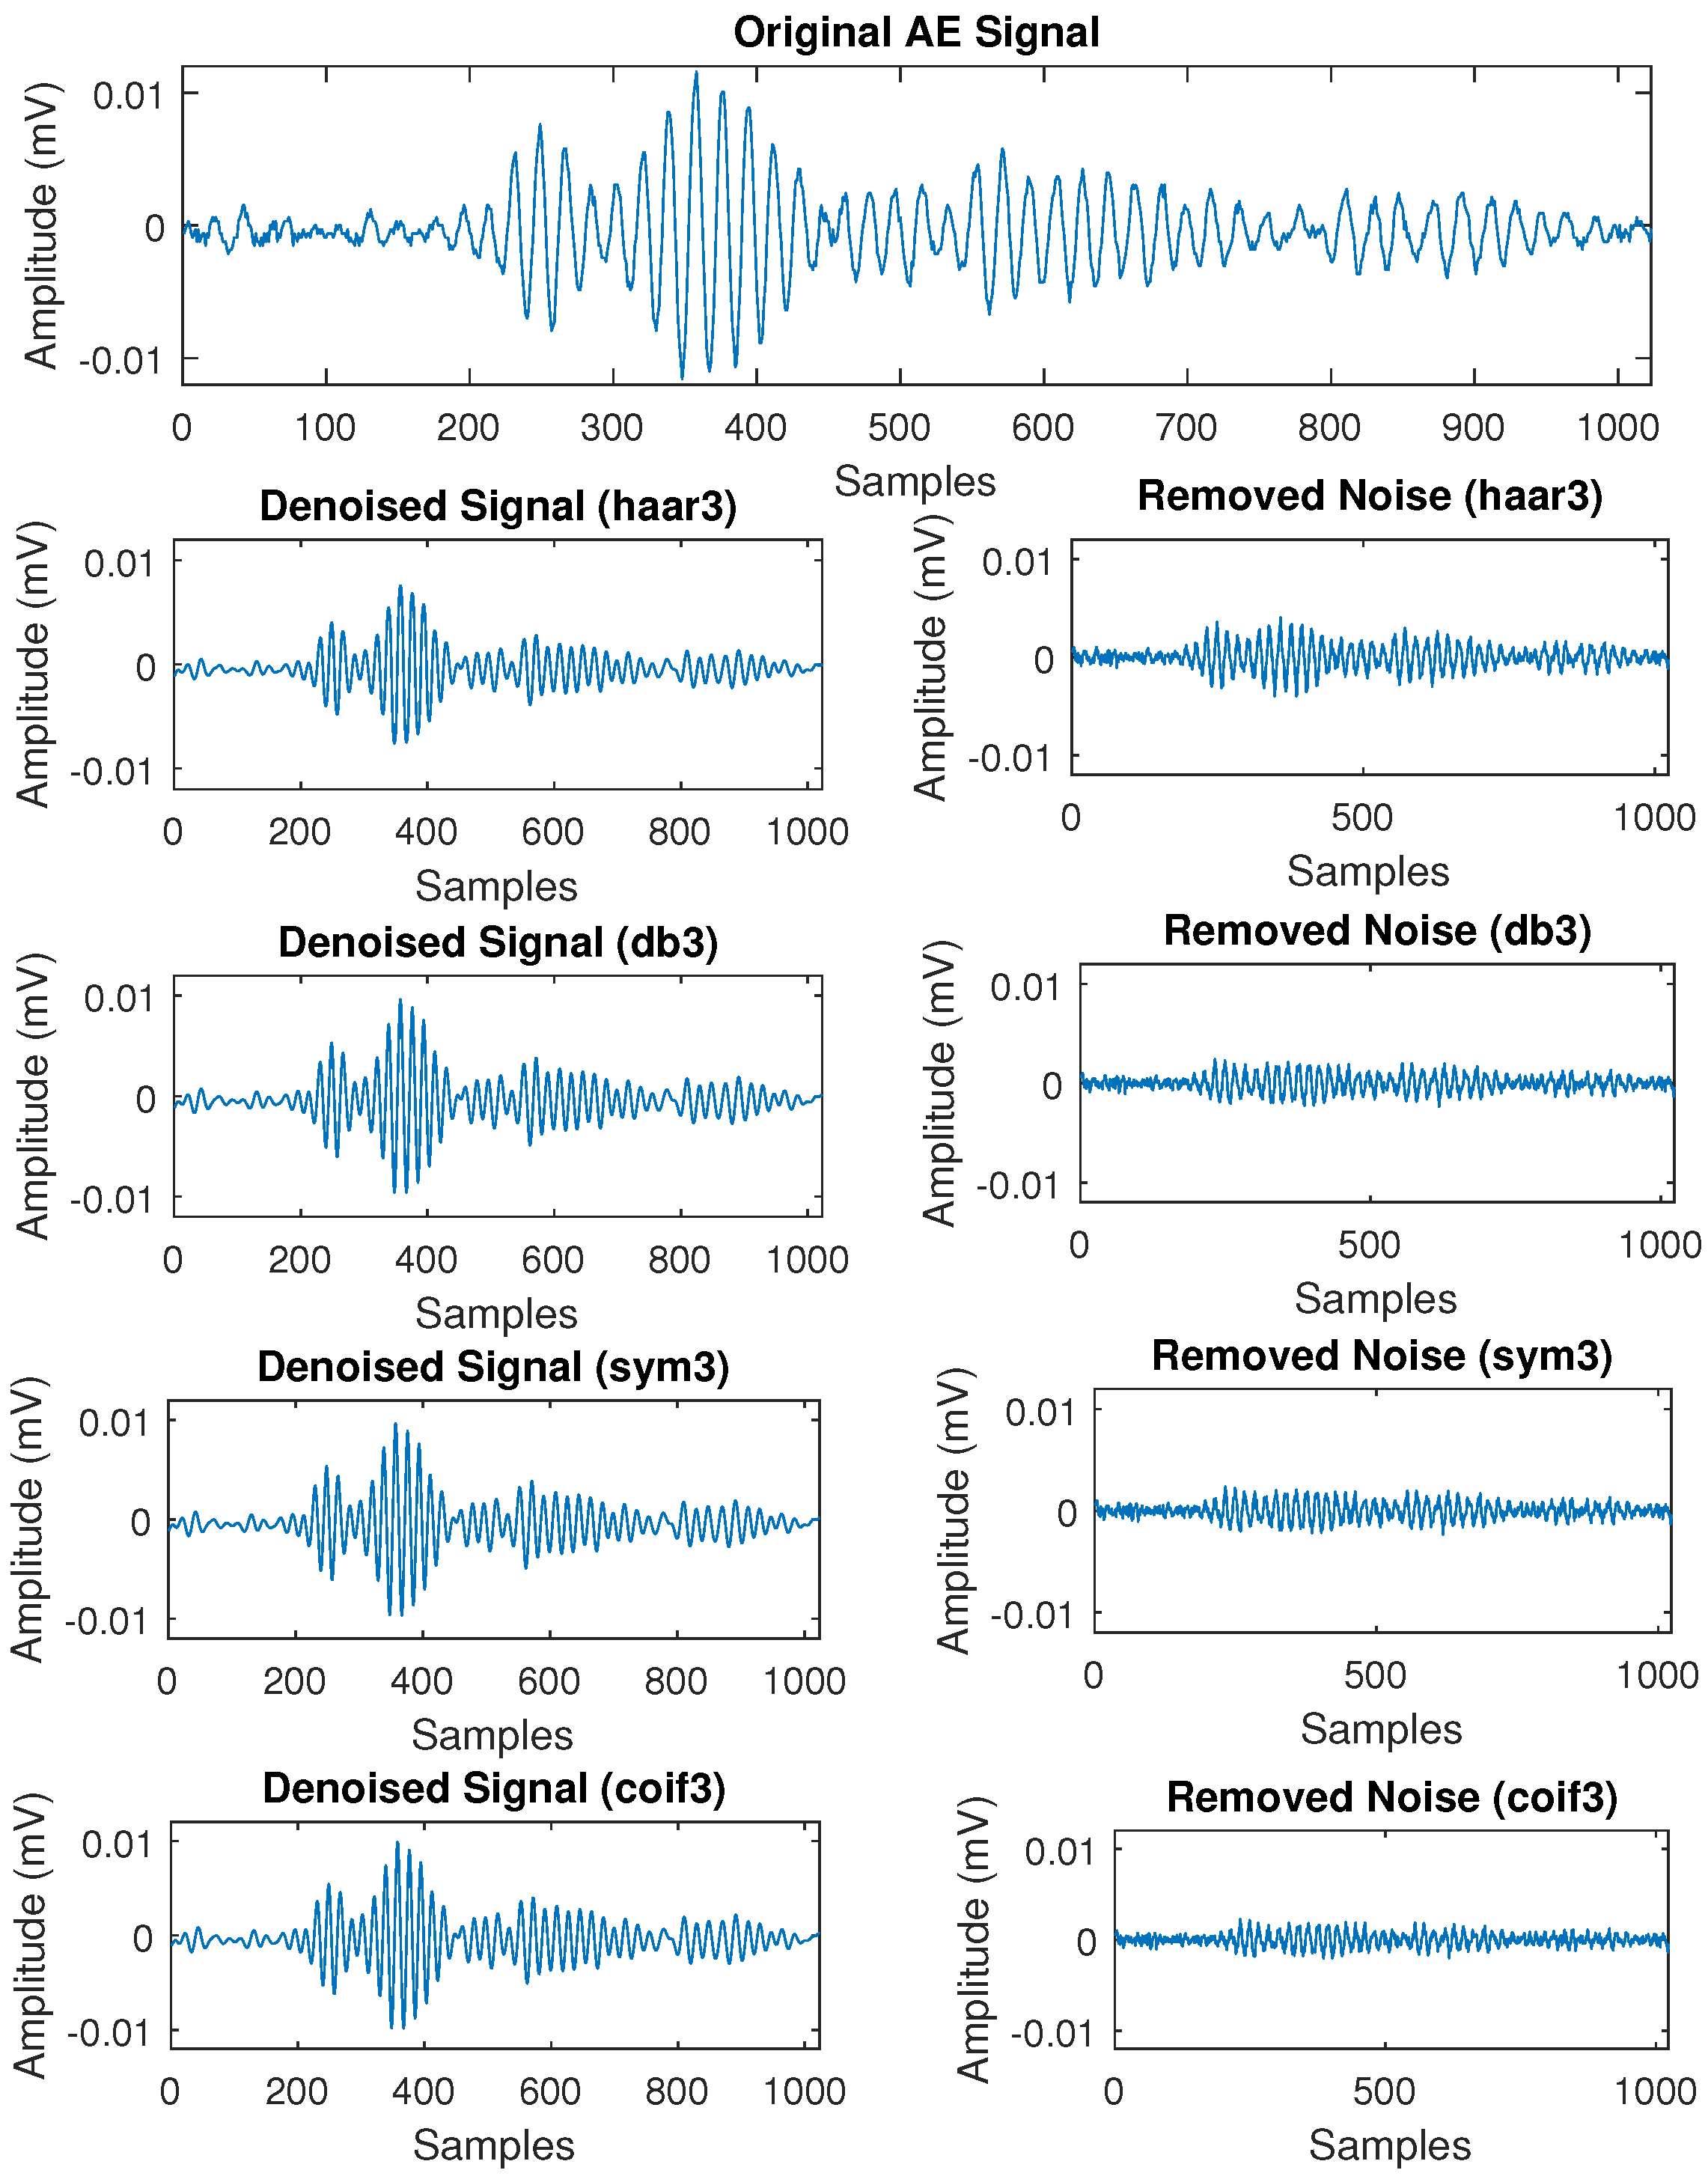
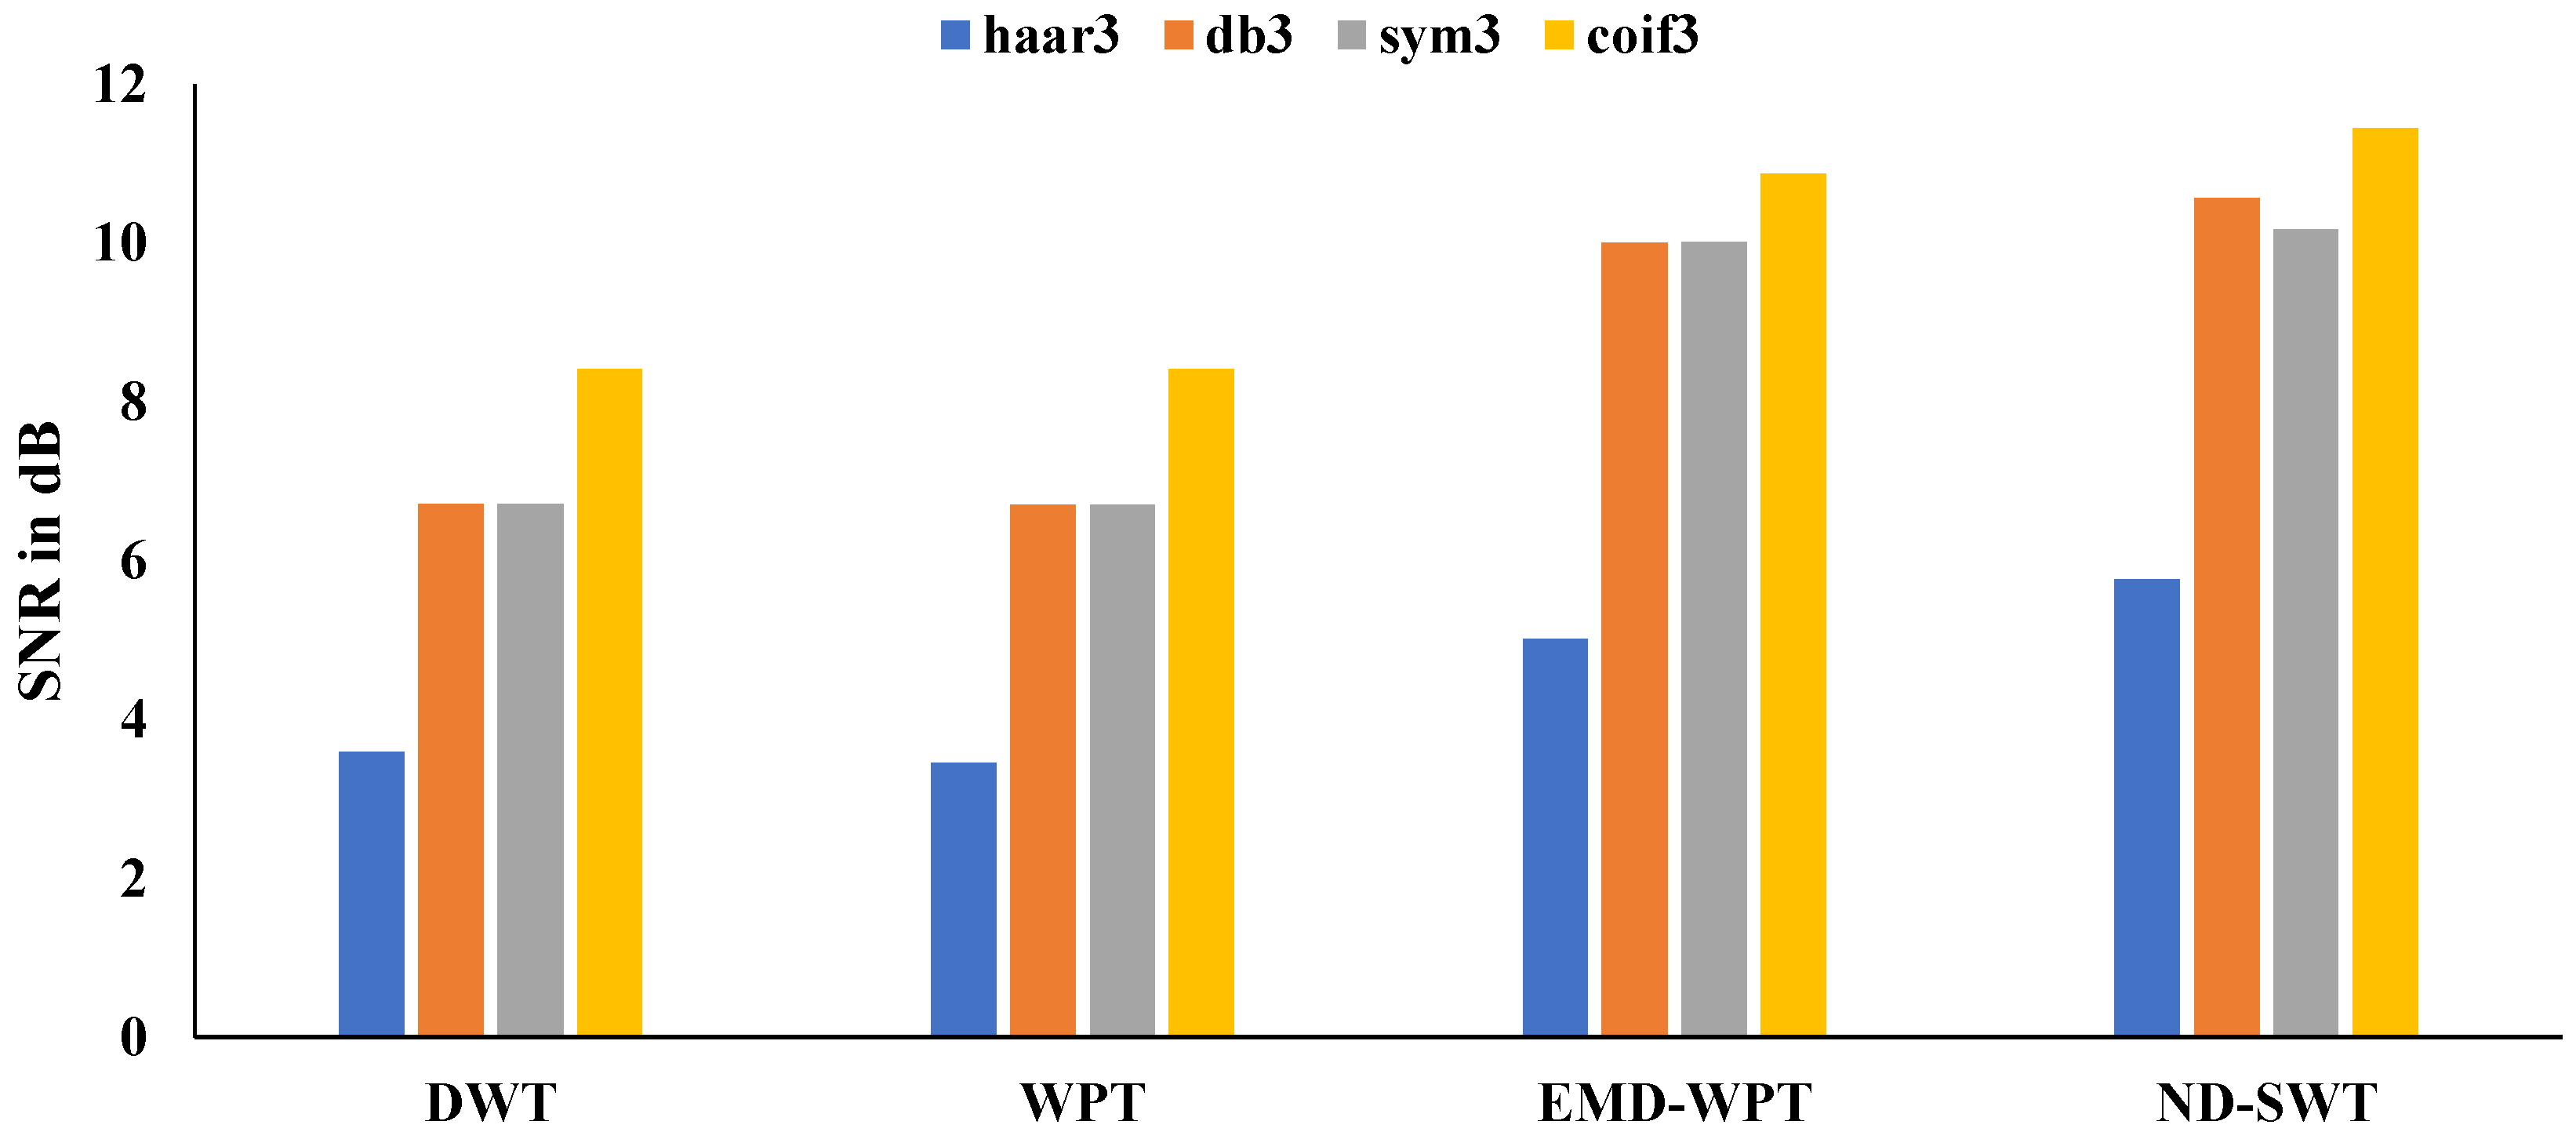
4.6. Comparison of the Performance in Denoising AE Signal Based on Different Methods

In this section, the performance of various denoising methods on AE signals acquired from the hydrogen evolution experiments using different mother wavelets is analyzed. The performance of the proposed method in terms of denoising for “haar3”, “db3”, “sym3” and “coif3” wavelets is shown in Figure 8.
The plot illustrates the comparison between the original AE signal and the denoised AE signal along with the estimated suppressed noise for various types of wavelets. It can be observed that the proposed denoising method suppresses the highlighted friction noise generated from the mechanical or experimental environment and reconstructs the denoised signal with less distortion of the original signal for all types of wavelets. Please note that the “coif3” wavelet yields the lowest distortion after noise reduction of AE signal as compared to others. Moreover, Figure 9, Figure 10 and Figure 11 represent the performance comparison of the most popular existing denoising methods between the original AE signal and the denoised AE signal along with the eliminated amount of noise for different wavelets. It can be observed that the existing methods yield poor performance in terms of denoising the AE signal as compared to the proposed methods. Even the “coif3” wavelet yields better performance in denoising for all existing methods, it still yields the poor noise suppression performance compared to the performance of the proposed method’s “coif3” wavelet.

4.7. Performance Comparison of Different Methods Using Various Performance Metrics

In this section, the performance of various denoising methods is evaluated using different performance metrics, including RMSE, SNR, PSNR, and cross-correlation. All performance metrics have been measured by comparing the properties of the original AE signals and noise-free reconstructed signals. Figure 12, Figure 13, Figure 14 and Figure 15 present the performance of the proposed method on various metrics while denoising the AE signal with respect to the four different wavelets and compare it with the performances of the existing denoising methods. It can be clearly seen in the case of all performance metrics that the mother wavelet named “coif3” performs better in terms of denoising AE signals for all simulated methods than the performances of “haar3”, “db3” and “sym3” wavelets. The main reason is that the “coiflets” uses high windows overlapping and six scaling wavelet function coefficients so that it increases adjacent samples in both averaging and differencing leads to a smoother wavelet. Hence, it is more capable of denoising AE signals. Apart from this, it can be observed from the graphs that the ND-SWT yields the optimum results in terms of accuracy in denoising AE signals, as it yields the lowest value of RMSE and highest values of SNR, PSNR, and cross-correlation as compared to the other existing DWT, WPT, and EMD-WPT methods. This is due to its functional characteristics, including revolving, multi-scale invariable, translation, translation invariability, and redundant properties.

4.8. Frequency Spectrum Analysis of AE Signal after Noise Reduction

The frequency spectrum analysis explains the frequency of a signal or distributed frequency over a time-series. Figure 16 presents the frequency spectrum of the original AE signal, where the original signal has been transformed using FFT and displayed the magnitude in (mV) with respect to the frequency in (kHz) over time-series.
The frequency spectrum illustrates a concentration of power at low frequencies, and it varies in amplitude and slope. Figure 16 also shows the frequency spectrum of the reconstructed denoised AE signal by the proposed and existing denoising methods. It can be clearly seen that the frequency spectrum of the ND-SWT-based denoised signal yields better originality in terms of the original frequency spectrum properties of the signal compared to the other existing methods. Thus, the ND-SWT method provides the accurate damage characterization facility in SHM using accurate frequency components of cleaned AE signals.

5. Concluding Remarks

Our findings and analysis confirm the fact that denoising method is very useful to clean noises from the AE signals in order to improve the quality of the AE signals and use them effectively for different applications in monitoring carbon steel structure, suffered from the hydrogen-induced damage reaction. The adopted ND-SWT provides efficient noise reduction of AE signals generated by hydrogen evolution experiments with the minimum reconstruction error hence, making it useful for large-scale noisy AE signals generated from various monitoring applications in SHM. The simulation results of the proposed method have proven that the SNR, PSNR, and cross-correlation performances are maintained high with the minimum RMSE compared to the performances of the recent existing denoising methods in SHM. The ND-SWT method can be applied to acquire AE clean signals during SHM inspection in real environments. However, the preliminary analysis should be carried out in order to identify the setting parameters during acquisition including threshold value, length of wave, the accurate AE sensor and wave velocity for a specific structure. The selection of appropriate parameters can play a role of removing the reflected wave and other noise. The performance of the ND-SWT method in real practice can vary due to the influence of other external and internal factors such as temperature, humidity, load, pressure and so on which are unable to be considered in this work. The further study can be carried out on real-world SHM application including these factors to investigate the denoising performance of ND-SWT method.

Author Contributions

Review and final editing—Z.M., N.A.N.; data acquisition—M.S.M.; conceptualization and methodology—M.K.A.; data analysis—M.K.A., Z.M.; and original draft preparation—M.K.A. and N.A.A.R. All authors have read and agreed to the published version of the manuscript.

Funding

This research was funded by the Yayasan Universiti Teknologi PETRONAS-Fundamental Research Grant (YUTP-FRG) 2020 under Grant number 015LCO-187 and Mitsubishi Grant under Grant number 015LE0-001.

Acknowledgments

The authors acknowledge YUTP-FRG 2020 (Grant number 015LCO-187) and Mitsubishi Grant (Grant number 015LE0-001) for providing the financial support by the research grants to perform this research.

Conflicts of Interest

The authors declare no conflict of interest.

References

  1. Joseph, R.; Giurgiutiu, V. Analytical and Experimental Study of Fatigue-Crack-Growth AE Signals in Thin Sheet Metals. Sensors 2020, 20, 5835. [Google Scholar] [CrossRef] [PubMed]
  2. He, K.; Xia, Z.; Si, Y.; Lu, Q.; Peng, Y. Noise reduction of welding crack AE signal based on EMD and wavelet packet. Sensors 2020, 20, 761. [Google Scholar] [CrossRef] [PubMed] [Green Version]
  3. Mei, H.; Haider, M.F.; Joseph, R.; Migot, A.; Giurgiutiu, V. Recent advances in piezoelectric wafer active sensors for structural health monitoring applications. Sensors 2019, 19, 383. [Google Scholar] [CrossRef] [PubMed] [Green Version]
  4. Jack, T.A.; Pourazizi, R.; Ohaeri, E.; Szpunar, J.; Zhang, J.; Qu, J. Investigation of the hydrogen induced cracking behaviour of API 5L X65 pipeline steel. Int. J. Hydrogen Energy 2020, 45, 17671–17684. [Google Scholar] [CrossRef]
  5. Wasim, M.; Ngo, T.D. Failure analysis of structural steel subjected to long term exposure of hydrogen. Eng. Fail. Anal. 2020, 114, 104606. [Google Scholar] [CrossRef]
  6. Kang, Y.; Kim, M.; Kim, G.; Kim, N.; Song, S. Characteristics of Susceptible Microstructure for Hydrogen-Induced Cracking in the Coarse-Grained Heat-Affected Zone of Carbon Steel. Metall. Mater. Trans. A 2020, 51, 1–11. [Google Scholar] [CrossRef]
  7. Nguyen, T.T.; Tak, N.; Park, J.; Nahm, S.H.; Beak, U.B. Hydrogen embrittlement susceptibility of X70 pipeline steel weld under a low partial hydrogen environment. Int. J. Hydrogen Energy 2020, 45, 23739–23753. [Google Scholar] [CrossRef]
  8. Kharrat, M.; Ramasso, E.; Placet, V.; Boubakar, M. A signal processing approach for enhanced Acoustic Emission data analysis in high activity systems: Application to organic matrix composites. Mech. Syst. Signal Proc. 2016, 70, 1038–1055. [Google Scholar] [CrossRef] [Green Version]
  9. Liu, X.L.; Liu, Z.; Li, X.B.; Rao, M.; Dong, L.J. Wavelet threshold de-noising of rock acoustic emission signals subjected to dynamic loads. J. Geophys. Eng. 2018, 15, 1160–1170. [Google Scholar] [CrossRef] [Green Version]
  10. Khamedi, R.; Abdi, S.; Ghorbani, A.; Ghiami, A.; Erden, S. Damage characterization of carbon/epoxy composites using acoustic emission signals wavelet analysis. Compos. Interfaces 2019, 27, 111–124. [Google Scholar] [CrossRef]
  11. Ji, J.; Li, Y.; Liu, C.; Wang, D.; Jing, H. Application of EMD Technology in Leakage Acoustic Characteristic Extraction of Gas-Liquid, Two-Phase Flow Pipelines. Shock Vib. 2018, 2018, 1529849. [Google Scholar] [CrossRef]
  12. Satour, A.; Montrésor, S.; Bentahar, M.; Elguerjouma, R.; Boubenider, F. Acoustic emission signal denoising to improve damage analysis in glass fibre-reinforced composites. Nondestruct. Test. Eval. 2014, 29, 65–79. [Google Scholar] [CrossRef]
  13. Faisal, N.; Droubi, M.; Steel, J. Corrosion monitoring of offshore structures using acoustic emission sensors. J. Inst. Corros. 2017, 139, 14–16. [Google Scholar]
  14. Calabrese, L.; Campanella, G.; Proverbio, E. Noise removal by cluster analysis after long time AE corrosion monitoring of steel reinforcement in concrete. Constr. Build. Mater. 2012, 34, 362–371. [Google Scholar] [CrossRef]
  15. Hrairi, M. Statistical signal processing and sorting for acoustic emission monitoring of high-temperature pressure components. Exp. Tech. 2009, 33, 35–43. [Google Scholar] [CrossRef]
  16. Huang, N.E. Introduction to the Hilbert–Huang transform and its related mathematical problems. In Hilbert–Huang Transform and its Applications; World Scientific: Singapore, 2014; pp. 1–26. [Google Scholar]
  17. Schreiber, T. Interdisciplinary application of nonlinear time series methods. Phys. Rep. 1999, 308, 1–64. [Google Scholar] [CrossRef] [Green Version]
  18. Ramos, R.; Valdez-Salas, B.; Zlatev, R.; Schorr Wiener, M.; Bastidas Rull, J.M. The discrete wavelet transform and its application for noise removal in localized corrosion measurements. Int. J. Corros. 2017, 2017, 7925404. [Google Scholar] [CrossRef] [Green Version]
  19. Tan, C.; Wang, Y.; Zhou, X.; Wang, Z.; Zhang, L.; Liu, X. An integrated denoising method for sensor mixed noises based on wavelet packet transform and energy-correlation analysis. J. Sens. 2014, 2014, 650891. [Google Scholar] [CrossRef]
  20. Nason, G.P.; Silverman, B.W. The stationary wavelet transform and some statistical applications. In Wavelets and Statistics; Springer: Berlin/Heidelberg, Germany, 1995; pp. 281–299. [Google Scholar]
  21. Wu, K.; Jung, W.S.; Byeon, J.W. Acoustic emission of hydrogen bubbles on the counter electrode during pitting corrosion of 304 stainless steel. Mater. Trans. 2015, 56, 587–592. [Google Scholar] [CrossRef] [Green Version]
Figure 1. The schematic diagram for (a) cathodic hydrogen charging setup and (b) cross section pipe with location of sensors.
Processes 08 01460 g001
Figure 2. The ND-SWT decomposition tree.
Processes 08 01460 g002
Figure 3. Synthetic clean signal and the signals with the addition of several degrees of Gaussian white noise.
Processes 08 01460 g003
Figure 4. Synthetic clean signal and the ND-SWT-based denoised signals.
Processes 08 01460 g004
Figure 5. Comparison among frictional noisy AE signal generated from hydrogen evolution experiment, the signal after denoising and estimated noise.
Processes 08 01460 g005
Figure 6. Comparison among frictional and vibrational noisy AE signal, the signal after denoising and estimated noise.
Processes 08 01460 g006
Figure 7. Comparison between the frequency components of the Original noisy AE signals and ND-SWT-based denoised signals.
Processes 08 01460 g007
Figure 8. Noise reduction by ND-SWT using haar3, db3, sym3 and coif3 wavelets.
Processes 08 01460 g008
Figure 9. Noise reduction by DWT using haar3, db3, sym3 and coif3 wavelets.
Processes 08 01460 g009
Figure 10. Noise reduction by WPT using haar3, db3, sym3 and coif3 wavelets.
Processes 08 01460 g010
Figure 11. Noise reduction by EMD-WPT using haar3, db3, sym3 and coif3 wavelets.
Processes 08 01460 g011
Figure 12. Comparison on RMSEs of the simulation AE signal with respect to four methods using four different wavelets.
Processes 08 01460 g012
Figure 13. Comparison on SNRs of the simulation AE signal with respect to four methods using four different wavelets.
Processes 08 01460 g013
Figure 14. Comparison on PSNRs of the simulation AE signal with respect to four methods using four different wavelets.
Processes 08 01460 g014
Figure 15. Comparison on cross-correlations of the simulation AE signal with respect to four methods using four different wavelets.
Processes 08 01460 g015
Figure 16. Frequency spectrum of AE signal after noise reduction by DWT, WPT and EMD-WPT and ND-SWT Methods.
Processes 08 01460 g016
Table 1. AE parameters.
ParameterValue
Hit definition time (HDT)2000 μs
Peak definition time (PDT)1000 μs
Hit lockout value (HLT)500 μs
Threshold value40 dB
Sample rate1 μs per sample
Table 2. Specifications of R6I-AST sensor.
ParameterValue
Peak sensitivity, ref (V/(m/s))117 dB
Operating frequency Range40–100 kHz
Resonant Frequency, ref (V/(m/s))55 kHz
Table 3. Comparison among the properties of synthetic clean signal, different degrees of noisy signals and the ND-SWT-based denoised signals.
PropertiesClean Signal25 dB20 dB15 dB10 dB5 dB
Number of Peaks21209209209273338
Max Peak Frequency (Hz)19.5319.5319.5319.5319.5319.53
Mean Frequency (Hz)19.8020.5322.0126.5841.2771.47
Angular Frequency (Hz)125.541291.411291.411690.431970.832082.04
RMS Bandwidth (kHz)0.8760.2460.24110.20107.47101.97
Mean Frequency Power (dB)−6.01−5.97−5.86−5.80−5.30−4.26
RMSE0.000.040.070.120.230.38
SNR (dBc) 24.4920.9115.669.296.04
xcorr (%)100.0099.8499.5298.4895.1787.76
ND-SWT-Based Denoised Signals
Number of Peaks212121212121
Max Peak Frequency (Hz)19.5319.5319.5319.5319.5319.53
Mean Frequency (Hz)19.8019.6819.6819.6919.5619.50
Angular Frequency (Hz)125.54125.79125.79125.79125.79125.92
RMS Bandwidth (kHz)0.870.980.980.980.960.94
Mean Power (dB)−6.01−6.37−6.37−6.47−6.55−6.81
RMSE0.000.030.040.050.070.11
SNR (dB) 50.8955.8454.7848.2954.96
xcorr (%)100.0099.9199.8399.7499.5698.91
Publisher’s Note: MDPI stays neutral with regard to jurisdictional claims in published maps and institutional affiliations.

