Article

Water Vapor Pathways during Freeze-Drying of Foamed Product Matrices Stabilized by Maltodextrin at Different Concentrations

Chair of Food and Bioprocess Engineering, School of Life Science, Technical University of Munich, 85354 Freising, Germany
*
Author to whom correspondence should be addressed.
Submission received: 15 October 2020 / Revised: 10 November 2020 / Accepted: 11 November 2020 / Published: 15 November 2020
(This article belongs to the Special Issue Modern Freeze Drying Design for More Efficient Processes)

Abstract

:
This study aimed to identify the water-vapor transport mechanisms through an aerated matrix during microwave freeze-drying. Due to the larger surface area and lower water vapor transport resistance of an aerated product compared to the solution, foam structures dry faster. Different foam structures were produced with different maltodextrin (MD) concentrations (10–40%) as a foam-stabilizing agent. Depending on the initial viscosity of the solution prior to foaming, the samples differed in overrun (41–1671%) and pore size (d50 = 58–553 µm). Experiments were partially performed in a freeze-drying chamber of a light microscope to visualize structural changes in-situ. Different mechanisms were identified explaining the accelerated drying of foams, depending on the MD concentration, above or below 30%. At lower MD concentration, high overruns could be produced prior to freezing with big bubbles and thin lamellae with short diffusion pathway length. At 40% MD concentration, the viscosity was too high to integrate much air into the product. Therefore, the foam overrun was low and the bubble size small. Under these conditions, the water vapor generates high pressure, resulting in the formation of channels between bubbles, thus creating the pathways with low resistance for a very fast water vapor mass transfer. In addition, microwave freeze-drying experiments using a pilot plant unit were conducted to validate the findings of the freeze-drying microscope. A reduction of the drying time from 150 min (10% MD) to 78 min (40% MD) was achieved.

Graphical Abstract

1. Introduction

To increase the shelf life of biogenic substances of relevance in the food and pharmaceutical industries such as proteins, antibodies, immunoglobulins or microorganisms and to improve their handling, biomolecules are often preserved by freeze-drying (FD), which mainly uses sugar as protectants [1,2]. FD has been well established as a very gentle process, which maintains high physiological activity of the substrates [3]. However, FD is a highly time- and energy-consuming process, and thus often presents the main capacity bottleneck in the entire production chain for biotechnological applications [4].
To accelerate the drying process, energy can be introduced using microwave technology, which allows a more effective and more uniform volumetric energy input [5], and by foaming the product before drying. This will increase the surface area of the product and lower the water vapor transfer resistance [6]. Several studies have shown that foam drying results in high-quality products and shorter drying processes [7,8,9,10]. In addition, foam drying can possibly be used to process products that are difficult to dry, such as sticky tomato [11,12], raspberry [13] or mango pastes [14].
One advantage of drying liquid foam is that the lamellae act as capillaries, pumping water to the surface [15]. This accelerates the drying process, whereas the lower heat-transfer rate appears to be non-dominant [12]. However, because of the natural instability of foam, it tends to collapse before being dried [16]. To stabilize the foam, sugar and other polymers are used to increase the viscosity of the bulk phase before the drying starts. Thus, producing kinetically stable foam becomes possible, which allows it to withstand foam decay until stabilization due to solidification when subjected to the drying process [5].
Freezing of foam yields another possibility of preserving the foam characteristics over the entire drying process, which enables the development of drying models similar to that used by Sochanski et al. for the microwave-supported freeze-drying (MWFD) of aerated milk [17]. These authors stated that the water vapor leaves the frozen foam through air voids, creating an open porous structure where gas can pass through the structure without resistance. In their study, they concluded that their model appeared to be valid, however the water vapor pathway has yet to be identified by further experiments. As shown in a study by Wang et al. [18], who investigated the foam freeze-drying of a mannitol, skim milk and sodium carboxymethylcellulose containing formulation the drying speed and vapor transport can be positively influenced by the use of initially foamed samples. Further, they assumed that the drying will take place throughout the sample. Nonetheless, they assumed this only by temperature measurement inside their sample mold, but did not validate this experimentally by microscopic analysis. While the background of foam-freeze drying has not yet been fully understood, industry is already using this technology, e.g., for pharmaceutical forms of delivery [19], the drying of coffee [20], apple juice [21] or egg white concentrates [22].
The approach in the present study was therefore the investigation of the drying behavior of foam with different properties to identify the not fully understood drying mechanisms of frozen foam. Different concentrations of the polysaccharide maltodextrin were used in combination with surfactant polysorbate 80. This process resulted in different foam properties such as volume increase (overrun) and bubble size and gave the possibility of examining the water vapor pathway of different product structures. Regarding freeze-drying of bulk solid materials, some studies investigated the effect of pore size on the drying kinetics. While small pores (<20 µm) resulted in a single, sharp sublimation front starting from the top [23], particles of a few hundred micrometers dry with two sublimation fronts starting from the bottom and the top simultaneously [24]. For particles of several millimeters in size, the sublimation was reported to start from the surface of the single individual particles throughout the product [25]. Studies by Foerst et al. looked at the whole range of pore size on frozen bulky solids on freeze-drying and confirmed the findings of these earlier studies regarding the effect of pore size as a significant impact on the drying kinetics [23]. Even though the freeze-drying of bulky solids with outer pores does not seem to be directly comparable with the freeze-drying of foams, where pores are inside the product, the influence of the pore size can be an indication also for the behavior of foam drying. Therefore, the purpose of this study was to identify and assess how water vapor transport occurs through porous, i.e., foamed and highly viscous or solid frozen matrices, which is of equal interest for conventional and microwave-supported drying processes. The hypothesis of this study therefore was that different carbohydrate concentrations have a structural impact on the foamability and, thus, on the drying behavior of the foam. By changing the drying behavior, it can be assumed that the water vapor pathway itself will change because of the differences in lamellae thickness and inner surface area.
The drying process was observed using a freeze-drying microscope, which allowed online observations of the whole freeze-drying process inline, including freezing of the liquid foam and the consequent drying process. The results were compared with those of the pilot-plant experiments to validate the findings from the microstructural analysis of freeze-drying.

2. Materials and Methods

2.1. Materials

Polysorbate 80, which was used as foaming agent, was obtained from Sigma-Aldrich Co. LLC, (St. Louis, MO, USA). Maltodextrin DE-6 (MD) was purchased from Nutricia GmbH (Erlangen, Germany). All reagents were of analytical grade.

2.2. Sample Preparation

Sample solutions of 200 g each were prepared by mixing and dissolving 3% (w/w) polysorbate 80 with different amounts of maltodextrin DE-6 (0% to 40% in steps of 5% (w/w)) in demineralized water. The application of different maltodextrin concentrations provided the opportunity to create foam with a broad range of bubble sizes and different foam volumes, i.e., overruns. To ensure full hydration, the sample solutions were gently stirred using a magnet stirrer (Maxi Direct, Fisher Scientific GmbH, Schwerte, Germany) at 200 rpm for 12 h at 4 °C. Prior to the experiments, the sample solutions were tempered at 20 °C in a water bath (F3, Fisher Scientific GmbH, Schwerte, Germany).

2.3. Measurement of Dielectric Constant

The dielectric constant was measured with a dielectric kit for vials (µWaveAnalyser, Püschner GmbH & Co. KG, Schwanewede, Germany) inside a −20 °C chamber following in principle the method of Péres-Campos et al. [26]. One milliliter of sample solution was transferred into a glass vial (1MLFBG, 40 × 8mm, VWR International GmbH, Darmstadt, Germany) and tempered at −20 °C for at least 8 h to ensure that the temperature is in equilibrium. Thereafter, the dielectric constant was measured at 2450 MHz and calculated by the software µWaveAnalyser (Version 3.2.0, Püschner GmbH & Co. KG, Schwanewede, Germany).

2.4. Foam Preparation

A total of 150 g of the sample solution was whipped using a commercial planetary mixer (ARTISAN 5KSM150PS, KitchenAid, St. Joseph, MI, USA) for 15 min at 220 rpm and 20 °C. The mixer had a wire-whisk geometry (K45WW, KitchenAid, St. Joseph, MI, USA).

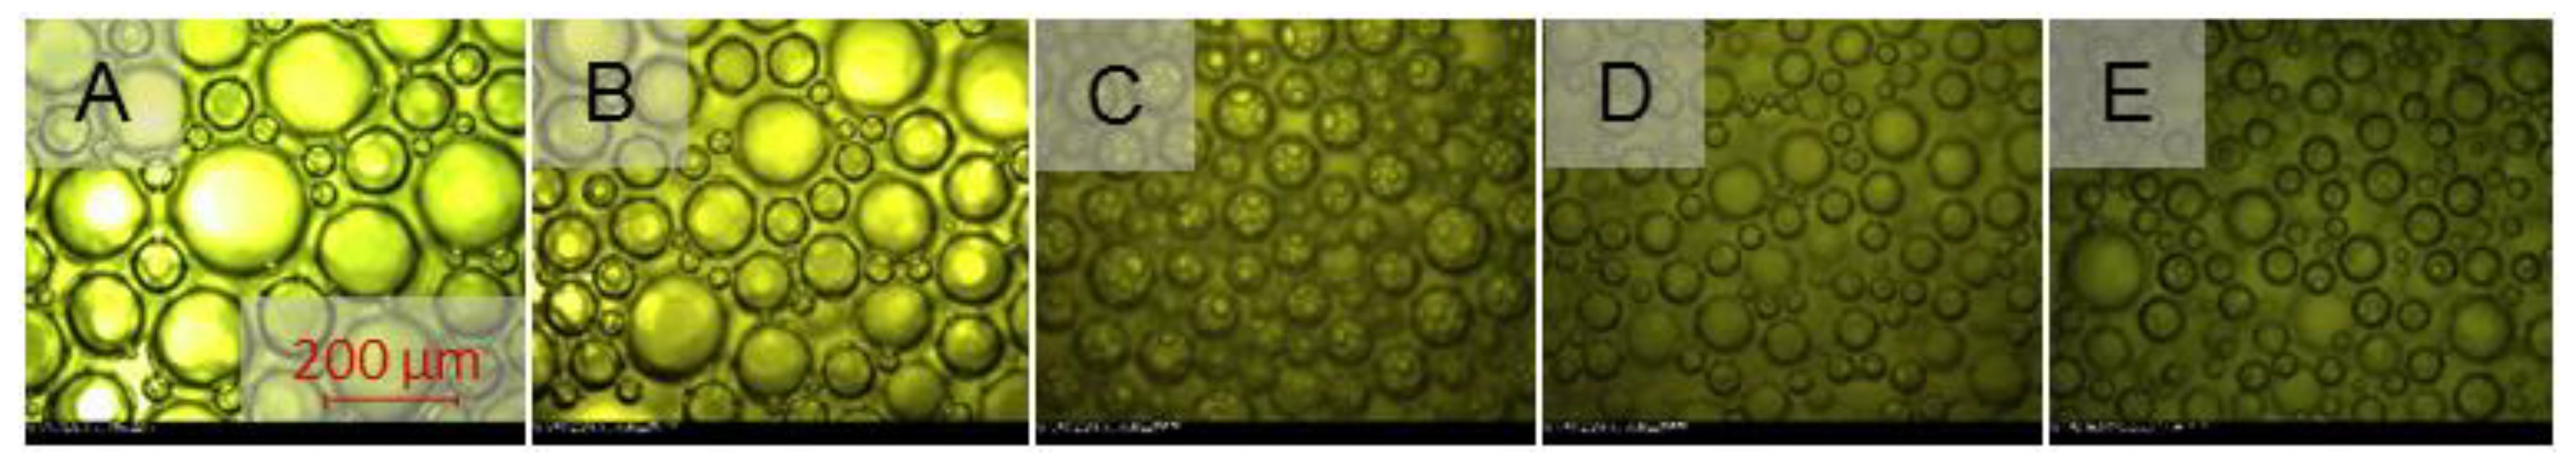
2.5. Determination of Bubble Size Distribution and Overrun

The overrun is defined as the percentage increase in volume of the foamed sample greater than the volume of the original sample, which is in our case the volume of the solution. It was determined as described by Kreuß et al. [27] and calculated according to Equation (1), where mS is the mass of the sample solution and mF is the mass of the foam.
Overrun ( % ) = m S m F m F · 100
The bubble size distribution was determined using an optical microscope (Axiovert 135, Carl Zeiss AG, Oberkochen, Germany) with 10-fold magnification. The foam samples were gently transferred to a microscope slide 15 min after the foam formation. Photographs were taken across the foam. A number of at least 300 bubbles per sample were analyzed and the d50 value was calculated using the software AxioVision (Version 4.8.2.0, Carl Zeiss AG, Oberkochen, Germany).

2.6. Examination of Freeze-Drying Behavior Using a Freeze-Drying Microscope

Observation of the freeze-drying process was made possible using a freeze-drying microscope (Olympus BX51, Olympus Europa SE & Co. KG, Hamburg, Germany). Here, a single foam drop was placed on the microscope slide. A spacer between the microscope slide and cover glass prevented foam deformation. The freezing and drying processes were documented using a FireWire camera PL-A662 (PixeLINK®, Navitar Inc., New York, NY, USA). Next to the picture, pressure, temperature and cooling rate were documented. The pressure was set using a vacuum pump (E2M1.5, Edwards Germany GmbH, Munich, Germany) that was connected to the microscope software Linksys 32 (Linkam Scientific Instruments Ltd., Surrey, UK) and controlled by the active pirani gauge APG-L-NW16i (Edwards Germany GmbH, Munich, Germany). To observe the drying process, reflected and transmitted lights were used. For tempering, the stage was equipped with a Peltier element for heating and cooling (Figure 1). In order to achieve fast cooling rates, a liquid nitrogen vessel was connected to the stage. Due to the thin layer of sample, it was assumed that the heating of the freeze-drying microscope is comparable with the volumetric heating of the microwave drier.
The temperature was set at a rate of −5 °C∙min−1 to 0 °C. Subsequently, the temperature was set to −45 °C at a sample dependent freezing rate. In order to be able to compare microwave-assisted drying and freeze-drying microscope, the freezing rates of 120 g foam samples were measured inside the −80 °C freezer. The temperature sensors were placed at the half thickness of sample and located at both relevant sides (towards the door of the freezer and in direction of the freezers cavity) and the center of the sample. The freezing rate was calculated by the mean of the temperature slopes until nucleation occurred and used for the setup in the freeze-drying microscope (Table 1). During the freezing step, the pressure was set to 0.1 mbar. After the sample reached −45 °C, the sample was equilibrated for 5 min. Thereafter, the temperature was increased by 2 °C∙min−1 up to −25 °C and held for 90 min, while the pressure was kept constant at 0.1 mbar. Thereafter, the temperature was set at a rate of 10 °C∙min−1 at 20 °C. Then, the pressure was also set to ambient conditions.
Pictures were captured using reflected light and transmitted light during the cooling, freezing and drying steps. After the drying process and pressure release, a picture of the final product was taken.

2.7. Microwave-Supported Freeze-Drying

For the microwave-supported freeze-drying process, a µVac0150fd microwave dryer was used. For the process control, the drying plant was connected to a computer and software µWaveCAT (the hardware and software were both from Püschner GmbH & Co. KG, Schwanewede, Germany). We transferred 120 g foam into a 230 mm diameter sample glass and gently flattened it. The sample was frozen overnight at a −80 °C freezer (BF-U538, Buchner Labortechnik, Germany) before the drying process was started. The drying of samples was performed at 0.1 mbar and a microwave power input of 200 W. The surface temperature was measured using a pyrometer (Heitronics Infrarot Messtechnik GmbH, Wiesbaden, Germany) and set to a maximum temperature of 20 °C. The weight of the sample was recorded during the process with a scale, which was connected to the turntable. The drying process was stopped when no mass loss occurred during 10 consecutive minutes. The drying time was estimated after the drying process as the time difference between the start of the drying and 0.5% of the residual moisture. This value has been chosen because of the accuracy of the scale for low water evaporation rates. Finally, all drying runs resulted in the same residual water content of 4.5% and water activity of 0.05.

2.8. Determination of the Residual Water Content

The initial moisture content was gravimetrically measured using Smart Turbo 6 (CEM Corp., Kamp-Lintfort, Germany). For the determination of the water content of the dried samples, the Karl Fischer titration method [28] was used (Schott AG, Mainz, Germany). The analysis was conducted using automatic titrator Titro Line KF (Schott AG, Mainz, Germany). A 0.1 g dried sample was used for each measurement. All reagents used for the analysis were purchased from Sigma-Aldrich Inc. (Steinheim, Germany).

2.9. Determination of Water Activity

The water activity of the dried sample powder was determined at 25 °C using water-activity meter AW Sprint (Novasina AG, Lachen, Switzerland) with a sensitivity of 0.001 following practical hints described by Bell & Labuza [29], with modifications. Standard salt solutions (Novasina AG, Lachen, Switzerland) of known water activity were used for sensor calibration at the measurement temperature.

2.10. Determination of the Diffusion Coefficient

In addition to the measured water activity and water content, the effective diffusion coefficient Deff was calculated. The effective diffusion coefficient describes the intrinsic mass transfer property of moisture as described by Karathanos et al. [30]. It can be calculated using Fick’s second law (Equation (2)).
c t = D eff 2 c x 2
The equation was simplified for uniform initial moisture distribution (Equation (3)) and slab geometries (Equation (4)) by Crank [31]
MR ( t ) = MC x MC e MC 0 MC e
MR = 8 π 2 n = 1 1 ( 2 n 1 ) 2 exp [ ( 2 n 1 ) 2 π 2 D eff t 4 L 2 ]
where MR(t) is the moisture ratio at any drying time, MCX is the mean moisture content at the time t, MCe is the equilibrium moisture content, MC0 is the initial moisture content, Deff is the effective diffusivity and L the thickness of the sample. The calculated thickness of the samples can be found in Table 1. For long drying processes, Equation (4) can be simplified by only using the first term in the series equation and taking the natural log, which results in Equation (5) [32].
lnMR = ln 8 π 2 π 2 D eff t 4 L 2
With this, a plot of lnMR with respect to the time gives a straight line with a slope, which can be used to determine Deff (Equation (6)) [33].
K = π 2 D eff 4 L 2
where K is the slope of the logarithmic moisture ratio as a function of time. It was assumed that the drying of the sample occurs from both sides simultaneously. Therefore, the thickness L was divided by two [30]. As the microwave-supported freeze-drying has two drying sections, an average value was calculated out of the slopes of primary and secondary drying section. This was done in order to receive a value for the ability of water to leave the different product matrices with regard to the different product thicknesses and water contents. The primary drying sections refers mostly to sublimation, while in the secondary drying section, desorption and diffusion are limiting.

2.11. Statistical Analysis

For solution and foam characterization, three batches of each sample formulation were prepared and each sample was analyzed in duplicate. Thus, a six-fold determination was carried out. Two samples of each formulation were investigated using the freeze-drying microscope and microwave-assisted freeze-drying. The mean values were plotted in the diagrams and error bars indicated the standard deviation.

3. Results and Discussion

3.1. Microwave-Supported Freeze-Drying

Figure 2 shows that the required drying time decreased from 2.5 h with 10% maltodextrin (MD) content to 1.3 h for samples with 30% MD content. The dashed line is guide to the eyes and shows how the speed of drying changed with different carbohydrate content. The addition of more than 30% MD to the sample did not result in further acceleration of the drying process because a longer secondary drying stage due to the thicker lamellae of highly carbohydrate-concentrated samples was expected. Further, melting and macroscopic cracks occurred sometimes for carbohydrate concentrations above 30% MD content (data not shown), which indicated local overpressure and overheating during the drying process. It was assumed that the dielectric properties were not the reason for the crack formation, because the dielectric constant of frozen solutions (−20 °C, 2450 MHz) were generally very similar (10% MD 3.75 ± 0.43; 20% MD 3.64 ± 0.05; 30% MD 4.08 ± 0.13 and 40% MD 4.22 ± 0.03). With regard on high penetration depth of microwaves into ice, it should be mentioned that the microwaves are able to pass the sample several times and thus, the dielectric constant provided no explanation for the differences in the heating kinetics or required drying time.
A shorter drying time resulting from the MD addition was also reported by Ozcelik et al. [7] in microwave processing of raspberry foams. Similar to [7], a lower MD content was expected to exhibit higher overrun due to the lower viscosity, which was expected to yield higher diffusion coefficients because of lower mass transfer resistance. This can be explained by a more efficient water pathway due to the lower effective thickness of samples with high overrun. Figure 3 shows the apparent diffusion coefficient and the slope of the primary drying section as a function of the MD content. We could observe that the effective diffusion decreased with increasing MD content from 2.11 × 10⁻⁷ to 1.14 × 10⁻⁹ m2∙s−1, which is in accordance with results reported in the literature [33]. We assumed that the decrease in the water diffusion was a result of the thicker lamellae. Further, the slope of the primary drying section significantly increased above MD contents of more than 25%. This result could be due to the thinner product cake at lower overruns (Table 2), as well as the formation of cracks, which would be in accordance with the macroscopically observed cracks at the surface of the product cake. In order to be able to clarify which of these explanations apply, we will present results obtained by a freeze-drying microscope in Section 3.2.
A decrease in the effective diffusion with decreasing overrun was also reported by other researchers. Kadam and Balasubramian [11] and Thuwapanichayanan et al. [8] investigated the influence of different foaming agents on the drying behavior and obtained a high effect of the overrun on the texture and required drying time. In contrast to our study, in both aforementioned studies the lamellae remained still liquid, and therefore, an even higher effect of overrun on the diffusivity was expected. If one compares Figure 2 and Figure 3, the results appear as contradictive at first sight. However, this can be explained by the fact that smaller amounts of water have to be sublimated at higher the dry matter content (maltodextrin level). This results in a decreasing drying time, which here indicates that the total water content exerted a greater effect on the drying time than the water diffusion during the secondary drying stage. This can be also observed from the plot dm/dt over the drying process (see Supplementary Materials Figure S1): While samples with 10% MD showed slow but constant sublimation rate during the drying, samples with 40% MD first had a higher rate of sublimation but remained longer in a slower sublimation stage.
The temperature and moisture ratio of the samples are shown in Figure 4. Generally, the temperature overshot of approximately 5 to 10 °C at the end of the drying process. While for samples with 10–30% MD content, the temperature increased evenly during the drying process, the temperature of the samples with 40% MD content sample did not. Instead, the temperature largely increased in the middle of the drying process. Further, the surface temperature of the sample strongly varied, which can be observed by a higher amplitude. Both could be explained by the non-uniform heat distribution inside the sample and thus cracks appeared. These cracks made it possible to measure the hot temperature inside the sample and whereas the top of the sample surface remained comparably cold, the temperature changed with high frequency.
For MD contents below 30%, this non-uniform temperature distribution was not detected, as confirmed by optical analysis of the samples. None of the samples with MD content below 30% exhibited non-uniform structural changes. With regards to the moisture, samples with 10–30% MD content exhibited more uniform drying behavior than those with 40% MD content. Further, we could observe that in this example, the drying time was as long as for the sample with 30% MD content. This result could be explained by a certain overheating of the sample. The overheating occurred randomly and within single spots, which are a so-called hot-spots. While the power has to be reduced to prevent further product damage, other parts of the sample remained at low temperature. Therefore, the drying speed greatly decreased in the end of the drying as clearly shown in Figure 3, and the final drying time was about the same as for 30% MD concentration, which explains the larger standard deviation for MD = 40% in Figure 2. Samples below 40% MD content might also form hot-spots, but with non-observable intensity.
The reasons for the acceleration of the drying process between the samples with 10% and 30% MD contents and the constant drying time for samples with MD concentrations between 30% and 40% were investigated using a microscope that was operated under freeze-drying conditions.

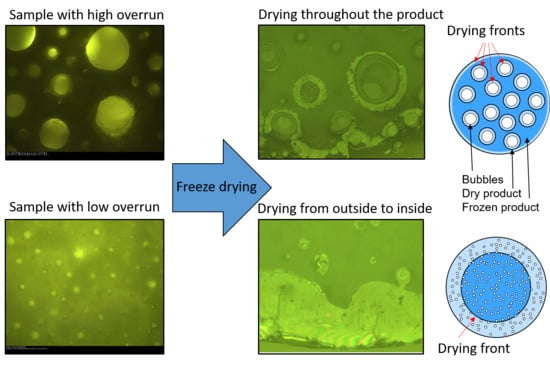
3.2. Freeze-Drying Microscope Results

The observation of the freeze-drying process inside the freeze-drying microscope was divided into five different sections: liquid foam, frozen foam, initial drying phase, mid of drying time and end of drying. Subsequent to the end of drying, the microscope was set back to ambient conditions and pictures of the final product were made. For each section, an out of single snapshots assembled picture of the transverse section was taken. In Figure 5, liquid foams are shown using transmitted-light microscopy. As a result of the different amounts of MD in the formulation, the viscosity varied, and thus, the bubble size varied from big bubbles at low carbohydrate concentration to small bubbles at high carbohydrate concentration. Bubble size d50 and the overrun value are listed in Table 2. A large reduction of bubble size and overrun could be observed with increasing MD content.
We could clearly observe that the bubble size decreased less with increasing MD concentration than the overrun did, which could be explained by the reduced number of bubbles in the highly viscous samples at high MD concentrations. Samples with 41% overrun are commonly not defined as real foam because their gas volume fraction is below 0.5 [34]. Therefore, these samples can be identified as bubbles in liquid, and we expect that their behavior is more similar to that of a liquid instead of that of a foam.
Further, the lamellae were shown to be thicker with increasing carbohydrate concentration, which also resulted in a darker appearance of photographs shown in Figure 5 from left to right because the light transmission was reduced with higher MD concentration. Less, but larger bubbles can be seen in Figure 5A, while bubble numbers go up and bubble sizes decrease from Figure 5A–E.
Figure 6 shows the different freeze-drying steps using transmitted-light microscopy. During the initial phase of drying, each bubble had its own drying front (Figure 6C), which can be observed by the dark color around the single bubbles. However, because of its dependency on the carbohydrate concentration, these fronts appeared to very slowly progress. Therefore, the pressure inside the small bubbles increases due to the sublimation of water (Figure 6C), until critical pressure that formed cracks was reached (Figure 6D,E). The reason for the increase in pressure was that because of the lack of free volume, no flow pathway existed for the sublimated water. Finally, the main drying front, directed from outside to inside the sample reached the high pressure areas and, together with the cracks and formed pores inside the lamellae, allowed the sublimated gas to leave the product.
This showed that the drying did not take place similar to that in a loosely structured porous bulk as described by Sochanski et al. [17], where the water was free to leave the product using the voids as channel. The issue then was how the water release happened in case of low carbohydrate concentration. Figure 7 shows a situation during the initial drying step that compared foam containing 20% and a 40% MD. By using reflected light, the already dried areas had a bright color, whereas the dark color indicated that the sample still contained water. We could clearly observe that for the lower MD content the water is primarily sublimated into the bubbles (Figure 7A), whereas for 40% MD content an additional clearly separated drying front moved from outside to the center of the foam (Figure 7B). This drying from outside in is more typical for the drying of solutions, as, e.g., observed by Yang et al. [35] and supported our prediction for low overrun foam systems.
For low carbohydrate concentrations of 10% and 20%, which resulted in more accessible volume inside the product, we expected that the drying fronts of the bubbles will combine (red arrow in Figure 7A), providing the water vapor a channel to leave the product. This is more comparable with the expected model from Sochanski et al. [17]. Further, in the secondary drying, we required that the structure, which remained after the drying in the lamellae, must contain open pores with a low water transfer resistance. If the structure is too dense, water might slowly diffuse out of the lamellae, which could lead to a longer drying duration. The foams that were stabilized by low carbohydrate content uniformly and simultaneously became dry across the whole product because of thin lamellae and big bubbles. In contrast, the foam with the high-MD-content behaved similar to a frozen liquid because of the thick lamellae, which remained closed and solid during the beginning of the drying process. This condition prevented a fast transfer of water vapor through the lamellae, resulting in overpressure and crack formation. Therefore, the pathway for the water vapor transfer varied according to the carbohydrate content or the foam properties. Wang et al. [18] investigated the foam-freeze drying of complex mannitol samples with a moderate solid content. They assumed that the drying front has to proceed throughout the product due to similar temperatures inside the sample at different positions during the first drying step. With our study, we are in agreement with this hypothesis for samples with 10–30% MD content. Nonetheless, the microscopically detected changes of drying behavior within our samples´ range show that further investigations of foam properties are necessary in order to identify the limitations of foam-freeze drying.
The final structures of the samples with 20% and 40% MD content are shown in Figure 8, which were assessed using transmitted-light microscopy. As a result of the dried MD, the lamellae displayed a dark color, whereas the cracks and air voids exhibited brighter colored parts of the product. Other researchers also observed indications of liquid-like behavior in their raspberry foam with low overrun samples [7], which indicated that the results were also valid for more complex systems.
We could observe that the lamellae were intact for the samples with 20% MD content, whereas at c(MD) = 40% cracks occurred. This result indicated that the water vapor pathway at low concentrations occurred through the lamellae, whereas for high MD concentration (40%), a higher pressure build-up must have occurred, because of the lower overrun and lower porosity, respectively (Figure 9). Thus, less volume is available to take up the water vapor and cracks were created as additional pathways for the water vapor. This agrees well with the results presented in Section 3.1. Generally, we observed that below a 25% MD content, no cracks occurred during the first drying stage. At 30% MD content, a few cracks were observed, and over 30% MD content, the samples exhibited massive crack formation.

4. Conclusions

Our study results show the cause of acceleration of the drying process due to the use of foam. For low carbohydrate concentration, a different pathway for the water vapor was found compared with that of the foam with high carbohydrate concentration was found. For low carbohydrate concentration, a simultaneous and uniform drying starting from the surfaces of the individual gas bubbles was observed across the whole product without any macroscopic channel or crack formation. The water vapor transfer occurred through the highly porous structure of dried lamellae. For high carbohydrate concentration, the thicker and denser lamellae resulted in higher water vapor transfer resistance. From this, it can concluded that this results in a higher inner bubble pressure and bubble sublimation temperature. Crack formation therefore occurs when the inner pressure becomes too high. The cracks acted similar to channels and enabled water transfer out of the product. These new insights provide a better scientific understanding of freeze-drying processes, which so far have only been phenomenologically observed. This is of relevance for a better process understanding of freeze-drying and product design in food and pharmaceutical applications and can be further used for process acceleration to allow for shorter drying processes. In future studies, the effect of other sugar types on the quality of sensitive ingredients that result in a change in physiological activity or storage stability will be investigated.

Supplementary Materials

The following are available online at https://0-www-mdpi-com.brum.beds.ac.uk/2227-9717/8/11/1463/s1, Figure S1: Sublimation rate of foams with MD content between 10–40%.

Author Contributions

Experimental investigation, P.K. and A.T.; data curation, P.K. and A.T.; writing—original draft preparation, P.K.; writing—review and editing, U.K. All authors have read and agreed to the published version of the manuscript.

Funding

This IGF Project of the FEI was supported via AiF 18819N within the program for promoting the Industrial Collective Research (IGF) of the German Ministry of Economic Affairs and Energy (BMWi), based on a resolution of the German Parliament.

Acknowledgments

We would like to thank Christian Hansen A/S (Copenhagen, Denmark) for providing the freeze-drying microscope. We also want to thank Prof. Petra Först at Technical University of Munich for her help with the freeze-drying microscope.

Conflicts of Interest

The authors declare no conflict of interest.

References

  1. Pikal, M.J. Freeze-drying of proteins. Part I: Process design. BioPharm 1990, 3, 18–27. [Google Scholar]
  2. Pikal, M.J. Freeze-drying of proteins. Part II: Formulation selection. BioPharm 1990, 3, 26–30. [Google Scholar]
  3. Flickinger, M.C. Downstream Industrial Biotechnology. In Recovery and Purification; Wiley: Hoboken, NJ, USA, 2013; ISBN 9781118131244. [Google Scholar]
  4. Schmitt, S. The Freeze Drying Challenge. Pharm. Technol. Eur. 2012, 24, 18-18. [Google Scholar]
  5. Ambros, S.; Dombrowski, J.; Boettger, D.; Kulozik, U. The Concept of Microwave Foam Drying under Vacuum: A Gentle Preservation Method for Sensitive Biological Material. J. Food Sci. 2019, 84, 1682–1691. [Google Scholar] [CrossRef] [PubMed]
  6. Huang, J.; Yang, Z.-H.; Zeng, G.-M.; Wang, H.-L.; Yan, J.-W.; Xu, H.-Y.; Gou, C.-L. A novel approach for improving the drying behavior of sludge by the appropriate foaming pretreatment. Water Res. 2015, 68, 667–669. [Google Scholar] [CrossRef]
  7. Ozcelik, M.; Ambros, S.; Heigl, A.; Dachmann, E.; Kulozik, U. Impact of hydrocolloid addition and microwave processing condition on drying behavior of foamed raspberry puree. J. Food Eng. 2019, 240, 83–91. [Google Scholar] [CrossRef]
  8. Thuwapanichayanan, R.; Prachayawarakorn, S.; Soponronnarit, S. Effects of foaming agents and foam density on drying characteristics and textural property of banana foams. LWT Food Sci. Technol. 2012, 47, 348–357. [Google Scholar] [CrossRef]
  9. Hajare, A.; More, H.; Pisal, S. Vacuum foam drying: New technology for preservation of sensitive biomolecules. Pharmatimes 2006, 38, 28–30. [Google Scholar]
  10. Ratti, C.; Kudra, T. Foam-mat drying: Energy and cost analyses. Can. Biosyst. Eng. 2006, 48, 27–32. [Google Scholar]
  11. Kadam, D.M.; Balasubramanian, S. Foam mat drying of tomato juice. J. Food Process. Preserv. 2011, 35, 488–495. [Google Scholar] [CrossRef]
  12. Ratti, C.; Kudra, T. Drying of Foamed Biological Materials: Opportunities and Challenges. Dry. Technol. 2007, 24, 1101–1108. [Google Scholar] [CrossRef]
  13. Ozcelik, M.; Heigl, A.; Kulozik, U.; Ambros, S. Effect of hydrocolloid addition and microwave-assisted freeze drying on the characteristics of foamed raspberry puree. Innov. Food Sci. Emerg. Technol. 2019, 56, 102183. [Google Scholar] [CrossRef]
  14. Lobo, F.A.; Nascimento, M.A.; Domingues, J.R.; Falcão, D.Q.; Hernanz, D.; Heredia, F.J.; de Lima Araujo, K.G. Foam mat drying of Tommy Atkins mango: Effects of air temperature and concentrations of soy lecithin and carboxymethylcellulose on phenolic composition, mangiferin, and antioxidant capacity. Food Chem. 2017, 221, 258–266. [Google Scholar] [CrossRef] [PubMed]
  15. Rajkumar, P.; Kailappan, R.; Viswanathan, R.; Raghavan, G. Drying characteristics of foamed alphonso mango pulp in a continuous type foam mat dryer. J. Food Eng. 2007, 79, 1452–1459. [Google Scholar] [CrossRef]
  16. Walters, R.H.; Bhatnagar, B.; Tchessalov, S.; Izutsu, K.-I.; Tsumoto, K.; Ohtake, S. Next generation drying technologies for pharmaceutical applications. J. Pharm. Sci. 2014, 103, 2673–2695. [Google Scholar] [CrossRef]
  17. Sochanski, J.S.; Goyette, J.; Bose, T.K.; Akyel, C.; Bosisio, R. Freeze dehydration of foamed milk by microwaves. Dry. Technol. 1990, 8, 1017–1037. [Google Scholar] [CrossRef]
  18. Wang, W.; Hu, D.; Pan, Y.; Zhao, Y.; Chen, G. Freeze-drying of aqueous solution frozen with prebuilt pores. AIChE J. 2015, 61, 2048–2057. [Google Scholar] [CrossRef]
  19. Davies, J.D. Freeze-Dried Foam Dosage Form. U.S. Patent 4,642,903, 17 February 1987. [Google Scholar]
  20. Wertheim, J.H.; Mishkin, A.R. Freeze Drying a Frozen Foam of Coffee Concentrate. U.S. Patent 4,565,706, 21 January 1986. [Google Scholar]
  21. Raharitisfa, N.; Ratti, C. Foam-mat freeze-drying of apple juice Part 2: Stability of dry producs during storage. J. Food Process Eng. 2010, 33, 341–364. [Google Scholar] [CrossRef]
  22. Muthukumaran, A.; Ratti, C.; Raghavan, V.G.S. Foam-Mat Freeze Drying of Egg White—Mathematical Modeling Part II: Freeze Drying and Modeling. Dry. Technol. 2008, 26, 513–518. [Google Scholar] [CrossRef]
  23. Liapis, A.I.; Bruttini, R. A mathematical model for the spray freeze drying process: The drying of frozen particles in trays and in vials on trays. Int. J. Heat Mass Transfer 2009, 52, 100–111. [Google Scholar] [CrossRef]
  24. Chitu, T.; Vessot, S.; Peczalski, R.; Andrieu, J.; Woinet, B.; Françon, A. Influence of Operating Conditions on the Freeze-Drying of Frozen Particles in a Fixed Bed and Modeling Data. Dry. Technol. 2015, 33, 1892–1898. [Google Scholar] [CrossRef]
  25. Trelea, I.C.; Passot, S.; Marin, M.; Fonseca, F. Model for Heat and Mass Transfer in Freeze-Drying of Pellets. J. Biomech. Eng. 2009, 131, 1301. [Google Scholar] [CrossRef] [PubMed]
  26. Pérez-Campos, R.; Fayos-Fernández, J.; Lozano-Guerrero, A.J.; Martínez-González, A.; Monzó-Cabrera, J.; Mediavilla, I.; Peña-Carro, D.; Esteban-Pascual, L.S. Permittivity Measurements for Cypress and Rockrose Biomass Versus Temperature, Density, and Moisture Content. Sensors 2020, 20, 4684. [Google Scholar] [CrossRef] [PubMed]
  27. Kreuß, M.; Krause, I.; Kulozik, U. Influence of glycosylation on foaming properties of bovine caseinomacropeptide. Int. Dairy J. 2009, 19, 715–720. [Google Scholar] [CrossRef]
  28. Fischer, K. Neues Verfahrens zur maßanalytischen Bestimmung des Wassergehalts von Flüssigkeiten und festen Körpern. Angew. Chem. 1935, 48, 394–396. [Google Scholar] [CrossRef]
  29. Bell, L.N.; Labuza, T.P. Moisture Sorption: Practical Aspects of Isotherm Measurement and Use, 2nd ed.; American Association of Cereal Chemists: St. Paul, MN, USA, 2000; ISBN 1891127187. [Google Scholar]
  30. Karathanos, V.T.; Villalbobos, G.; Saravacos, G.D. Comparison of Two Methods of Estimation of the Effective Moisture Diffusivity from Drying Data. J. Food Sci. 1990, 55, 218–231. [Google Scholar] [CrossRef]
  31. Crank, J. The Mathematics of Diffusion, 2nd ed.; Clarendon Press: Oxford, UK, 1975; ISBN 0198533446. [Google Scholar]
  32. Tutuncu, M.A.; Labuza, T.P. Effect of Geometry on the Effective Moisture Transfer Diffusion Coefficient. J. Food Eng. 1996, 30, 443–447. [Google Scholar] [CrossRef]
  33. Salahi, M.R.; Mohebbi, M.; Taghizadeh, M. Foam-Mat Drying of Cantaloupe (Cucumis melo): Optimization of Foaming Parameters and Investigating Drying Characteristics. J. Food Process. Preserv. 2015, 39, 1798–1808. [Google Scholar] [CrossRef]
  34. Wilson, A. Foams. Physics, Chemistry and Structure; Springer: London, UK, 1989; ISBN 978-1-4471-3809-9. [Google Scholar]
  35. Yang, G.; Gilstrap, K.; Zhang, A.; Xu, L.X.; He, X. Collapse temperature of solutions important for lyopreservation of living cells at ambient temperature. Biotechnol. Bioeng. 2010, 106, 247–259. [Google Scholar] [CrossRef]
Figure 1. Vertical cut of the heating/cooling unit inside the freeze-drying microscope.
Processes 08 01463 g001
Figure 2. Drying time of polysorbate 80 foams as a function of the maltodextrin content.
Processes 08 01463 g002
Figure 3. Effective diffusion coefficient (■) and slope of the primary drying section (▲) as a function of the maltodextrin concentration of microwave-supported freeze-drying (MWFD) dried samples.
Processes 08 01463 g003
Figure 4. Relative moisture ratio (decreasing curves) and temperature (increasing curves) during microwave-supported freeze-drying of polysorbate 80 foam with different maltodextrin contents.
Processes 08 01463 g004
Figure 5. Liquid polysorbate 80 foam with maltodextrin concentrations of (A) 20, (B) 25, (C) 30, (D) 35 and (E) 40% using transmitted light. The scale bar in (A) can also be applied to (BE).
Processes 08 01463 g005
Figure 6. Drying of a polysorbate 80 foam with 40% MD at different stages of the drying process: (A) liquid, (B) frozen, (C) early drying, (D) mid drying, (E) final drying. The scale bar in (A) can also be applied to (BE).
Processes 08 01463 g006
Figure 7. Different drying mechanisms of foams with (A) 20% and (B) 40% maltodextrin (MD) content, respectively, in the freeze-drying microscope during the first drying stage.
Processes 08 01463 g007
Figure 8. Dried polysorbate 80 foam with (A) 20% and (B) 40% maltodextrin contents.
Processes 08 01463 g008
Figure 9. Schematic pathway of water during the drying of samples with high and low overrun values.
Processes 08 01463 g009
Table 1. Calculated freezing rates and product thickness, L, for 120 g of foamed sample at the −80 °C freezer.
Concentration Maltodextrin, %Freezing Rate, °C∙min1Thickness of Samples, L, cm
10-4.90
202.52.16
252.51.37
303.50.85
356.00.60
407.00.34
Table 2. Bubble size d50 and overrun of polysorbate 80 foam at different maltodextrin concentrations.
Maltodextrin Content, %10203040
Bubble size, d50, µm553 ± 51202 ± 29102 ± 1458 ± 10
Overrun, %1671 ± 251715 ± 71233 ± 741 ± 3
Publisher’s Note: MDPI stays neutral with regard to jurisdictional claims in published maps and institutional affiliations.

