Article

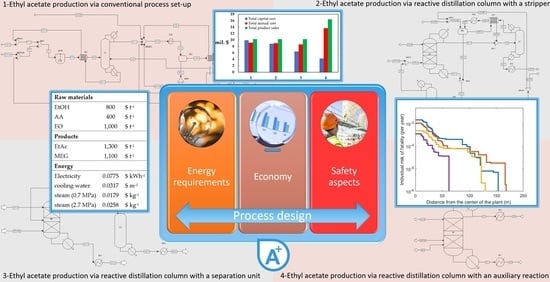
Multi-Aspect Comparison of Ethyl Acetate Production Pathways: Reactive Distillation Process Integration and Intensification via Mechanical and Chemical Approach

Institute of Chemical and Environmental Engineering, Faculty of Chemical and Food Technology, Slovak University of Technology in Bratislava, Radlinského 9, 812 37 Bratislava, Slovakia
*
Author to whom correspondence should be addressed.
Submission received: 14 October 2020 / Revised: 5 November 2020 / Accepted: 2 December 2020 / Published: 8 December 2020
(This article belongs to the Special Issue Process Intensification in Chemical Reaction Engineering)

Abstract

:
This paper provides a multi-aspect comparison of selected methods of ethyl acetate production and shows the possibility of further reactive distillation process integration and sophisticated intensification including process stream regeneration. The production pathways were selected with respect to their practical applicability and sufficient experimental and feasibility studies already published. A total of four case studies were designed and compared: conventional process set-up (ethyl acetate is produced in a chemical reactor) is designed as a base case study; reactive distillation with a separation unit is derived from the conventional process set-up. The mechanical and chemical approach to reactive distillation process intensification and integration were assumed: reactive distillation column with a stripper and reactive distillation column with an auxiliary chemical reaction (ethylene oxide hydration). Process models were compiled in the Aspen Plus software. Complex process flowsheets of selected case studies including separation and regeneration were designed and optimized. Three different points of view were applied to evaluate the selected process benefits and drawbacks. Process energy, economy, and safety were assessed. As a result, a reactive distillation column with an auxiliary chemical reaction has been proven to be the most suitable pathway for ethyl acetate production assuming all three evaluated aspects.

Graphical Abstract

1. Introduction

Ethyl acetate is known as one of the key organic solvents. It is widely used in various industries mainly due to its reasonable price, low toxicity, and suitable properties as a solvent [1]. Global consumption of ethyl acetate has been steadily increasing over the last decades [2]. At present, the world’s annual production capacity is estimated at 3 million tons, which increases due to the growing consumption of ethyl acetate expected in the following years. Therefore, it is necessary to intensify existing ethyl acetate production and to design new plants employing more efficient processes compared to the conventionally used ones.
The use of direct Fischer esterification is still the most commonly used method to produce ethyl acetate. Ethanol and acetic acid are used as reactants in the presence of an acidic catalyst. Other chemical paths for ethyl acetate production implemented on an industrial scale are based on ethylene acetylation or ethanol dehydrogenation respectively. However, these paths have been denoted as non-economic and even potentially dangerous [3]. Therefore, esterification is still preferred, especially due to the possibility of using different catalysts, the availability of raw materials from renewable sources, and the potential for process intensification [4]. At present, much attention is given to overcoming the limitations associated with the equilibrium esterification reaction; in particular, separation of azeotropic mixtures formed during the production process, distillation boundaries, by-product removal, energy consumption reduction, and improvement of process economy [5,6,7].
Several techniques are used to solve the separation of azeotropic mixtures containing water, ethyl acetate, and ethanol, for example, azeotropic distillation, pressure swing distillation, and extractive distillation. All these techniques are well known and the latest knowledge in this field including heat integration [8], thermal coupling [9], dividing wall columns [10], pervaporation modules [11,12], use of a new class of solvents (ionic liquids) [13,14] can be applied effectively. Although the separation of azeotropic mixtures is possible, high energy consumption and a high number of devices should be expected.
To overcome distillation boundaries and reduce energy demands and the number of equipment units, reactive distillation (RD) can be used [6]. The concept of RD combining simultaneous chemical reaction and separation in one unit has shown great potential in the production of esters [15,16]. Industrial-scale plants combining a reactive distillation column with a separation unit can be found all over the world [16,17]. However, even though RD itself has brought benefits compared to conventional production processes, it still shows potential for intensification. Taking RD to the next level of process intensification requires more advanced RD configurations allowing an additional range of operating conditions (not available in classic RD setups) [16]. Improvements can be achieved by physical, chemical, or mechanical methods [4,18]. Physical methods are based on improving the separation of reactive distillation products by adding a selective solvent (azeotropic reactive distillation (ARD), reactive extractive distillation (RED)), or by changing operation conditions (pressure-swing RD). The production of 2-phenylethyl acetate via azeotropic reactive distillation can be listed as an illustrative example [19]. Employing an auxiliary chemical reaction in the RD system is used as the chemical path of intensification. One by-product of the main reaction is consumed by the auxiliary reaction; another valuable product can be obtained. Reactive distillation with an auxiliary reaction (RDAR) is a very innovative method that can improve the main reaction and separation at the same time [4,20]. Mechanical ways of RD intensification are focused on the use of special internal equipment of columns to ease the separation (reactive distillation with a dividing wall (RDWC) and reactive distillation with pervaporation (RDPV)); which intensify the chemical reaction (special catalyst beds in case of a heterogeneous catalyst) [4]. Special attention is given to integrated columns with strippers (RDS), recompression of superheated vapor, etc. [18,21].

1.1. Current Ethyl Acetate Production Methods

Usually, the esterification reaction of acetic acid by ethanol is used to form ethyl acetate. The process composed of a continuous stirred tank reactor (CSTR) and several separation columns is reported as the most widespread ethyl acetate commercial production method [15]. At least three distillation columns are needed to separate the reaction mixture from the CSTR. First, unreacted acetic acid has to be regenerated—this separation is a high energy-consuming [4,15] and azeotropic distillation is recommended to reduce energy consumption in the first column [17]. One of the process products (ethyl acetate) is used as an azeotropic agent. A decanter has to be deployed to overcome the distillation boundary and thus allow separation of pure ethyl acetate in a second distillation column. The third column is usually used for water regeneration. Despite several options for columns and recycles integration, this process is energy-intensive [5]. Moreover, large recycles are used due to the distillation boundary and the equipment has also to be relatively large. Reactive distillation is used as the second method for ethyl acetate industrial production [16]. RD column, decanter, and two distillation columns are employed. A water-ethanol-ethyl acetate azeotropic mixture is obtained in the RD column and it is then separated in a similar way as in the conventional method. However, many other RD configurations have been tested at a laboratory scale, including all three of the above-mentioned ways of improvement and intensification [4]. The research has been mainly focused on RDWC [22]; RDAR [23,24]; RDS [4,18], and RED [25]. However, so far, only a classic RD column with a separation unit is used at the industrial scale. This is mainly due to the simplicity of design and control of this approach compared to integrated RD configurations [15,16]. However, with the advancement of process regulation and production design, it is clear that many production lines will be transformed into fully integrated RD processes [16,22] in the future.

1.2. Methodology

The main goal of this paper is the comparison of selected ethyl acetate production pathways and to point out the possibility of further reactive distillation process integration and sophisticated intensification including process stream regeneration. Three different points of view were applied to evaluate the selected process’s pros and cons. Process energy, economy, and safety are assessed. Comprehensive research has been accomplished to select case studies demonstrating more levels of process integration and intensification [4,16]. The production pathways have been selected with respect to their practical applicability (both present and future), to sufficient experimental and feasibility studies already published, and the intensification of reactive distillation via chemical and mechanical methods. As the base case study, a conventional process from [15,17] was adopted. Operation sequence according to Riemenschneider [1] consists of a continuous stirred tank reactor (CSTR) and several separation columns. A classic reactive distillation process design was used as the second case study because of its present practical industrial applicability [4]. Mechanical modification of RD is represented by the third case study where an RD column with a stripper (RDS) is used. The RDS process set-up is well known in the petrochemical industry. In the fourth case study, an auxiliary chemical reaction is included as a chemical modification of RD. Hydration of ethylene oxide is proposed as the auxiliary reaction. With this intensification method, ethyl acetate–water azeotrope is removed and pure ethyl acetate is separated at the top of the RD column [23]. In addition, another valuable product (monoethylene glycol) is obtained when the auxiliary reaction is included.
Process modeling was performed using the Aspen Plus software [26]. Reliable and complex models were compiled to evaluate and compare individual case studies. An important benefit of this work is the detailed design of all case studies including the rigorous non-equilibrium stage (NEQ) model of reactive distillation and separation columns. More accurate results are expected when using the NEQ model contrary to works where only the equilibrium stage model (EQ) is used [18,19,20]. Muthia (2018) has proved that the reactive distillation EQ model is useful in the process feasibility analysis [27]. However, RD partial processes can be overestimated by this model; namely separation efficiency and chemical reaction rate. In the EQ model, the separation efficiency has to be estimated and thus it can be overestimated as well as underestimated.
The chemical reaction rate is influenced by mass transfer; therefore it can be significantly overestimated [16,22]. Consequently, the equipment size is estimated incorrectly, and the energy consumption is often underestimated [28,29]. Therefore, the NEQ model should be preferred when assessing the economy and safety aspects [30,31].
Processes with uneven yield and poor recovery design have been compared previously [15,32]. Conclusions from these results have been confused because of incomplete process material balance and comparison of incomplete design of process schemes. Therefore, recycling of process streams and unification of case studies inlet and outlet streams have been included in this paper. With this improvement, reproducible comparison of individual case studies is achieved; ethyl acetate yield and water recovery problems are solved.

1.3. Process Sustainability Indicators

To evaluate the process efficiency and compare it with other alternatives, several indicators, which consider energy, economy, and safety aspects of all selected process alternatives, are used. A summary of evaluated indicators provides better insight into process sustainability.
Energy requirements of processes can be quantified by specific energy consumption (SEC) [5,15]. SEC is expressed by Equation (1). In addition to SEC, process material efficiency is evaluated using suitable indicators such as recovery, productivity, etc. Material efficiency can be excluded when using identical material inputs and outputs from the designed process in compared alternatives.
Total production cost (TPC) can be used as an economic indicator. TPC is expressed by Equation (2); total annual cost (TAC); total capital cost (TCC) and pay-back period are included. The price of the equipment together with its installation represents the main part of TCC. TAC is composed of fixed cost, utility cost, and raw materials cost [33]. Product sales are dependent on the actual market situation and therefore the price can be quite volatile. Consequently, the long-term average has to be considered. The profitability of the process is reflected in the payback period. Thus, the complex economy of the process is considered via TPC. On the other hand, a detailed analysis of individual economic indicators (TCC, TAC, utility cost, etc.) is needed to identify bottlenecks in the process.
Specific   energy   consumption   ( SEC ) = energy   consumption   ( kW ) mass   of   product   ( t )
Total   production   cost   ( TPC ) = TAC   ( $   year 1 ) + TCC   ( $ ) payback   period   ( year ) 1.1 × mass   of   product   ( t   year 1 )

1.4. Safety Indicators

Overall safety analysis in this work is based on the Chemical Process Quantitative Risk Analysis. To evaluate and compare the safety aspects of the presented alternatives, the individual risk estimation was performed for each case study. A large amount of frequency and consequence information generated during quantitative process risk assessment must be integrated into a presentation that is relatively easy to understand and use. The form of the presentation varies depending on the goal of the analysis. As the main goal of the presented work is to evaluate process efficiency and to compare it with other alternatives, the presentation of individual risk as a function of distance (individual risk profiles) was chosen, which is a simplification of the individual risk contour plot where two assumptions are used: risk source is compact (i.e., well approximated by a point source), and distribution of risk is equal in all directions. In the initials steps of conceptual design, the final distribution of risk is unknown and therefore the mentioned assumptions do not affect final results.
Calculation of individual risk assumes that contributions of all incident outcome cases are additive [34]. Thus, the total individual risk of fatality at geographical location x, y (IRx,y) is equal to the sum of individual risks of fatality at geographical location x, y from incident outcome case i (IRx,y,i):
I R x , y = i = 1 n I R x , y , i
where n is the total number of incident outcome cases considered in the analysis and each individual risk of fatality from incident outcome case i (IRx,y,i) is obtained from the frequency of incident outcome case i (fi) and the probability that incident outcome case i results in a fatality at location x, y (pf,i):
I R x , y , i = f i p f , i = F I p o , i p f , i
Calculation of frequency of incident outcome case i (fi) requires the evaluation of the frequency of incident I (FI) and the incident outcome probability (po,i). To estimate incident frequencies, the Fault Tree Analysis was used. Even Tree Analysis was used to quantitatively estimate the incident outcomes probability [34].

2. Process Modeling

2.1. Thermodynamic Model

A multicomponent model system is presented in this work. The basic model system contains ethyl acetate (EtAc), ethanol (EtOH), water (H2O), and acetic acid (AA); one case study is extended by ethylene oxide (EO) and monoethylene glycol (MEG). This system is strongly non-ideal. Two homogeneous binary azeotropes (EtOH–H2O, EtOH–EtAc), one heterogeneous binary azeotrope (EtAc–H2O), and one homogeneous ternary azeotrope (EtAc–EtOH–H2O) are reported in the literature [35,36] and databases [26]. Despite acetic acid forming no azeotropic mixture with other participating compounds, it is known for its strong association in the vapor phase and the formation of dimers [37]. Monoethylene glycol does not form an azeotropic mixture with other mentioned components. Unlike other components, ethylene oxide is a gas at room temperature [38]. For such a system, the NRTL-HOC thermodynamic model is highly recommended [15,22,28] as it is capable of calculating the VLLE (vapor–liquid–liquid phase equilibria) correctly including two liquid phases, azeotropic mixtures composition, and boing points, dimerization in the vapor phase. All the above-mentioned papers have shown simulation results to be in good agreement with experiment data. Moreover, reliable parameters for the NRTL-HOC model can be obtained from available databases (Aspen Plus [26], DECHEMA, NIST).

2.2. Kinetic Model

Mechanism and reaction kinetics of the esterification reaction of ethanol and acetic acid in the presence of acid catalysts has been studied in many works [1,39,40]. Three types of catalysis have been reported: autocatalysis, homogeneous catalysis, and heterogeneous catalysis. The reaction rate is low and achievable conversion is up to 20% at high residence times in the case of autocatalysis reaction [39]. Strong mineral acids, such as sulfuric acid and hydrochloric acid, are traditionally used as homogeneous catalysts [15]. High conversion, of up to 65.5%, is achieved in industrial applications using sulfuric acid [1] in the range from 0.2 to 1.0 volume percent of the reactive mixture [15,23]. Acidic ion exchange resins in various forms have been used as heterogeneous catalysts to increase conversion (slightly below 70%); however, no solid heterogeneous catalyst has been found to increase the reaction rate in favor of ethyl acetate production better than sulfuric acid [15]. High reaction rate, high conversion, and a smaller amount of catalyst are preferred from the industrial point of view. In addition, process set-up and equipment design are much easier in the case of homogeneous catalysis. On the other hand, equipment corrosion and catalyst recycling are major drawbacks of homogeneous catalysis with sulfuric acid.
In this work, homogeneous catalysis using sulfuric acid was assumed, Equation (5). The reaction rate (r [kmol m−3 s−1]) is expressed by Equation (6), which has been used in works [23,40]. The reaction occurs in the liquid phase; liquid phase molar concentrations (C [kmol m−3]) are used. The concentration of sulfuric acid catalyst was low [15,25], so its presence in the phase equilibria calculation was neglected.
As it was mentioned, an auxiliary chemical reaction was included to enhance the reactive distillation process in the last case study. This auxiliary reaction was chosen to ensure the removal of the main esterification reaction by-product—water. Ethylene oxide (EO) hydration was used, Equation (7). Monoethylene glycol (MEG) is produced as the main product of the auxiliary reaction. Further reactions towards higher glycols (diethylene glycol, triethylene glycol) were omitted because of lower reaction rate and negligible change in the composition of product streams [23,38,41]. The auxiliary reaction rate is expressed by Equation (8) [23,41].
Processes 08 01618 i001
r 1 = 2.8 × 10 4   exp ( 41 , 868 R T ) C A A C E t O H 7.1 × 10 3 exp ( 41 , 868 R T ) C H 2 O C E t A c
Processes 08 01618 i002
r 2 = 3.15 × 10 12   exp ( 79 , 374 R T ) C E O C H 2 O

2.3. Equipment Model

Aspen Plus V10 simulation environment provides several options to compile a process model. In this work, three main types of equipment models were used: chemical reactor, heat exchanger, and distillation column/reactive distillation column.
A chemical reactor is simulated by a model of continuous stirred tank reactor (CSTR) which assumes ideal mixing along with rate-controlled chemical reaction based on known kinetics. The reactor can be operated as an isothermal as well as an adiabatic one. The residence time parameter was used to achieve the desired conversion. Valid phases (liquid, vapor, vapor–liquid) for the chemical reaction were specified; in case of esterification (5), the chemical reaction rate is expressed by Equation (6) and takes place only in the liquid phase.
Heat exchangers were simulated by the Heater and HeatX models, respectively. A shortcut set-up was applied to reach the desired stream temperature. Heat integration was applied to improve the optimal process design. The minimum stream temperature difference was set to 10 °C.
A Rigorous RadFrac column model was used for RD modeling as well as for conventional distillation. This model allows both EQ and NEQ approaches. Building an NEQ model of reactive separation or separation is not as straightforward as it is in the EQ model. The NEQ model requires much more reliable parameters compared to the EQ model. Consequently, the NEQ model is more difficult to calculate and convergence problems often occur. To improve NEQ model convergence, a good initial guess of stage temperature, liquid phase composition, and vapor phase composition have to be used. For this purpose, the EQ model of each column was made in the first step of the simulation using initial column parameters such as the number of theoretical stages (N), reactive zone (NR), feed stage position (f), reflux ratio (R). These parameters can be found in the literature [5,15]. Results of the EQ model simulation provide a very good starting point for building the NEQ model [19,27]. Another advantage of first building the EQ model is the possibility of faster testing of individual case studies [28]. When the suitable case study concept is selected, the NEQ model is built based on the EQ model results.
Rate-based set-up must be enabled in the Aspen Plus [26] in the NEQ model. Therefore, detailed column internal configuration is required next. A packed column is selected similarly to simulation-experimental works [22,28]. Mass and heat transfer correlation methods were selected according to the recommendation for the packing type (Rashing Ralu-Ring). Column hydraulics was simulated by Aspen Plus built-in hydraulic function assuming correlation for Rashing Ralu-Ring packing type. Column internal configuration (internal diameter (d), packing height (H), packing dimensions) were set during the calculation procedure with regard to reasonable column hydraulics, pressure drop, and approach to flood.
In the case of an RD column, the chemical reaction rate is expressed by Equations (6) and (8). A homogeneous catalyst (sulfuric acid) is fed to the column together with acetic acid [17,23]. The esterification reaction (5) is enabled in the reactive zone (NR) only, where acetic acid is presented. On the other hand, the hydration reaction (7) is enabled in the whole RD column because ethylene oxide reacts with water whenever they meet in the liquid phase. All the above-mentioned column parameters (N, NR, f, R, d, H…) were optimized to meet the design criteria of individual columns as well as of the whole process.

2.4. Simulation Strategy and Design Specification

Global simulation strategy is focused on minimizing the number of process units within maximal raw material utilization and minimal energy consumption.
The separation sequence is designed to separate the component with the highest boiling point (or to consume it by a reaction); solve energy-intensive separation (azeotropic distillation, decanter with recirculation), and to regenerate other process streams (EtAc aqueous solutions). Process integration and intensification were based on a conventional process case study. Other case studies (RD column with a separation unit, RD column with a stripper, and RD column with an auxiliary reaction) were derived from the base one. Also, heat integration was considered in all case studies.
The following initial input specifications were entered for all case studies: equimolar raw material input (10 kmol h−1 of both ethanol and acetic acid); process inlet and outlet streams temperature of 25 °C; atmospheric pressure.
Process design specifications were defined to produce 10 kmol h−1 of pure ethyl acetate (99.9 mol.%), prevent ethyl acetate loss in other product streams (full EtAc recovery), separate process by-products (water or monoethylene glycol) in equimolar ratio to the main product (EtAc). Moreover, the total conversion of all reactants was attempted. Process parameters were optimized while maintaining fixed design specifications. The optimization was based on minimizing vapor flows in the individual columns. Subsequently, the economy and safety parameters were evaluated.

3. Simulation Results

3.1. Conventional Process Set-Up

Most ethyl acetate production plants apply the process described by Riemenschneider (2008) [1,17] which consists of a continuous stirred tank reactor (CSTR) and several separation columns. Even though the capacity of large plants can be up to about 100,000 tons of EtAc per year [2], this process is problematic and inefficient for several reasons [15], separation of the reaction mixture from the CSTR reactor being the main problem. As is mentioned in Section 2.1, the azeotropic mixture is formed during the separation. Moreover, separation of unreacted acetic acid is an energy-intensive process, even in large distillation columns. Overcoming the distillation boundary to produce pure EtAc is reported as the next issue. A decanter is most often used for this purpose adding a certain amount of pure water to obtain an organic (EtAc rich) and an aqueous phase. Losses of ethyl acetate in the aqueous phase and the regeneration of used water have also to be solved. Thus, high recycle flows and large energy consumption of this process are inevitable.

3.1.1. Flowsheet Design (Figure 1)

The conventional set-up consists of four key equipment units. Esterification reaction proceeds in a CSTR reactor, which is followed by an azeotropic distillation column and two conventional columns. Detailed flowsheet with streams attachment is depicted in Figure 1. Raw material streams (AA0 and ETOH0) are mixed with recycled streams and lead to the adiabatic CSTR reactor (R1). As the esterification reaction conversion is slightly over 60%, the reaction mixture contains four compounds (acetic acid, ethanol, water, and ethyl acetate). Reactor products stream (P1) is then preheated in heat exchanger EX1. This mixture is separated in azeotropic distillation column C1 (Figure 1) which has two feed streams: reaction mixture from the CSTR (P2) and pure ethyl acetate (AZ) used as azeotropic distillation entrainer. The bottom product (W11) contains unreacted acetic acid and water, and it is recycled back to the CSTR. The water-ethanol-ethyl acetate azeotropic mixture is obtained as a distillate (D11). Pure water is added to overcome the distillation boundary and the mixture (D12) is cooled down in heat exchanger EX2. The water phase (H2OL) and organic phase (ORG) are separated in decanter DEC (Figure 1). The organic phase contains mainly ethyl acetate. Pure ethyl acetate is separated in distillation column C2 as a bottom product (W21). A part of pure ethyl acetate flow is recirculated as the azeotropic entrainer (AZ) back to column C1. The final product (W22) is cooled down in heat exchanger EX7. The C2 column distillate (D21) contains a ternary mixture of water, ethanol, and ethyl acetate; it is cooled down in C2 preheater EX3 and recirculated back to the decanter. The water phase (H2OL) is rich in unreacted ethanol; thus, it is regenerated in distillation column C3 (Figure 1). The C3 column feed (F31) is preheated in two heat exchangers: EX4 and EX5. Pure water (W31) is obtained as the C3 column bottom product and concentrated ethanol-water mixture is separated in distillate (D31) which is cooled down in EX4 and recirculated back to the CSTR. The bottom product (W31) is cooled down in EX5 and then divided into water final product stream (H2OP1) and water for recirculation back to the decanter (H2OREC)

3.1.2. Process Simulation Results & Equipment Parameters of Conventional Process Set-Up

Process simulation of the material balance of the conventional process depicted in Figure 1 is listed in Table 1. Energy and economy aspects are discussed in Section 4.1 and Section 4.2, respectively.
The CSTR (Figure 1) reactor is designed as an adiabatic one with a residence time of 200 min [15]. The esterification reaction is described by reaction kinetics, Equation (6). Lower acetic acid conversion is achieved compared to that reported in the literature (53.0% compared to 63.0%). This is caused by the connection of recycled streams (D32, W12) in which, in addition to EtAc, water is present. Therefore, conversion in the CSTR reactor is slightly shifted towards the reactants side. The volume of the liquid phase in CSTR is calculated to be 8.9 m3.
Separation of unreacted acetic acid is the primary function of the C1 column (Figure 1) employing azeotropic distillation to make this process easier and less energy-intensive. No azeotropic agent selection was done as a suitable agent (EtAc) is produced in the process directly. The ratio of recirculated (AZ) and produced EtAc (W22) is set to 1. Such an amount of recirculated EtAc is sufficient to ensure desired C1 column specifications at reasonable energy demands. If the ratio is below 0.8, azeotropic distillation does not run. As EtAc forms a ternary azeotrope with water and ethanol at the lowest boiling temperature in the system, separation of AA in the bottom product (W11) is possible. Total recovery of AA in the bottom product (W11) is required (less than 0.001 mol.% of AA is allowed in the distillate (D11)). The desired purity of AA (W11) was set to 70 mol.% based on recycle flow (W11) and energy consumption optimization. Consequently, the C1 column reboiler temperature was below 100 °C. Also, column hydraulics is an issue due to different liquid flows in the rectifying and stripping section, which is caused by two feed streams and process intensification via azeotropic distillation. Therefore, two packing diameters (25 mm and 35 mm) are used within one column diameter (1.0 m). Designed C1 column parameters are listed in Table 2.
The next important separation step takes place in the decanter. Water to ethyl acetate mole flow ratio in the stream (D13) is a crucial parameter of the decanter in overcoming the distillation boundary and thus allowing separation of pure EtAc. The ratio was set to 4.1 and therefore the EtAc concentration increased from 56.6 mol.% (D11) to 76.7 mol.% (ORG), Table 1. EtAc recovery in the decanter of over 90% was achieved, which is common in the separation of two liquid phases [5,22].
Distillation column C2 (Figure 1) is designed for pure EtAc (99.9 mol.%) separation, which is a highly energy consuming process as EtAc–EtOH–water ternary azeotrope is formed in the distillate (D21) and it has to be recirculated back to the decanter. To obtain 20 kmol h−1 of pure EtAc in the C2 bottom product (W21), more than 41 kmol h−1 of organic phase flow (ORG) from the decanter is needed and thus only 63.2% EtAc recovery can be achieved in the C2 column due to the distillation boundary and the azeotrope composition. A high reflux ratio is also required because the ternary azeotrope and pure ethyl acetate boiling point temperature are close. Designed C2 column parameters are listed in Table 2.
The aqueous phase from the decanter (H2OL) contains also ethanol and ethyl acetate. A part of this mixture is recirculated back to the decanter directly (BYPASS) as the water content is above 90 mol.%. Into the decanter (DEC), a maximum of 20% of the aqueous phase stream (H2OL) can be directly recirculated, the remaining part of the aqueous phase has to be regenerated in distillation column C3 (Figure 1). The C3 column is designed to separate pure water as a bottom product (W31) and distillate containing all remaining ethanol and ethyl acetate (D31). Column design specifications are set for total EtOH recovery in the distillate and 99.9 mol.% purity of water in the bottom product. Designed C3 column parameters are listed in Table 2.

3.2. Reactive Distillation Column with a Separation Unit

Integration and intensification of the convention process set-up can be achieved by combining reaction and separation together via the reactive distillation process. Several RD plants for ethyl acetate production are operated worldwide with the reported individual plant annual production capacity of around 20,000 tons of EtAc [4,15]. As RD is a multifunctional reactor concept combining the mechanism of reaction and separation in one single unit, benefits such as the reduction of equipment and plant size, improvement of process efficiency, and, consequently, better process economy are expected [19]. In this case study, the main benefit expected is the reduction of the number of equipment units and overcoming the distillation boundary which limits the conventional set-up. CSTR, EX1, and C1 columns are put together into an RD column. As a result, one main equipment unit (CSTR) and two heat exchangers are removed from the process compared to the conventional set-up (Figure 1).

3.2.1. Flowsheet Design (Figure 2)

The reactive distillation set-up is derived from the conventional one (Figure 1). Reaction and separation are put together in one column (compare to three equipment units: CSTR, EX1, and C1, in Figure 1). A detailed process scheme is depicted in Figure 2. The reactive distillation column has two feed streams: acetic acid feed (AA0) and mixed ethanol feed (ETOH). Raw ethanol is added to the process in the (ETOH0) stream. All acetic acid is consumed in the RD. Therefore, RD distillate (D11) contains a nearly azeotropic mixture of EtAc-EtOH-water, while the bottom product (W11) contains a water-ethanol mixture (Figure 2). The distillate composition was from a different distillation region than that of distillate in the conventional process set-up (D11 in Figure 1). Therefore, stream (D11 in Figure 2) can be separated directly. Distillation column C1 is deployed to separate the final pure EtAc (Figure 2). The C1 column bottom product (W21) contains pure EtAc which is cooled down in heat exchanger EX5. The EtAc-EtOH-water ternary azeotrope is present in the C1 column distillate (D21 in Figure 2) Thus, columns C1 column (Figure 2) and C2 in conventional process set-up (Figure 1) are operated in the same way. The distillate (D21) is cooled down in heat exchangers EX1 and EX2 and fed into decanter DEC to extract EtAc (Figure 2). Pure water is fed to DEC; organic phase (ORG1) and aqueous phase (H2OL) are separated. The organic phase (ORG1) is preheated in EX1 and mixed with (D11). The aqueous phase (H2OL) contains some amount of EtOH and EtAc and therefore it has to be regenerated. The (H2OL) stream is mixed with the RD column bottom product (W11) and preheated in heat exchanger EX3 (Figure 2). For water regeneration, distillation column C2 is used (Figure 2). All EtOH and EtAc are obtained in the C2 distillate (D31) which is recirculated back to the RD column. Pure water is separated in the C2 bottom product (W31) and it is cooled down in EX3 and EX4 (Figure 2). An equimolar ratio of water to EtAc product (W22) is separated (H2OP) as a final by-product and the rest of the water is recirculated back to the decanter (H2OREC).

3.2.2. Process Simulation & Equipment Parameters of Reactive Distillation Column with a Separation Unit

The reactive distillation column was designed according to the philosophy described in Section 2.3 and Section 2.4. However, column operating conditions are different. As the esterification reaction (5) proceeds, reactants conversion (acetic acid, ethanol) has to be considered. From an energetic point of view, consumption of all acetic acid is the most advantageous as no acetic acid is present in the distillate or the bottom product of the RD column (Figure 2). To achieve total acetic acid conversion (xD11(AA) = 10−5, xW11(AA) = 10−5), the RD column parameters were optimized including: acetic acid feed (fAA) and ethanol feed (fEtOH) position; reflux ratio (R); number of theoretical stages (N). The reactive zone (NR) is introduced from fAA to a reboiler. However, if the NEQ model is used to simulate the RD column, the packing height (H), column internal diameter (d) as well as the packing type are crucial parameters. Moreover, RD column hydraulics is limited by the reflux ratio with regard to design specifications. At reflux ratios below 2, AA is present in the distillate; on the other hand, at reflux ratios above 3.5, a part of the column is flooded and total AA conversion cannot be achieved. Final RD column design parameters after the optimization are listed in Table 4.
Separation of pure EtAc is performed in distillation column C1 (Figure 2) designed in the same way as the C2 column in the conventional set-up (C2 in Figure 1). The ethyl acetate purity of 99.9 mol.% in the bottom product (W21) is set as the design criterion. Designed column (C1 in Figure 2) parameters are listed in Table 4. Overheated vapors from the C1 column contain almost 54 mol.% of EtAc (Table 3) which is extracted in decanter DEC (Figure 2). The same amount of water is added to DEC as in the conventional process (Figure 1). The separated organic phase (ORG1) contains 75.5 mol.% of EtAc and the overall EtAc yield in DEC is 90%.
The aqueous phase from decanter (H2OL) as well as the RD column bottom product (W11) are regenerated in the C2 distillation column (Figure 2) employed for total EtOH recovery. This separation is direct as pure water can be obtained in the bottom product (W31) and ethanol-water mixture in the distillate (D31). The optimum ethanol content in the distillate is determined to be 62 mol.%. Energy requirements are acceptable at the reflux ratio of 2.58, and the EtOH regeneration proceeds properly. The separation results and internal geometry of the C2 column are listed in Table 4.
The material balance of the whole process simulation is presented in Table 3. Energy and economy aspects are discussed in Section 4.1 and Section 4.2, respectively.

3.3. Reactive Distillation Column with a Stripper

Even though the RD column with a separation unit (Figure 2) represents process integration and intensification compared to the conventional set-up (Figure 1), there is still a place for improvement such as the reduction of the large flow of the recycled stream to the decanter or reduction of equipment number. As the reaction in the RD process has overcome the distillation boundary, it is possible to remove the decanter and to solve azeotropic mixture regeneration via distillation. Also, the ethanol-water mixture from the RD column (W11 in Figure 2) can be easily separated into pure water (high boiling point) and ethanol-water mixture at high ethanol concentrations. Therefore, the flowsheet of the RD column with a separation unit (Figure 2) was modified: C2 column is integrated into the bottom part of the RD column; decanter and heat exchangers EX1 and EX2 are removed; C1 column condenser is removed and overheated vapors from C1 are recirculated back to the RD column (Figure 3). Thus, the process scheme in Figure 3 contains two columns and three heat exchangers less than the process scheme shown in Figure 2.
The main idea of such integration is based on the thermal coupling. Two columns are thermally coupled if a vapor (liquid) stream is sent from the first column to the second one and then a return liquid (vapor) stream is set between the same columns. These streams, when introduced at the top or bottom of a column, provide (at least partial) reflux or boil-up to this column [42]. This approach is commonly used in the petrochemical industry [43,44].

3.3.1. Flowsheet Design (Figure 3)

This process set-up is composed of two columns: reactive distillation column RD and stripper column C1 (Figure 3). The reactive distillation column has three feed streams: (AA0) consists of pure acetic acid and is led to the upper section of the RD column; (ETOH0) contains pure ethanol and is attached to the bottom section of the RD column; and overheated vapors (AZ1) from stripper C1 fed in the middle of the RD column (Figure 3). The RD column has two product streams: liquid distillate (D1) brought to the head of stripper C1; liquid bottom product (W11) which is cooled down in heat exchanger EX1. The stripper column has only one product stream (W21), which is cooled down in heat exchanger EX2.

3.3.2. Process Simulation and Equipment Parameters of Reactive Distillation Column with a Stripper

The main task in designing an RD column with a stripper (RDS in Figure 3) is to ensure total conversion of acetic acid in the RD column. Thus, no acetic acid should be present in the distillate or bottom product, the same as in the RD column with a separation unit concept (Figure 2). To meet this requirement, a high number of theoretical stages, suitable position of feed stages, proper RD column reflux ratio, and amount of recirculated vapors have to be considered. In contrast to the RD column with a separation unit (Figure 2), in the case of an RD column with a stripper (Figure 3), three feed streams are attached: two subcooled liquid streams and one overheated vapor stream (AZ1 in Figure 3). Composition of the (AZ1) stream is expected to be close to the azeotropic mixture EtAc-EtOH-water) and therefore is the (AZ1) stream feed stage (fAZ1) located in the middle part of the main RD column, between the acetic acid feed stage (fAA0) and the ethanol feed stage (fEtOH0). Acetic acid conversion is significantly affected by a change of fAZ1. If fAZ1 is attached above fAA0, the RD column does not work at all as the high amount of ethanol in (AZ1) stream cannot be consumed in the reaction (5). On the other hand, if fAZ0 is attached below fEtOH0, the esterification reaction (5) is slowed down because of an excess of its products (EtAc and water) in the stripping section of the RD column. The reflux ratio is calculated based on the design specification (xD1(AA) = 10−5); however, it is also significantly influenced by stripper C1. Intense recirculation of overheated vapors leads to partial boil-up in the RD column while the RD column distillate (D1 in Figure 3) leads to liquid reflux of stripper C1. The vapors flow (AZ1 in Table 5) is the key process parameter along with the feed stage position (fAZ1). At least 130 kmol h−1 of overheated vapor are needed to operate the process successfully. At lower vapor flow, desired product purity (xW11(H2O) = 0.999 and xW21(EtAc) = 0.999) cannot be achieved either in the RD column or in the C1 striper. A slightly higher amount of recirculated vapors (135.5 kmol h−1, see Table 5) is used to ensure process stability and reasonable column hydraulics.
As stated above, various vapor flows occur in the RD column and a different column design is required when overheated vapor stream feed is present. Consequently, a RD column with two different diameters is used; wider column internal diameter is used in the upper section (d1 = 1.15 m) compared to the bottom section (d2 = 0.65 m). Sections are divided by the (AZ1) feed stream. Detailed results are presented in Table 6.
The design of the C1 stripper column (Figure 3) is similar to that of columns for EtAc separation in previous case studies (C2 column in the conventional set-up (Figure 1) and C1 column in the RD column with a separation unit (Figure 2) but without the column condenser. Therefore, the C1 stripper column is composed of a column tower and a reboiler only. The C1 column (Figure 3) liquid reflux is directly dependent on the RD column distillate flow (D11). Some differences in the column geometry can be observed compared to the previous case studies. Column diameter and overall packing height increased due to the larger flow. The column parameters are listed in Table 6.
Complete material balance of RDS (Figure 3) is presented in Table 5. Energetic aspects of the RDS configuration are discussed in Section 4.1 in more detail.

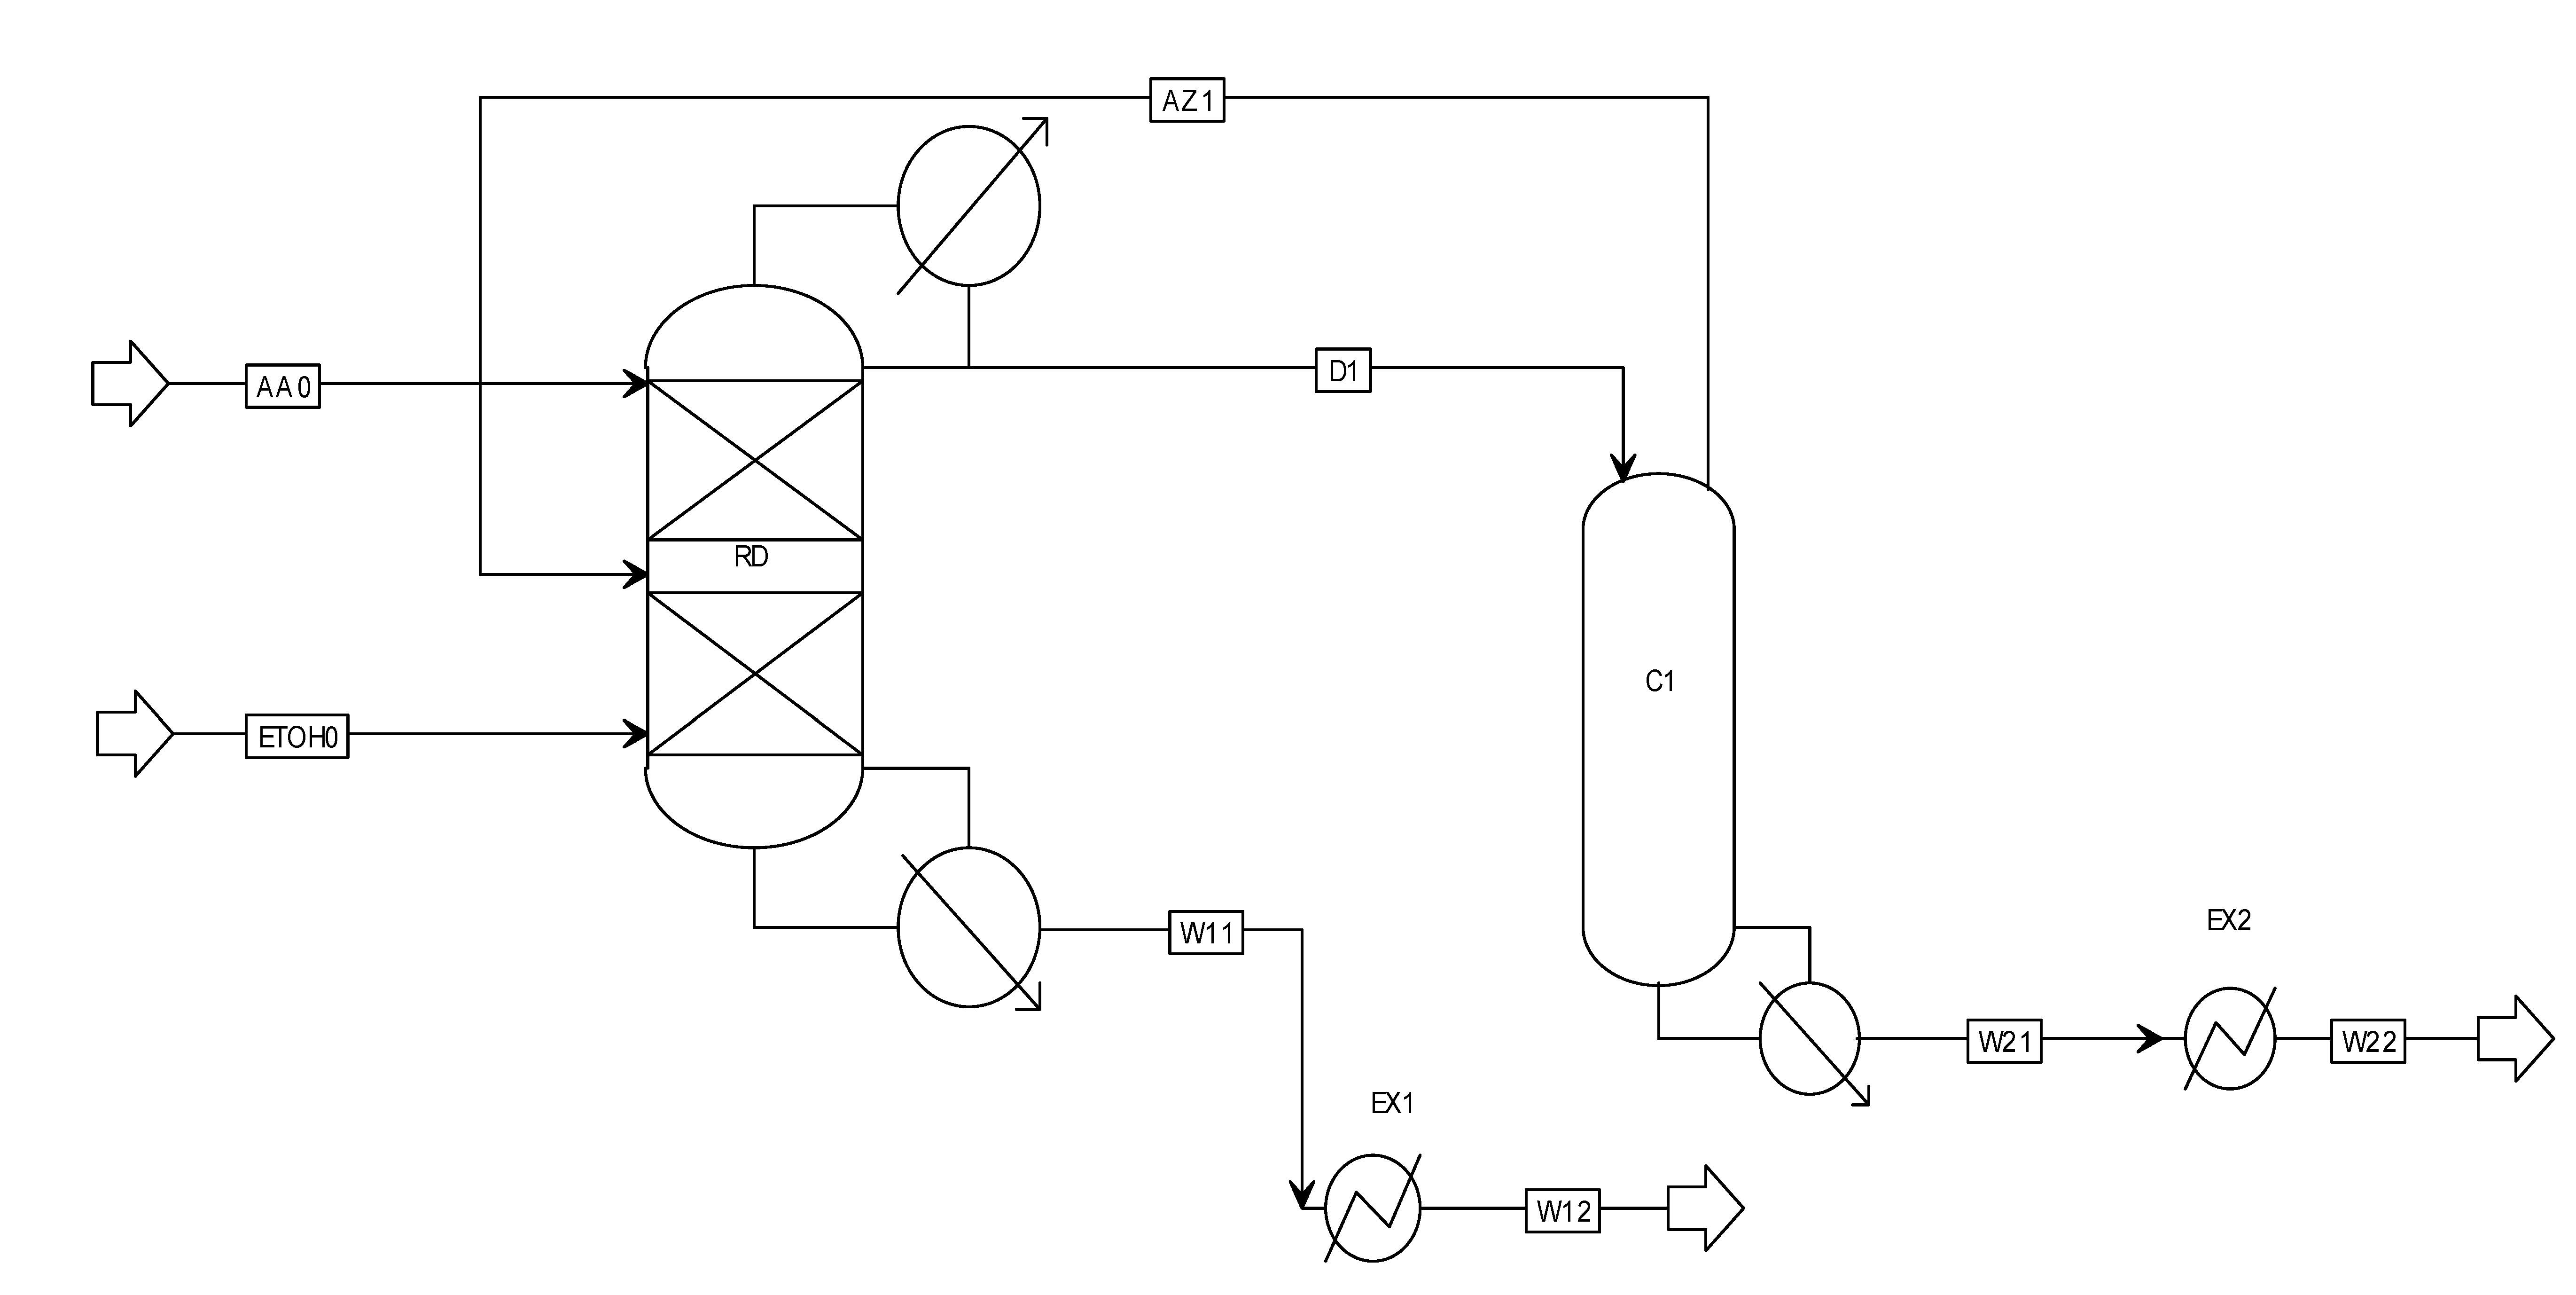
3.4. Reactive Distillation Column with an Auxiliary Reaction

The RD column with a stripper set-up (Figure 3) has reduced the number of equipment units significantly compared to the conventional process set-up (Figure 1) and the RD column with a separation unit (Figure 2). Further process integration and intensification is limited by the presence of water. As the ternary azeotrope EtAc-EtOH-water is formed, at least two columns (RDS) are needed for its separation. Moreover, equilibrium esterification reaction (5) conversion is suppressed by the increasing concentration of products. Therefore, the removal of water as a by-product is attempted to intensify the process and reduce the number of equipment units.
Water can be consumed by an auxiliary chemical reaction [23]. If Ethylene oxide (EO) hydration is applied as the auxiliary chemical reaction; the ternary azeotrope is removed and another valuable product, monoethylene glycol (MEG), is obtained. The idea is derived from industrial glycol production. An RD column with total reflux and selective ethylene oxide hydration is used to obtain the desired glycol in the RD column bottom product [38,41].
Such an innovative approach was first tested by Tavan [23] who used the simulation environment of Aspen HYSYS. However, inaccurate results can be obtained because of the presence of acetic acid. The Aspen Plus software is more suitable for the simulation of processes with organic acids as its built-in thermodynamic model NRTL-HOC, omitted in HYSYS [26], can be used. In this paper, a rigorous NEQ model of the RD column has been build and the RD column internals have been designed in more detail providing more accurate simulation results compared to the EQ model used by Tavan [23].

3.4.1. Flowsheet Design (Figure 4)

The last flowsheet contains only one column (Figure 4) with three feed streams: raw acetic acid (AA0) is fed to the top section; raw ethanol (ETOH0) is fed to the middle section and pure ethylene oxide (EO) is fed to the lower part of the RD column. As this set-up is fully integrated and intensified, there are two product streams only: distillate (D1) contains pure EtAc and bottom product (W1) contains monoethylene glycol. Both product streams are cooled down in heat exchangers EX1 and EX2, respectively (Figure 4).

3.4.2. Process Simulation and Equipment Parameters of Reactive Distillation Column with Auxiliary Reaction

The design and simulation of the RD column with an auxiliary reaction (RDAR) are depicted in Figure 4. Despite the simplicity of the material balance of the overall system (Table 7), complex optimization is required to meet the design criteria (xD1(EtAc) = 0.999, xW1(MEG) = 0.999). Feed stage position of inlet streams (fAA, fEtOH, fEO), reflux ratio (R), and column internal design (d, H) are the key parameters.
Two chemical reactions are employed: esterification reaction (5) takes place from fAA to RD column reboiler (NR1), and hydration (7) in the whole column (NR2).
The acetic acid feed stage (fAA) is located in the upper section of the column; the ethanol feed stage (fEtOH) is located at the bottom of the RD column like in all previous case studies. The ethylene oxide feed stage (fEO) has to be placed so that water is rapidly consumed by the auxiliary reaction. Based on previous case studies, the highest water concentration is under fEtOH. Therefore, fEO is attached at the bottom of the RD column, Table 8. If the (EO) stream is attached above fAA or between fAA and fEtOH, a large amount of EO passes into the distillate and its conversion is very low. The hydration reaction (7) is much faster than esterification (5), however, hydration proceeds in the liquid phase only. Therefore, EO (gas) diffusion to the liquid phase is the process rate limiting factor. The diffusion rate is influenced by several aspects; however, the key one is the column hydraulics. If the EO feed stage is attached to the upper part of the column, the column can operate with high residence time and at a high reflux ratio only, which is not economical, and obtaining the desired product purity is also questionable.
The desired purity of the final products can be achieved by changing the reflux ratio (R). However, the range of the reflux ratio values is limited by column hydraulics and convergence stability. At reflux ratios below 2, a part of the column packing dries up due to insufficient liquid flow in the rectification section while at reflux ratios above 4.2, the process simulation convergence is unstable. This may indicate multiple steady states as this behavior is well known from the production of glycols by hydration [41].
In this case study, total conversion of all reactants (AA, EtOH, and EO) is ensured by high packing height (H) to ensure high separation efficiency, and small packing diameter (25 mm and 15 mm RALU-RING) to increase the residence time, Table 8. Multidiameter column design is used because of various vapor and liquid flows present in the RD column sections. Detailed RD column parameters are listed in Table 8.
The complete material balance of RDAR (Figure 4) is presented in Table 7. Energetic aspects of the RDAR configuration are discussed in Section 4.1 in more detail.

4. Discussion

4.1. Energy Requirements of Individual Case Studies

Energy consumption of individual equipment units is calculated based on the simulation results. Reboiler duty ( Q ˙ W ) and condenser duty ( Q ˙ C ) of each column are evaluated as well as the cooling duty of heat exchangers including heat integration. Overall energy consumption (OEC) is calculated as a sum of required heating or cooling duties respectively; heat integration is excluded. To better compare individual case studies, OEC is normalized to the specific energy consumption (SEC, Equation (1)), which is related to the production of one ton of pure EtAc. Summary results of energy requirements are listed in Table 9.
The conventional process set-up (Figure 1) has three distillation columns in which both reboiler and condenser are included. Thus, a highly energy-intensive process is expected. Distillation column for water regeneration C3 consumes almost 550 kW of heat, which represents 18.4% of the total heat duty required in whole the conventional path (Figure 1). However, the column for separation of unreacted acetic acid C1 and that for EtAc separation C2 are even more energy-consuming (Figure 1). Overall, 81.6% of the total required heat duty is consumed in these two columns. All three column condensers consume 2851 kW of cooling duty, which corresponds to 94.6% of the total cooling duty required. EX2, EX6, and EX7 heat exchangers consume less than 164 kW of cooling capacity to reach the required stream temperature. Therefore, from the energetic point of view, the C1 and C2 columns are the key equipment units, Table 9. This is mainly due to large recycle flows (Table 1) and energy-intensive separation of the azeotropic mixture. The process is even more energy-intensive if the C1column (Figure 1) is not operated as an azeotropic distillation column with an SEC of 3408 kW of heating duty and 3427 kW of cooling duty. Overall, five main equipment units along with seven heat exchangers are used (distillation columns reboilers and condensers are included as a part of the main column equipment), Table 9.
In the RD column with a separation unit (Figure 2), process energy demands are improved in more ways. Both heat consumption and cooling demands in the RD column are improved by 40.4% compared to the reaction part (CSTR reactor + C1 column) of the conventional process (Figure 1). This is mainly due to the process integration and reduction of the flow of some streams. The process integration has a positive effect on the regeneration of unreacted ethanol in distillation column C2 (Figure 2). Here, 361.9 kW of heat duty is consumed in the column reboiler; 323.1 kW of cooling duty is required in the column condenser. This is by 34.1% less of reboiler duty and by 35.7% less of condenser duty compared to regeneration column C3 in the conventional path (Figure 1). It is caused by a lower amount of aqueous solution to be regenerated; 77 kmol h−1 (Figure 2) compared to 117 kmol h−1 in the conventional process (Figure 1). The water content showed a similar trend (91 mol.%). On the other hand, the separation of pure EtAc in distillation column C1 (Figure 2) is the most energy-consuming process. The C1 column (Figure 2) reboiler duty is 1760 kW, which is by almost 28.0% more energy-intensive than the separation of pure EtAc in the conventional process (Figure 1). A similar increase was observed for the cooling duty increase (around 30.7%) due to different content of EtAc in the column feed stream (F2); 65 mol.% in the RD with a separation unit (Figure 2) compared to 77 mol.% in the conventional process (Figure 1). Consequently, EtAc separation from diluted aqueous solution is more energy-intensive. Some energy savings can be reached when higher water flow to the decanter is used or a slightly different column with higher packing height is used. However, the RD column with a separation unit (Figure 2) is more energy-efficient than the conventional process (Figure 1). SEC is lower by 6.0% in case of both heat consumption and cooling demands. Moreover, the number of equipment units is lower; CSTR and two heat exchangers have been removed. Results can be found in Table 9.
RD column with a stripper (Figure 3) shows significant process integration and intensification. The process philosophy has been improved as several equipment were removed or integrated into the main two columns (Figure 3). The RD column reboiler duty (556 kW) is 2.31 times lower compared to that of the C1 stripper (Figure 3, 1286 kW). Also, vapor flow in the stripper is almost three times higher than that in the second section of the RD column. Energy demands of both columns (Figure 3) are quite high compare to the conventional path (Figure 1) and the RD column with a separation unit (Figure 2). In the designed RD column, the heat consumption decreased by almost 21% compared to the RD column with a separation unit (Figure 2), (Table 9). The C1 stripper (Figure 3) reboiler duty is lower by 26.8% compared to that of the C1 distillation column for EtAc separation in the RD column with a separation unit (Figure 2). On the other hand, 1816 kW of cooling duty are required in the condenser of the designed RD column (Figure 3), the highest cooling duty of all designed equipment, mainly due to the large flow of internal liquid recycle (D1 in Figure 3) and internal vapor recycle (AZ1 in Figure 3). Fortunately, no other condenser is included in the process (Figure 3). Consequently, the RD column condenser covers all main cooling demands. SEC has vastly decreased compared to the RD column with a separation unit (Figure 2); heat consumption is by almost 35% lower as well as the cooling duties (34.5%). The number of equipment units has decreased as a decanter, distillation column for water regeneration and three heat exchangers have been eliminated. Results are listed in Table 9.
RD column with an auxiliary reaction (Figure 4) represents a fully integrated and intensified concept. Several aspects have brought significant energy savings; the synergy of two chemical reactions is used; reaction heat partially covers the process heating demands; product separation is enhanced by increased relative volatility of produced EtAc to MEG; the number of equipment units has been reduced to the RD column only. Designed RDAR energy requirements are very low compared to the previously designed processes (Figure 1, Figure 2 and Figure 3). SEC has vastly decreased; cooling duties are by more than 70% lower compared to the RDS (Figure 3); heat consumption is a tenth only of that in RDS. This can be explained by the hydration reaction of ethylene oxide (7) which is highly exothermic, reaction heat is −98,867.6 kJ kmol−1 at 25 °C. Therefore, almost 275 kW of heat generated by the hydration reaction is created in the RD column. This reaction-generated heat along with external heat (reboiler duty) suffices to operate the RD column. Results are listed in Table 9.

4.2. Economy Aspects of Individual Case Studies

An economic evaluation of the presented case studies is based on optimized simulations of the process models. Prices of commodities were selected according to market research [45,46,47]. Prices of both reactants and products were chosen as a long-term average. Electricity, cooling water, and steam are considered to be energy utilities and their costs were obtained from the Aspen Plus database [26]. These utility costs correspond with actual prices. Exact values are listed in Table 10.
Equipment cost was calculated using the Aspen Process Economic Analyzer software [26]. Individual mapping and sizing of each equipment unit was applied, which is important as the case studies simulations were calculated using rate-based modeling with known equipment dimensions. Also, special RD column configuration has been introduced in the RDS and RDAR case studies (Figure 3 and Figure 4)—multiple diameter columns, stripper column (without condenser, etc.). Detailed individual equipment cost and installed cost are listed in Appendix A, Table A1.
Energy requirements of individual case studies (Table 9) were recalculated to utility consumption and further to the price per hour. The conventional production path (Figure 1) is the most energy-intensive, which is reflected in cooling water and steam consumption. The cooling water consumption was 233.11 m3 h−1, which is by more than 5.8% higher compared to the RD column with a separation unit (Figure 2) (219.36 m3 h−1) and by more than 38.2% higher compared to the RD column with a stripper (Figure 3) (143.87 m3 h−1). The same trend was observed in steam consumption, Table 11. The RDAR set-up (Figure 4) has the lowest energy consumption. The cooling water flow is by more than 83% lower compared to the conventional process (Figure 1). Despite the use of more expensive high-pressure steam (2.7 MPa) compared to all other case studies where low-pressure steam (0.7 MPa) is used, the RDAR set-up (Figure 4) has the lowest heating cost. Detailed results are listed in Table 11. Comparison of total installed cost and total utility cost of individual case studies is depicted in Figure 5.
To complete the economic analysis, total capital costs, total annual costs, total raw material cost, and product sales were calculated. A return rate of 20% per year and an annual work fund of 340 days were assumed. The capital costs are almost 10 mil. $ in the conventional path (Figure 1). Process integration and intensification can decrease total capital cost by 11% (RD column with a separation unit); 35% (RDS); or even 57% (RDAR). Total raw materials cost is similar (5.45 mil. $) except for RDAS (Figure 4) as the price of ethylene oxide has to be included. However, the highest product sales are in the RDAS set-up (16.4 mil. $ compared to 10.3 mil. $). Finally, a simple payback period was calculated: two years of project feasibility and preparation (projecting, building, licensing, etc.) is included. The conventional process (Figure 1) has a payback period of over 10 years because of the highest capital and utilities cost. RD column with a separation unit (Figure 2) becomes profitable 1.5 years earlier than the conventional process (Figure 1). The payback period is almost halved in the case of RDS (Figure 3), and only one-third in the case of RDAR (Figure 4) compared to the conventional process (Figure 1). Finally, total production cost (TPC) was evaluated, Equation (2), and the results are presented in Table 12. Comparison of total capital and annual costs with product sales are presented in Figure 6. From Figure 6 and the TPC, it is clear that the most promising concepts are RDS (Figure 3) and RDAR (Figure 4) from the economic point of view.

4.3. Safety Aspects of Individual Case Studies

Individual risk is a risk assessment methodology that allows for numerical estimates of the level of risk associated with a certain activity or a series of activities to be estimated and then assessed. To identify the list of incidents a semi-automated approach was used. For each type of unit, a predefined set of representative incidents was prepared. The final choice of incidents is very difficult and requires judgment from an analyst; therefore, three main factors were taken into consideration: the size of the release, state of releasing material (liquid, vapor), and whether the release is instantaneous or continuous.
  • For distillation and reactive distillation columns, the incident list contained: liquid leaks (full bore rupture and hole equivalent to 20% of diameter), vapor leaks, and complete rupture of column.
  • For heat exchangers, small leaks and full rupture were used.
  • For all pipelines in the simulation, the only full rupture was considered.
For the list of representative incidents, a number of different incident outcomes are possible. To define the incident outcomes, three different generic event trees were used:
  • continuous liquid release,
  • continuous gaseous release and
  • instantaneous release.
Probabilities were adjusted based on a recommendation from [48]. Consequence modeling was performed using standard (and widely used) software system ALOHA (The Areal Location of Hazardous Atmospheres) provided by the US Environmental Protection Agency. Three representative weather conditions (wind speed 1, 2, and 4 m s−1 and atmospheric stability F, D, and C) were taken into account for all case studies. The wind was assumed to be uniformly distributed in all directions. Probabilities of individual representative weather conditions were adopted from information provided by the Slovak Hydrometeorological Institute.
Results of individual risk estimation for the presented case studies are depicted in Figure 7. To compare all investigated case studies, individual risk is presented in form of risk profiles as a function of distance. Based on the risk profiles, it is possible to conclude that, from the safety point of view, the conventional process set-up (Figure 1) and reactive distillation column with a separation unit (Figure 2) are the worst alternatives. Both profiles are practically identical. Close to the center of the production unit, the conventional process set-up (Figure 1) shows the highest individual risk from all presented case studies. If we focused only on the boundary of acceptable risk, 1 × 10⁻⁵ year−1 for existing plants (Table 13), the least suitable set-up is the distillation column with a separation unit (Figure 2) due to the high number of equipment units but mainly due to the recirculation of large quantities of material and high flow rates through the columns.
Based on the presented analysis, the best alternative, from the safety analysis point of view, is the reactive distillation column with an auxiliary reaction. This result can be a little bit surprising because in this case study, ethylene oxide (extremely flammable, explosive, and toxic gas) is added as a feedstock. On the other hand, the main advantage of this set-up (Figure 4) compared with the previous three, is the minimal number of operation units and no material recycles. Main reactions and separation are performed only in one unit (reactive distillation column and vapor and liquid flow through the column are lower than in all previous case studies. For this reason, the volume of hazardous materials in the column, reboiler, and other auxiliary equipment are also lower compared to the previous case studies. The concentration of the extremely flammable ethylene oxide is very low in the column and its mole fraction in the whole system is below 10%; except for 10 trays close to its feed location.
From the comparison of individual risk of fatality estimation (Figure 7 resp. Table 13), it is clear that minimizing the number of equipment and internal recycles leads to a reduction of the level of risk. In the presented study, only the production and separation part of the case studies were evaluated. If required, the safety study can be extended to include storage facilities for each case study.

5. Conclusions

Intensification and integration of ethyl acetate production via reactive distillation have been studied. Four detailed process flowsheets were designed: conventional process set-up (Figure 1); reactive distillation column with a separation unit (Figure 2), reactive distillation column with a stripper (RDS) (Figure 3), and reactive distillation column with an auxiliary reaction (RDAR) (Figure 4). A multi-aspect comparison of the set-ups covering energy requirements, economy, and safety analysis was done.
Process modeling was performed in Aspen Plus [26]. Thermodynamic model NTRL-HOC with reliable parameters was used for phase equilibrium calculations. Chemical reactions (esterification (5) and hydration (7)) were modeled by rate Equations (6) and (8) obtained from extensive literature research. A rigorous non-equilibrium stage model of the distillation/reactive distillation column was used. Detailed column internal configuration was designed (packed column) and therefore, more accurate simulation results were obtained including reasonable column hydraulics.
Process streams regeneration and recovery were solved to achieve defined specifications (production of 10 kmol h−1 of pure ethyl acetate (99.9 mol.%); prevention of ethyl acetate losses in other product streams (full EtAc recovery); separation of process by-products (water or monoethylene glycol) in equal amount and purity as the main product (EtAc)). This was successfully achieved in all designed processes (Figure 1, Figure 2, Figure 3 and Figure 4). In the conventional process set-up (Figure 1), regeneration was energy-intensive due to large recycle flows. Energy requirements for recycle regeneration decreased significantly due to process integration. Regeneration was less energy-intensive in the case of RD column with a separation unit (Figure 2) compared to the conventional set-up (Figure 1, by around 35%). No process stream regeneration was needed in the case of either RDS (Figure 3) or RDAR (Figure 4). Therefore, energy consumption was reduced by process integration and intensification remarkably. The lowest energy consumption was achieved in a fully integrated and intensified process—RDAR (Figure 4), due to the synergy of two chemical reactions and enhanced product separation (Table 9).
Economic and energy aspects showed similar trends in the designed processes. The total utility costs were the highest in the case of commercial process set-up (Figure 1)—almost 0.9 mil. $ per year. Savings of 10% in the utility costs were observed when the conventional process (Figure 1) was replaced by an RD column with a separation unit (Figure 2). Further utilities cost savings were achieved by RD process integration and intensification via RDS (Figure 3), up to 39%, and via RDAR (Figure 4) up to 88%, respectively. More remarkable savings were observed in total capital cost (TCC) (Table 12). As the number of equipment units was reduced, TCC decreased accordingly. On the other hand, the price of individual equipment units increased because of larger columns with sophisticated internal configuration. Detailed prices of individual equipment are listed in the Appendix A in Table A1.
An integral part of the intensification process of ethyl acetate production is the safety analysis. To translate the probability and impact of risk into a measurable quantity, individual risk estimation was used. Results in the form of risk profiles can be easily compared for several alternatives of ethyl acetate production and prioritize the safer ones. From the safety analysis point of view, a reactive distillation column with an auxiliary reaction (Figure 4) comes out as the best alternative even though ethylene oxide (extremely flammable, explosive, and toxic gas) is added as feedstock. This is due to the minimum number of equipment and the elimination of recycles in the system.

Author Contributions

Conceptualization, B.Š. and Z.L.; methodology, B.Š., Z.L., and J.L.; software, B.Š., J.L.; validation, B.Š., Z.L.; formal analysis, B.Š., Z.L., and J.L.; investigation, B.Š.; resources, Z.L.; data curation, B.Š.; writing—original draft preparation, B.Š., Z.L., and J.L.; writing—review and editing, B.Š., Z.L., and J.L.; visualization, B.Š.; supervision, Z.L.; funding acquisition, Z.L. All authors have read and agreed to the published version of the manuscript.

Funding

This research was funded by the Slovak Scientific Agency, Grant No. VEGA 1/0659/18; the Slovak Research and Development Agency, under contract No. APVV-18-0134, and by the Slovak University of Technology in Bratislava within the Young Scientist Support Program 2020.

Conflicts of Interest

The authors declare no conflict of interest.

List of Symbols

Cmolar concentrationkmol m−3
dcolumn internal diameterm
ffeed stage position
fifrequency of incident outcome i year−1
FIfrequency of incident Iyear−1
Hpacked section heightm
IRx,ytotal individual risk of fatality at geographical location x, yyear−1
ntotal number of incident outcome case
molar flowkmol h−1
Nnumber of theoretical stages, total condenser, and reboiler are included
NRreactive section stages
pf,ifatality at location x, y
po,iincident outcome probability
Ptotal pressurekPa
ΔPcolumn section pressure dropkPa
Q ˙ C condenser dutykW
Q ˙ W reboiler dutykW
rreaction ratekmol m−3 s−1
Rgas constantkJ kmol−1 K−1
Rreflux ratio
Ttemperature°C
Tthermodynamic temperature in Equations (6) and (8)K
V ˙ volume flowm3 h−1
xmolar fraction in the liquid phase

Subscripts

AAacetic acid
Ccondenser
Ddistillate
EtAcethyl acetate
EtOHethanol
Ffeed
iincident outcome case
Iincident
H2Owater
Rreaction occurrence
Wreboiler
x, ygeographical location

Abbreviations

AAacetic acid
ARDazeotropic reactive distillation
CSTRcontinuous stirred tank reactor
DSdesign specification
EQequilibrium stage
EtAcethyl acetate
EtOHethanol
HETPheight equivalent of theoretical plate
HOCHayden–O’Connell equation of state
NEQnon-equilibrium stage
NRTLnon-random two liquids
OECoverall energy consumptionkW
RDreactive distillation
RDARreactive distillation with auxiliary reaction
RDPVreactive distillation with pervaporation
RDSreactive distillation with stripper
RDWCreactive distillation with a dividing wall
REDreactive extractive distillation
SECspecific energy consumptionkW t−1EtAc
TACtotal annual cost$ year−1
TCCtotal capital cost$
TPCtotal production cost$ t−1
VLvapor–liquid
VLLEvapor–liquid–liquid phase equilibria

Appendix A

Table A1. Equipment cost and total installed cost of individual equipment.
Conventional Path
(Figure 1)
RD Column with Separation Unit
(Figure 2)
RD Column with Stripper
(Figure 3)
RD Column with Auxiliary Reaction
(Figure 4)
Equipment CostInstalled Cost Equipment CostInstalled Cost Equipment CostInstalled Cost Equipment CostInstalled Cost
Item[103 $][103 $][103 $][103 $][103 $][103 $][103 $][103 $]
CSTR/RD173.7334.3680.51214.0840.51614.0790.41480.5
C1620.71147.2610.61185.2380.2695.2--
C2594.51138.1148.0487.8----
C3172.6564.0------
DEC16.1108.916.1108.9----
EX18.553.08.759.18.558.610.161.0
EX239.3120.019.385.410.560.310.560.3
EX38.759.19.962.6----
EX48.545.714.370.7----
EX511.063.910.960.8----
EX68.545.7------
EX710.560.3------
Sum1672.63740.21518.33334.51239.72428.1811.01601.8

References

  1. Riemenschneider, W.; Bolt, H.M. Esters, Organic. In Ullmann’s Encyclopedia of Industrial Chemistry; Wiley-VCH Verlag GmbH & Co. KGaA: Weinheim, Germany, 2012. [Google Scholar]
  2. Cornils, B. Ethyl Acetate. In Catalysis from A to Z; Wiley-VCH: Weinheim, Germany, 2020; p. 2020. [Google Scholar]
  3. Srinivasan, R.; Nhan, N.T. A statistical approach for evaluating inherent benign-ness of chemical process routes in early design stages. Process Saf. Environ. Prot. 2008, 86, 163–174. [Google Scholar] [CrossRef]
  4. Li, C.; Duan, C.; Fang, J.; Li, H. Process intensification and energy saving of reactive distillation for production of ester compounds. Chin. J. Chem. Eng. 2019, 27, 1307–1323. [Google Scholar] [CrossRef]
  5. Toth, A.J. Comprehensive evaluation and comparison of advanced separation methods on the separation of ethyl acetate-ethanol-water highly non-ideal mixture. Sep. Purif. Technol. 2019, 224, 490–508. [Google Scholar] [CrossRef]
  6. Wierschem, M.; Górak, A. Reactive Distillation. In Reference Module in Chemistry, Molecular Sciences and Chemical Engineering; Elsevier: Amsterdam, The Netherlands, 2018; pp. 1–10. [Google Scholar]
  7. Niesbach, A.; Kuhlmann, H.; Keller, T.; Lutze, P.; Górak, A. Optimisation of industrial-scale n-butyl acrylate production using reactive distillation. Chem. Eng. Sci. 2013, 100, 360–372. [Google Scholar] [CrossRef]
  8. Qasim, F.; Shin, J.S.; Park, S.J. A simulation study on selection of optimized process for azeotropic separation of methanol and benzene: Internal heat integration and economic analysis. Korean J. Chem. Eng. 2018, 35, 1185–1194. [Google Scholar] [CrossRef]
  9. Timoshenko, A.V.; Anokhina, E.A.; Morgunov, A.V.; Rudakov, D.G. Application of the partially thermally coupled distillation flowsheets for the extractive distillation of ternary azeotropic mixtures. Chem. Eng. Res. Des. 2015, 104, 139–155. [Google Scholar] [CrossRef]
  10. Staak, D.; Grützner, T. Process integration by application of an extractive dividing-wall column: An industrial case study. Chem. Eng. Res. Des. 2017, 123, 120–129. [Google Scholar] [CrossRef]
  11. Lv, B.; Liu, G.; Dong, X.; Wei, W.; Jin, W. Novel Reactive Distillation–Pervaporation Coupled Process for Ethyl Acetate Production with Water Removal from Reboiler and Acetic Acid Recycle. Ind. Eng. Chem. Res. 2012, 51, 8079–8086. [Google Scholar] [CrossRef]
  12. Harvianto, G.R.; Ahmad, F.; Lee, M. A hybrid reactive distillation process with high selectivity pervaporation for butyl acetate production via transesterification. J. Membr. Sci. 2017, 543, 49–57. [Google Scholar] [CrossRef]
  13. Graczová, E.; Šulgan, B.; Steltenpohl, P. Tert-Butanol–water mixture separation by extractive distillation: Application of experimental data in process simulations. Sep. Purif. Technol. 2020, 251, 116968. [Google Scholar] [CrossRef]
  14. Ma, S.; Shang, X.; Li, L.; Song, Y.; Pan, Q.; Sun, L. Energy-saving thermally coupled ternary extractive distillation process using ionic liquids as entrainer for separating ethyl acetate-ethanol-water ternary mixture. Sep. Purif. Technol. 2019, 226, 337–349. [Google Scholar] [CrossRef]
  15. Santaella, M.A.; Orjuela, A.; Narváez, P.C. Comparison of different reactive distillation schemes for ethyl acetate production using sustainability indicators. Chem. Eng. Process. Process. Intensif. 2015, 96, 1–13. [Google Scholar] [CrossRef]
  16. Kiss, A.A.; Jobson, M. Taking Reactive Distillation to the Next Level of Process Intensification. Chem. Eng. 2018, 69, 553–558. [Google Scholar] [CrossRef]
  17. Raymond, K.E.; Othmer, D.F. Encyclopedia of Chemical Technology, 8th ed.; Wiley: Weinhem, Germany, 2007. [Google Scholar]
  18. Segovia-Hernández, J.G.; Hernández, S.; Petriciolet, A.B. Reactive distillation: A review of optimal design using deterministic and stochastic techniques. Chem. Eng. Process. Process. Intensif. 2015, 97, 134–143. [Google Scholar] [CrossRef]
  19. Šulgan, B.; Labovská, Z.; Markoš, J. Production of 2-phenylethyl acetate via reactive distillation. Chem. Pap. 2020, 74, 2341–2356. [Google Scholar] [CrossRef]
  20. Dimian, A.C.; Bildea, C.; Omota, F.; Kiss, A. Innovative process for fatty acid esters by dual reactive distillation. Comput. Chem. Eng. 2009, 33, 743–750. [Google Scholar] [CrossRef]
  21. Harmsen, J. Reactive distillation: The front-runner of industrial process intensification. Chem. Eng. Process. Process. Intensif. 2007, 46, 774–780. [Google Scholar] [CrossRef] [Green Version]
  22. Xie, J.; Li, C.; Peng, F.; Dong, L.; Ma, S. Experimental and simulation of the reactive dividing wall column based on ethyl acetate synthesis. Chin. J. Chem. Eng. 2018, 26, 1468–1476. [Google Scholar] [CrossRef]
  23. Tavan, Y.; Behbahani, R.M.; Hosseini, S.H. A novel intensified reactive distillation process to produce pure ethyl acetate in one column—Part I: Parametric study. Chem. Eng. Process. Process. Intensif. 2013, 73, 81–86. [Google Scholar] [CrossRef]
  24. Huang, F.; Xu, S.; Li, T.; Zhu, N. Innovative Ethylene Glycol Diacetate synthesis process in a single reactive distillation column. Chem. Eng. Process. Process. Intensif. 2016, 109, 80–89. [Google Scholar] [CrossRef]
  25. Hu, S.; Zhang, B.J.; Hou, X.Q.; Li, D.L.; Chen, Q.L. Design and simulation of an entrainer-enhanced ethyl acetate reactive distillation process. Chem. Eng. Process. Process. Intensif. 2011, 50, 1252–1265. [Google Scholar] [CrossRef]
  26. ASPEN Technology. Aspen Plus®: Aspen Plus User Guide, Version 10.2; Aspen Technology Inc.: Cambridge, MA, USA, 2000. [Google Scholar]
  27. Muthia, R.; Reijneveld, A.G.; Van Der Ham, A.G.; Kate, A.J.T.; Bargeman, G.; Kersten, S.R.; Kiss, A.A. Novel method for mapping the applicability of reactive distillation. Chem. Eng. Process. Process. Intensif. 2018, 128, 263–275. [Google Scholar] [CrossRef]
  28. Singh, D.; Gupta, R.K.; Kumar, V. Simulation of a plant scale reactive distillation column for esterification of acetic acid. Comput. Chem. Eng. 2015, 73, 70–81. [Google Scholar] [CrossRef]
  29. Risco, A.; Plesu, V.; Heydenreich, J.A.; Bonet-Ruiz, A.-E.; Calvet, A.; Iancu, P.; Llorens, J. Pressure selection for non-reactive and reactive pressure-swing distillation. Chem. Eng. Process. Process. Intensif. 2019, 135, 9–21. [Google Scholar] [CrossRef]
  30. Švandová, Z.; Labovský, J.; Markoš, J.; Jelemenský, Ľ. Impact of mathematical model selection on prediction of steady state and dynamic behaviour of a reactive distillation column. Comput. Chem. Eng. 2009, 33, 788–793. [Google Scholar] [CrossRef]
  31. Švandová, Z.; Markoš, J.; Jelemenský, Ľ. Multiple steady states in a CSTR with total condenser: Comparison of equilibrium and nonequilibrium models. Chem. Pap. 2006, 60, 432–440. [Google Scholar] [CrossRef]
  32. Sun, S.; Yang, A.; Chien, I.-L.; Shen, W.; Wei, S.; Ren, J.; Zhang, X. Intensification and performance assessment for synthesis of 2-methoxy-2-methyl-heptane through the combined use of different pressure thermally coupled reactive distillation and heat integration technique. Chem. Eng. Process. Process. Intensif. 2019, 142, 107561. [Google Scholar] [CrossRef]
  33. Couper, J.R.; Hertz, D.W.; Smith, F.L. Process Economics. In Perry’s Chemical Engineers’ Handbook, 8th ed.; Green, D.W., Perry, R.H., Eds.; McGraw-Hill: New York, NY, USA, 2007. [Google Scholar]
  34. The Center for Chemical Process Safety. Guidelines for Chemical Process Quantitative Risk Analysis; American Institute of Chemical Engineers: New York, NY, USA, 1989. [Google Scholar]
  35. Trofimova, M.; Sadaev, A.; Samarov, A.; Golikova, A.; Tsvetov, N.; Toikka, M.; Toikka, A. Liquid-liquid equilibrium of acetic acid–ethanol–ethyl acetate–water quaternary system: Data review and new results at 323.15 K and 333.15 K. Fluid Phase Equilibria 2020, 503, 112321. [Google Scholar] [CrossRef]
  36. Wichterle, I.; Bogdanić, G. Vapour–liquid and chemical equilibria in the ethyl ethanoate+ethanol+propyl ethanoate+propanol system accompanied with transesterification reaction. Fluid Phase Equilibria 2012, 328, 61–68. [Google Scholar] [CrossRef]
  37. Hayden, J.G.; O’Connell, J.P. A Generalized Method for Predicting Second Virial Coefficients. Ind. Eng. Chem. Process. Des. Dev. 1975, 14, 209–216. [Google Scholar] [CrossRef]
  38. Altiokka, M.R.; Akyalçin, S. Kinetics of the Hydration of Ethylene Oxide in the Presence of Heterogeneous Catalyst. Ind. Eng. Chem. Res. 2009, 48, 10840–10844. [Google Scholar] [CrossRef]
  39. Arnikar, H.J.; Rao, T.S.; Bodhe, A.A. A gas chromatographic study of the kinetics of the uncatalysed esterification of acetic acid by ethanol. J. Chromatogr. A 1970, 47, 265–268. [Google Scholar] [CrossRef]
  40. Calvar, N.; González, B.; Dominguez, A. Esterification of acetic acid with ethanol: Reaction kinetics and operation in a packed bed reactive distillation column. Chem. Eng. Process. Process. Intensif. 2007, 46, 1317–1323. [Google Scholar] [CrossRef]
  41. Monroy-Loperena, R.; Álvarez-Ramírez, J. On the Steady-State Multiplicities for an Ethylene Glycol Reactive Distillation Column. Ind. Eng. Chem. Res. 1999, 38, 451–455. [Google Scholar] [CrossRef]
  42. Doherty, M.F.; Fidkowski, Z.T.; Malone, M.F.; Taylor, R. Distillation. In Perry’s Chemical Engineers’ Handbook, 8th ed.; Green, D.W., Ed.; McGraw-Hill: New York, NY, USA, 2007. [Google Scholar]
  43. Bagajewicz, M.; Ji, S. Rigorous Procedure for the Design of Conventional Atmospheric Crude Fractionation Units. Part I: Targeting. Ind. Eng. Chem. Res. 2001, 40, 617–626. [Google Scholar] [CrossRef]
  44. Glavič, P. Integrated crude distillation design. Comput. Chem. Eng. 1995, 19. [Google Scholar] [CrossRef]
  45. Löser, C.; Urit, T.; Bley, T. Perspectives for the biotechnological production of ethyl acetate by yeasts. Appl. Microbiol. Biotechnol. 2014, 98, 5397–5415. [Google Scholar] [CrossRef]
  46. Chembid. Available online: www.chembid.com (accessed on 22 June 2020).
  47. Molbase. Available online: www.molbase.com (accessed on 22 June 2020).
  48. Vílchez, J.A.; Espejo, V.; Casal, J. Generic event trees and probabilities for the release of different types of hazardous materials. J. Loss Prev. Process. Ind. 2011, 24, 281–287. [Google Scholar] [CrossRef]
Figure 1. Ethyl acetate production via conventional process set-up.
Processes 08 01618 g001
Figure 2. Ethyl acetate production via reactive distillation column with a separation unit.
Processes 08 01618 g002
Figure 3. Ethyl acetate production via reactive distillation column with a stripper.
Processes 08 01618 g003
Figure 4. Ethyl acetate production via reactive distillation column with an auxiliary reaction.
Processes 08 01618 g004
Figure 5. Total utilities cost and total installed equipment cost for individual case studies; 1—Conventional path; 2—RD column with a separation unit; 3—RDS; 4—RDAR.
Processes 08 01618 g005
Figure 6. Total capital, total annual costs, and product sales for individual case studies; 1—Conventional path; 2—RD column with a separation unit; 3—RDS; 4—RDAR.
Processes 08 01618 g006
Figure 7. Individual risk of fatality estimation for presented case studies.
Processes 08 01618 g007
Table 1. Material balance of designed conventional process set-up (Figure 1).
AA0ETOH0F11F21R1P1P2W11W12D11D12D13ORGF2W21AZ
[kmol h−1]10.0010.0022.6419.8842.5242.5242.5212.6512.6539.86187.78187.7841.2141.2120.0010.00
xH2O---0.08690.04070.27560.2756--0.29400.76080.76080.16040.16040.00030.0003
xAA1.0000-0.8325-0.44330.20830.20830.70000.7000-------
xEtAc--0.16730.13010.14990.38480.38480.29960.29960.56600.18560.18560.76720.76720.99900.9990
xEtOH-1.00000.00020.78300.36620.13120.13120.00040.00040.14000.05360.05360.07240.07240.00070.0007
T [°C]25.0025.0039.6429.3836.9839.0154.2498.2049.0170.0248.9725.0025.0041.7976.8376.83
P [kPa]101.3101.3101.3101.3101.3101.3101.3101.3101.3101.3101.3101.3101.3101.3101.3101.3
V ˙ [m3 h−1]0.560.581.441.192.652.662.720.950.882.906.716.503.373.452.121.06
W22W23D21D22H2OLBYPASSF31F32F33D31D32W31W32H2ORECH2OINH2OP1
[kmol h−1]10.0010.0021.2121.21146.5729.31117.26117.26117.269.879.87107.38107.3897.370.0210.00
xH2O0.00030.00030.31140.31140.92960.92960.92960.92960.92960.17490.17490.99900.99900.99901.00000.9990
xAA----------------
xEtAc0.99900.99900.54870.54870.02200.02200.02200.02200.02200.26190.2619-----
xEtOH0.00070.00070.13990.13990.04840.04840.04840.04840.04840.56320.56320.00100.00100.0010-0.0010
T [°C]76.8325.0070.0235.0025.0025.0025.0030.3472.7971.6935.0099.3440.3440.3425.0040.34
P [kPa]101.3101.3101.3101.3101.3101.3101.3101.3101.3101.3101.3101.3101.3101.3101.3101.3
V ˙ [m3 h−1]1.060.981.511.433.180.642.552.5659.33 a0.650.612.111.981.800.000.18
a vapor–liquid mixture.
Table 2. Parameters of designed columns—conventional set-up (Figure 1).
C1C2C3
N606030
fP1235--
fAZ34--
fF2-36-
fF33--18
DS1xD1(AA) = 10−5xW21(EtAc) = 0.999xW31(H2O) = 0.999
DS2xW11(AA) = 0.70-xD31(EtOH) = 0.56
R2.005.004.00
P [kPa]101.3101.3101.3
Column geometry
Column section 12–402–592–29
N1395828
Packing typeRALU-RING 25 mmRALU-RING 25 mmRALU-RING 38 mm
d1 [m]1.01.200.60
H1 [m]2 × 4.02 × 3.52 × 4.0
HETP1 [m]0.210.120.29
ΔP1 [kPa]2.01.80.8
Column section 241–59--
N219--
Packing typeRALU-RING 38 mm--
d2 [m]1.0--
H2 [m]4.0--
HETP2 [m]0.21--
ΔP2 [kPa]0.9--
Table 3. Material balance of designed RD column with a separation unit (Figure 2).
AA0ETOH0ETOHD11W11W12W13 aD31W31W32W33H2OPH2ORECH2OINH2ODECH2OL
[kmol h−1]10.0010.0018.6620.947.7277.3477.348.6668.7068.7068.7010.0258.670.0158.6969.62
xH2O--0.09090.26660.79180.90960.90960.19580.99950.99950.99950.99950.99951.00000.99950.9227
xAA1.0000---------------
xEtAc--0.08550.5536-0.02060.02060.1842-------0.0229
xEtOH-1.00000.82360.17980.20820.06970.06980.62000.00050.00050.00050.00050.0005--0.0544
T [°C]25.0025.0047.8870.0282.4731.2072.0472.6599.5045.0025.0025.0025.0025.0025.0025.00
P [kPa]101.3101.3101.3101.3101.3101.3101.3101.3101.3101.3101.3101.3101.3101.3101.3101.3
V ˙ [m3 h−1]0.560.581.111.540.221.7519.65a0.531.351.271.250.181.060.001.061.53
ORG1ORG2F2W21W22D21D22D23
[kmol h−1]19.6619.6640.6010.0110.0130.5930.5930.59
xH2O0.16320.16320.21650.00020.00020.28730.28730.2873
xAA--------
xEtAc0.75580.75580.65150.99900.99900.53780.53780.5378
xEtOH0.08110.08110.13200.00080.00080.17490.17490.1749
T [°C]25.0060.0064.4776.8425.0070.0145.8425.00
P [kPa]101.3101.3101.3101.3101.3101.3101.3101.3
V ˙ [m3 h−1]1.591.683.211.060.982.202.122.06
a vapor–liquid mixture.
Table 4. Parameters of designed columns—reactive distillation (RD) column with a separation unit (Figure 2).
RDC1C2
N1006050
NR25–100--
fA0025--
fETOH070--
fF2-38-
fW13--32
DS1xD11(AA) = 10−5xW21(EtAc) = 0.999xW31(H2O) = 0.999
DS2xW11(AA) = 10−5-xD31(EtOH) = 0.62
R2.405.002.58
P [kPa]101.3101.3101.3
Column geometry
Column section 12–752–592–49
N1745848
Packing typeRALU-RING 25 mmRALU-RING 25 mmRALU-RING 25 mm
d1 [m]0.751.300.40
H1 [m]3 × 3.02 × 3.52 × 3.0
HETP1 [m]0.120.120.13
ΔP1 [kPa]3.12.81.6
Column section 276–99--
N224--
Packing typeRALU-RING 25 mm--
d2 [m]0.75--
H2 [m]3.5--
HETP2 [m]0.15--
ΔP2 [kPa]0.8--
Table 5. Material balance of the designed RD column with a stripper (RDS) process (Figure 3).
AA0ETOH0W11W12D1AZ1 aW21W22
[kmol h−1]10.0010.0010.0010.00145.54135.5410.0010.00
xH2O--0.99900.99900.27380.29400.00020.0002
xAA1.0000-0.00080.0008----
xEtAc----0.59020.56000.99900.9990
xEtOH-1.00000.00020.00020.13600.14600.00080.0008
T [°C]25.0025.0099.6025.0070.0470.0476.8425.00
P [kPa]101.3101.3101.3101.3101.3101.3101.3101.3
V ˙ [m3 h−1]0.560.580.200.1810.883740.18 a1.060.98
a overheated vapor.
Table 6. Parameters of designed columns—RDS (Figure 3).
RDC1
N10060
NR30–100-
fAA030-
fAZ145-
fEtOH060-
fD1-1
DS1xD1(AA) = 10−5xW21(EtAc) = 0.999
DS2xW11(H2O) = 0.999-
R0.32-
P [kPa]101.3101.3
Column geometry
Column section 12–441–59
N14359
Packing typeRALU-RING 25 mmRALU-RING 25 mm
d1 [m]1.151.30
H1 [m]3 × 3.43 × 3.0
HETP1 [m]0.240.15
ΔP1 [kPa]3.61.7
Column section 245–99-
N255-
Packing typeRALU-RING 15 mm-
d2 [m]0.65-
H2 [m]3 × 4.0-
HETP2 [m]0.22-
ΔP2 [kPa]2.4-
Table 7. Material balance of designed RD column with an auxiliary reaction (Figure 4).
AA0ETOH0EOD1D2W1W2
[kmol h−1]10.0010.0010.0010.0010.0010.0010.00
xH2O-------
xAA1.0000----0.00040.0004
xEtAc---0.99930.99930.00030.0003
xEtOH-1.0000-0.00040.0004--
xEO--1.00000.00030.0003--
xMEG-----0.99930.9993
T [°C]25.0025.0025.0076.8125.00194.6325.00
P [kPa]101.3101.3101.3101.3101.3101.3101.3
V ˙ [m3 h−1]0.560.58241.61 a1.060.980.650.55
a gas.
Table 8. Parameters of the designed column—RDAR (Figure 4).
RD
N80
NR120–80
NR21–80
fAA020
fETOH066
fEO72
DS1xD1(EtAc) = 0.999
DS2xW1(MEG) = 0.999
R3.43
P [kPa]101.3
Column geometry
Column section 12–66
N165
Packing typeRALU-RING 25 mm
d1 [m]0.70
H1 [m]4 × 4.0
HETP1 [m]0.25
ΔP1 [kPa]4.2
Column section 267–79
N213
Packing typeRALU-RING 15 mm
d2 [m]0.40
H2 [m]4.0
HETP2 [m]0.31
ΔP2 [kPa]1.1
Table 9. Energy requirements and the number of the equipment for designed ethyl acetate production pathways.
Conventional Process Set-Up
(Figure 1)
RD Column with a Separation Unit
(Figure 2)
RD Column with a Stripper (RDS)
(Figure 3)
RD Column with an Auxiliary Reaction (RDAR)
(Figure 4)
Equipment Q ˙ C [kW] Q ˙ W [kW] Q ˙ C [kW] Q ˙ W [kW] Q ˙ C [kW] Q ˙ W [kW] Q ˙ C [kW] Q ˙ W [kW]
CSTR a/RD--676.69703.861816.43556.42396.70152.57
C11135.231181.191750.311759.95-1286.57--
C21212.971267.94323.10361.93----
C3502.97549.35------
DEC0.85-8.07-----
EX125.01 b-31.04 b-15.39-25.85-
EX2133.75-28.61-25.87-77.20-
EX331.04 b-77.70 b-----
EX413.73 b-27.83-----
EX5131.31 b-25.89-----
EX63.10-------
EX725.85-------
OEC3014.722998.482840.502825.741857.691842.99499.76152.57
SEC [kW t−1EtAc]3426.873408.413223.863207.112110.302093.59567.68173.30
Number of main equipment units5421
Number of heat exchangers7522
a adiabatic reactor, b heat integration—no external energy source is required.
Table 10. Prices of raw materials, products, and energy used in process economic evaluation.
Raw Materials References
EtOH800$ t−1[46,47]
AA400$ t−1[46]
EO1000$ t−1[46]
Products
EtAc1300$ t−1[45]
MEG1100$ t−1[46]
Energy [26]
Electricity0.0775$ kWh−1
cooling water0.0317$ m−3
steam (0.7 MPa)0.0179$ kg−1
steam (2.7 MPa)0.0258$ kg−1
Table 11. Utility costs of designed ethyl acetate production pathways.
Conventional PathRD Column with a Separation UnitRDSRDAR
(Figure 1)(Figure 2)(Figure 3)(Figure 4)
RatePrice
[$ h−1]
RatePrice
[$ h−1]
RatePrice
[$ h−1]
RatePrice
[$ h−1]
electricity [kW]104.178.0758.104.5056.054.3453.814.17
cooling water [m3 h−1]233.117.39219.366.95143.874.5638.711.23
steam (0.7 MPa) [kg h−1]5219.9593.684920.7088.313209.3057.59--
steam (2.7 MPa) [kg h−1]------302.557.81
Table 12. Total annual costs of individual case studies.
Conventional PathRD Column with a Separation UnitRDS RDAR
(Figure 1)(Figure 2)(Figure 3)(Figure 4)
Total capital cost [ mil. $]9.918.846.434.24
Total installed cost [mil. $]3.743.332.431.60
Total annual cost [mil. $ year−1]9.159.048.6513.72
Total raw materials cost [mil. $ year−1]5.465.465.469.42
Total product sales [mil. $ year−1]10.2710.2710.2716.40
Total utilities cost [mil. $ year−1]0.890.810.540.11
Pay-back period [year]10.869.195.973.58
Total production cost [$ t−1]1273.911266.141231.321018.09 a
a both products (EtAc and MEG) are included.
Table 13. Distance from the center for individual case studies up to which individual risk of fatality is lower than 10−5 resp. 10−4 year−1.
Individual Risk 10−5 Year−1Individual Risk 10−4 Year−1
Distance from the Center [m]Distance from the Center [m]
Conventional path (Figure 1)12295
RD column with separation unit (Figure 2)16659
RDS (Figure 3)12243
RDAR (Figure 4)6228
Publisher’s Note: MDPI stays neutral with regard to jurisdictional claims in published maps and institutional affiliations.

