Abrasive Water Jet Cutting of Hardox Steels—Quality Investigation


1
Faculty of Manufacturing Technologies with a Seat in Presov, Technical University of Kosice, Sturova 31, 08001 Presov, Slovakia
2
IMSLOV, P. Horova 19, 08001 Presov, Slovakia
*
Author to whom correspondence should be addressed.
Processes 2020, 8(12), 1652; https://0-doi-org.brum.beds.ac.uk/10.3390/pr8121652
Submission received: 9 November 2020
/
Revised: 9 December 2020
/
Accepted: 12 December 2020
/
Published: 14 December 2020
(This article belongs to the Special Issue Expanding the Horizons of Manufacturing: Towards Wide Integration, Smart Systems and Tools)
Abstract
:The paper aims to study the surface quality dependency on selected parameters of cuts made in Hardox™ by abrasive water jet (AWJ). The regression process was applied on measured data and the equations were prepared for both the Ra and Rz roughness parameters. One set of regression equations was prepared for the relationship of Ra and Rz on cutting parameters—pumping pressure, traverse speed, and abrasive mass flow rate. The second set of regression equations describes relationships between the declination angle in kerf as the independent variable and either the Ra or the Rz parameters as dependent variables. The models can be used to predict cutting variables to predict the surface quality parameters.
1. Introduction
Cutting of materials by abrasive water jets has been studied for several decades. The pioneer scientists dealing with this topic were Hashish [1,2] and Zeng and Kim [3,4]. Later, some further investigations occurred aimed at the machining process, e.g., by Kovacevic and Yong [5,6]. The current state of research of abrasive water jet technology shows that one of the important problems is the quantification and modeling of the influence of technological parameters on surface quality parameters, particularly on wear-resistant steels. Evaluation of cutting quantity and quality was continuously studied by various groups [7,8,9,10]. Sutowska et al. [11] studied the influence of cutting parameters on the kerf quality in detail. Some of the recent experiments were performed on HardoxTM 400, 450, and 500 steel plates by Filip, Vasiloni, and Mihail [12,13].
Evaluation of the cutting quality is related to the quality of the cut walls. The typical characteristics of the walls are roughness and waviness. The most common characteristics used for the evaluation of the surface roughness were measured and analyzed. These characteristics are Ra, the mean arithmetic deviation of the profile, and Rz, the height of the profile unevenness. These two quantities can be measured by contact profilometers or by non-contact profilometers [14,15,16]. Nevertheless, the values depend not only on cut material or depth in the kerf but also on abrasive material quality and grain size [17]. Former research works aimed at the problem of abrasive material changes in the mixing process show, however, that the problem is not easy to solve [18,19] because not only the average mean size ao plays the decisive role in changes to new one an but also the amount and type of the original damage of abrasive grains. The influence of the abrasive material and its granularity is constant for one selected material sort. This is the most common case in all commercial firms. Therefore, the influence of abrasive material can be considered as disturbance quantity identical in all experiments. The surface waviness has much higher values than roughness, generally in the order of millimeters. The quality of this part of the cut walls is incredibly low, therefore, beyond the interest of this paper.
The Hlaváč group has presented another approach to the determination of the cutting wall quality than the use of the Ra and Rz values, proposing a direct relationship between the declination angle (measured between the tangent to the striation curve in the definite depth h and the impinging jet axis) and respective cutting wall quality. The angle is calculated either for a certain depth in material or some assigned traverse speed from the presented model [17]. Nevertheless, angle values are incredibly low in quality cutting, and thus even relatively small imperfections in measurements bring quite large uncertainty in quality results. Therefore, this method is better for evaluating the part of the cut walls with predominant waviness.
Although there is a constantly growing set of developed solutions to the problem, including methodologies and evaluations of experiments valid for specific measurement conditions, the current solutions still do not cover several variations. The microscopic models describing the mechanism of material cutting were prepared [18] as well as the macroscopic model of cutting front behavior [19,20]. An interesting multi-parametric phenomenological description of the cutting process has also been presented by the Ostrava group [21,22,23]. The group of TU Kosice researchers entered this research area as a part of systematic studies of the operational states of manufacturing processes using progressive technologies [14,15,24] and influence of the process parameters on the surface quality [25,26] a few years ago.
The recent research is focused on complementing existing models and preparing some new ones that would be simple enough to be applicable in industrial conditions to help predict and control the production quality. The most important results are presented in this paper. They can be used for the preparation of the regression models describing surface quality relationship to the cutting factors, water pressure, traverse speed, and abrasive mass flow rate.
2. Experimental Section
2.1. Characteristics of the Samples
All samples were cut from HardoxTM 500 abrasion resistant plates with a nominal hardness of 500 HBW developed for applications with high demands on abrasion resistance. Material properties were obtained by a combination of quenching and tempering performed by manufacturer SSAB Oxelösund AB, Sweden. Sheet thicknesses of 6, 10, 15, and 40 mm were used for the individual sets of experiments with the following characteristics [27]:
Hardness (Brinell hardness, HBW according to EN ISO 6506-1, on a milled surface 0.5–2 mm below plate surface per heat and 40 tons): 486 (6 mm)–497 (40 mm).
Impact Properties (longitudinal Charpy-V; typical impact energy for 20 mm plate thickness at temperature −40 °C): 30 J.
The chemical composition of the material is presented in Table 1.
To study the dependencies of parameters, a 3-level full 3-factor experiment was designed with a total number of combinations of technological parameter values of 27 (Table 2). These combinations were applied to 4 different sample thicknesses (6, 10, 15, and 40 mm). It follows that 9 samples with 3 cut surfaces were cut from each sheet thickness. Therefore, the shape with the plan view of an equilateral triangle was chosen as the most suitable sample shape. Transverse speeds v was used for sample thicknesses of 10 and 15 mm; v+ are increased speeds for 6 mm samples because the speeds v for 6 mm sheet metal would leave minimal roughness and at the same time almost identically rough-cut surfaces. Traverse speeds v− were used for 40 mm sheet metal, as v would not be enough to cut the plate, so decreased speeds were chosen.
2.2. Characteristics of the AWJ System and Procedure
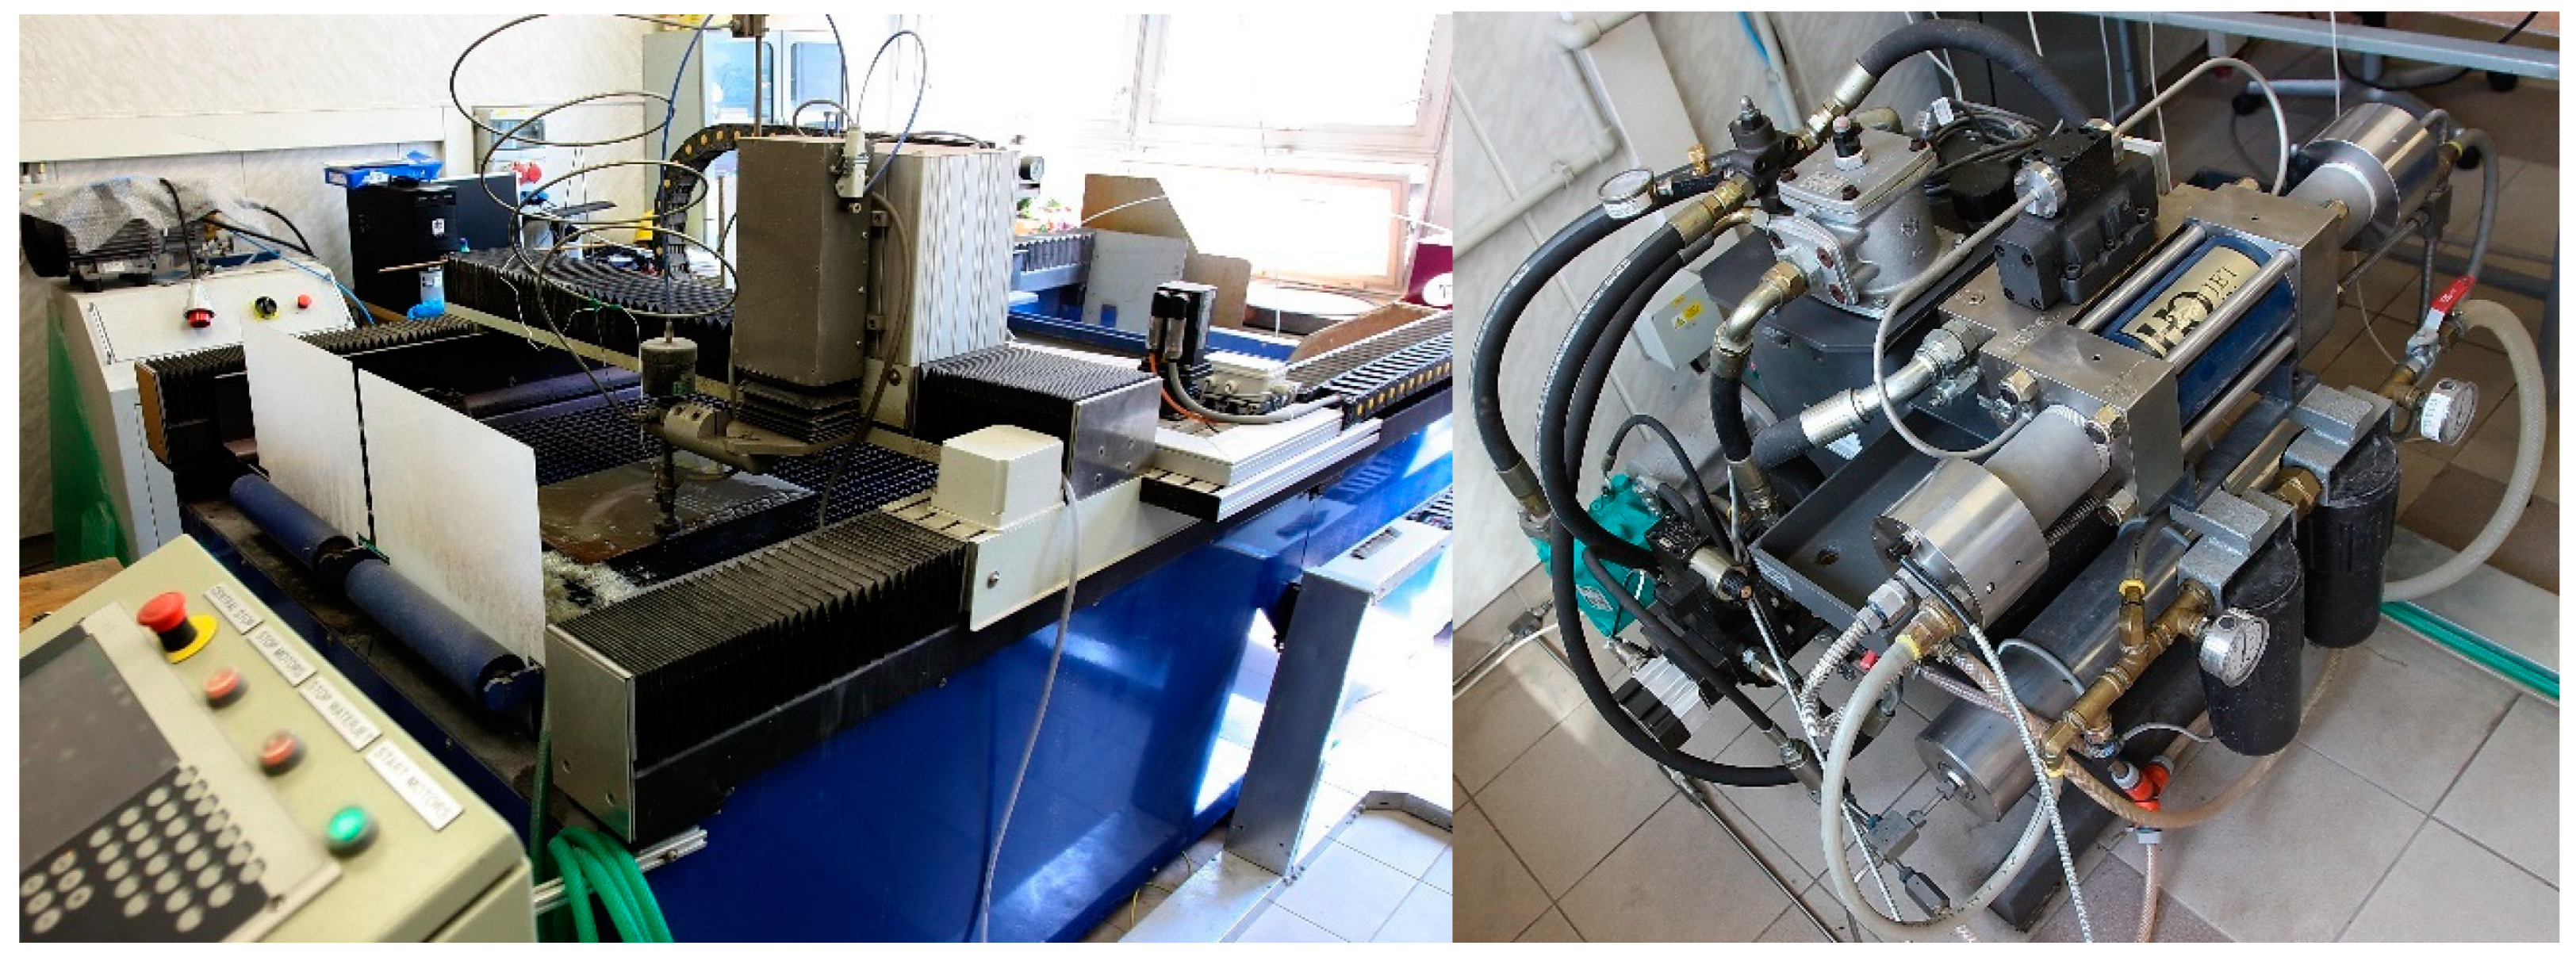
The experiments were performed on the AWJ system comprising technological (cutting) head PaserIIITM, X-Y table WJ1020-1Z-EKO with X-Y Computer Numerical Controlled (CNC) system and pump Flow HSQ 5X (see Figure 1) with combination of the following parameters:
| Water orifice diameter do | 0.25 mm |
| Stand-off distance L | 2 mm |
| Focusing tube diameter da | 1.02 mm |
| Focusing tube length la | 76 mm |
| Abrasive material average grain size ao | 0.275 mm (MESH 80) |
| Abrasive material type | Australian garnet |
| Angle of impact θ | 0 rad |
| Water jet pressure p | 300, 340, 380 MPa |
| Abrasive mass flow rates ma | 170, 220, 270 g/min |
| Experimental traverse speeds v | 40, 60 80 mm/min for each thickness 6, 10 15 mm |
| 10, 15, 20 mm/min for thickness 40 mm | |
| 60, 90, 120 mm/min for thickness 6 mm |
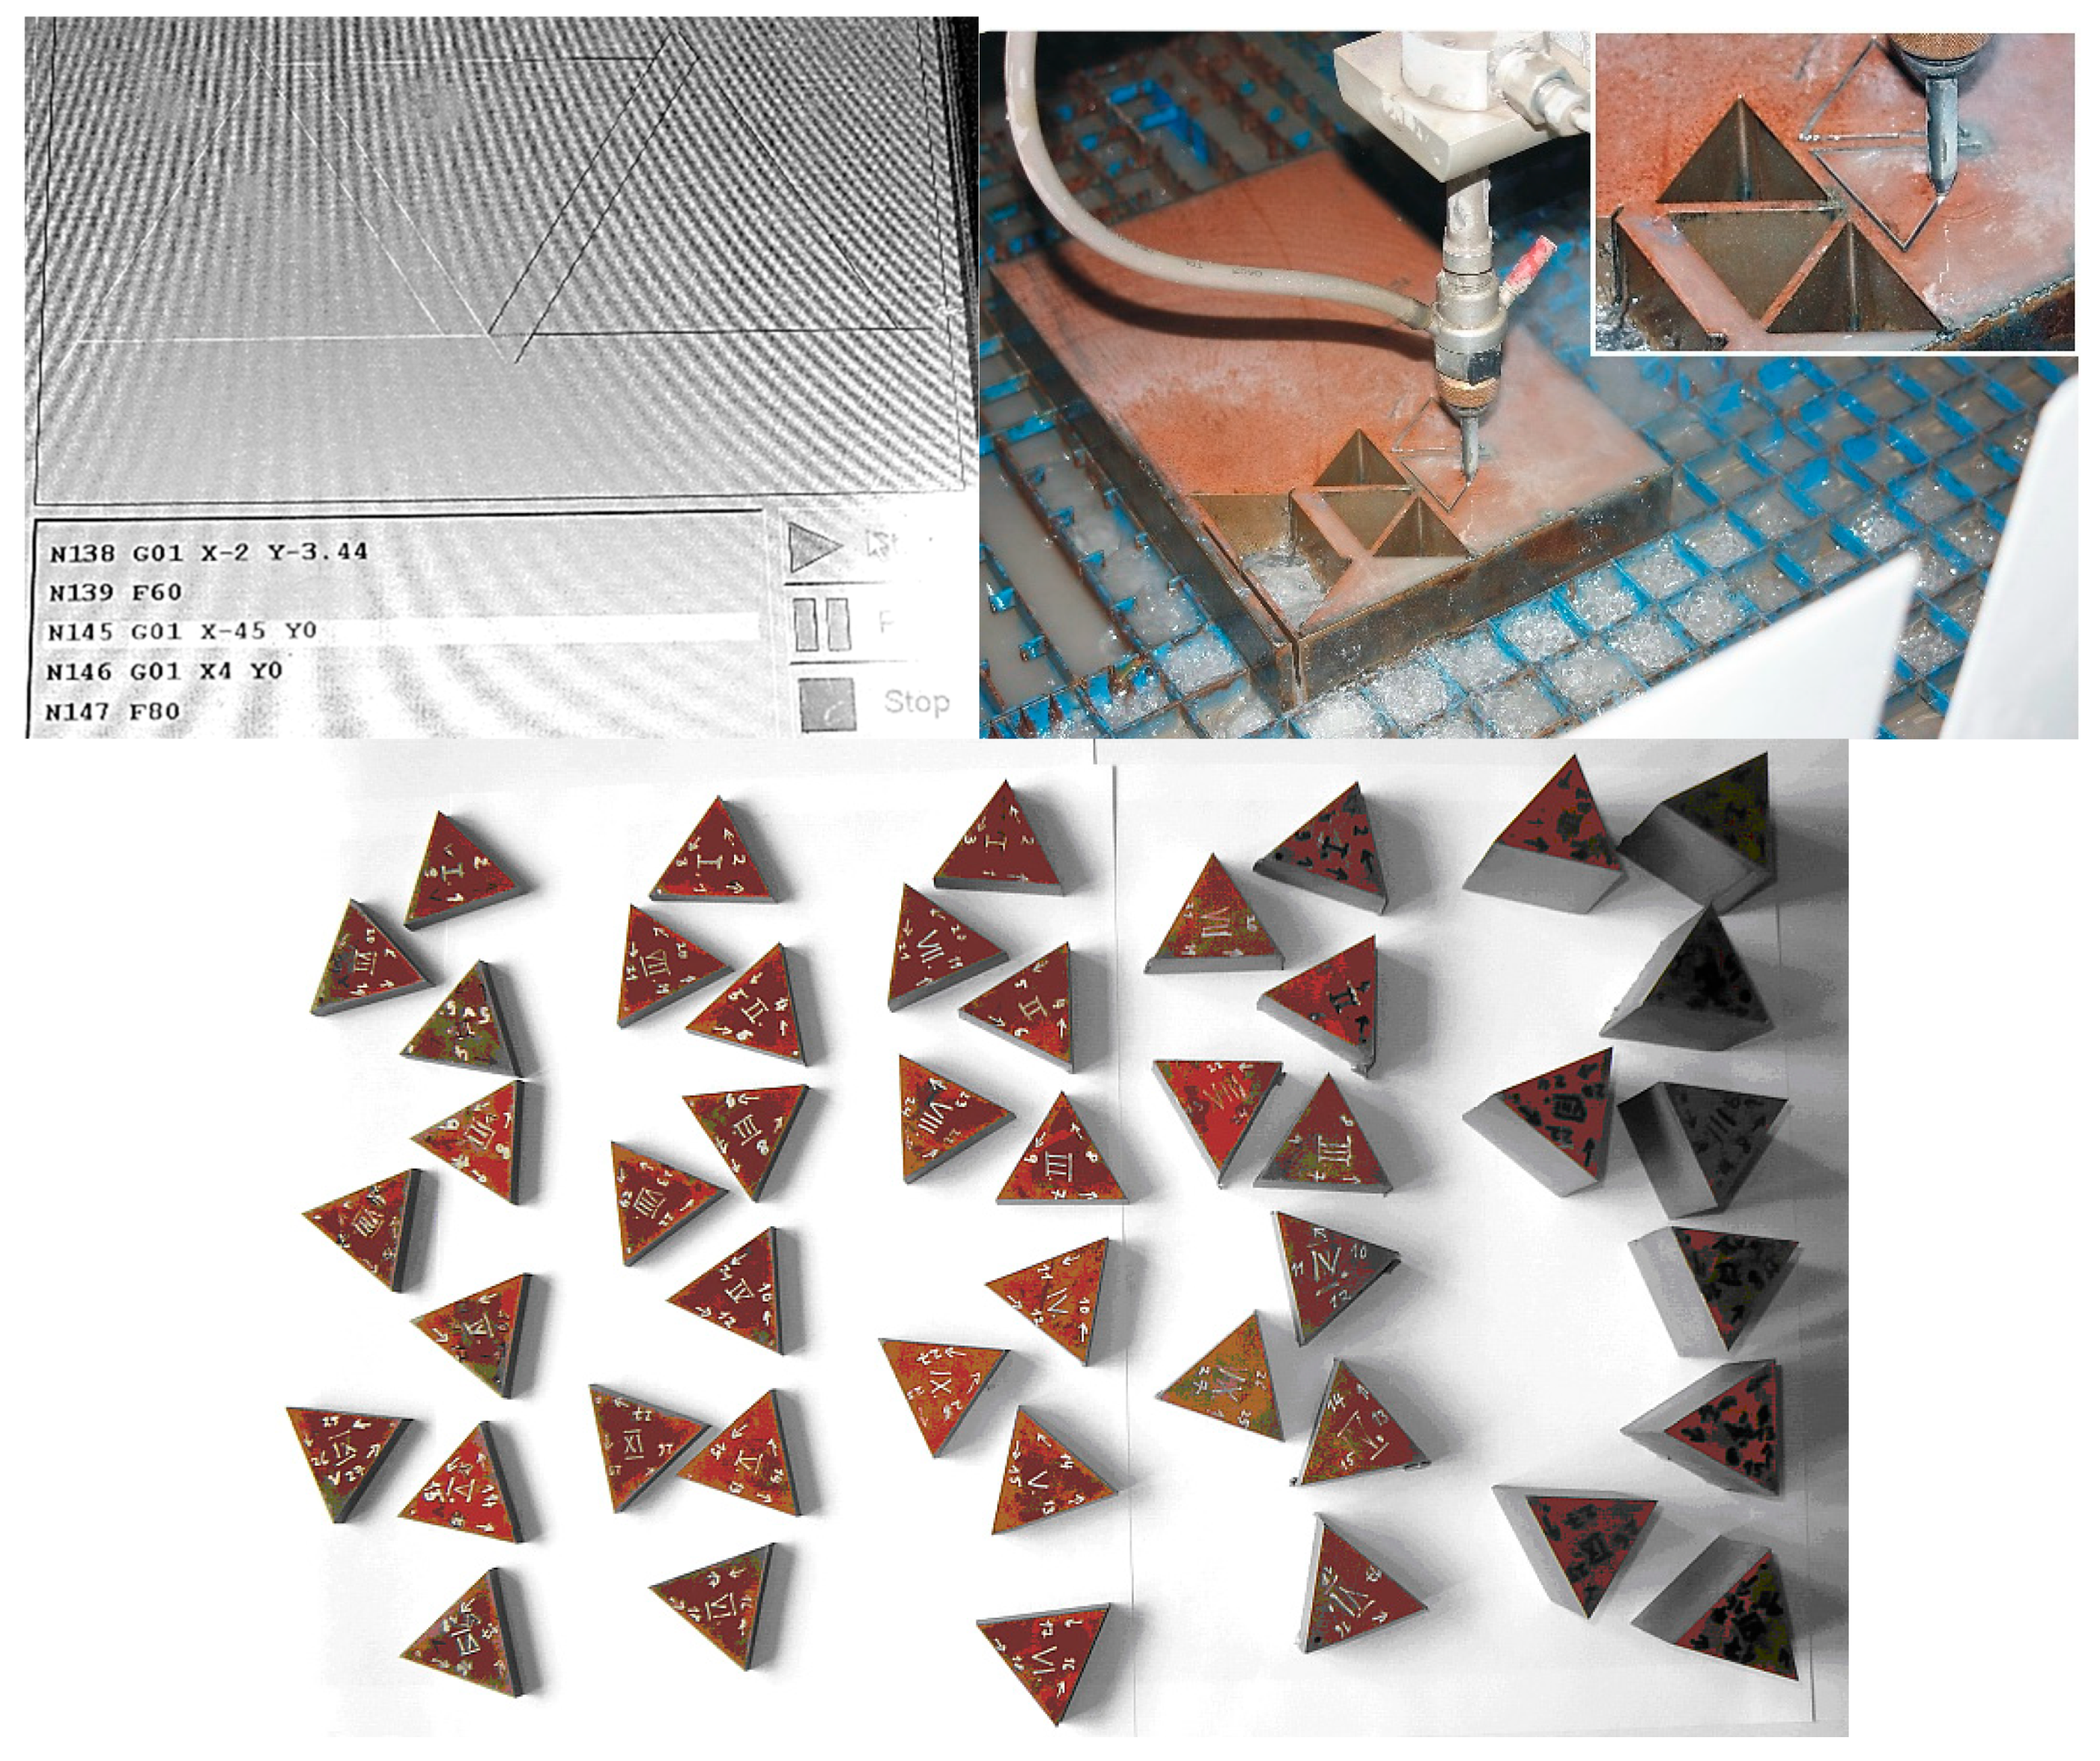
These combinations represent 135 single cuts. Therefore, 45 triangle-shaped samples were cut, each side being cut with a different traverse speed v (Figure 2). All samples’ cut surfaces were chemically treated with a passivation bath immediately after the end of the experiments—a solution of 5 g of sodium nitrite per 1 liter of water. The samples were immersed for 2–3 s in a solution at a temperature of about 60 ± 5 °C. Immediately after application of the solution, drying with hot air and storage in a dry environment followed. Surfaces treated in this way will resist corrosion for sufficient time to perform measurements.
The samples with thickness 6 mm were cut two times, ones with the same traverse speed as thicknesses 10 and 15 mm, ones with higher traverse speeds. Thickness 40 mm was not possible to cut using the same traverse speeds as other thicknesses. Therefore, the lower ones were utilized.
2.3. Roughness Measurement of Cut Surfaces
The roughness parameters Ra and Rz were measured in the middle height of the sample, i.e., at half the cut material’s thickness. The roughness parameters Ra4 and Rz4 were measured on the cut surfaces of samples of all examined thicknesses (6, 10, 15, 40 mm and 6 mm+) at a distance of 4 mm from the upper cutting edge (from the surface of the sheet where the jet enters the material) using the Mitutoyo Surftest SJ-301 roughness tester. Repeated control measurements were performed for the reliability of all measured sets of values. The control measurements’ total errors for the roughness Ra, Rz, Ra4, and Rz4 are in the range <3.06; 5.09> percent.
The Dixon test of extreme values is applied to selected sets of measured values in which some values differ significantly from the other values of the set. Based on the comparison of the calculated value and the tabular critical value of the test criterion, it can be stated with 95% probability that Rz and Ra’s assessed values are not extreme values and can therefore remain in the sets of measured values for evaluation.
Results of Ra and Rz measurements performed on the middle line of the thickness of samples cut from 6, 10, and 15 mm thick plates using the identical jet parameters mentioned above are summarized in Table 3. The additional results were measured on samples prepared from a 40 mm thick plate applying lower traverse speeds. They are presented in Table 4.
Results measured on samples 6 mm thick, cut at higher traverse speeds than samples presented in Table 3, were used to broaden the confidence interval of a regression derivation of the relationships useful for analyses, simulations, and control of the surface quality.
Results of surface roughness characteristics Ra and Rz presented in Table 3 indicate supposed relationships—increasing quality for lower traverse speeds, higher pressures in pump, and higher abrasive mass flow rates. Similar conclusions can be drawn from the results presented in Table 4. Nevertheless, the relationship between roughness and declination angle values can be derived from values in Table 4. Subsequently, the results can be compared with the model presented by Hlaváč [17].
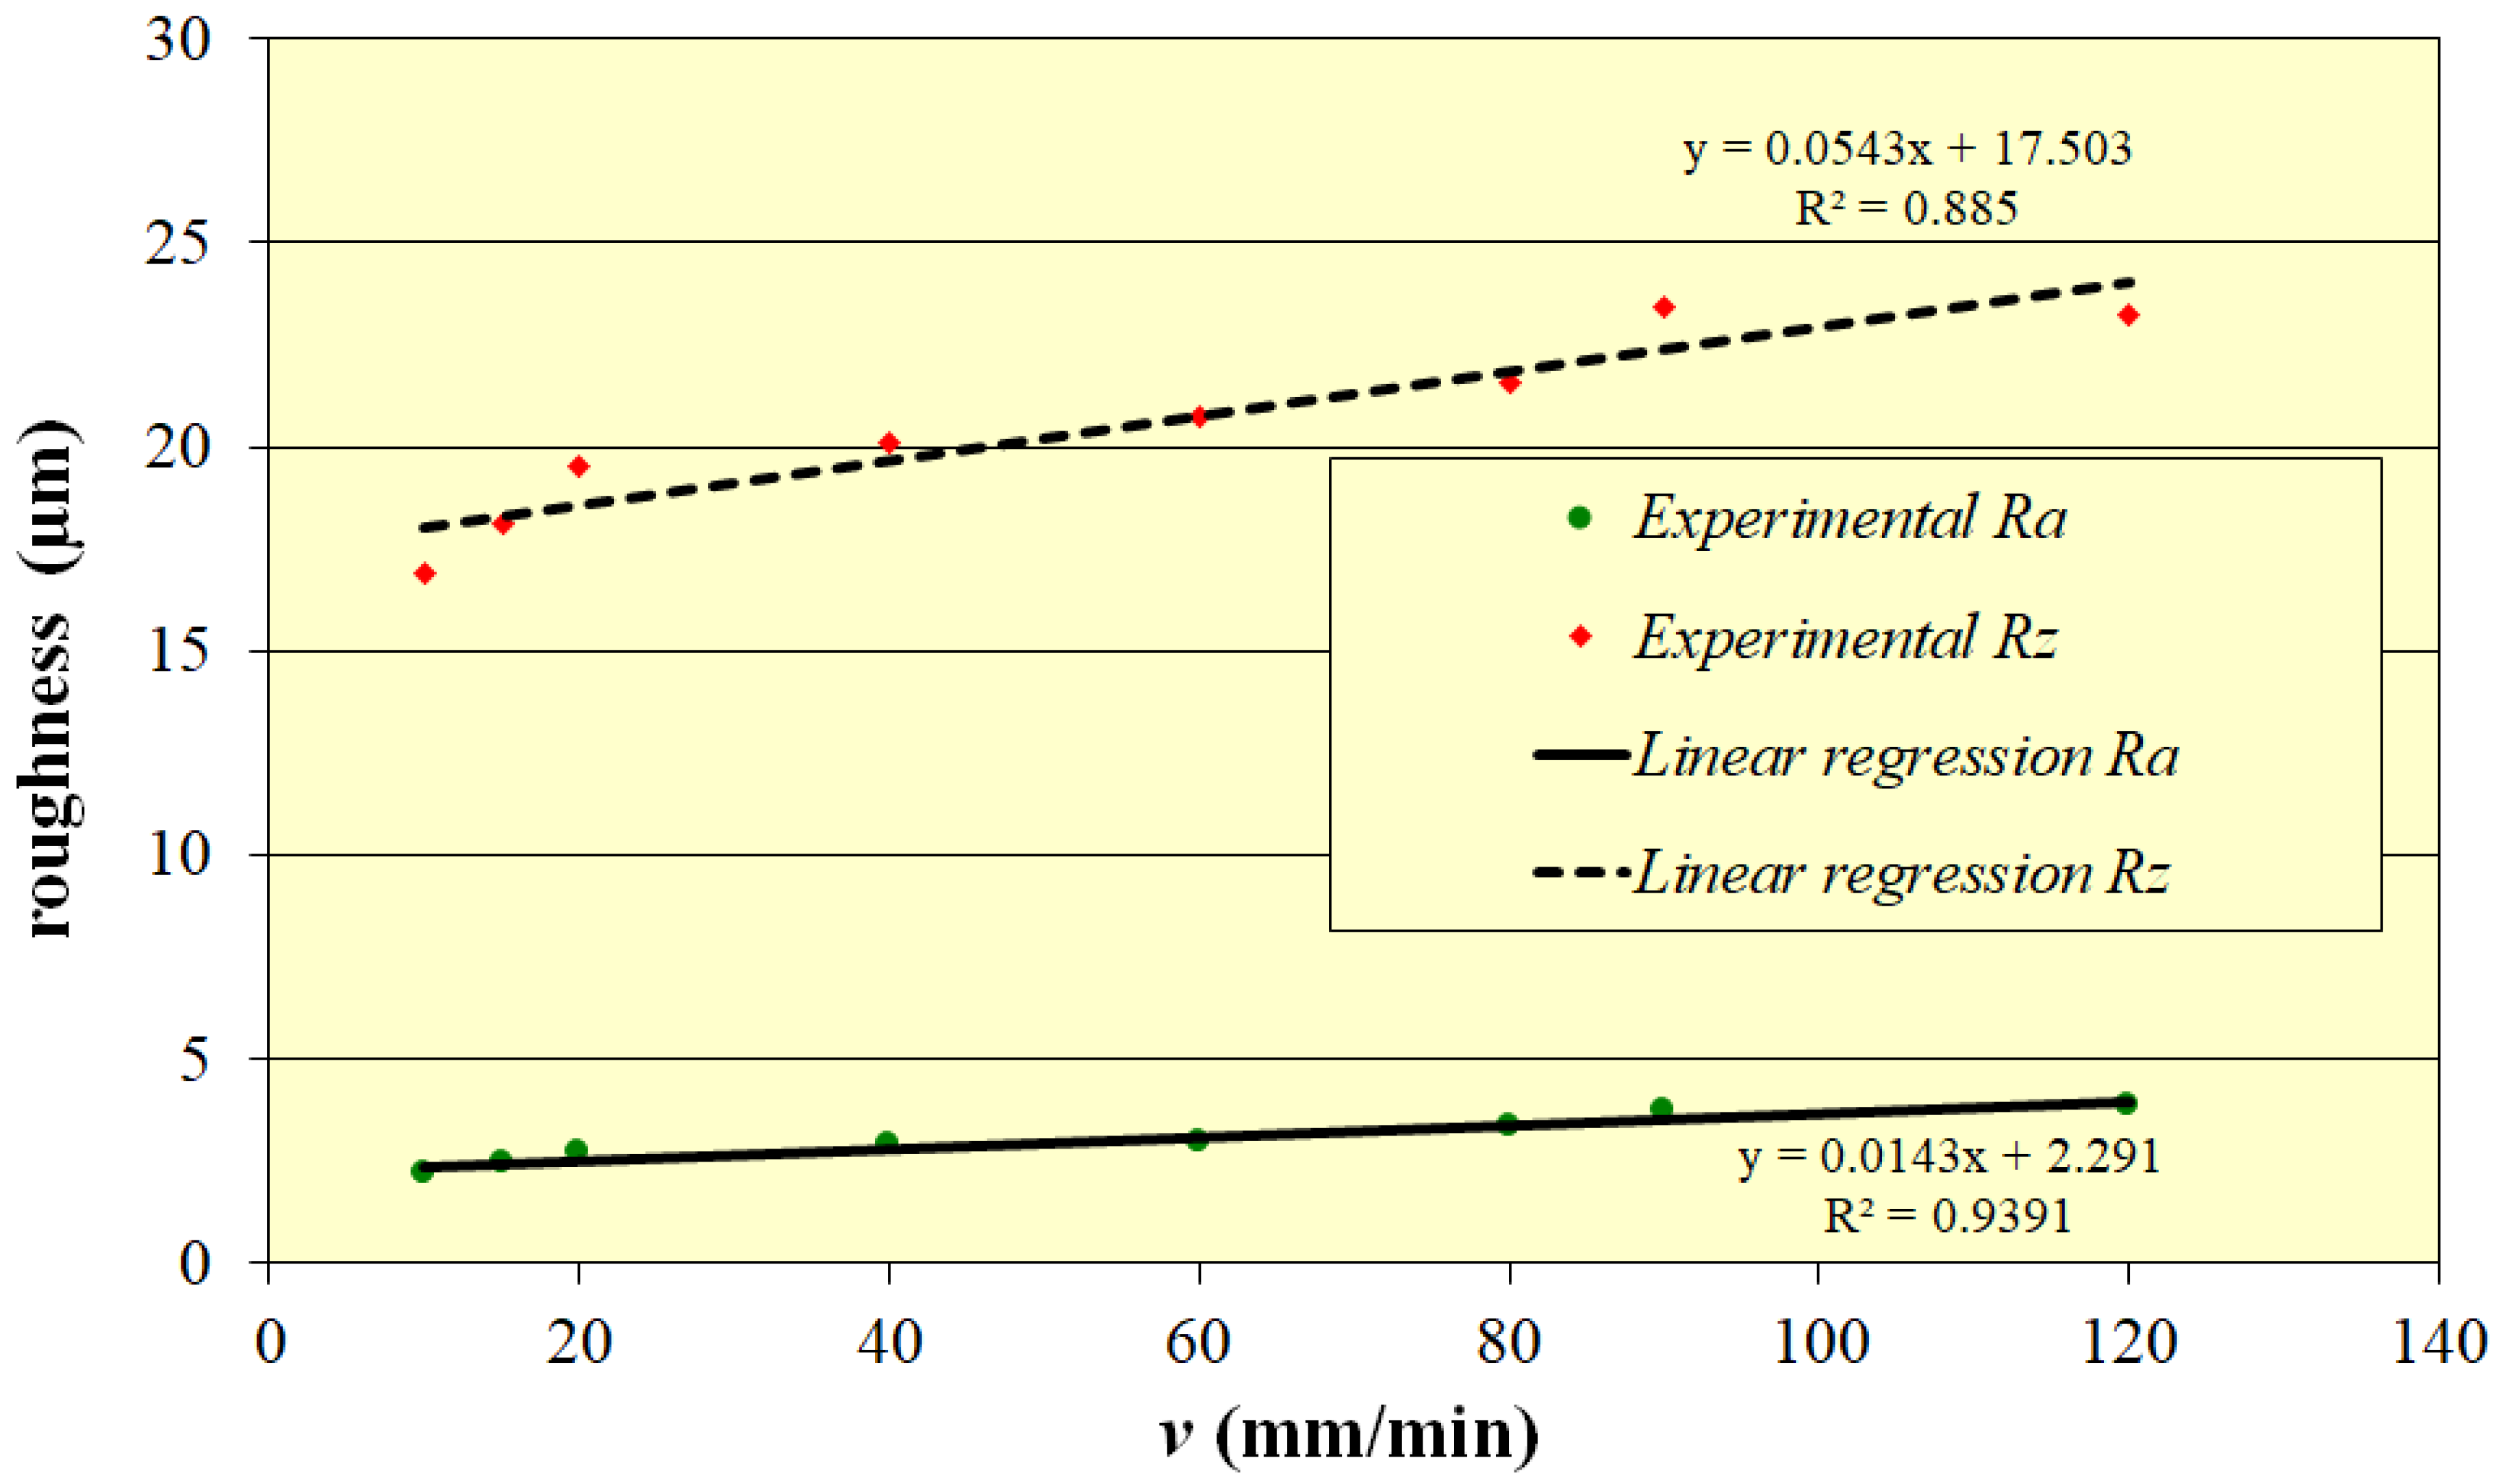
Summarizing all combinations of factors, it is possible to obtain functions describing speed-dependent roughness for each doublet ma and p. However, it is necessary to measure the values in a certain selected identical depth on the cut wall for all samples (to compare the values). The depth equal to 4 mm was selected for presentation in this paper (values are marked Ra4 and Rz4). The typical series of roughness values for all used traverse speeds is presented in Table 5. The selected abrasive mass flow rate is typical for applied nozzle diameter, focusing tube characteristics, abrasive material type, grain size, and pump pressure. Traverse speeds were completed from all experimental sets.
The graph of relation between traverse speed and surface roughness parameters is presented in Figure 3 (for values presented in Table 5).
The summary regression models for factors x1 (ma), x2 (p) and x3 (v) can be written as
Values calculated from these models were compared with further experimental results, and the comparison is presented in Table 6. The modeled surface roughness values for the respective combinations of technological parameter values were subsequently experimentally verified. The result of the verification confirmed the correctness of the verified mathematical models and the subsequently performed calculation. The deviation between the values of Ra, Rz obtained from the simulation, and the values from the subsequent verification experiment ranges from −5.4 to +5.6% for Ra and in the range of −4.9 to +0.3% for Rz. From that, it is evident that the model is simple but works effectively.
2.4. Measurements of the Angle of Declination of the Jet
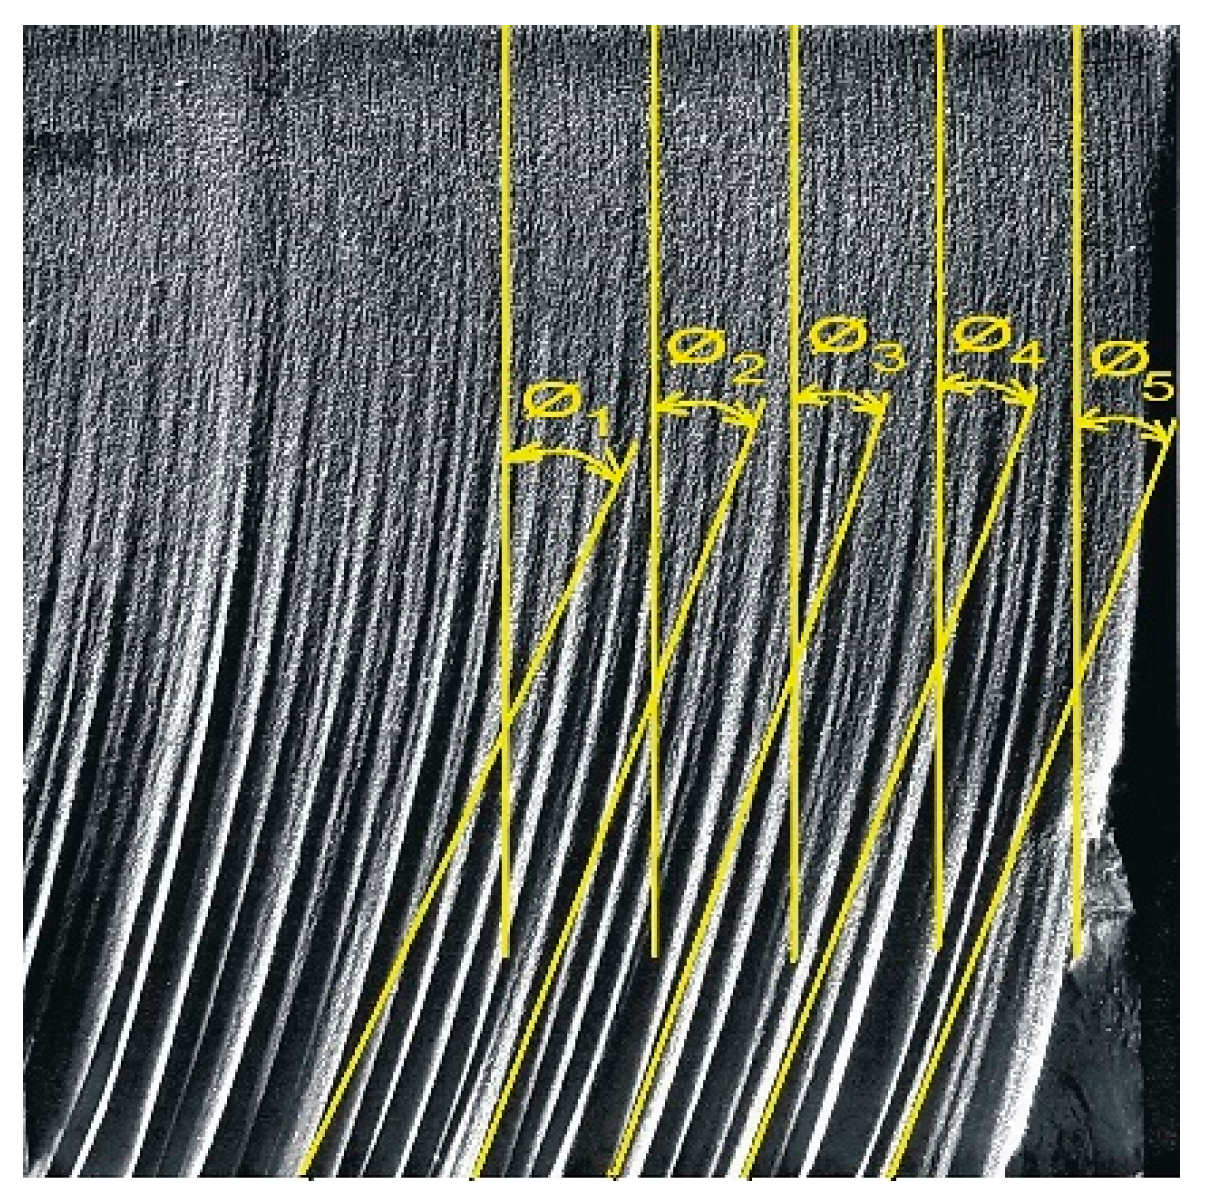
The declination angle θ of the abrasive water jet for 40 mm thick samples was measured at 5 locations on each cut surface on series of successive measurements distinct approximately 5 mm from the previous measurement in the cutting direction according to Figure 4. The resulting values of the jet deflection on the cut surfaces were obtained by the arithmetic mean of the measured repeated values on the individual cut surfaces (θ1–θ5).
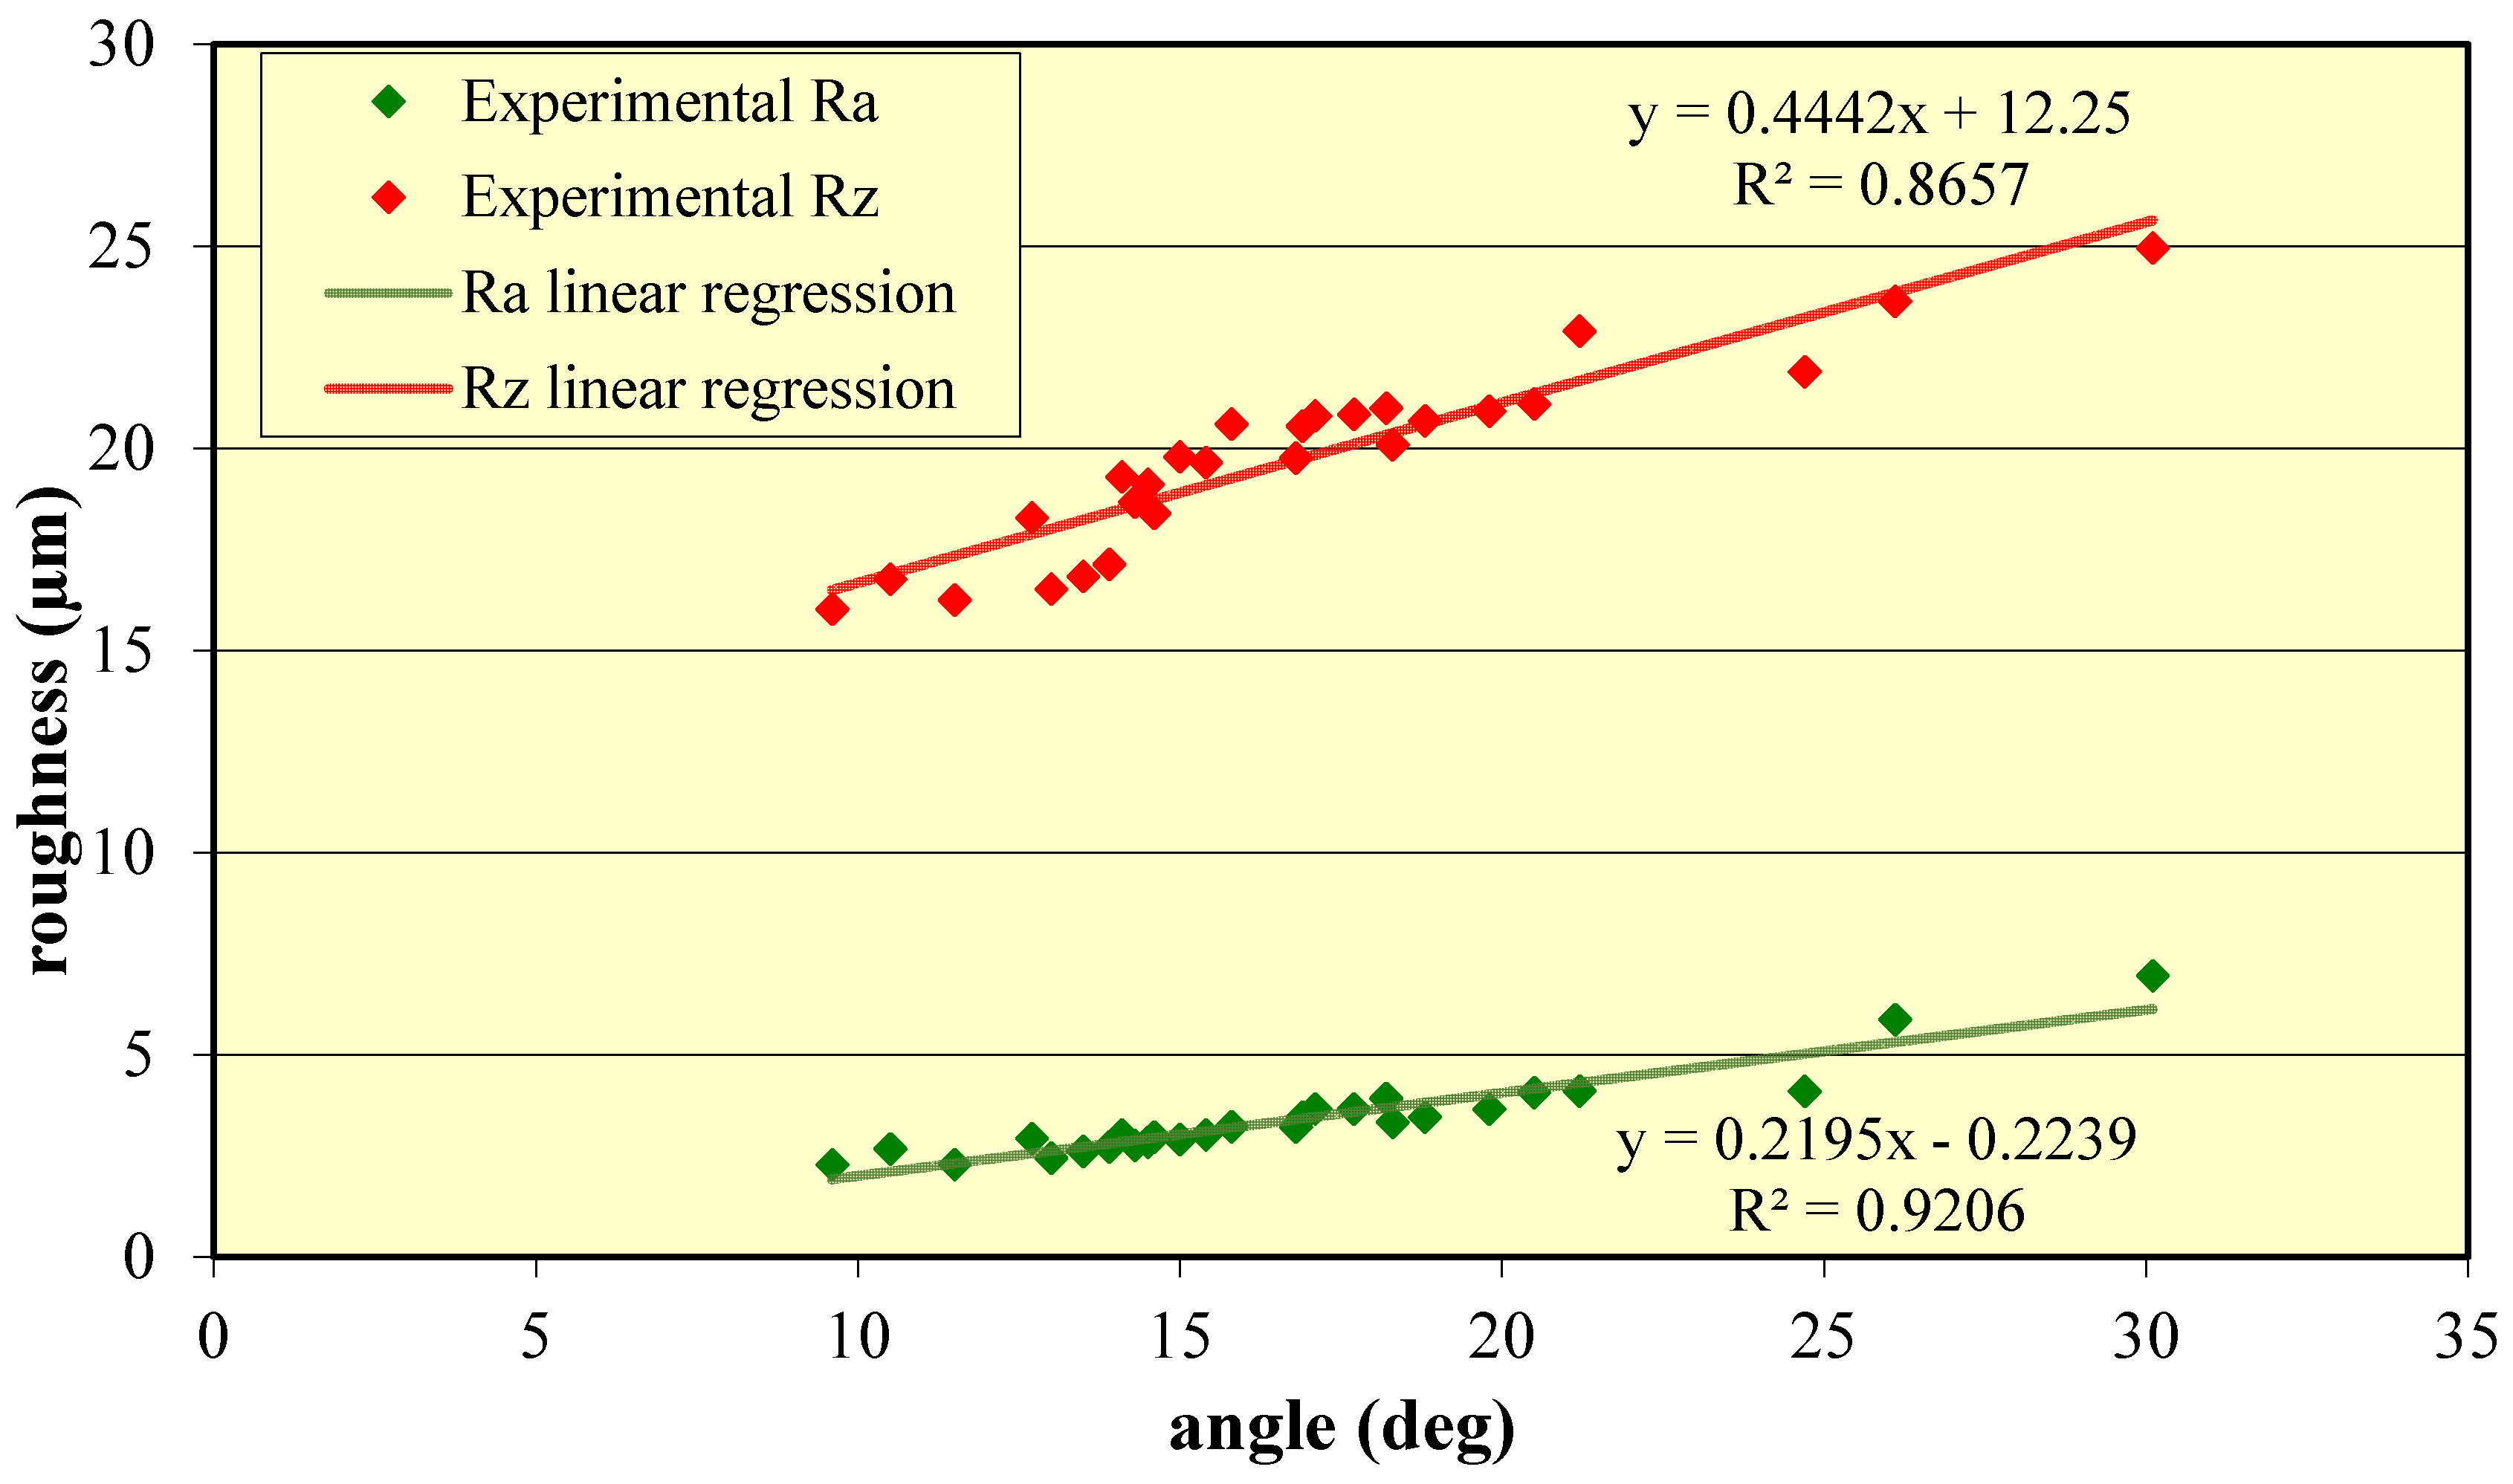
A Vogel-Germany Universal Winkelmesser device with measuring range distribution 4 × 90° and scale resolution 5′ was used to measure jet declination on cut surfaces of 40 mm thick samples. Presented results also make it possible to prepare the regression equations describing the relations between declination angle value and roughness parameters. The equations obtained from regression by the processing of all measured values for both the Ra and Rz characteristics of roughness for factor x4 (θ) are as follows
The obtained model reveals linear behavior within the tested range, as shown in Figure 5. Testing of this model accuracy on other materials is just in the stage of preparation for future work.
3. Discussion
The experimental investigation of cuts made in very hard and wear-resistant steel concludes that relationships between the declination angle and roughness parameters are linear. The studied problem is close to the tailback and the taper investigations performed in the past by Hashish [16] or Ma and Deam [28]. Precise experiments studying surface quality on the selected process parameters of the Hardox steel plates cutting were revealing the traverse speed as the most important parameter influencing the accuracy of AWJ cutting were performed previously [11,12,13].
Calculation of the tilting of the cutting head for compensation of the declination angle effect on cut walls, presented, e.g., by a group of Ostrava researchers [17,29,30], should help to improve the cutting process and to minimize the typical defects caused by the abrasive water jet declination when the cut starts, ends, changes direction in the corners and in the curved parts of trajectories. Because according to the up-to-date results, no simple and direct relationship has been proved between common material properties and cutting quality for all types of cut material, the presented relations seem to be quite important. Their further investigation and confirmation for a broad spectrum of materials are necessary.
Models proposed in the present article may be evaluated from some points of view as simple; lacking physical linking of the parameters; but still in accordance with the main features of the more complex Hlaváč model and with the experimental findings of other teams studying the quality of this type of cut materials and confirmed by experiments reported in Table 6. Thus, it may complement the variety of the materials and range of studied parameters and widen existing models for application in particular conditions.
The relations for these quantities should be the aim of further research because the miniaturization of abrasive water jets needs a strong and stable description to predict and control the production quality. Therefore, studying the surface topography on the cut walls is still important. Experimental and theoretical studies of the interaction problems are important for lifting the abrasive water jet tool to a higher level of operational excellence.
4. Conclusions
The presented research was aimed at the dependence of selected technological parameters of the AWJ system on selected parameters of the quality of the cut surface. The multiple linear regression function describing the cut wall roughness as a function of the mentioned selected cutting variables has been determined for both Ra and Rz.
The main results can be summarized as follows:
With increasing material thickness from 6 to 10 and 15 mm, the roughness in its central part increases by more than 18% at Ra and 5.5% at Rz for 6 and 10 mm thicknesses and by one third for Ra and 21% for Rz for 10 and 15 mm thicknesses.
The values of technological parameters ma = 170 g/min, p = 300 MPa, v = 80 mm/min represent the combination with which the highest roughness values while the values of technological parameters ma = 270 g/min, p = 380 MPa, v = 40 mm/min represent the combination with which the smallest roughness values were achieved. By increasing ma from 170 to 270 g/min at p = 340 MPa, it is possible to twice the speed v with an unchanged roughness value Ra of the cut surface.
The largest influence of the monitored technological parameters on the roughness (Ra, Rz) was found for the abrasive mass flow, a smaller influence was revealed for the cutting speed v.
Derived regression models (Equations (1) and (2)) show linear relationships have been determined between studied independent variables of the cutting process (traverse speed, liquid pressure, and abrasive mass flow rate) and roughness characteristics. Simultaneously, the linear relationships (Equations (3) and (4)) have also been found between declination angle values and roughness parameters Ra and Rz.
The models can be used both for a prediction of cutting variables and for a calculation of the cutting characteristics, such as traverse speeds, abrasive flow rates, and other influencing cutting walls quality. The achieved results are utilizable for improvement of the control software of the CNC machines used for water jet and abrasive water jet cutting and complement the existing solutions in the scientific field and can be used to reduce operating costs and increase the economic efficiency of production systems with AWJ technology.
The authors plan to include non-contact measurements on the samples cut using the AWJ systems, more complex roughness and waviness parameter analysis, and texture modeling of measured surfaces using their merging for future work.
Author Contributions
Conceptualization, M.S. and T.K.; methodology, M.S.; validation, T.K. and M.S.; formal analysis, M.S.; data curation, T.K.; writing—original draft preparation, M.S.; writing—review and editing, T.K.; visualization, J.M.; supervision, T.K.; project administration, J.M.; funding acquisition, S.G. All authors have read and agreed to the published version of the manuscript.
Funding
This work was supported by the Slovak Ministry of Education within project VEGA No. 1/0116/20 and by the Slovak Research and Development Agency under contract No. APVV-18-0316.
Acknowledgments
Authors would like to acknowledge Stanislav Fabian for valuable comments.
Conflicts of Interest
The authors declare no conflict of interest and the funders had no role in the design of the study; in the collection, analyses, or interpretation of data; in the writing of the manuscript, or in the decision to publish the results.
Nomenclature
| angle between impinging jet axis and tangent to the striation curve in the selected depth h…[°] | |
| average mean size of abrasive particles formed in the mixing process…[m] | |
| average mean size of abrasive particles entering the mixing process…[m] | |
| water nozzle diameter…[mm] | |
| focusing tube diameter…[mm] | |
| material thickness…[mm] | |
| focusing tube length…[mm] | |
| stand-off distance…[mm] | |
| water jet pressure…[MPa] | |
| abrasive mass flow rate…[g/min] | |
| traverse speed…[mm/min] | |
| Ra | arithmetic average roughness…[µm] |
| Rz | maximum peak to valley height of the profile…[µm] |
References
- Hashish, M. Modeling study of metal cutting with abrasive waterjets. J. Eng. Mater. Technol. Trans. ASME 1984, 106, 88–100. [Google Scholar] [CrossRef]
- Hashish, M. A Model for Abrasive—Waterjet (AWJ) Machining. J. Eng. Mater. Technol. Trans. ASME 1989, 111, 154–162. [Google Scholar] [CrossRef]
- Zeng, J.; Kim, T.J. Development of an abrasive waterjet kerf cutting model for brittle materials. In Jet Cutting Technology; Lichtarowicz, A., Ed.; Kluwer Academic Publishers: Dordrecht, The Netherlands, 1992; pp. 483–501. [Google Scholar]
- Zeng, J.; Kim, T.J. An erosion model of polycrystalline ceramics in abrasive waterjet cutting. Wear 1996, 193, 207–217. [Google Scholar] [CrossRef]
- Kovacevic, R.; Yong, Z. Modelling of 3D abrasive waterjet machining, part 1—Theoretical basis. In Jetting Technology; Gee, C., Ed.; Mechanical Engineering Publications Ltd.: Bury St Edmunds, UK; London, UK, 1996; pp. 73–82. [Google Scholar]
- Yong, Z.; Kovacevic, R. Modelling of 3D abrasive waterjet machining. Part 2—Simulation of machining. In Jetting Technology; Gee, C., Ed.; Mechanical Engineering Publications Ltd.: Bury St Edmunds, UK; London, UK, 1996; pp. 83–89. [Google Scholar]
- Hlaváč, L.M. JETCUT—Software for prediction of high-energy waterjet efficiency. In Jetting Technology; Louis, H., Ed.; Prof. Eng. Pub. Ltd.: Bury St Edmunds, UK; London, UK, 1998; pp. 25–37. [Google Scholar]
- Chen, F.L.; Wang, J.; Lemma, E.; Siores, E. Striation formation mechanism on the jet cutting surface. J. Mater. Process. Technol. 2003, 141, 213–218. [Google Scholar] [CrossRef]
- Henning, A.; Westkämper, E. Analysis of the cutting front in abrasive waterjet cutting. In Water Jetting; Longman, P., Ed.; BHR Group: Cranfield, UK; Bedford, UK, 2006; pp. 425–434. [Google Scholar]
- Monno, M.; Pellegrini, G.; Ravasio, C. An experimental investigation of the kerf realised by AWJ: The influence of the pressure fluctuations. In Water Jetting; Longman, P., Ed.; BHR Group: Cranfield, UK; Bedford, UK, 2006; pp. 309–321. [Google Scholar]
- Sutowska, M.; Kapłonek, W.; Pimenov, D.Y.; Gupta, M.K.; Mia, M.; Sharma, S. Influence of variable radius of cutting head trajectory on quality of cutting kerf in the abrasive water jet process for soda–lime glass. Materials 2020, 13, 4277. [Google Scholar] [CrossRef] [PubMed]
- Filip, A.C.; Mihail, L.A.; Vasiloni, M.A. An experimental study on the dimensional accuracy of holes made by abrasive waterjet machining of Hardox steels. MATEC Web Conf. 2017, 137, 02003. [Google Scholar] [CrossRef] [Green Version]
- Filip, A.C.; Vasiloni, M.A.; Mihail, L.A. Experimental research on the machinability of Hardox steel by abrasive waterjet cutting. MATEC Web Conf. 2017, 94, 03003. [Google Scholar] [CrossRef] [Green Version]
- Krenický, T. Non-contact study of surfaces created using the AWJ technology. Manuf. Technol. 2015, 15, 61–64. [Google Scholar] [CrossRef]
- Maščenik, J.; Gašpár, Š. Experimental assessment of roughness changes in the cutting surface and microhardness changes of the material S 355 J2 G3 after being cut by non-conventional technologies. Adv. Mater. Res. 2011, 314–316, 1944–1947. [Google Scholar] [CrossRef]
- Pahuja, R.; Ramulu, M.; Hashish, M. Surface quality and kerf width prediction in abrasive water jet machining of metal-composite stacks. Compos. Part B Eng. 2019, 175, 107134. [Google Scholar] [CrossRef]
- Hlaváč, L.M. Investigation of the abrasive water jet trajectory curvature inside the kerf. J. Mater. Process. Technol. 2009, 209, 4154–4161. [Google Scholar] [CrossRef]
- Deam, R.T.; Lemma, E.; Ahmed, D.H. Modelling of the abrasive water jet cutting process. Wear 2004, 257, 877–891. [Google Scholar] [CrossRef]
- Orbanic, H.; Junkar, M. Analysis of striation formation mechanism in abrasive water jet cutting. Wear 2008, 265, 821–830. [Google Scholar] [CrossRef]
- Rahman, M.A.; Mustafizur, R.; Kumar, A.S. Chip perforation and ‘Burnishing–like’ finishing of Al alloy in precision machining. Precis. Eng. 2017, 50, 393–409. [Google Scholar] [CrossRef]
- Hlaváč, L.M.; Hlaváčová, I.M.; Arleo, F.; Viganò, F.; Annoni, M.; Geryk, V. Shape distortion reduction method for abrasive water jet (AWJ) cutting. Precis. Eng. 2018, 53, 194–202. [Google Scholar] [CrossRef]
- Hlaváč, L.M.; Štefek, A.; Tyč, M.; Krajcarz, D. Influence of material structure on forces measured during Abrasive Waterjet (AWJ) machining. Materials 2020, 13, 3878. [Google Scholar] [CrossRef] [PubMed]
- Hlaváč, L.M.; Hlaváčová, I.M.; Plančár, Š.; Krenický, T.; Geryk, V. Deformation of products cut on AWJ x-y tables and its suppression. IOP Conf. Ser. Mater. Sci. Eng. 2018, 307, 012015. [Google Scholar] [CrossRef]
- Mascenik, J. Experimental determination of cutting speed influence on cutting surface character in material laser cutting. MM Sci. J. 2016, 3, 960–963. [Google Scholar] [CrossRef] [Green Version]
- Servátka, M. Modelling, simulation and optimization of the technological parameters in binding on the demanded quality of products in manufacturing technologies with water jet. Ph.D. Thesis, FMT TUKE, Prešov, Slovak, 2009. [Google Scholar]
- Olejárová, Š.; Ružbarský, J.; Krenický, T. Introduction into the issue of water jet machining. In Vibrations in the Production System. SpringerBriefs in Applied Sciences and Technology; Springer: Cham, Swizerland, 2019; pp. 1–10. ISBN 978-3-030-01736-1. [Google Scholar] [CrossRef]
- Hardox 500 Data Sheet, Version 2005-07-04. Available online: www.ssab.com (accessed on 11 July 2012).
- Ma, C.; Deam, R.T. A correlation for predicting the kerf profile from abrasive water jet cutting. Exp. Therm. Fluid Sci. 2006, 30, 337–343. [Google Scholar] [CrossRef]
- Štefek, A.; Hlaváč, L.M.; Tyč, M.; Barták, P.; Kozelský, J. Remarks to Abrasive Waterjet (AWJ) Forces Measurements; Advances in Water Jetting. Water Jet 2019. In Lecture Notes in Mechanical Engineering; Klichová, D., Sitek, L., Hloch, S., Valentinčič, J., Eds.; Springer: Cham, Switzerland, 2021. [Google Scholar] [CrossRef]
- Hlaváč, L.M.; Hlaváčová, I.M.; Gembalová, L.; Jonšta, P. Experimental investigation of depth dependent kerf width in abrasive water jet cutting. In Water Jetting; Trieb, F.H., Ed.; BHR Group: Cranfield, UK; Bedford, UK, 2010; pp. 459–467. [Google Scholar]
Figure 1.
Experimental AWJ system (on the left) and pump Flow HSQ 5X (on the right).

Figure 2.
The cutting program’s screen and detail of the HardoxTM steel plates cutting (on the top); below samples prepared from (thicknesses from left to right 6, 6, 10, 15 and 40 mm).
Figure 2.
The cutting program’s screen and detail of the HardoxTM steel plates cutting (on the top); below samples prepared from (thicknesses from left to right 6, 6, 10, 15 and 40 mm).

Figure 3.
Roughness dependence on traverse speed with linear regression (graph).

Figure 4.
Locations of zones for measuring roughness parameters Ra, Rz, and Ra4, Rz4 (upper left); measurement of roughness Ra, Rz, and Ra4, Rz4 on cut surfaces of samples (upper right); declination angle on the cut surface (bottom).
Figure 4.
Locations of zones for measuring roughness parameters Ra, Rz, and Ra4, Rz4 (upper left); measurement of roughness Ra, Rz, and Ra4, Rz4 on cut surfaces of samples (upper right); declination angle on the cut surface (bottom).


Figure 5.
Roughness dependence on traverse speed with linear regression (typical graph).


Table 1.
Chemical composition of the HardoxTM 500 plate samples [27].
Table 1.
Chemical composition of the HardoxTM 500 plate samples [27].
| Plate Thickness mm | C Max % | Si Max % | Mn Max % | P Max % | S Max % | Cr Max % | Ni Max % | Mo Max % | B Max % |
|---|---|---|---|---|---|---|---|---|---|
| 4-13 | 0.27 | 0.70 | 1.60 | 0.025 | 0.010 | 1.00 | 0.25 | 0.25 | 0.004 |
| (13)-32 | 0.29 | 0.70 | 1.60 | 0.025 | 0.010 | 1.00 | 0.50 | 0.30 | 0.004 |
| (32)-40 | 0.29 | 0.70 | 1.60 | 0.025 | 0.010 | 1.00 | 1.00 | 0.60 | 0.004 |
Table 2.
Combinations of technological parameter values for sets of experiments.
| Combination of Technological Values Parameters (Cutting No.) | Technological Parameter | ||||
|---|---|---|---|---|---|
| ma | p | v | v+ | v− | |
| 1 | 170 | 300 | 40 | 60 | 10 |
| 2 | 170 | 300 | 60 | 90 | 15 |
| 3 | 170 | 300 | 80 | 120 | 20 |
| 4 | 170 | 340 | 40 | 60 | 10 |
| 5 | 170 | 340 | 60 | 90 | 15 |
| 6 | 170 | 340 | 80 | 120 | 20 |
| 7 | 170 | 380 | 40 | 60 | 10 |
| 8 | 170 | 380 | 60 | 90 | 15 |
| 9 | 170 | 380 | 80 | 120 | 20 |
| 10 | 220 | 300 | 40 | 60 | 10 |
| 11 | 220 | 300 | 60 | 90 | 15 |
| 12 | 220 | 300 | 80 | 120 | 20 |
| 13 | 220 | 340 | 40 | 60 | 10 |
| 14 | 220 | 340 | 60 | 90 | 15 |
| 15 | 220 | 340 | 80 | 120 | 20 |
| 16 | 220 | 380 | 40 | 60 | 10 |
| 17 | 220 | 380 | 60 | 90 | 15 |
| 18 | 220 | 380 | 80 | 120 | 20 |
| 19 | 270 | 300 | 40 | 60 | 10 |
| 20 | 270 | 300 | 60 | 90 | 15 |
| 21 | 270 | 300 | 80 | 120 | 20 |
| 22 | 270 | 340 | 40 | 60 | 10 |
| 23 | 270 | 340 | 60 | 90 | 15 |
| 24 | 270 | 340 | 80 | 120 | 20 |
| 25 | 270 | 380 | 40 | 60 | 10 |
| 26 | 270 | 380 | 60 | 90 | 15 |
| 27 | 270 | 380 | 80 | 120 | 20 |
Table 3.
Values of roughness Ra and Rz measured on cut surfaces of samples.
| Sample Number | Cut Surface Number | ma g/min | P MPa | v mm/min | 6 mm Ra µm | 6 mm Rz µm | 10 mm Ra µm | 10 mm Rz µm | 15 mm Ra µm | 15 mm Rz µm |
|---|---|---|---|---|---|---|---|---|---|---|
| I | 1 | 170 | 300 | 40 | 3.17 | 21.88 | 4.44 | 23.82 | 4.92 | 26.76 |
| 2 | 170 | 300 | 60 | 3.52 | 22.02 | 4.36 | 24.58 | 6.12 | 32.26 | |
| 3 | 170 | 300 | 80 | 3.69 | 22.11 | 4.98 | 29.25 | 7.93 | 35.97 | |
| II | 4 | 170 | 340 | 40 | 3.06 | 21.73 | 3.87 | 23.41 | 4.62 | 26.32 |
| 5 | 170 | 340 | 60 | 3.42 | 21.90 | 4.44 | 23.66 | 5.96 | 29.49 | |
| 6 | 170 | 340 | 80 | 3.63 | 22.02 | 4.72 | 24.77 | 7.11 | 35.25 | |
| III | 7 | 170 | 380 | 40 | 3.04 | 21.59 | 3.76 | 22.80 | 4.23 | 24.45 |
| 8 | 170 | 380 | 60 | 3.18 | 21.61 | 3.67 | 22.87 | 5.74 | 28.42 | |
| 9 | 170 | 380 | 80 | 3.56 | 21.91 | 4.26 | 23.78 | 6.86 | 34.65 | |
| IV | 10 | 220 | 300 | 40 | 2.98 | 21.45 | 3.68 | 22.50 | 4.18 | 23.14 |
| 11 | 220 | 300 | 60 | 3.05 | 21.50 | 3.58 | 23.12 | 5.36 | 28.21 | |
| 12 | 220 | 300 | 80 | 3.52 | 21.77 | 4.40 | 24.15 | 6.24 | 34.49 | |
| V | 13 | 220 | 340 | 40 | 2.87 | 21.05 | 3.32 | 21.18 | 3.84 | 22.24 |
| 14 | 220 | 340 | 60 | 3.02 | 21.41 | 3.47 | 21.51 | 5.08 | 26.73 | |
| 15 | 220 | 340 | 80 | 3.28 | 21.52 | 3.33 | 22.00 | 6.02 | 33.20 | |
| VI | 16 | 220 | 380 | 40 | 2.73 | 19.39 | 3.07 | 20.00 | 3.22 | 20.48 |
| 17 | 220 | 380 | 60 | 2.99 | 21.12 | 3.33 | 20.70 | 3.78 | 21.30 | |
| 18 | 220 | 380 | 80 | 3.26 | 21.08 | 3.30 | 21.58 | 5.62 | 31.66 | |
| VII | 19 | 270 | 300 | 40 | 2.71 | 18.39 | 3.05 | 19.37 | 3.11 | 19.48 |
| 20 | 270 | 300 | 60 | 2.92 | 21.02 | 3.40 | 20.30 | 3.56 | 20.25 | |
| 21 | 270 | 300 | 80 | 3.20 | 20.90 | 3.28 | 20.82 | 5.49 | 30.80 | |
| VIII | 22 | 270 | 340 | 40 | 2.42 | 17.45 | 2.79 | 18.54 | 2.95 | 19.02 |
| 23 | 270 | 340 | 60 | 2.78 | 19.87 | 3.14 | 19.75 | 3.27 | 19.68 | |
| 24 | 270 | 340 | 80 | 3.08 | 20.22 | 3.25 | 20.01 | 5.40 | 28.00 | |
| IX | 25 | 270 | 380 | 40 | 2.27 | 17.20 | 2.75 | 17.81 | 3.10 | 18.27 |
| 26 | 270 | 380 | 60 | 2.44 | 19.11 | 2.89 | 19.05 | 3.08 | 19.33 | |
| 27 | 270 | 380 | 80 | 2.80 | 19.35 | 3.22 | 19.62 | 3.76 | 24.01 |
Table 4.
Measured values of declination angle θ and roughness characteristics Ra and Rz on the cut walls at samples with a thickness of 40 mm.
Table 4.
Measured values of declination angle θ and roughness characteristics Ra and Rz on the cut walls at samples with a thickness of 40 mm.
| Sample Number | Surface Number | ma g/min | p MPa | v mm/min | θ deg | Ra µm | Rz µm |
|---|---|---|---|---|---|---|---|
| I | 1 | 170 | 300 | 10 | 17.7 | 3.65 | 20.84 |
| 2 | 170 | 300 | 15 | 24.7 | 4.09 | 21.90 | |
| 3 | 170 | 300 | 20 | 30.1 | 6.95 | 24.96 | |
| II | 4 | 170 | 340 | 10 | 15.0 | 2.90 | 19.79 |
| 5 | 170 | 340 | 15 | 18.2 | 3.92 | 21.00 | |
| 6 | 170 | 340 | 20 | 26.1 | 5.87 | 23.64 | |
| III | 7 | 170 | 380 | 10 | 14.5 | 2.83 | 19.11 |
| 8 | 170 | 380 | 15 | 17.1 | 3.66 | 20.81 | |
| 9 | 170 | 380 | 20 | 21.2 | 4.10 | 22.90 | |
| IV | 10 | 220 | 300 | 10 | 14.3 | 2.75 | 18.67 |
| 11 | 220 | 300 | 15 | 16.9 | 3.46 | 20.56 | |
| 12 | 220 | 300 | 20 | 20.5 | 4.07 | 21.10 | |
| V | 13 | 220 | 340 | 10 | 13.9 | 2.71 | 17.14 |
| 14 | 220 | 340 | 15 | 15.8 | 3.22 | 20.60 | |
| 15 | 220 | 340 | 20 | 19.8 | 3.65 | 20.93 | |
| VI | 16 | 220 | 380 | 10 | 13.5 | 2.60 | 16.83 |
| 17 | 220 | 380 | 15 | 15.4 | 3.02 | 19.66 | |
| 18 | 220 | 380 | 20 | 18.8 | 3.46 | 20.69 | |
| VII | 19 | 270 | 300 | 10 | 13.0 | 2.44 | 16.52 |
| 20 | 270 | 300 | 15 | 14.1 | 3.01 | 19.30 | |
| 21 | 270 | 300 | 20 | 18.3 | 3.33 | 20.10 | |
| VIII | 22 | 270 | 340 | 10 | 11.5 | 2.28 | 16.25 |
| 23 | 270 | 340 | 15 | 12.7 | 2.93 | 18.29 | |
| 24 | 270 | 340 | 20 | 16.8 | 3.21 | 19.77 | |
| IX | 25 | 270 | 380 | 10 | 9.6 | 2.27 | 16.02 |
| 26 | 270 | 380 | 15 | 10.5 | 2.67 | 16.77 | |
| 27 | 270 | 380 | 20 | 14.6 | 2.96 | 18.40 |
Table 5.
Typical series of roughness values Ra4, Rz4 (abrasive mass flow rate 220 g/min and pressure 380 MPa are typical technological parameters used for cutting).
Table 5.
Typical series of roughness values Ra4, Rz4 (abrasive mass flow rate 220 g/min and pressure 380 MPa are typical technological parameters used for cutting).
| v mm/min | ma g/min | p MPa | Ra4 µm | Rz4 µm |
|---|---|---|---|---|
| 10 | 220 | 380 | 2.16 | 16.90 |
| 15 | 220 | 380 | 2.44 | 18.09 |
| 20 | 220 | 380 | 2.71 | 19.53 |
| 40 | 220 | 380 | 2.89 | 20.11 |
| 60 | 220 | 380 | 2.98 | 20.75 |
| 80 | 220 | 380 | 3.32 | 21.58 |
| 90 | 220 | 380 | 3.70 | 23.45 |
| 120 | 220 | 380 | 3.85 | 23.22 |
Table 6.
Comparison of calculated and measured roughness values Ra and Rz.
| Technological Parameters | Quality Parameters | Deviation of Calculated Value Regarding the Experimental Value | ||||||
|---|---|---|---|---|---|---|---|---|
| Abrasive Mass Flow Rate | Pump Pressure | Traverse Speed | Values Calculated from Model | Measured Experimental Values | ||||
| ma (x1) g/min | p (x2) MPa | v (x3) mm/min | Ra (y) µm | Rz (y) µm | Ra µm | Rz µm | for Ra % | for Rz % |
| 160 | 270 | 35 | 4.48 | 25.58 | 4.70 | 26.91 | −4.7 | −4.9 |
| 180 | 285 | 38 | 4.17 | 24.34 | 4.41 | 25.22 | −5.4 | −3.5 |
| 190 | 310 | 45 | 3.95 | 23.49 | 3.84 | 24.04 | 2.9 | −2.3 |
| 190 | 310 | 45 | 3.82 | 22.99 | 3.95 | 22.90 | −3.3 | 0.3 |
| 200 | 320 | 50 | 3.70 | 22.53 | 3.90 | 22.85 | −5.1 | −1.4 |
| 210 | 330 | 57 | 3.41 | 21.37 | 3.48 | 22.27 | −2.0 | −4.0 |
| 230 | 350 | 65 | 3.13 | 20.26 | 3.11 | 20.95 | 0.6 | −3.3 |
| 250 | 360 | 68 | 3.04 | 19.92 | 2.88 | 20.08 | 5.6 | −0.8 |
| 260 | 370 | 77 | 2.75 | 18.76 | 2.81 | 19.55 | −2.1 | −4.0 |
Publisher’s Note: MDPI stays neutral with regard to jurisdictional claims in published maps and institutional affiliations. |
© 2020 by the authors. Licensee MDPI, Basel, Switzerland. This article is an open access article distributed under the terms and conditions of the Creative Commons Attribution (CC BY) license (http://creativecommons.org/licenses/by/4.0/).
Share and Cite
MDPI and ACS Style
Krenicky, T.; Servatka, M.; Gaspar, S.; Mascenik, J. Abrasive Water Jet Cutting of Hardox Steels—Quality Investigation. Processes 2020, 8, 1652. https://0-doi-org.brum.beds.ac.uk/10.3390/pr8121652
AMA Style
Krenicky T, Servatka M, Gaspar S, Mascenik J. Abrasive Water Jet Cutting of Hardox Steels—Quality Investigation. Processes. 2020; 8(12):1652. https://0-doi-org.brum.beds.ac.uk/10.3390/pr8121652
Chicago/Turabian StyleKrenicky, Tibor, Milos Servatka, Stefan Gaspar, and Jozef Mascenik. 2020. "Abrasive Water Jet Cutting of Hardox Steels—Quality Investigation" Processes 8, no. 12: 1652. https://0-doi-org.brum.beds.ac.uk/10.3390/pr8121652
Note that from the first issue of 2016, this journal uses article numbers instead of page numbers. See further details here.