Improvement of Productivity through the Reduction of Unexpected Equipment Faults in Die Attach Equipment


1
Department of Industrial Engineering and Management, National Taipei University of Technology, Taipei 10608, Taiwan
2
Department of Industrial and Management Engineering, Hanyang University, Ansan 15588, Korea
*
Author to whom correspondence should be addressed.
Processes 2020, 8(4), 394; https://0-doi-org.brum.beds.ac.uk/10.3390/pr8040394
Submission received: 11 February 2020
/
Revised: 9 March 2020
/
Accepted: 20 March 2020
/
Published: 27 March 2020
(This article belongs to the Special Issue Fault Detection and Process Diagnostics by Using Big Data Analytics in Industrial Applications)
Abstract
:As one of the semiconductor back-end processes, die attach process is the process that attaches an individual non-defective die (or chip) produced from the semiconductor front-end production to the lead frame on a strip. With most other processes of semiconductor manufacturing, it is very important to improve productivity by lessening the occurrence of defective products generally represented as losses, and then find the fault causes which lower productivity of the die attach process. Thus, as the case study to analyze quantitatively the faults of the die attach process equipment, in this research, we developed analysis systems including statistical analysis functions to improve the productivity of die attach process. This research shows that the developed system can find the causes of equipment faults in die attach process equipment and help improve the productivity of the die attach process by controlling the critical parameters which cause unexpected equipment faults and losses.
1. Introduction
The semiconductor production process can be largely divided into two sequential processes that are commonly referred as front-end and back-end production, and furthermore both processes contain many complex and sophisticated steps. The front-end production refers to primarily wafer fabrication, whereas the back-end production refers to the assembly and testing of individual semiconductor devices. Once the front-end production process is complete, the wafers are transferred to an assembly facility in order to protect the chip, and facilitate its integration into electronic systems, limit electrical interference, and enable the dissipation of heat from the devices [1].
In general, the semiconductor back-end production has a form of the consignment production depending on the different orders of diverse customers. In other words, the back-end companies make the final product using only non-defective dies (or chips) selected from the wafer transferred from the front-end production (semiconductor chip makers or wafer fabrication companies), and delivers the final products within certain due dates. Thus, it is very important for back-end manufacturing companies executing mainly package and test processes not only to provide stabilized quality and but to meet the due date required from customers. In other words, with most other manufacturing industries, in the semiconductor industry, it is also the most important that all ordered final products must have consistency in quality level and be delivered within the required due dates.
Quality information of semiconductor die (chip) can be discovered through the electrical die sorting (EDS) test usually in front-end production. The EDS test based on electrical characteristic testing checks whether the individual die on a wafer meets a certain required quality level or not, or whether the individual die is repairable or not, and also specifies non-repairable chips with inking and inhibits to proceed to the next step. When the EDS test is completed, the non-defectiveness and defectiveness information is filed and passed on to the back-end process and, based on this information, only non-defective dies are made into the final product.
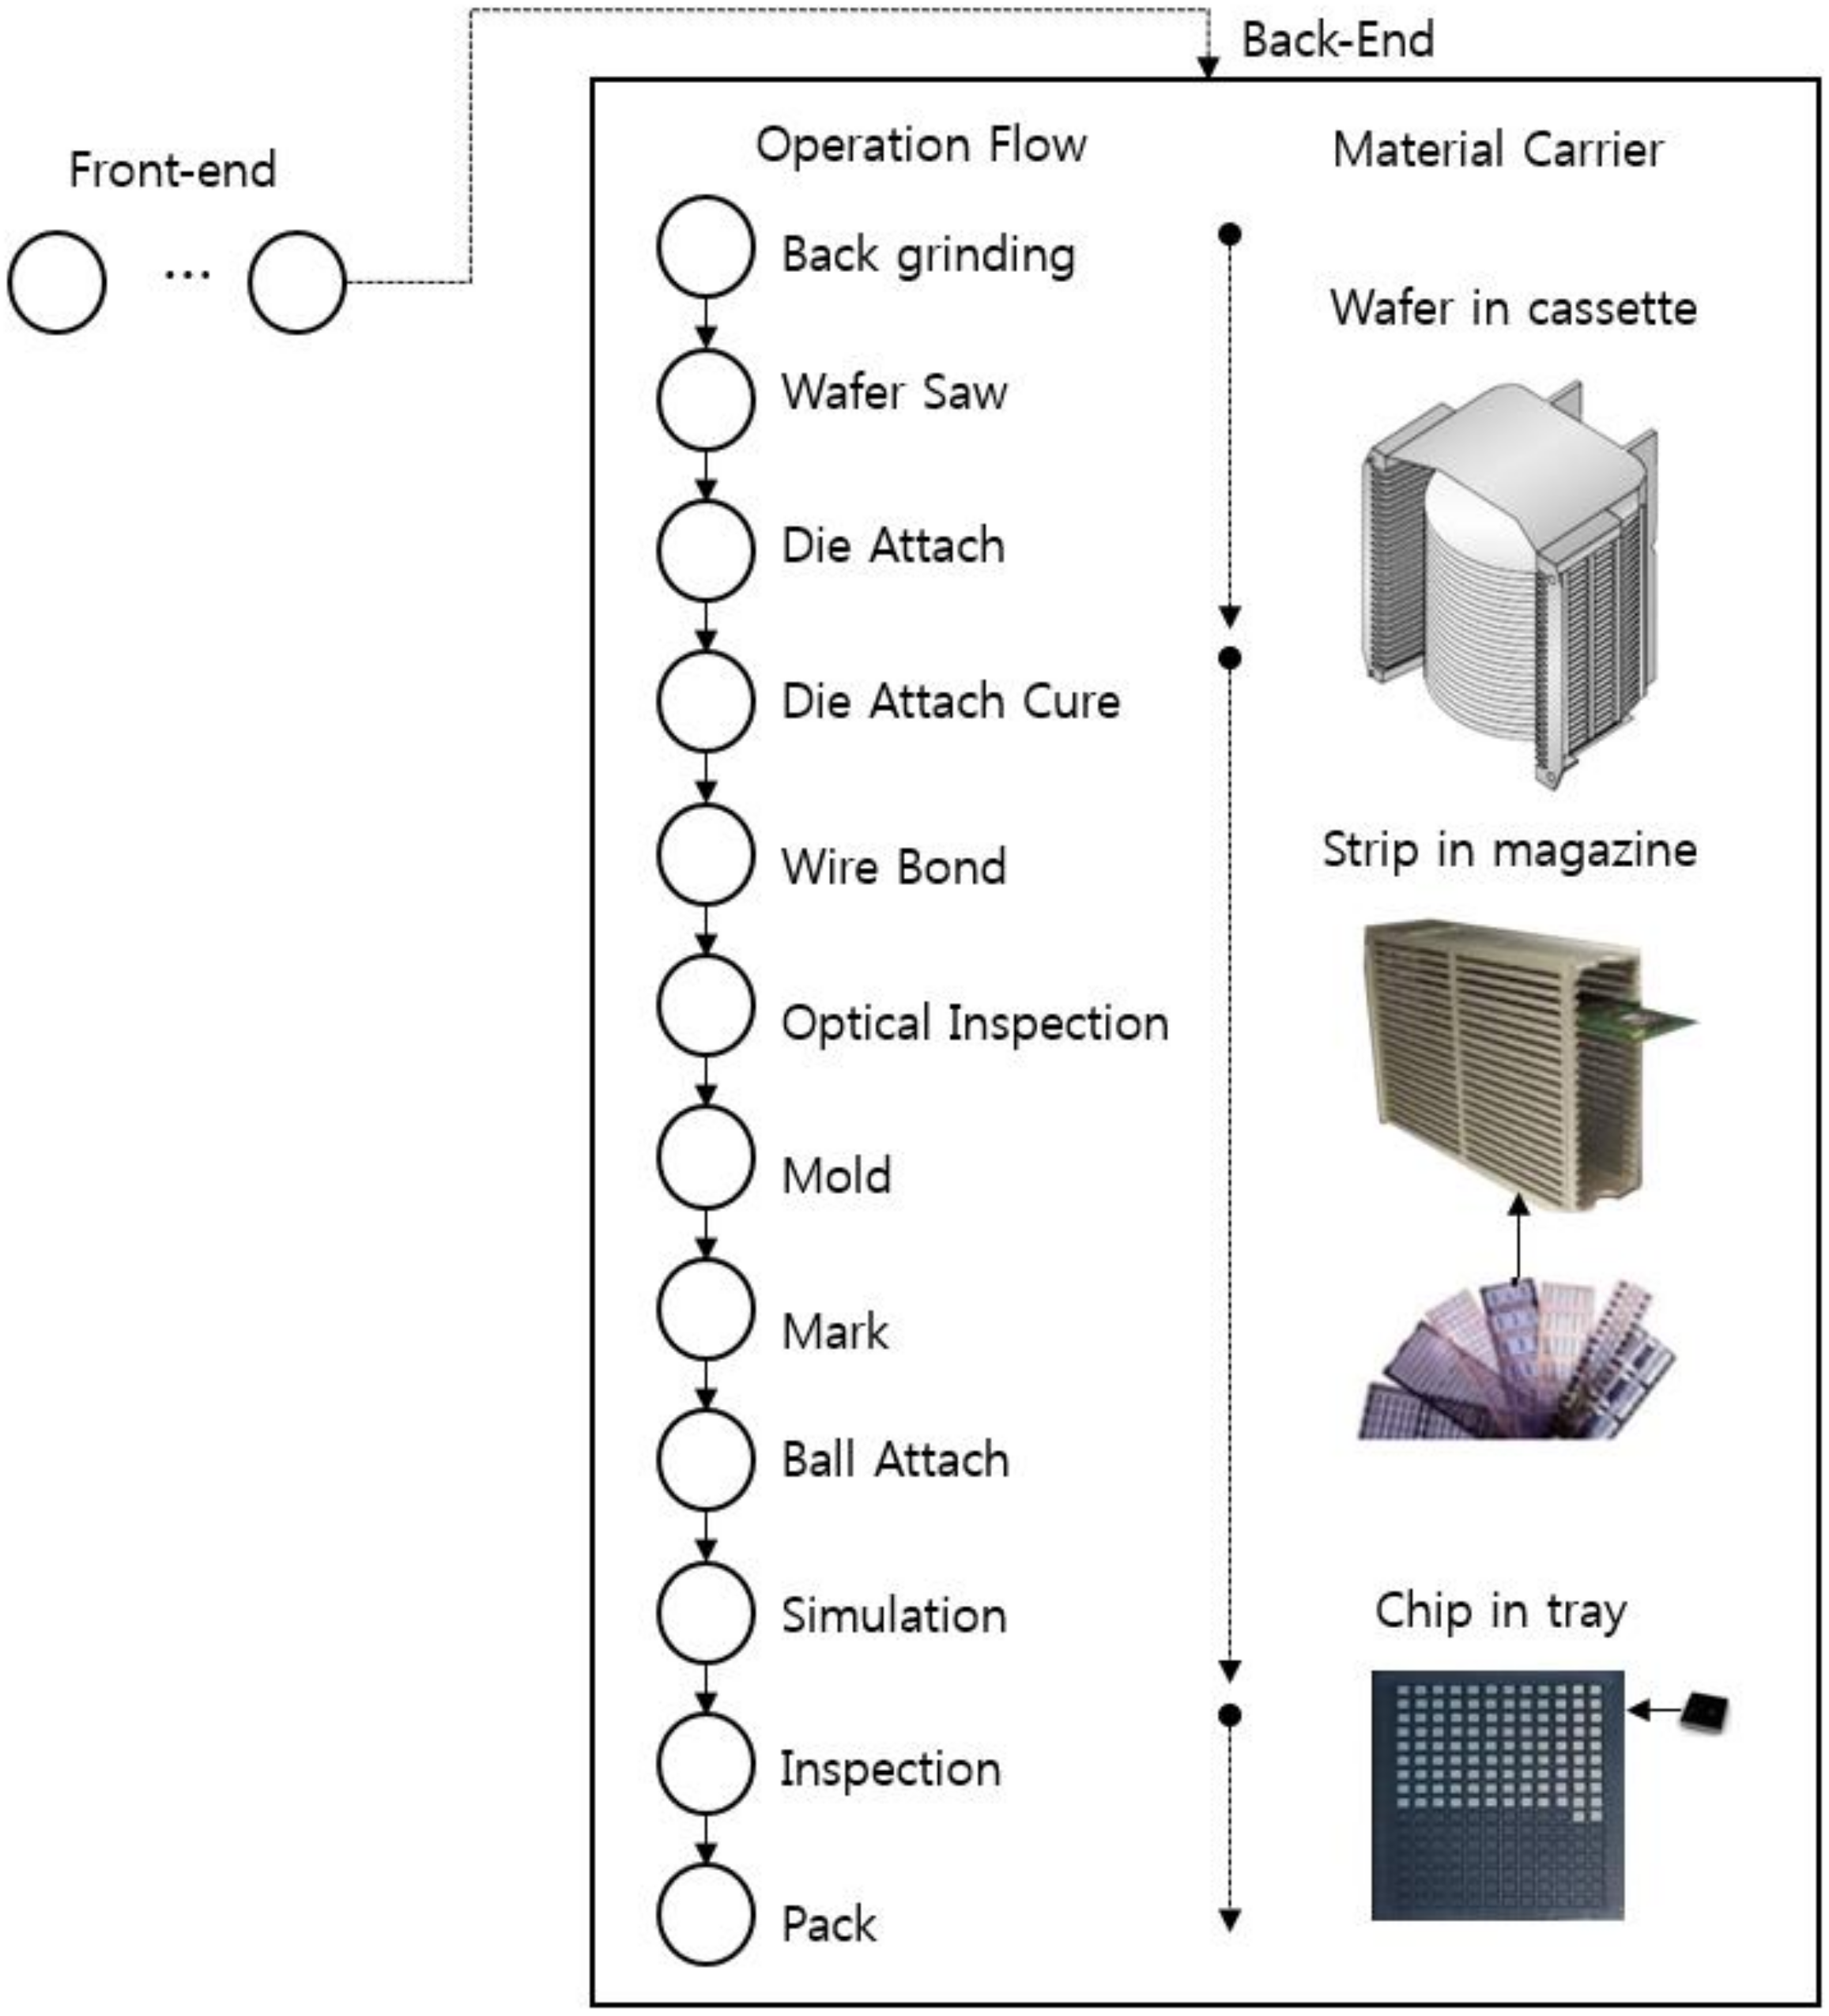
Figure 1 depicts the semiconductor back-end processes. The first process of the semiconductor back-end production is called the back grinding (polishing) process, which grinds the backside of the wafer without a circuit. The second process is wafer sawing (dicing) process which cuts and separates wafer passed through the back grinding process using a high-speed spinning diamond blade. Before executing the wafer sawing process, the backside of the wafer is taped to prevent dies being scattered during the wafer sawing process, and then wafer is cut into an individual semiconductor chip. The die attach process is to attach the non-defective dies produced from the wafer sawing process to the lead frame pad of strip and to enable the wire bonding. Generally, the number of the wafer sawing equipment is greater than that of the die attach equipment, and the wafer sawing process takes less time than the die attach process does. The wire bonding process connects the individual semiconductor die (chip) to a circuit board by fixing die pad of a chip to the lead frame of the strip using automatic machines known as wire bonders and a metallic device such as aluminum or gold wires. Through the wire bonding process, the leads on the lead frame are connected to the input and output terminals on the semiconductor chip.
Then, each semiconductor device is encapsulated in a plastic molding compound or ceramic case, forming the package. After the assembly process is completed, semiconductor devices are tested for different operating specifications including functionality, voltage, current, and timing. The completed packages passed through the tests are shipped to the customers. As described above, only good semiconductor dies (chips) based on wafer bin map information derived from the EDS test are individually picked up by a robot arm and attached to a lead frame on strips by means of an adhesive. This sub-process is known as the die attach process. As shown in Figure 1, until the wafer sawing process, semiconductor wafers are stored (and transferred) in a cassette (i.e., a box containing semiconductor wafers usually carries 25 sheets of wafer) and processed in wafer units like front-end process. But, in die attach process, lead frames containing semiconductor chips are stored in a magazine (i.e., after the die attach process, the non-faulty dies are moved to a lead frame or sometimes called substrate, and these strips are contained in a box known as the magazine) and managed in strip units.
Generally, the die attach process in semiconductor back-end production is known as the bottleneck process. A bottleneck could occur when a moderately large number of lots (used as an administrative unit or a product unit carrying a cassette with 25 sheets of wafer) are suddenly carried over to a die attach process from the previous process (that is, wafer sawing process), because a semiconductor wafer contains a great number of dies even though the number of dies on a wafer varies depending on the product. Additionally, when the wafers without being separated properly during the wafer sawing process are transferred to the next process (that is, die attach process), a bottleneck could occur due to the unexpected equipment fault by these faulty wafers. Due to these sudden drastic increase of volume and the unexpected equipment faults, the die attach process equipment will stop operating, and thus the productivity of the equipment would deteriorate. In particular, the unexpected equipment faults occurred in the die attach process due to the faulty wafers transferred from the wafer sawing process will increase reworks which is the main cause of lowering the equipment availability, and ultimately have a great influence on the due dates required from many customers.
Therefore, almost all semiconductor back-end companies have attempted to control and improve the productivity of the die attach equipment for meeting both quality level and due dates required by customers by maintaining the designated rate of equipment operation of the die attach process. Thus, in this research, we consider the die attach process of the semiconductor back-end production, and aim to develop a statistical analysis system to reduce the reworks while to increase productivity of die attach process equipment effectively. The procedure of statistical analysis is as follows:
(Procedure 1) Fault data as well as historical data of die attach process equipment are collected and basic statistical analysis on the causes of the corresponding to the faults is executed.
(Procedure 2) Derive the key equipment parameters (or factors) which affect the faults through the additional statistical analysis using the results from the statistical analysis on the causes of equipment faults and historical data.
(Procedure 3) Check whether the causes of the equipment faults are removed or not by adjusting the specifications of the key equipment parameters derived from the additional analysis.
2. Background
Much like the other industries, since the semiconductor industry also aims to sustain productivity and quality, various researches for improving these key goals have been done consistently, which is how to best manage and control the complicated and diverse semiconductor process equipment and to maximize its productivity and quality. In particular, the overall equipment effectiveness (OEE) is a very important index to represents the equipment productivity and quality of product since it enables the process or equipment engineers to monitor the current status of process equipment as well as semiconductor product quality [2,3]. The general concept of the OEE was first introduced by Nakajima (1988), the application guidelines of OEE for semiconductor manufacturing process was developed by Ames (1995), and a more definite notion of OEE was provided by Huang et al. (2003) [4,5,6,7,8]. To measure the OEE, Ljungberg (1998) defined explanatory variables which may affect OEE out of various production conditions, response variables which may represent OEE, and losses (due to equipment faults). Ljungberg (1998) showed that the availability is influenced by the equipment breakdowns and the equipment setups, and also the performance is influenced by the equipment idling, the minor equipment stoppage, and the production speed [9,10].
Ron and Rooda (2005) defined the status of the OEE and maintained the factor affecting the OEE were various elements related to the equipment. These elements include the facilities, operator, recipe, material, availability and scheduling requirements, etc. Currently, Semiconductor Equipment and Material International (SEMI) uses definitions of equipment statuses and OEE described by Ron and Rooda (2005) as a standard for semiconductor process [11,12]. To increase the OEE, reduction of the various losses that frequently occur while operating the equipment is very critical because losses including many faults such as breakdowns, setups, idling and minor stoppages, speed losses, and quality losses surely decrease the OEE [2]. Thus, it is necessary to define the losses clearly since the OEE can vary according to the definition of losses. Jonsson and Lesshammer (1999) classified the losses by the fault due to the equipment failure time, the fault due to the lower speed production, the fault due to the quality [13]. Nakajima (1988) sorted the breakdown loss into sporadic (temporary) failure and chronic failure and then showed these failures result in both time loss and volume loss [8]. Generally, it is known that the sporadic failures are affected by the necessary requirements in operating the equipment, (for example, diverse tools and operating method, equipment status, etc.) while the chronic failures are affected by mechanically inherent (but unknown) faults of equipment.
Generally, from the initial status, if the equipment is used for a long time, various faults (or failures) mentioned above will occur, and it will result in lowering the OEE. Therefore, in order to prevent these faults, the periodical maintenance must be carried out, and this is generally called the preventive maintenance (PM). But, even with these preventive maintenances, since the degradation of the OEE still frequently takes place, collecting historical data on faults as well as losses, comparing the OEE of before and after the preventive maintenance (PM), and analyzing the causes for the faults and losses, is needed to best improve the OEE [14,15].
Along with improving the OEE, estimation and assessment of the OEE is also critically important. Pomorski (1997) and Ron and Rooda (2006) used an efficiency management method for the individual product equipment to estimate and assess the entire efficiency of the factory [11,16]. Oechsner et al. (2003) extended the concept of the OEE and introduced the overall tool group efficiency (OGE) and developed an overall fab effectiveness (OFE) estimating matrix based on the OEE calculation model, and helped improve the OEE into the OFE [17]. Ljungberg (1998) researched on estimating the OEE from the enterprise-level total productive maintenance (TPM) [9], and Chien et al. (2007) researched the equipment efficiency monitoring through control chart techniques [18].
So far, there have been some researches on estimation and assessment methods of OEE and applications of the developed methods in semiconductor back-end production. Potoradi et al. (1999) attempted to optimize cycle time and lot size of the semiconductor back-end process and Jacobs et al. (2003) applied the equipment performance tracking (EPT) technique between the lots to draw out the optimal process recipe for the semiconductor back-end process equipment [19,20]. However, very few research has been done on improving the OEE of the die attach process equipment which is one of the important semiconductor back-end processes. The reason for this is, in order to analyze the OEE of the die attach equipment, it is necessary to collect very large-scale and diverse information such as data associated with current status of the equipment, alarms, faults, recipes, parameters, performances, events, materials, etc. But, methods of collecting data vary depending on the type of the die attach process equipment and sometimes it is impossible to collect data from certain equipment types. Therefore, in this research, we collect various data from die attach process equipment using the semiconductor equipment communication standard (SECS) protocol, which is known as the standard communication method in semiconductor production, and then analyze the equipment fault and provide useful solutions for improving OEE of die attach process equipment. Finally, we validate the effects of the improvement solutions for improving OEE.
3. Overall Equipment Effectiveness (OEE) and Loss
3.1. Overall Equipment Effectiveness (OEE)
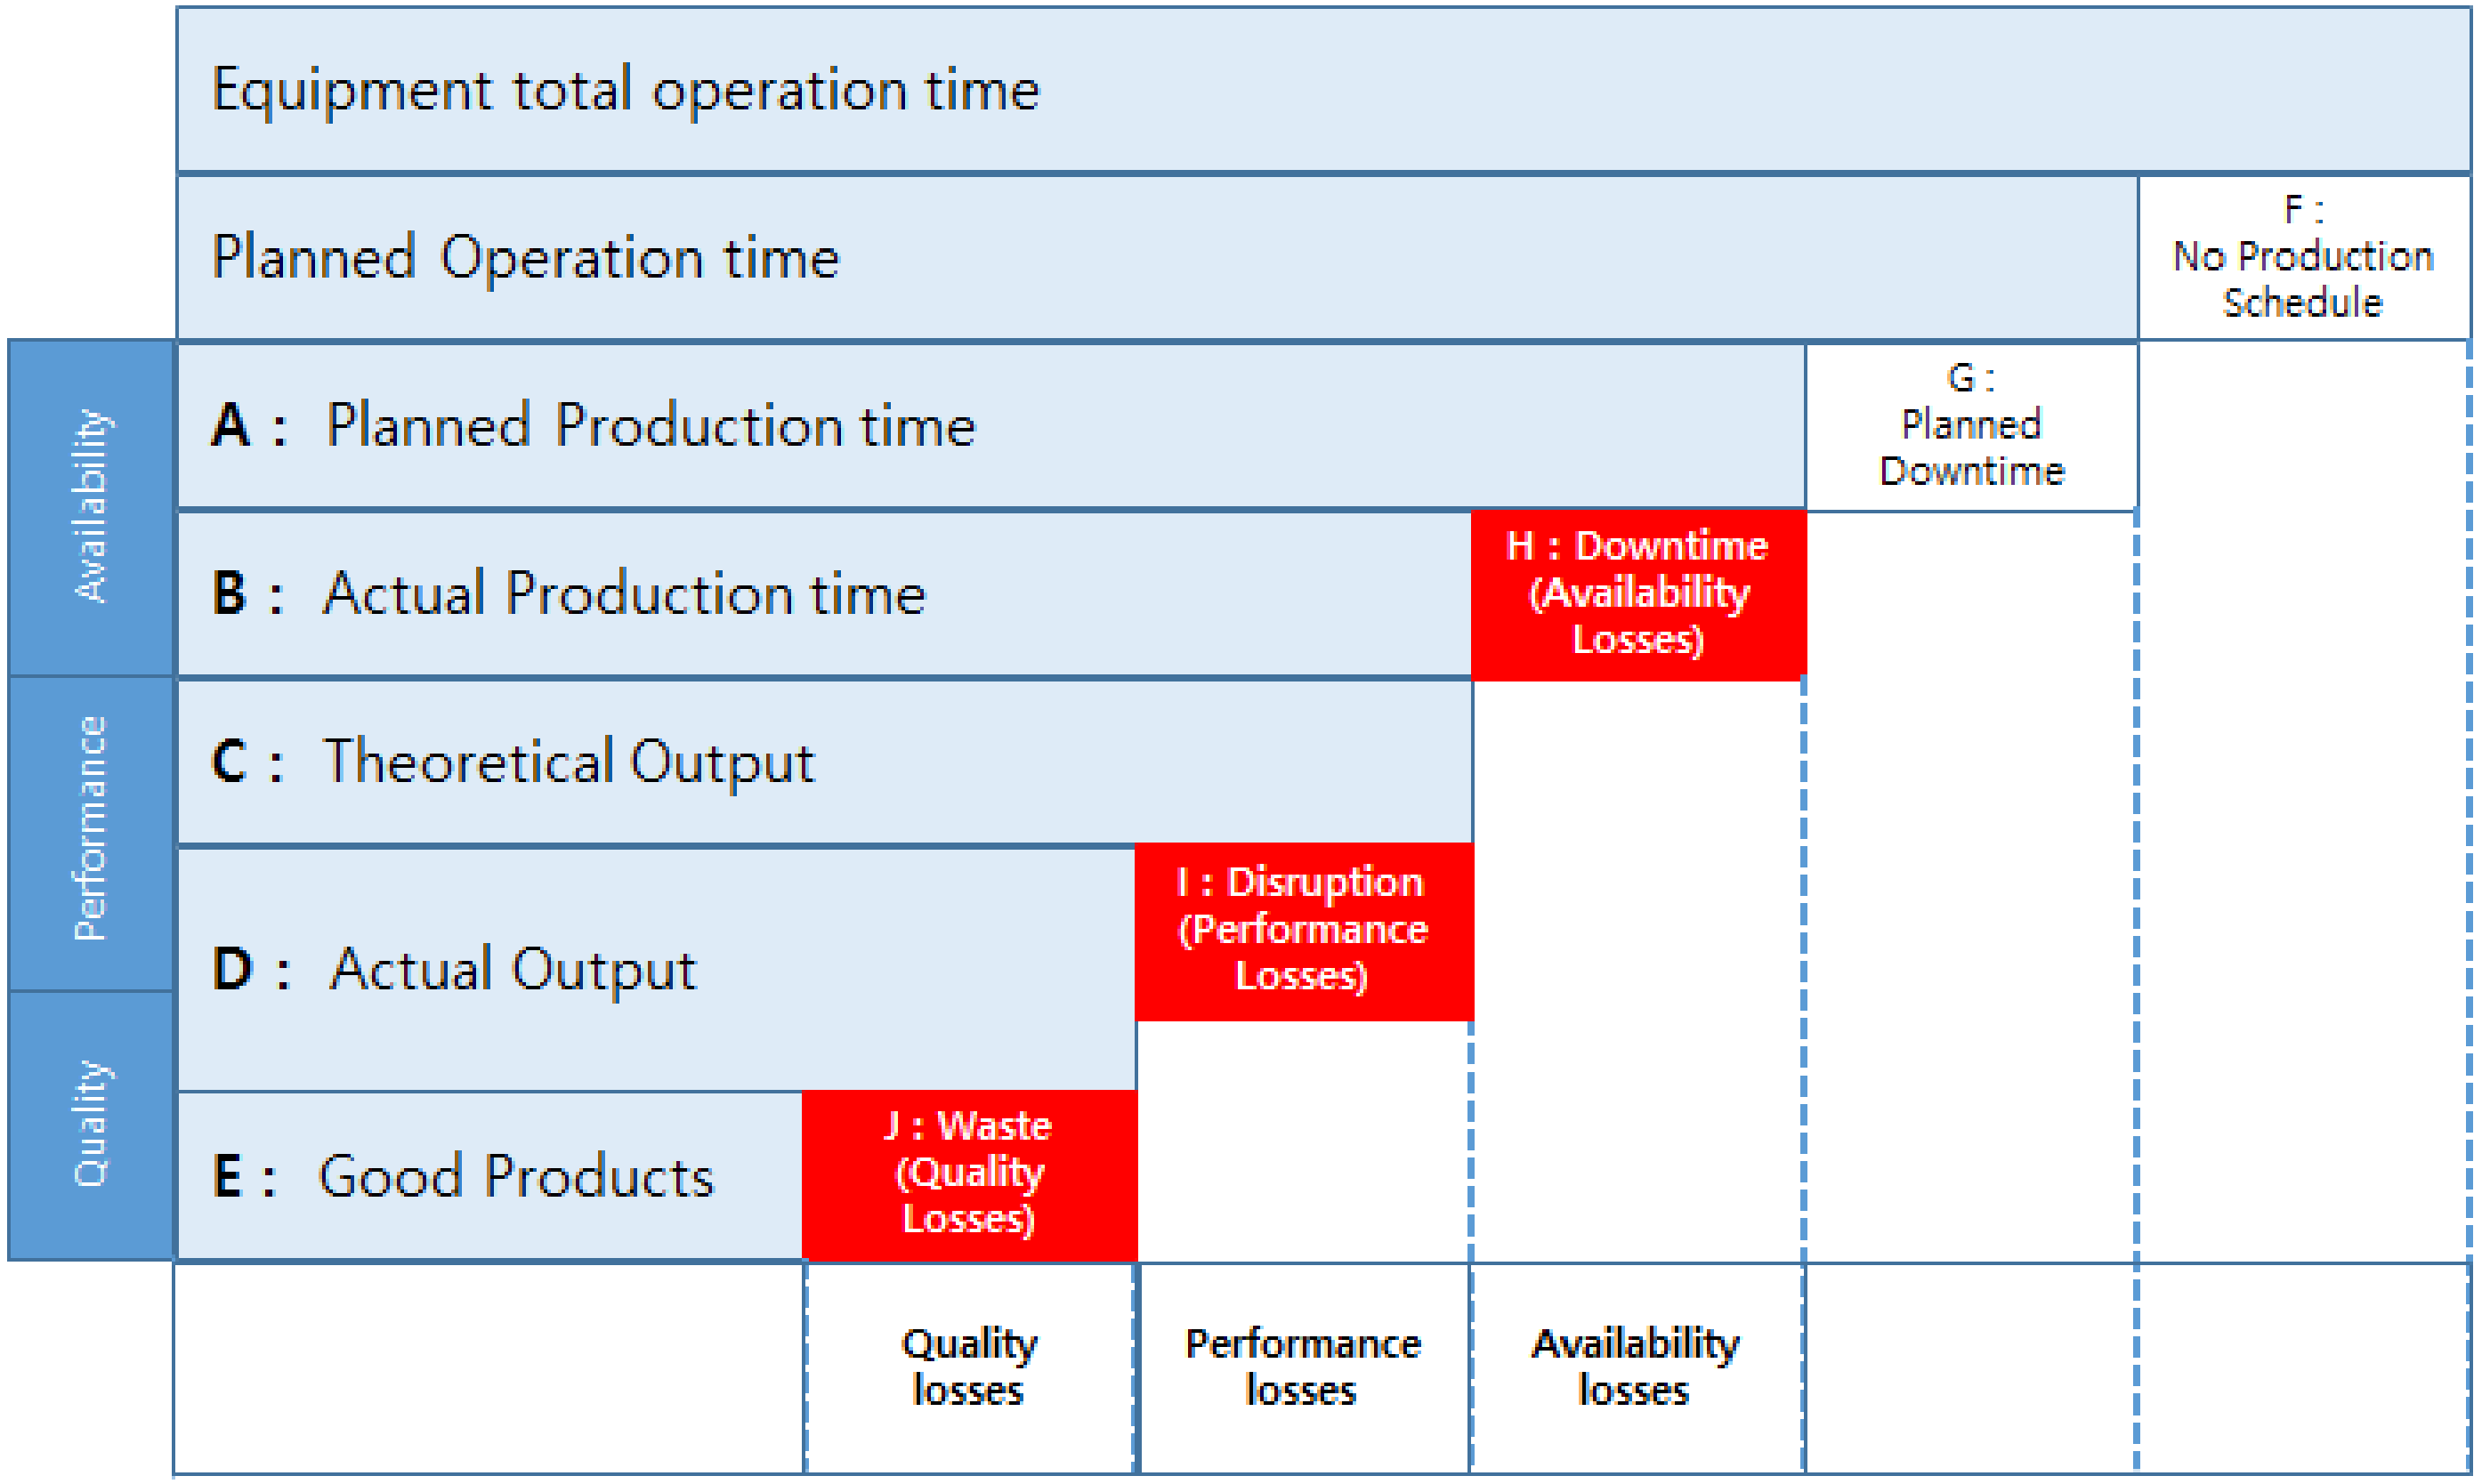
As shown in Figure 2, it is necessary to thoroughly identify the elements (i.e., time) which construct total equipment operation time in order to calculate the overall equipment effectiveness (OEE). The decomposition of the total equipment operation time thoroughly, allows derivation of three key indices, that is, the availability, performance, and quality, and then calculation of OEE by multiplying these three indices [21].
As the first index for calculating the OEE, the availability (A) is the ratio of the actual production time to the planned (theoretical) production time. The actual production time can be calculated by excluding unscheduled downtime caused by all unexpected equipment fault from the planned (theoretical) production time. In here, the expected fault involves all the failure (stoppage) when the equipment is intentionally stopped for the maintenance activity after a certain amount of time. So the equipment availability (A) can be defined as follows:
Here, we can see that the planned (theoretical) production time actually would be production load time (ET) by subtracting the planned downtime (PT) from the planned operation time (WT). And, the actual production time is calculated by subtracting the sum of the unscheduled (that is, unpredicted) downtime (TST) from the actual production load time (ET). In conclusion, the equipment availability (A) can be expressed as follows:
As shown above, the sum of the unscheduled (unexpected) downtime () influences the equipment availability and there is an inversely proportional relationship between the equipment availability and the unscheduled downtime. Thus, in order to maximize the equipment availability, it is necessary to minimize the sum of the unscheduled downtime ().
The performance (P) is an index for measuring operational efficiency of equipment which shows how many products can be produced through the equipment, and this index is measured from the proportion of actual output to the planned (theoretical) output. Here, the actual output is the amount of output excluding the disruption (i.e., any performance losses) from the whole amount of the planned (theoretical) output. The AO represents the actual output and the PO represents the planned (theoretical) output [22].
As shown above formula, if an equipment fault takes place and, as a result, this causes the equipment to stop, then the performance will drop because it reduces the actual output.
The quality (Q) (generally, the good quality ratio) is the ratio of the amount of good quality product except for the waste (quality loss) out of the whole actual output. Therefore, the quality indicates the ratio of products that conform to all the requirements in one process. For example, if a fault occurs during the production line, then a rework would be required frequently to fix the product or identify the cause of the fault, and the higher the rework rate is, the lower the OEE will be, and thus later it may seriously affect the quality of the process and product. Therefore, the rework, along with the general loss, is one of the most important wastes causes which can affect the OEE. The quality can be defined as follows:
Here, the PR (AO), L, RW represents the amount of actual output, the amount of losses, and the amount of reworks, respectively. Because the influential factors on the quality are the amounts of the losses and reworks, if the size of losses is fixed (or known), the factor that directly influences the quality can be the overall size of reworks. Therefore, in order to maximize the quality, it is necessary to minimize overall size of reworks under the fixed loss size. In conclusion, the overall equipment efficiency (OEE) to be maximized can be represented as the multiplication of three indices described above, that is, the availability, the performance, and the quality as follows:
3.2. Loss
In order to maximize the OEE, although the availability (A), the performance (P), and the quality (Q) needs to be enhanced as mentioned before, but it is not easy task to maximize or maintain the OEE in the actual production line. Therefore, many studies have been conducted on various methods for maximization of OEE or minimization of losses caused by various equipment faults in semiconductor production line. The six main losses due to several equipment faults in the semiconductor industry are categorized and illustrated in Table 1.
In various practical production lines, it is necessary to develop the functions to define, collect, and analyze information associated with many losses caused by equipment and process faults defined in Table 1 to minimize the losses to ultimately maximize the OEE. Through the implementation of these functions to the semiconductor manufacturing process, it is possible to analyze what kinds of losses take place and when and how often these losses occur during the process, and then to adjust the process or equipment conditions to minimize the losses based on these analyses [23]. Generally, information of faults and losses that occur in the semiconductor equipment can be received by the equipment automation system (EAS) called host, and the semiconductor equipment sends fault and loss information in a form of alarm message through semiconductor equipment communication standard (SECS) protocol. This alarm can be largely categorized into an error, a warning, and information alarm. When a certain equipment fault occurs, the equipment sends out a “S5F1” message out of the various SECS messages. The “S5F1” message to be sent to the host (i.e., EAS) includes alarm ID (ALID), the alarm category (ALCD), and the alarm text (ALTX) information. The various alarms arising from the equipment are defined by individual equipment manufacturer, based on the definition provided by the Semiconductor Equipment and Materials International standard (that is, SEMI standard). The alarm category (ALCD) defined by SEMI standard are provided in the following Table 2.
However, since the semiconductor equipment provides different types of alarms as well as numbers of alarms depending on the equipment manufacturer, it is often very difficult to clearly distinguish the losses provided in Table 1 using the alarm category (ALCD) defined by SEMI standard [24]. Since alarms defined on SECS messages have the same notion as the losses, in this research, we represent alarms arising from the equipment as equipment faults by regarding alarms as losses defined in OEE. Through the following two methods described in Table 3 and Table 4, we developed a new monitoring system to reduce the overall losses during the die attach process.
4. Development of Analysis System
4.1. Analysis of the Availability Loss
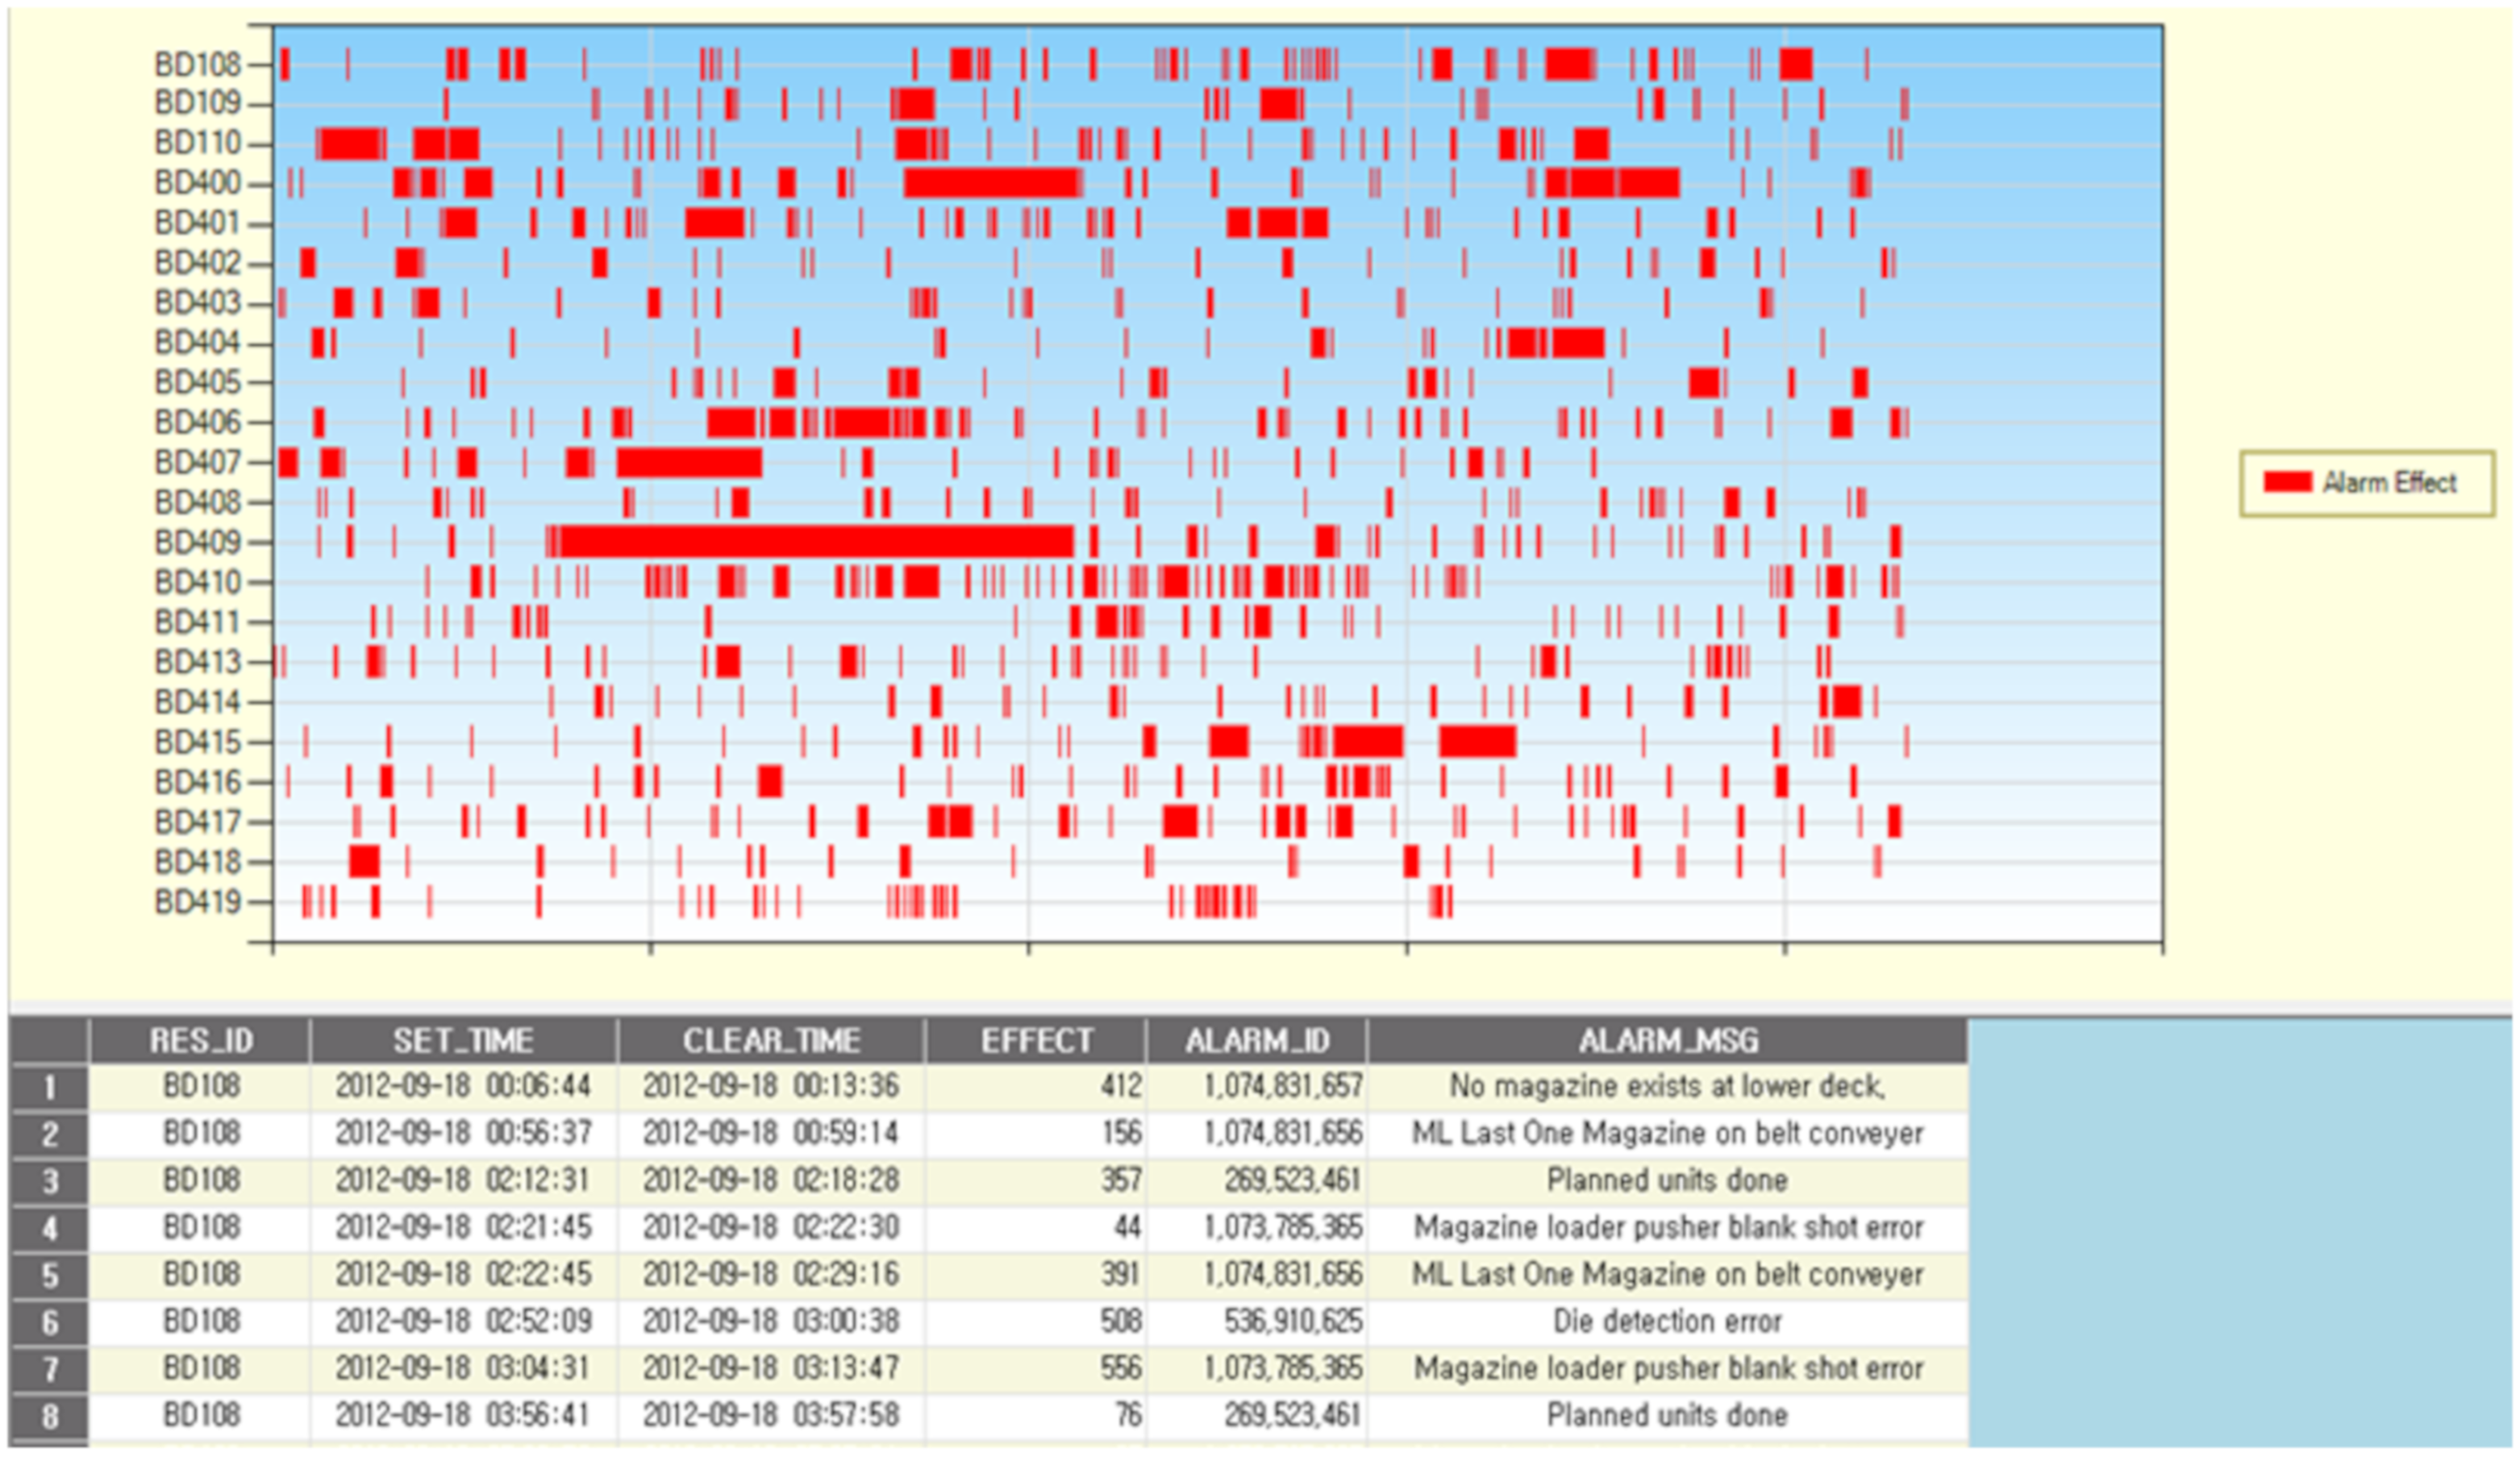
To analyze the availability loss of die attach process equipment, it is necessary to figure out how often faults occur in the process equipment, and how long it affects the process equipment. To do this, collection and classification of the faults and losses that occur in the die attach process equipment are required prior to analysis of the availability losses. In this research, we selected some of the die attach process equipment (ESEC 2100, SHINKAWA SPA 400, HITACHI DB 700, SECRON BD 502) that a semiconductor back-end manufacturing company “H” currently uses. For the selected equipment, equipment log data were collected by using the SECS messages they provide, that is, the starting and the finishing times of the losses as well as the types of losses. Utilizing the collected data, we developed an analysis system that shows what kinds of equipment faults resulting in losses occur how often and how long it continues as shown in Figure 3. Through this developed analysis system, a frequency analysis can be carried out that occurred in die attach process equipment, and also help figure out the influence of losses on the equipment (i.e., loss duration time). In Figure 3, the y-axis and x-axis represent the equipment ID number and loss duration time, respectively. The “RES_ID”, “EFFECT”, “ALARM_ID”, and “ALARM_MSG” in Figure 3 represent the equipment ID number, loss duration time, alarm ID, and alarm description, respectively. For example, we can see that equipment “BD409” is the equipment that caused long-term loss and also alarms have occurred several times in a short time at equipment “BD410”. Accordingly, this alarm distribution chart allows equipment engineers to grasp and compare the loss and alarm distributions of equipment and also to predict process equipment that need preventive maintenance in the future.
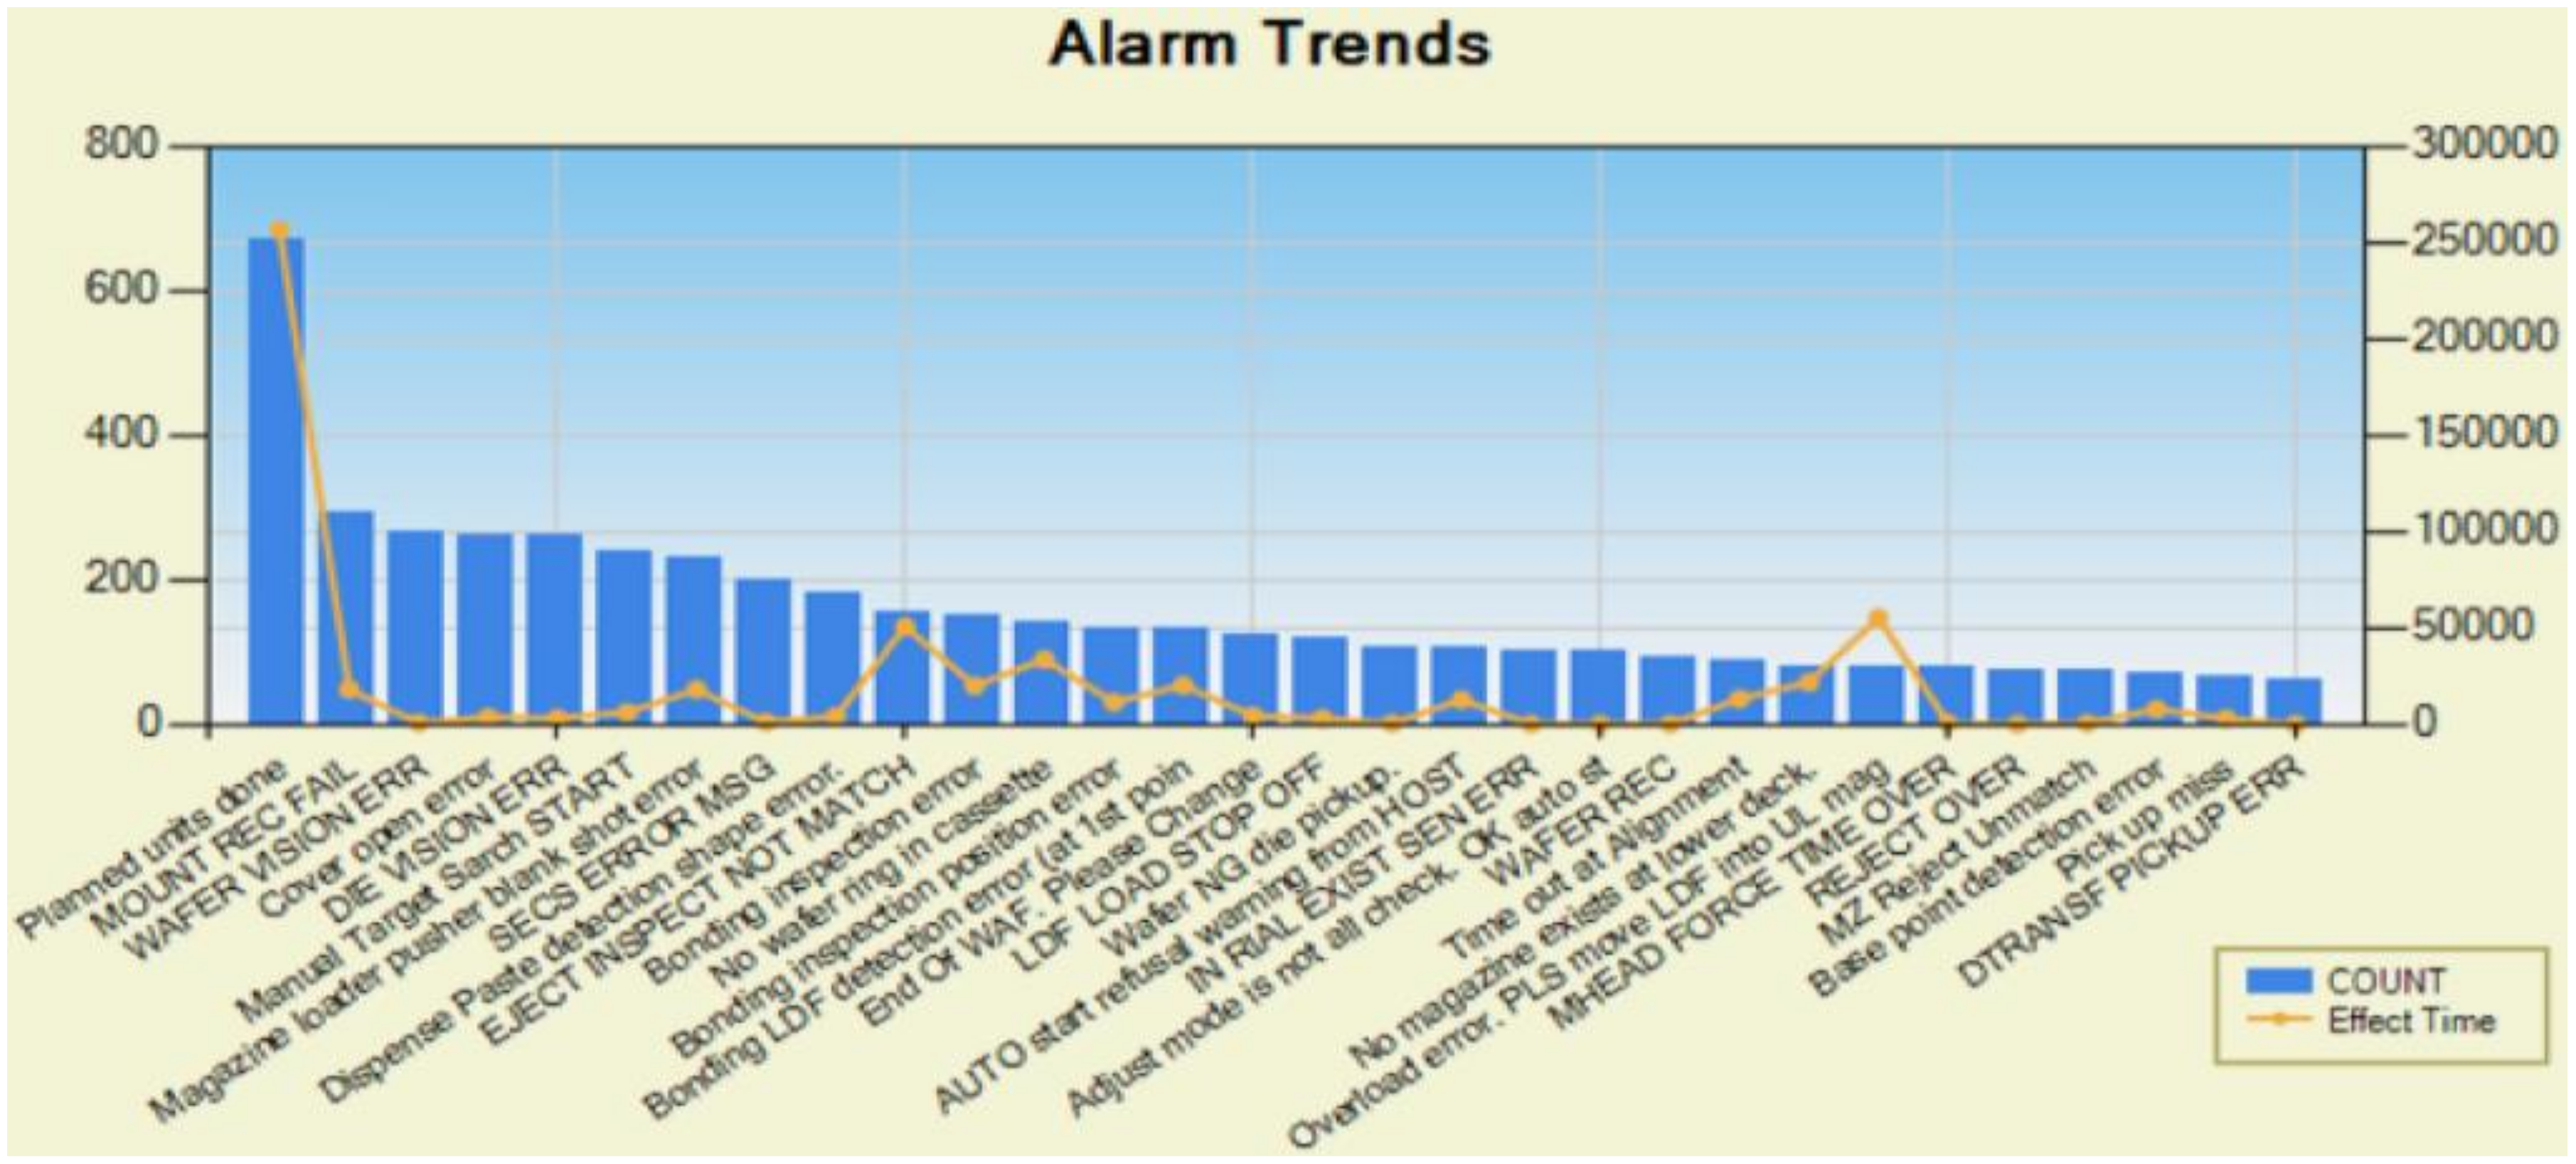
Based on the result of the loss frequency and loss duration time analysis, we developed a system that can carry out an additional fault analysis for the equipment that was long lasted due to losses as shown in Figure 4. In Figure 4, the y-axis on the left side of the graph, the y-axis on the right side of the graph, and x-axis represent the frequency of occurred losses, the amount of time to fix the corresponding cause of loss, and the types of losses, respectively. Figure 4 shows the analysis results of the losses that occur in the die attach process equipment according to loss categories. This analysis result includes the types of losses that the most frequently occurs, its frequency, and impact of the individual loss on the die attach process equipment. For example, the number of occurrences of loss type “EJECT INSPECT NOT MATCH” is small (almost less than 200), but the time to resolve this loss problem is moderately high.
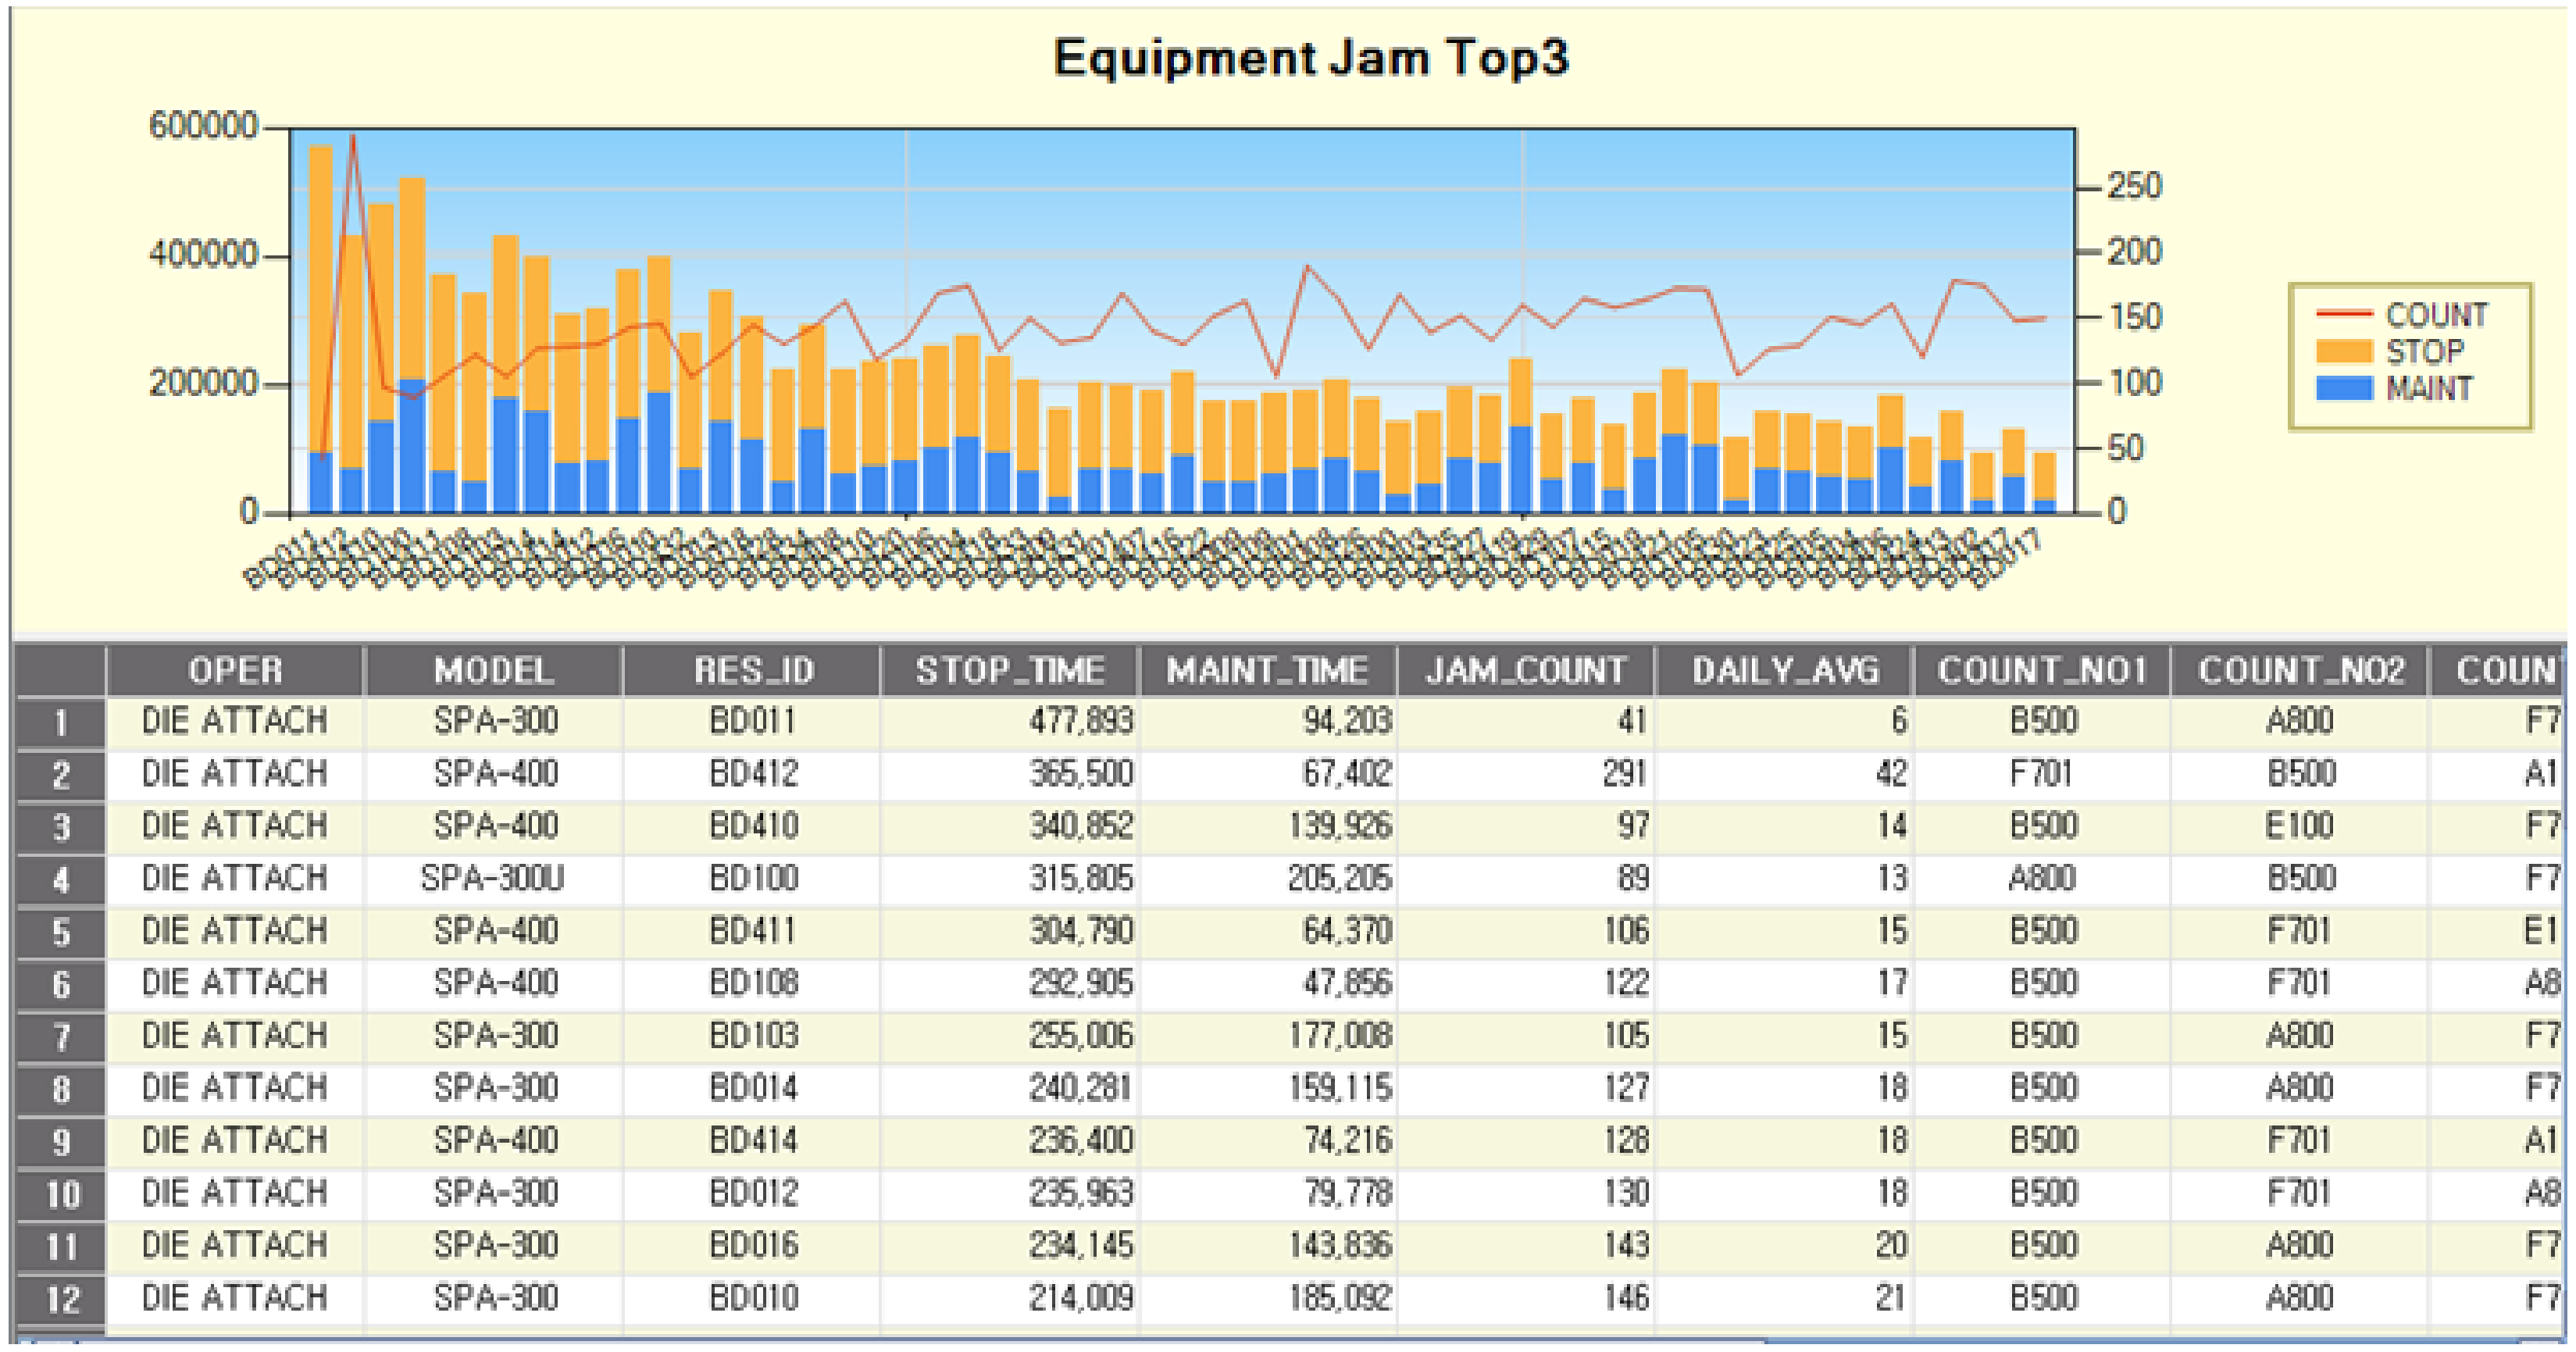
Finally, we developed another analysis system which shows fault types by die attach process equipment. With this system, for the die attach process equipment that losses frequently occur among all the die attach process equipment, the number of losses (named as “JAM_COUNT” in the table), the stoppage time of equipment (named as “STOP_TIME” in the table), and the required maintenance time of the corresponding (named as “MAINT_TIME” in the table) were analyzed as shown in Figure 5. For example, it is shown that there are 41 losses, and the stoppage time and maintenance time of the equipment “BD011” of the model “SPA-300” are 477,893 and 94,203, respectively.
4.2. Analysis of the Quality Loss
We developed a system for analyzing the process quality losses of the die attach equipment based on the following procedures as shown in Table 5.
Here, from the aspect of equipment productivity, the unit per equipment hour (UPEH) is a frequently used index to illustrate the availability of a machine (equipment) in various manufacturing process. Generally, the UPEH can measure the hourly equipment output and also check productivity trends in each equipment. Namely, this index enables the operators to grasp the hourly productivity of the die attach process equipment. In this research, we repeatedly carried out the search procedure of the wafer sawing process equipment parameters that may be related to the losses that occurred in die attach process equipment, out of the 1600 parameters in the wafer sawing process equipment. Finally, the 10 main control parameters of the wafer sawing process equipment that may affect the die attach equipment losses are derived as follows: (1) Spindle RPM, (2) chuck table feed speed, (3) blade height, (4) blade width, (5) blade sharpness, (6) cutting water temperature, (7) spindle water temperature, (8) cutting water flow, (9) spinner RPM, and (10) spinner time.
In general, the manufacturing execution system (MES) stores the process histories for lots that passed through the semiconductor back-end process and the equipment histories. Using the information derived from process and the equipment histories for lots stored in MES, we investigated lots with the most losses among numerous lots that are processed in the die attach process equipment as well as number of losses that occurred in the die attach process equipment. Then, we investigated which wafer sawing equipment in the previous process produce the faulty lots with the most losses and also which equipment parameters influence the losses. This allows engineers to see which equipment produced the lots with most losses during the previous process (i.e., the wafer sawing process), and also to help discover critical equipment control parameters in the wafer sawing process that have huge influence on the losses. As a result, we found that the blade height and the blade width are the two main equipment control parameters in wafer sawing process which most influenced the losses of the die attach equipment process. Table 6 contains ID number of die attach process equipment, the number of faults per equipment, UPEH of individual equipment, ID number of sawing process equipment, the corresponding blade height, and blade width. The blade height signifies the blade depth when wafer is sawn during the wafer sawing process.
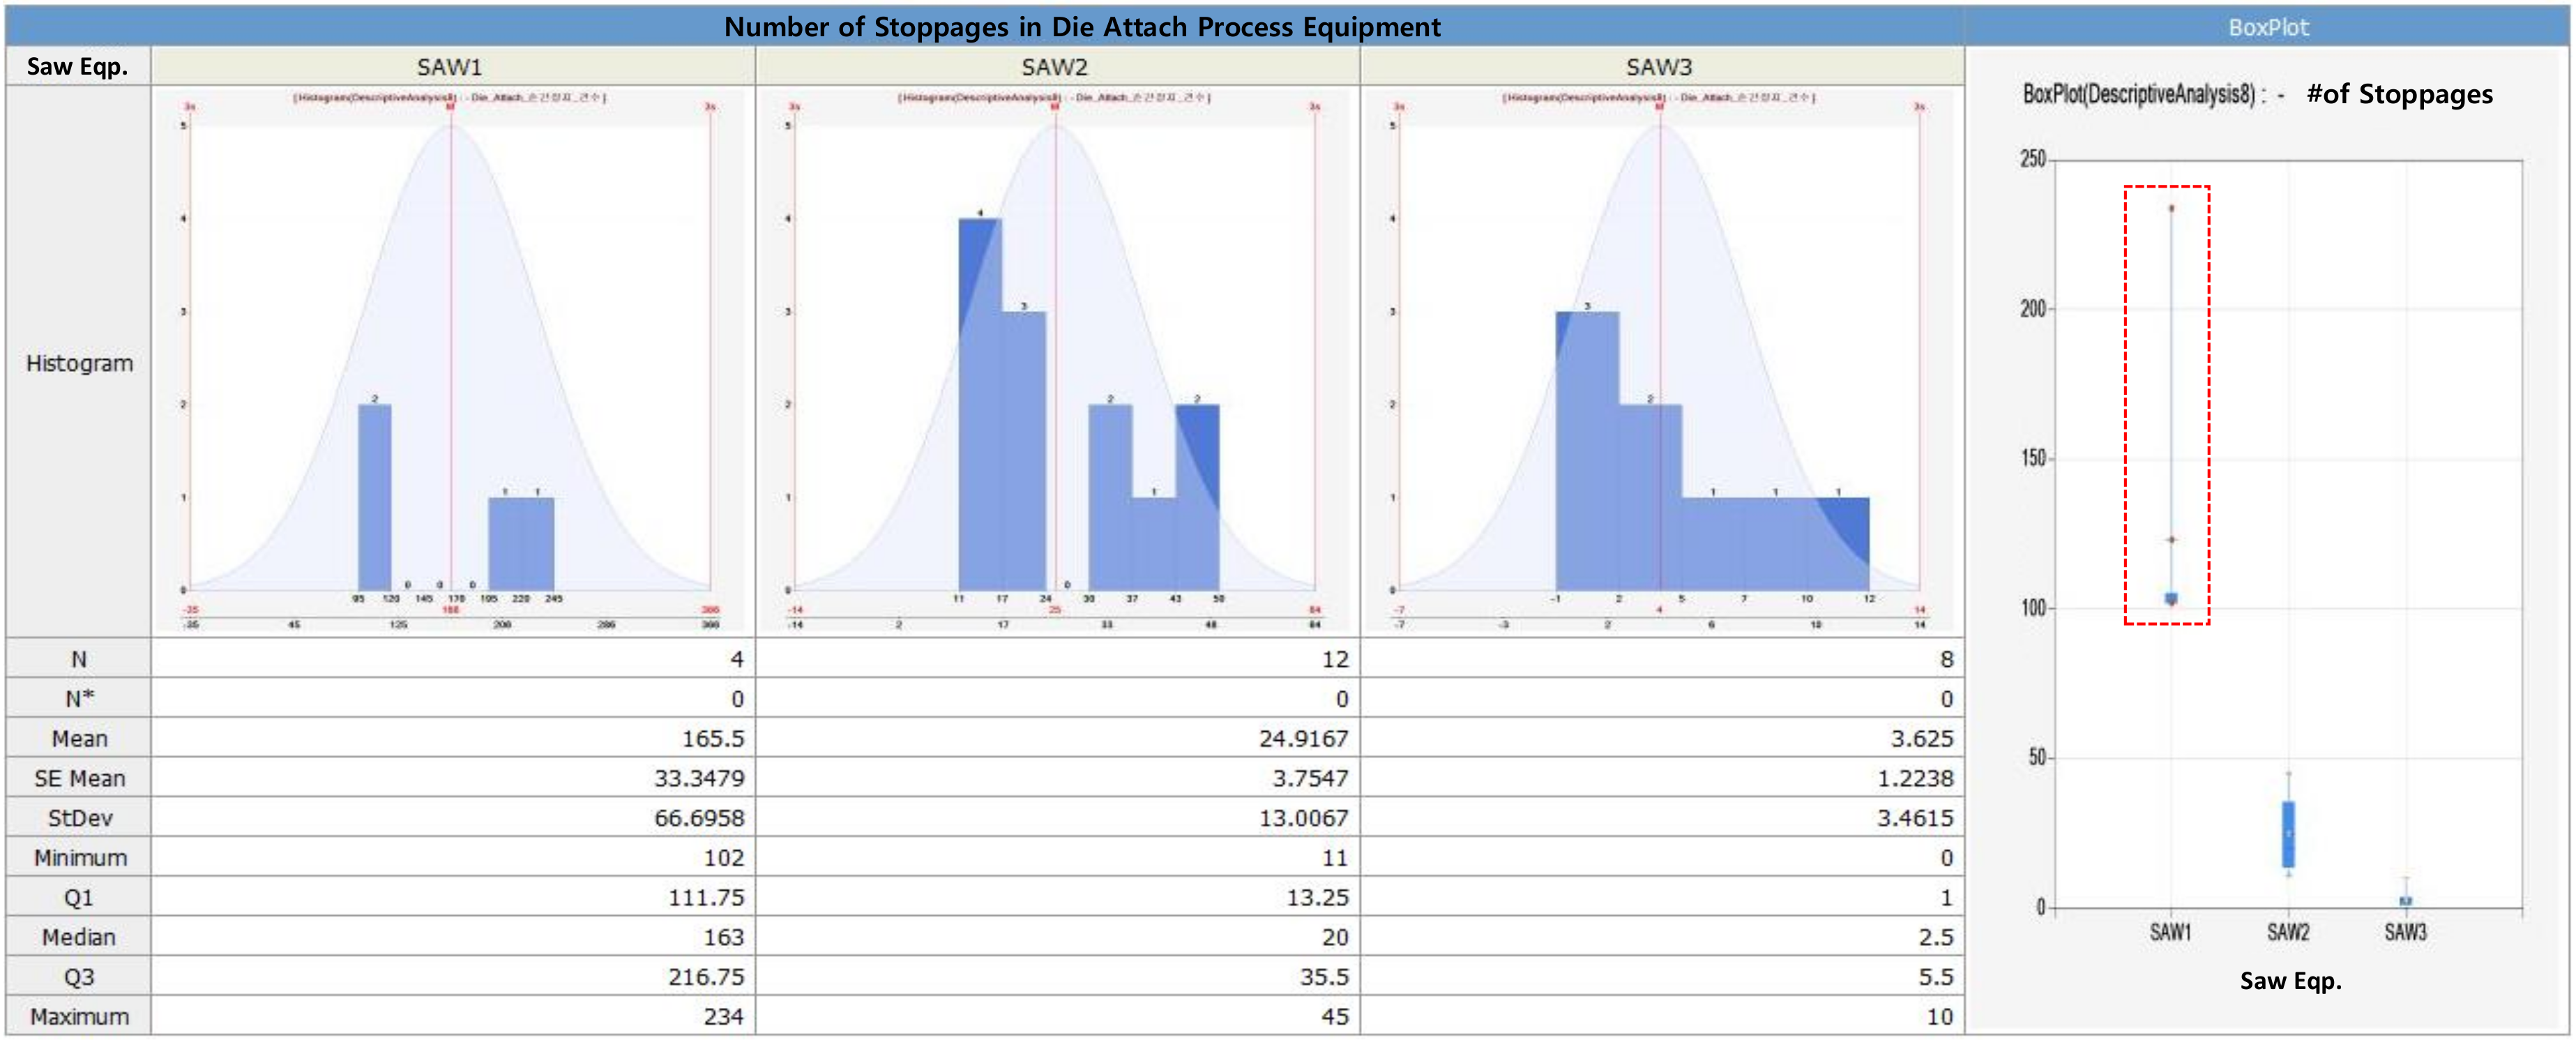
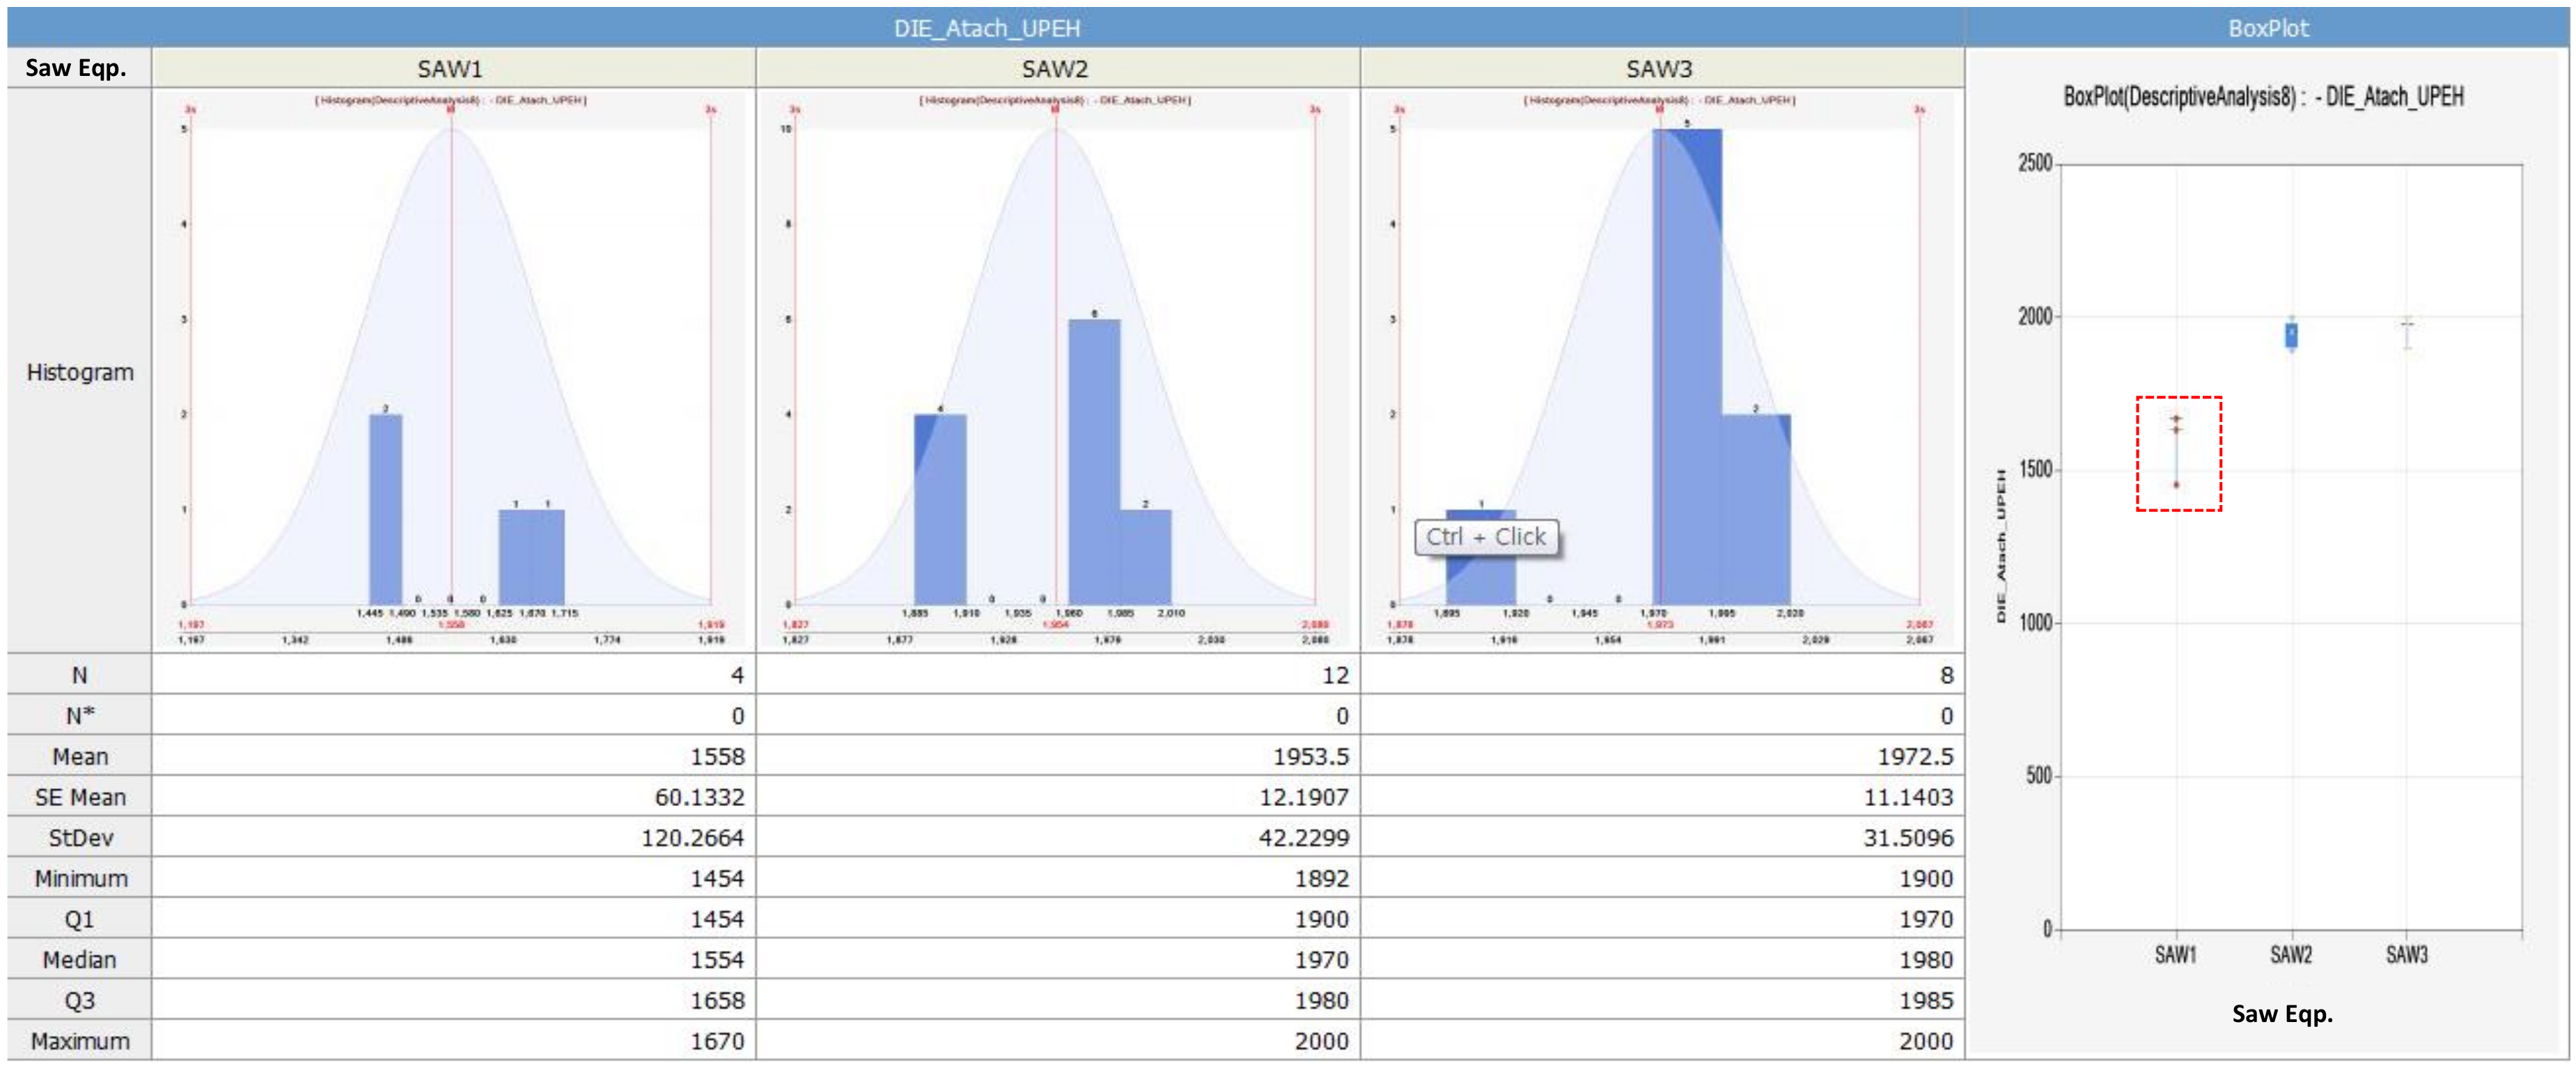
Then, in this research, we developed a system for executing a variety of descriptive statistical analysis based on data shown in Table 6. Figure 6 shows the results of the descriptive statistical analysis of wafer sawing process equipment which might affect equipment faults that occurred in die attach process equipment. As shown in Figure 6, among the three wafer sawing equipment, it is found that the number of stoppage of the first wafer sawing equipment is the highest and thus the lots which passed through the first wafer sawing equipment (wafer sawing equipment No. 1) cause the most losses.
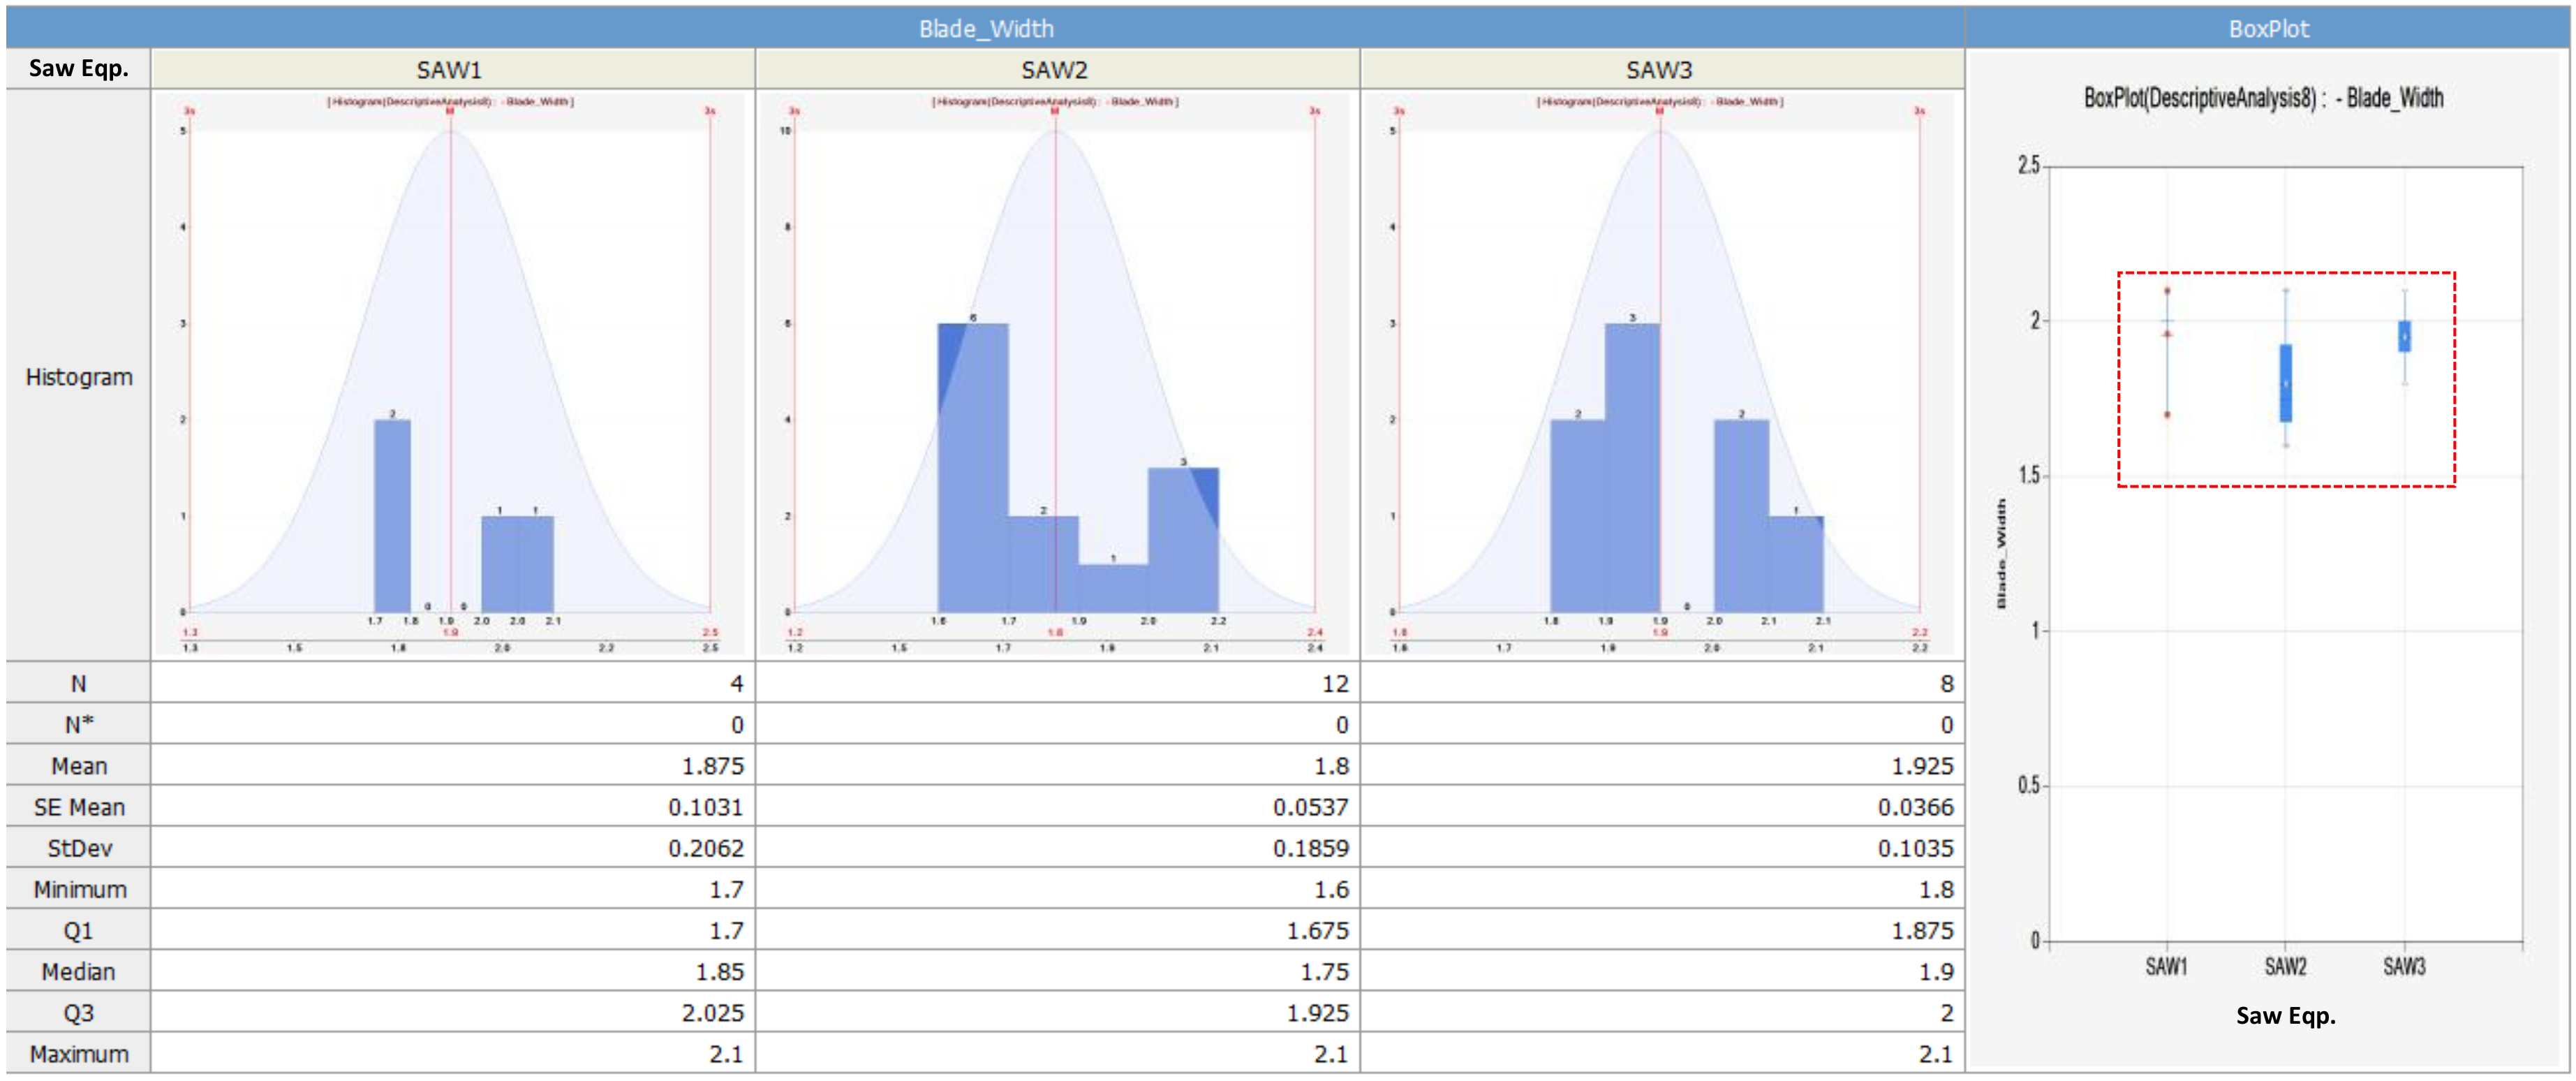
Based on the descriptive statistical analysis results, we additionally developed a system to analyze the effect of the blade height and the blade width, which are two main control parameters of the wafer sawing process equipment, and how these two control parameters influence on faults in die attach process equipment. That is, through this system, it is possible to analyze whether there is a difference in the blade heights and the blade widths by wafer sawing process equipment. Again, it is proved that the lots processed in the first wafer sawing process equipment caused more losses in the die attach equipment compared to the lots processed in the second and the third wafer sawing process equipment. Then, after analyzing whether there is a difference between the blade width of the first wafer sawing process equipment and that of the other two wafer sawing process equipment, we found that there is no difference in the blade width as shown in Figure 7. Thus, we can conclude that that the blade width has no effect on the faults (finally leading to losses) in die attach process equipment.
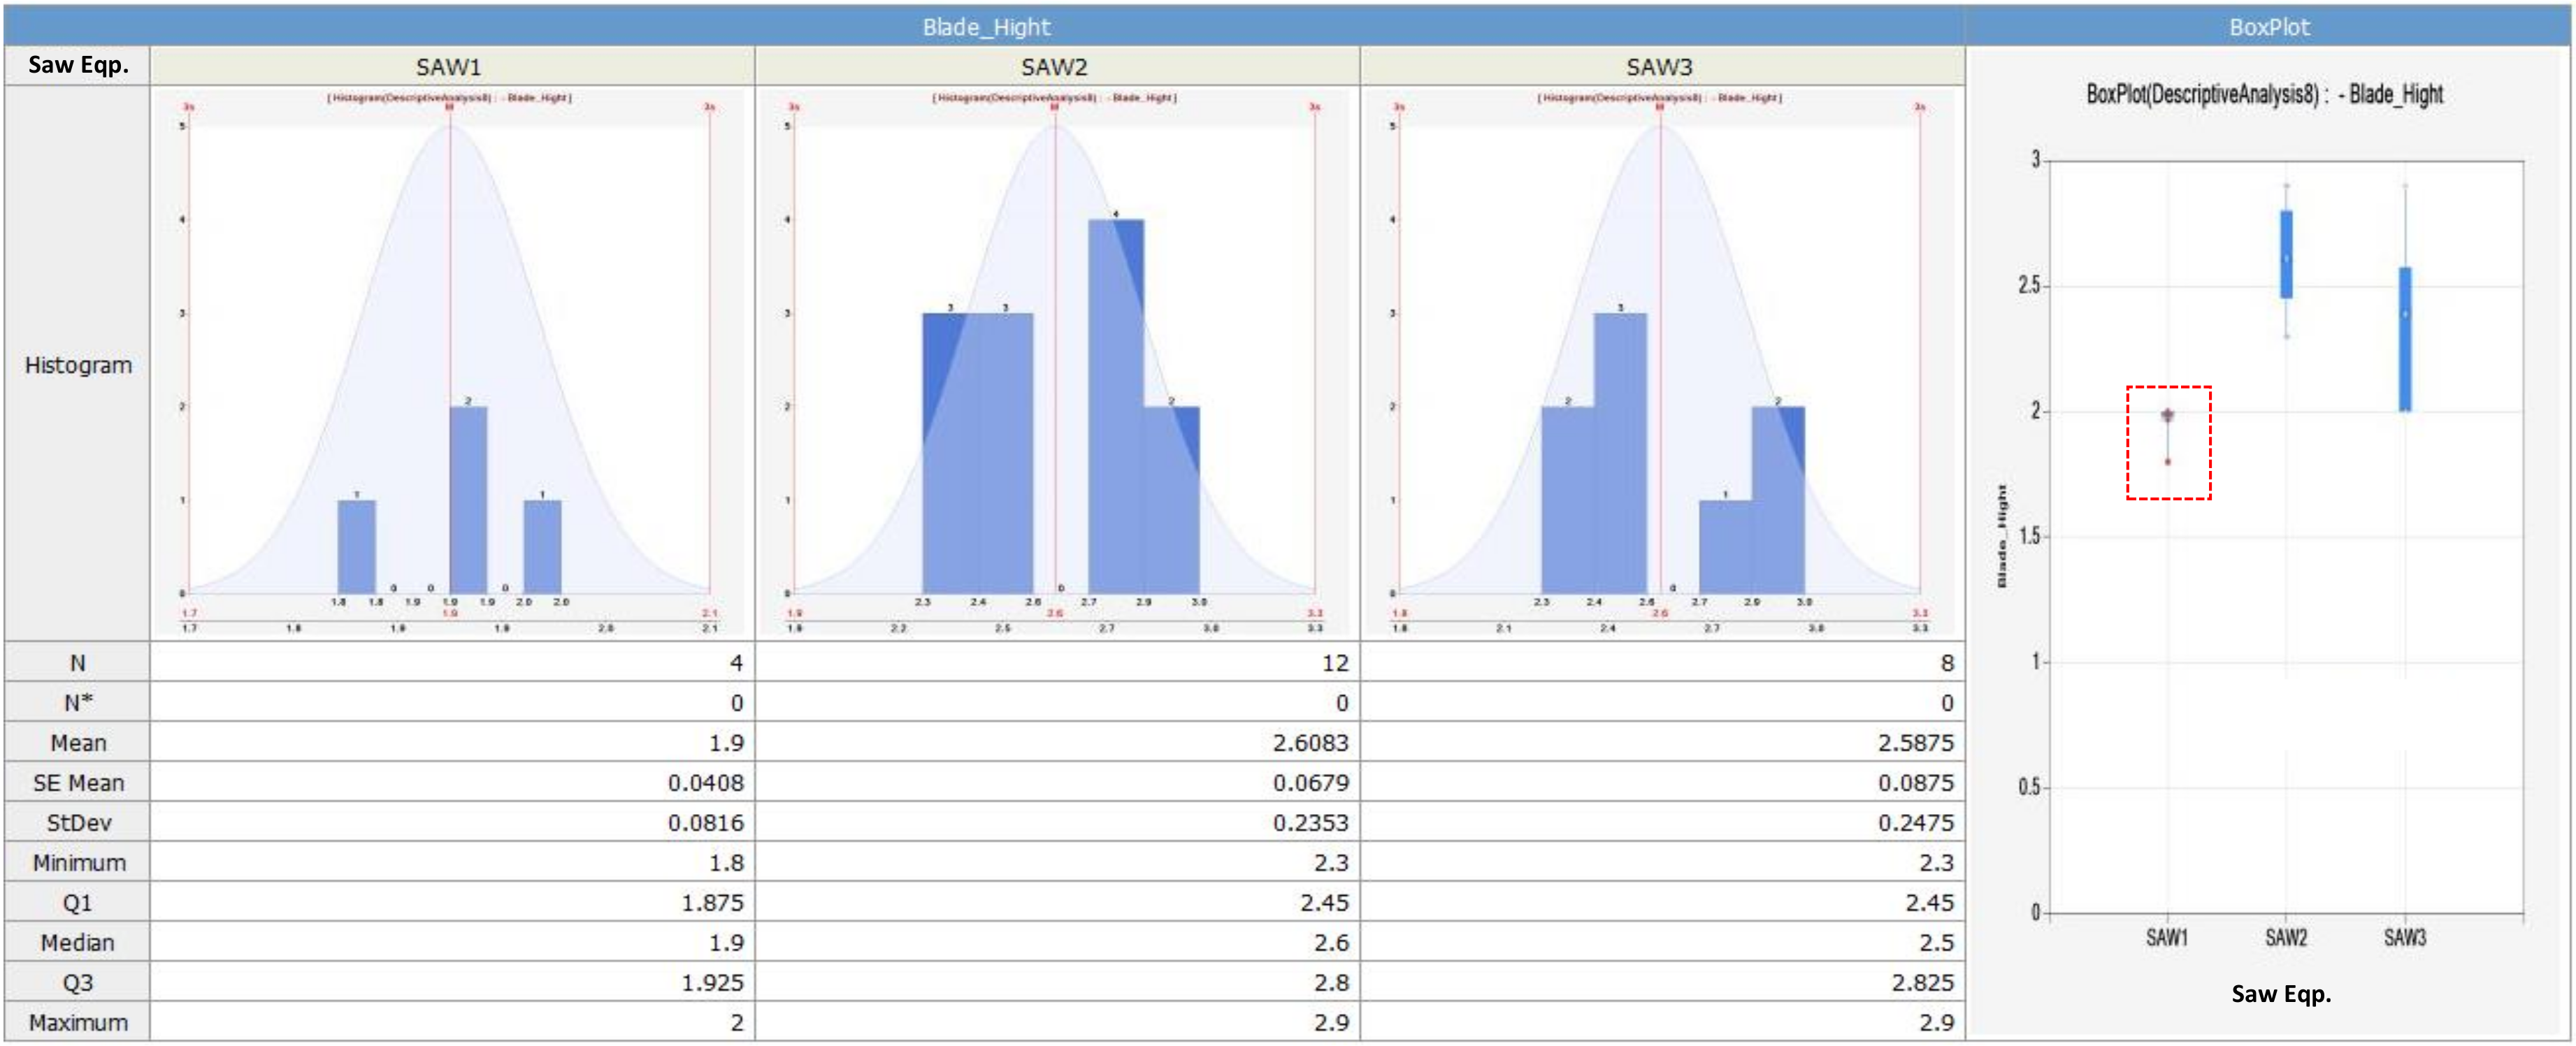
However, as shown in Figure 8, comparison result of the blade height of the first wafer sawing process equipment with that of the other two wafer sawing process equipment shows that the blade height of the first wafer sawing process equipment is relatively lower than the blade height of the other two the wafer sawing process equipment. From this, we can conclude that the blade height also affects the losses of the die attach process equipment.
Additionally, we developed a system that compares the unit per equipment hour (UPEH) of the individual wafer sawing process equipment. As shown in Figure 9, compared to the UPEHs of three wafer sawing process equipment, which causes faults in die attach equipment, it shows that the UPEH of the first wafer sawing process equipment is the lowest. This means that the lots processed in the first wafer sawing process equipment produced more faults in die attach equipment, and thus the first wafer sawing process equipment lowers the UPEH of the die attach equipment in comparison with the other two wafer sawing process equipment. Consequently, since the blade height of the first wafer sawing process equipment is very low compared to that of the other two wafer sawing process equipment, the number of non-defective die (i.e., good chip) produced hourly from the first wafer sawing process equipment can be smaller than the number of non-defective die produced hourly from the other two wafer sawing process equipment.
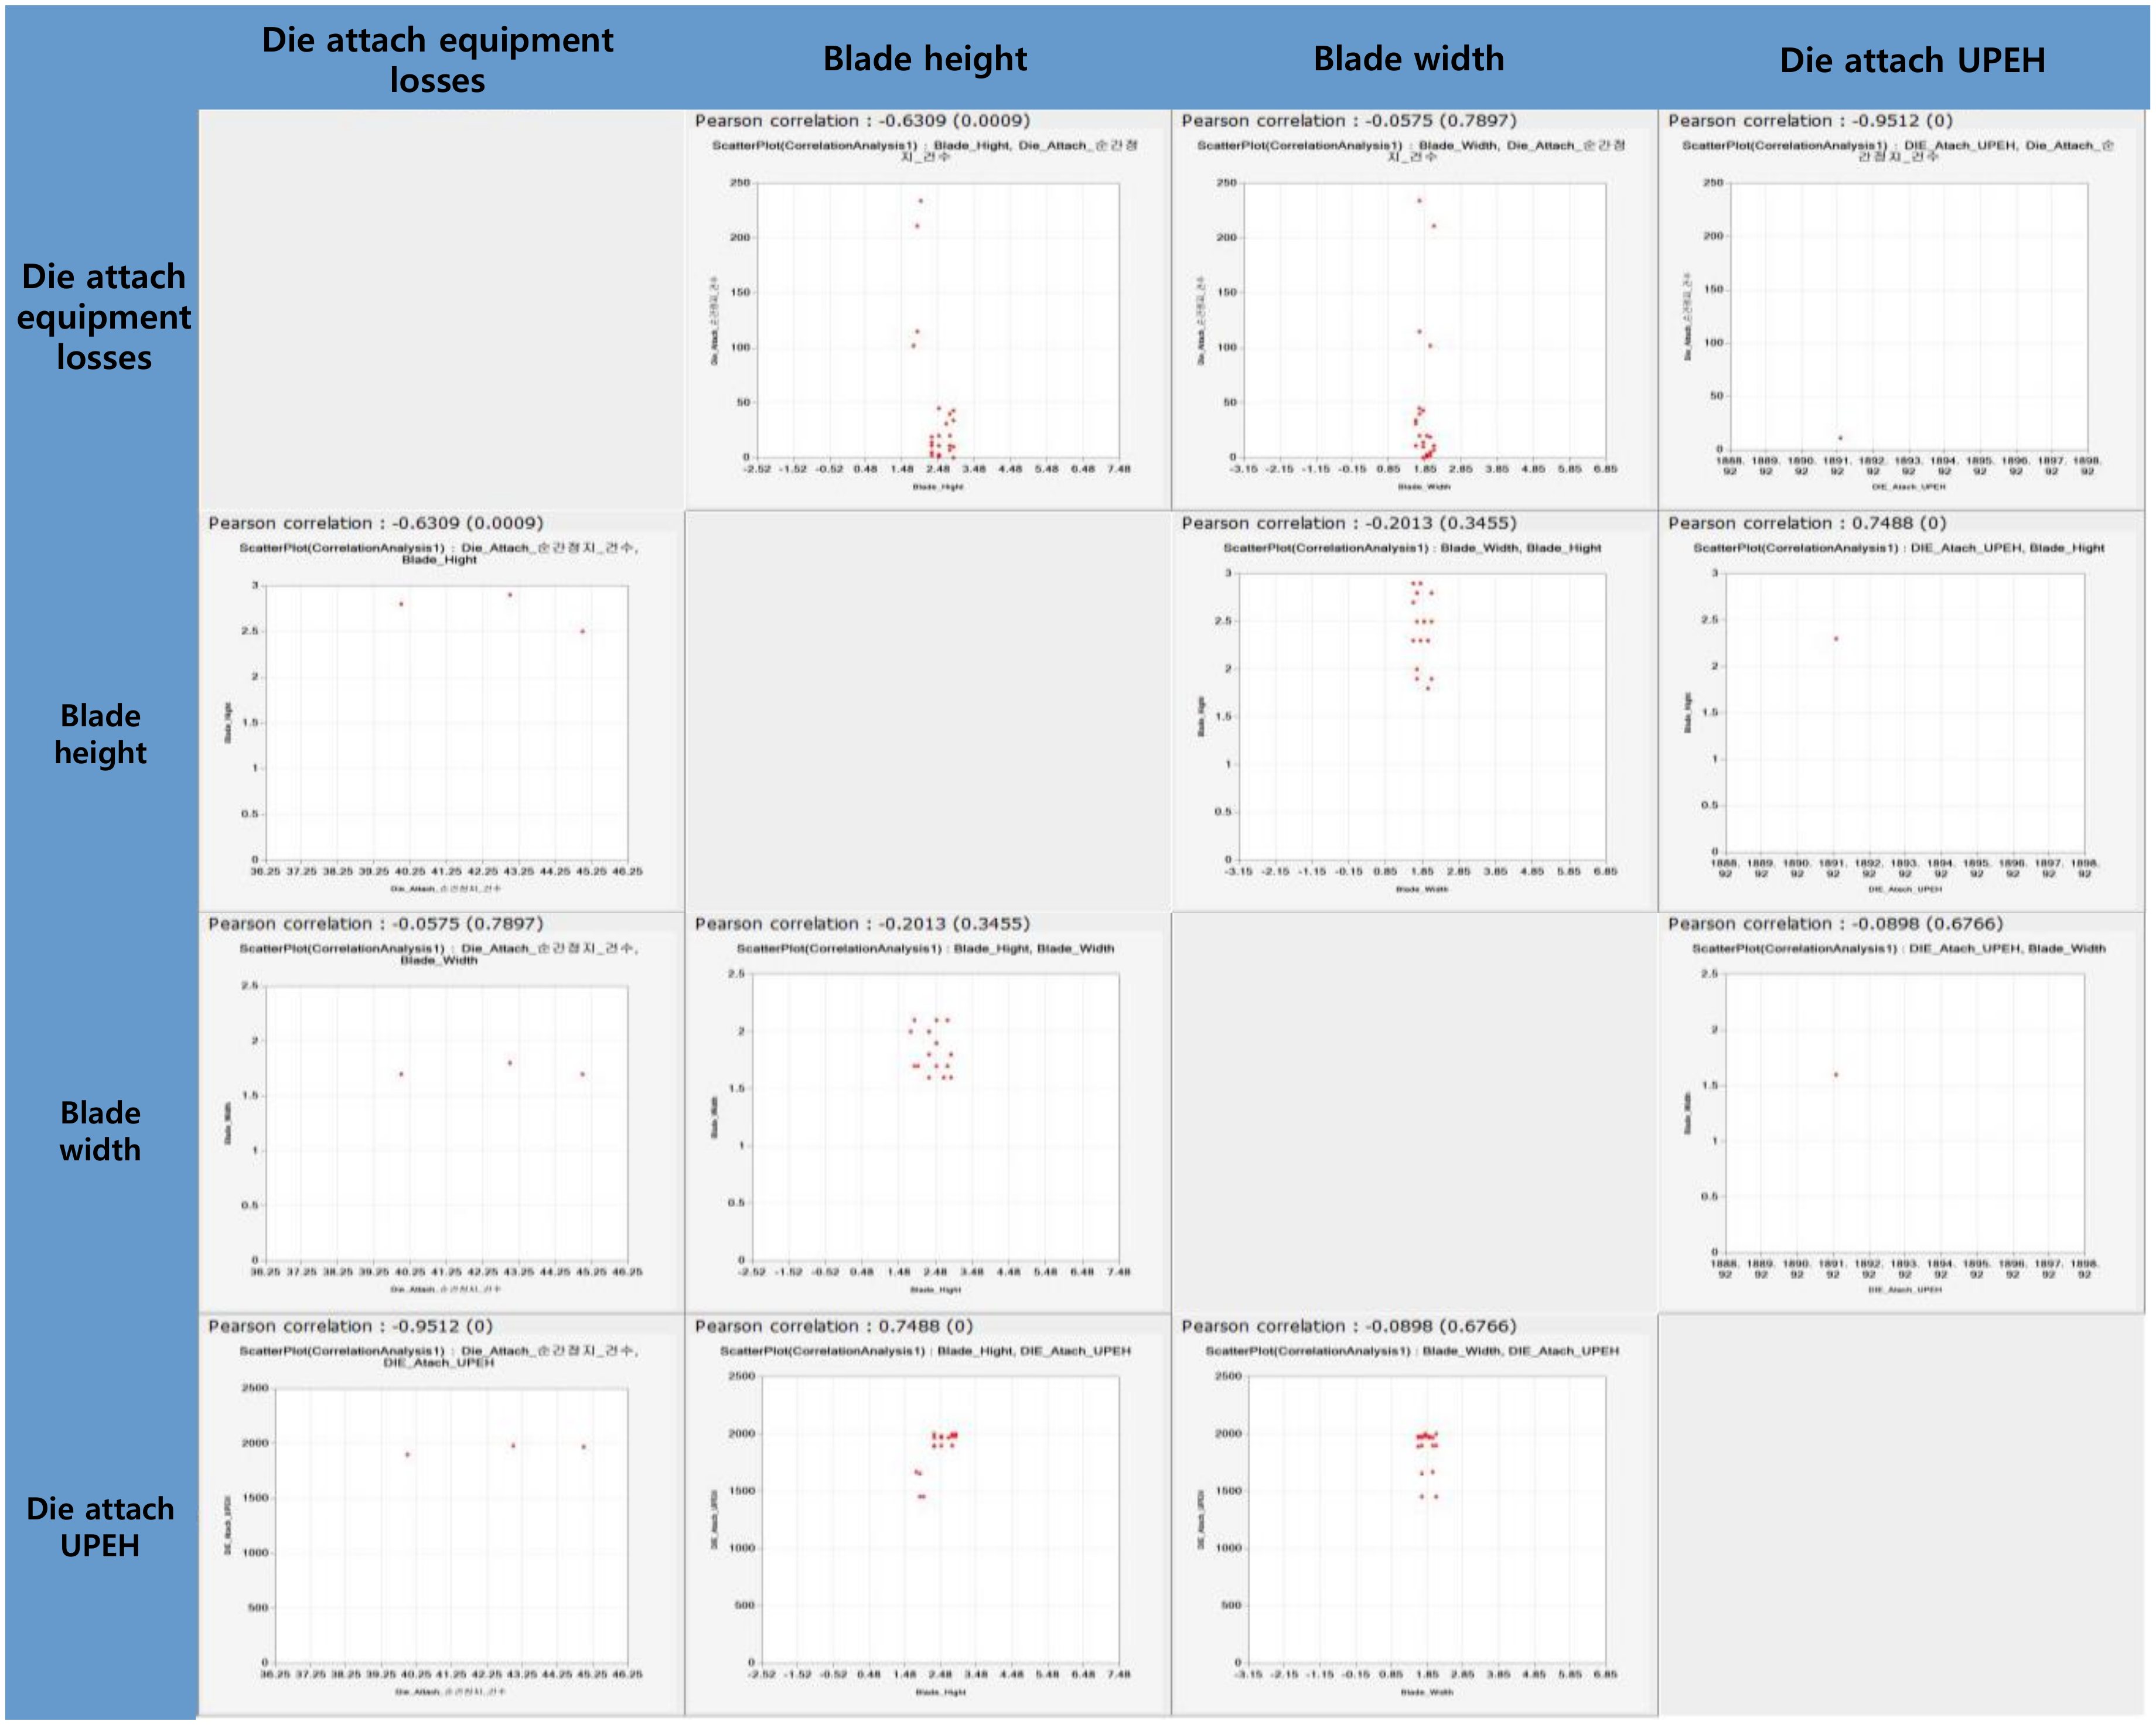
Additionally, we developed correlation analysis system for the four factors (equipment parameters) that affect the productivity, which are (i) the number of losses (due to equipment fault, i.e., unexpected stoppage) that occurred in die attach process equipment, (ii) the blade width of the wafer sawing process equipment, (iii) the blade height of the wafer sawing process equipment, and (iv) UPEHs of the die attach process equipment as shown in Figure 10. Through this system, the correlation coefficients of the previously mentioned four factors (parameters), die attach process equipment, and wafer sawing process equipment can be obtained as shown in Table 7.
The correlation analysis result shows that the correlation coefficient of the UPEH of die attach process equipment and wafer sawing process equipment is the highest (r = 0.75). It means that the wafer sawing process has the greatest influence on UPEH of die attach process equipment. In addition, among two wafer sawing process equipment parameters, the blade height has the greatest effect on the UPEH of die attach process equipment. Thus, in order to increase the UPEH of die attach process equipment, it is necessary to adjust appropriately the blade height of wafer sawing process equipment. To obtain the most suitable (i.e., optimal) blade height, a simple linear regression analysis was carried out using the data in Table 6, and the estimated linear regression model is as follows:
Here, ,
,
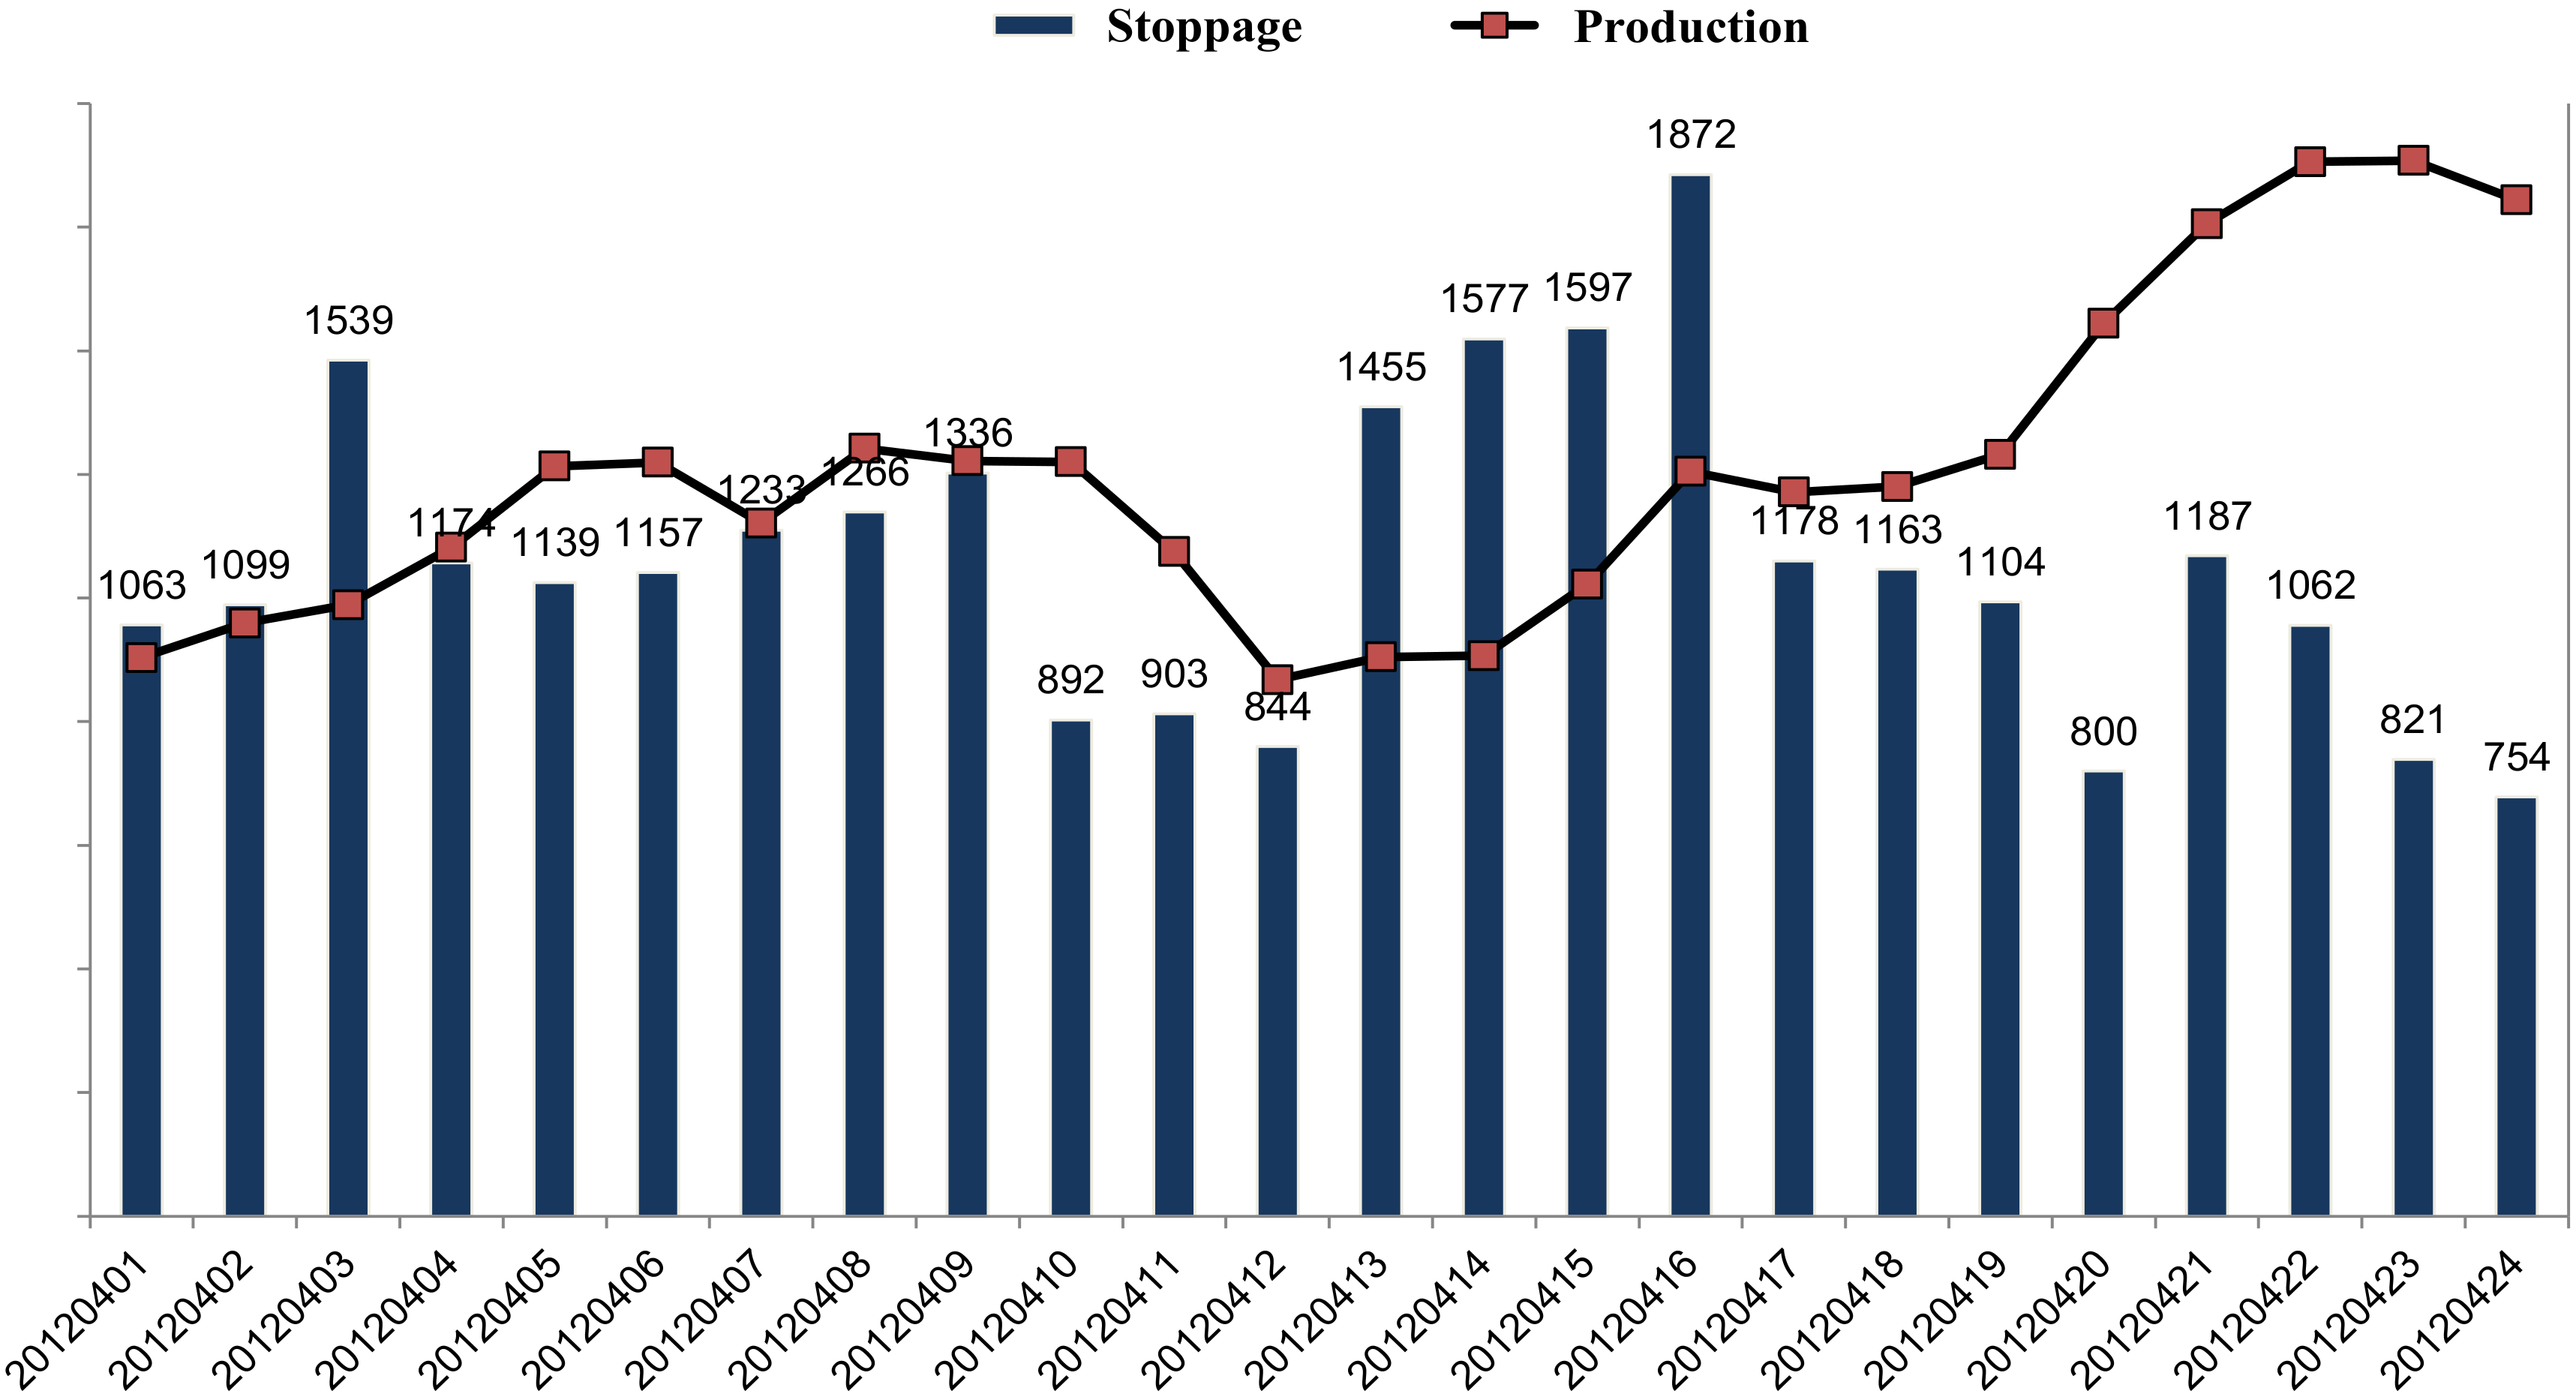
, and indicate UPEH of the ith die attach process equipment, the losses due to the die attach equipment fault including sudden stoppage (represented as the number of losses that occurred in die attach process equipment), the blade width, and the blade height, respectively. Additionally, since both values of (coefficient of determination) and (adjusted coefficient of determination) of the estimated linear regression model are 92.65% and 91.55%, respectively, so we can conclude that the estimated regression model is statistically significant. Additionally, as mentioned above, after finishing the back grinding process for wafer polishing, the wafers are then to be cut into individual chips using the wafer sawing process equipment. Since the blade height means the blade depth when cutting the wafer, the blade height is a very important equipment parameter that determines how deep the wafer will be cut. However, we should note that controlling only blade height does not guarantee the decrease of faults that occurred in die attach process equipment. The main cause for this is that the thickness of a wafer completed at the back grinding process are also influenced by the main equipment parameters of the back grinding process such as the grind speed (or polishing speed; RPM), the abrasion condition of the grinding head (or polishing head), the grinding (or polishing) time, the slurry, etc. Thus, since the blade height of wafer sawing process equipment could be influenced by the back grinding equipment (back grinder) parameters, it should be noted that the losses caused by faults that occur in die attach process equipment are not only connected to the process parameters of wafer sawing process equipment but also connected to the process parameters of the back grinding equipment. Finally, using the developed regression analysis function to estimate the most suitable (i.e., nearly optimal) blade height, we applied this function in the actual operation and, as a result, decreased the number of equipment losses due to certain faults during the whole die attach process by 40%, that is, from 1872 cases to 754 cases as shown in the following Figure 11.
5. Conclusions and Future Research
Not only are the semiconductor chip (or device) manufacturers but also the semiconductor process equipment manufacturers are actively carrying out various studies to increase both equipment productivity and product quality. In particular, there have been many drivers to significantly improve the productivity and quality of semiconductor front-end production. But, so far, there has not been a critical move for improving efficiency of the back-end production which comprises of assembly, packaging, and test process even though some researches presented strategies for automation in the back-end production. Thus, currently, many back-end equipment manufacturers are developing the various technologies that shall constitute back-end automation.
In this research, we analyzed the losses due to various faults that occur in die attach equipment of semiconductor back-end manufacturing process. Therefore, in order to find specific causes of the faults (which cause losses), we utilized the real equipment relevant datasets collected from a semiconductor back-end manufacturing company “H” over a year. The datasets include: Equipment fault data, the process parameters of die attach process equipment and wafer sawing process equipment, process history of lots and equipment history stored in the manufacturing execution system (MES), etc. Additionally, we collected data relevant not only to the equipment parameters monitored and controlled of die attach process but to all the process and equipment parameters of the back grinding process and the wafer sawing process which are the processes to die attach process, and then developed an effective analysis system including the frequency analysis, correlation analysis, and regression analysis that allow us to immediately deduce the relationship between the equipment faults and all the parameters of the die attach process. Through this analysis system, we could draw out the main equipment parameters of the wafer sawing process which directly affect the faults in the die attach process equipment. From the analysis results, we found that the number of losses that occurred in die attach process equipment hugely affects the UPEH of die attach process equipment and also there is the highest correlation of the number of losses that occurred in die attach process equipment and the blade height of the wafer sawing process equipment. It means that the blade height considerably affects the UPEH of the die attach process equipment while there is very small influence of the blade width of wafer sawing process equipment on the UPEH of die attach process equipment. Thus, we can conclude that the UPEH of die attach process equipment is inversely proportional to the number of losses that occurred in die attach process equipment and the blade height of wafer sawing process equipment is the most critical factor which affect the overall UPEH of die attach process. Additionally, we can conclude that the losses due to faults that occurred in die attach process equipment is affected by the previous process, that is, the wafer sawing process (equipment). Therefore, to avoid losses due to the equipment faults it is necessary to control the blade height in wafer sawing process equipment by limiting the number of the blade usages. Thus, in this research, we developed various useful statistical analysis modules which can be basis of automatic interlock system ceasing the wafer sawing operation when the number of blade usages exceeds a specified number (that is, when the number of blade usages is out of the specification limit). Secondly, the blade height, as one of the main equipment parameters of wafer sawing process, is the main factor that causes equipment faults (causing losses after all) in die attach process. By the way, the blade management system currently used employs the time-based maintenance approach, which replaces the blade after a certain period of time to manage the wafer sawing process equipment. However, through this research, we developed a new system which allows to collect and check the values of the blade height in real time using the SECS messages, that is, the condition-based maintenance approach in order to manage blade height of the wafer sawing process equipment more efficiently.
Finally, it is found that the faults that occur in die attach process equipment are influenced not only by wafer sawing process equipment but by the back grinding process equipment prior to the wafer sawing process. The reason for this, as mentioned earlier, is that the back-end process is in a form of flow shop, and so the influence of the processes before and after always exists. In general, the declines of productivity as well as losses or defects due to various (unexpected) faults that frequently occur during the manufacturing process are not solely attributed to relevant processes. Especially, although the equipment-oriented industries that involve many complex and microscopic processes such as the semiconductor manufacturing industry are carrying out many researches on improving productivity and on decreasing faults and losses of the corresponding processes, it is very difficult to precisely examine and improve the causes of faults and losses. Similarly, the causes of the faults in die attach process equipment are affected by the previous processes, that is, both the wafer sawing process and the back grinding process. However, practically, it might be impossible to investigate and illustrate all the causes of faults in die attach equipment and also the losses due to the equipment faults. So, it is necessary to consider all the relevant manufacturing processes and collect the related data to those processes and equipment, and then, based on this, we must investigate the causes of the productivity declination or faults and losses, and employ proper treatments to improve performances. For example, a fault that an individual semiconductor chip is not detached easily from a tape placed at the back side of the wafer for the back grinding process is caused by the problem that the tape may not stick to back side of the wafer due to the slightly uneven wafer surface from the back grinding. Thus, all the relevant process and equipment parameters should be collected since these include various kinds of information of faults and losses.
For future research, many researches on advanced process control (APC) techniques which automatically correct the previous process or equipment parameter setting along with the variety of the latest and the most suitable methods or data analysis techniques should be performed since the previous process or equipment parameters hugely influence on the productivity and product quality. Based on these techniques, the process and equipment parameters of before-and-after processes directly relevant to the die attach process as well as equipment parameters of the die attach process itself should be collected in real time using intelligent APC techniques to check not only the overall equipment effectiveness (OEE) but certain changes in other productivity indices, and then these productivity indices should be improved. Finally, because functions of the APC system are closely connected to the equipment parameters, so researches on optimizing the process recipe should also be needed, and, through a more reliable system based on these researches the occurrences of faults and losses in the semiconductor process equipment can be reduced, and ultimately the clients’ satisfaction by keeping the product due date will be maximized.
Author Contributions
Author contributions are as follows: data acquisition, Y.-J.P.; funding acquisition, Y.-J.P.; investigation, Y.-J.P.; writing—original draft, review, and editing, Y.-J.P.; methodology, S.H.; validation, S.H.; writing—review and editing, S.H. All authors have read and agree to the published version of the manuscript.
Funding
This work has been supported by the Research Project Program for Newly-Recruited Personnel funded by the Ministry of Science and Technology of Taiwan, R.O.C. (MOST 108-2218-E-027-008-MY2).
Conflicts of Interest
The authors declare no conflicts of interest.
References
- Tang, Y.; Zhou, M.C.; Qiu, R.G. Virtual production lines design for back-end semiconductor manufacturing systems. IEEE Trans. Semicond. Manuf. 2003, 16, 543–550. [Google Scholar]
- Bamber, C.J.; Castka, P.; Sharp, J.M. Cross-functional team working for overall equipment effectiveness (OEE). J. Qual. Maint. Eng. 2003, 9, 223–238. [Google Scholar]
- Konopka, J.; Trybula, W. Overall equipment effectiveness (OEE) and cost measurement. In Proceedings of the 9th IEEE/CPMT International Electronics Manufacturing Technology Symposium, Austin, TX, USA, 14–16 October 1996; pp. 137–140. [Google Scholar]
- Ames, V.A.; Gililland, J.; Konopka, A.; Barber, H. Semiconductor manufacturing productivity; Overall Equipment Effectiveness (OEE) guidelines. In Technology Transfer #950327443 A-GEN, Revision 1.0.; Sematech: Austin, TX, USA, 1995. [Google Scholar]
- Dal, B.; Tugwell, P.; Greatbanks, R. Overall Equipment Effectiveness as a measure for operational improvement. Int. J. Oper. Prod. Manag. 2000, 20, 1488–1502. [Google Scholar]
- Huang, S. Manufacturing System Modelling for Productivity Improvement. J. Manuf. Syst. 2002, 21, 249–259. [Google Scholar]
- Huang, S.H.; Dismukes, J.P.; Shi, J.; Su, Q.; Razzak, M.A.; Bodhale, R.; Robinson, D.E. Manufacturing Productivity Improvement Using Effectiveness Metrics and Simulation Analysis. Int. J. Prod. Res. 2003, 41, 513–527. [Google Scholar]
- Nakajima, S. Introduction to TPM: Total Productive Maintenance; Productivity Press: Cambridge, MA, USA, 1988; pp. 21–22. [Google Scholar]
- Ljungberg, Õ. Measurement of overall equipment effectiveness as a basis for TPM activities. Int. J. Oper. Prod. Manag. 1998, 18, 495–507. [Google Scholar]
- Muchiri, P.; Pintelon, P. Performance measurement using overall equipment effectiveness (OEE): Literature review and practical application discussion. Int. J. Prod. Res. 2003, 46, 3517–3535. [Google Scholar]
- Ron, A.J.; Rooda, J.E. Equipment Effectiveness: OEE Revisited. IEEE Trans. Semicond. Manuf. 2005, 18, 190–196. [Google Scholar]
- SEMI. Standard for Definition and Measurement of Equipment Productivity; SEMI E79-0200: Milpitas, CA, USA, 2000. [Google Scholar]
- Jonsson, P.; Lesshammar, M. Evaluation and improvement of manufacturing Performance measurement systems—the role of OEE. Int. J. Oper. Prod. Manag. 1999, 19, 55–78. [Google Scholar]
- Parida, A. Study and analysis of maintenance performance indicators (MPIs) for LKAB: A case study. J. Qual. Maint. Eng. 2007, 13, 325–337. [Google Scholar]
- Parida, A.; Chattopadhyay, G. Development of multi-criteria hierarchical framework for maintenance performance measurement (MPM). J. Qual. Maint. Eng. 2007, 13, 241–258. [Google Scholar]
- Pomorski, T. Managing overall equipment effectiveness [OEE] to optimize factory performance. In Proceedings of the IEEE International Symposium on Semiconductor Manufacturing Conference, San Francisco, CA, USA, 6–8 October 1997; pp. 33–36. [Google Scholar]
- Oechsner, R.; Pfeffer, M.; Pfitzner, L.; Binder, H.; Müller, E.; Vonderstrass, T. From overall equipment efficiency (OEE) to overall Fab effectiveness (OFE). Mater. Sci. Semicond. Process. 2003, 5, 333–339. [Google Scholar]
- Chien, C.F.; Chen, H.K.; Wu, C.H. Constructing the OGE for promoting tool group productivity in semiconductor manufacturing. Int. J. Prod. Res. 2007, 45, 509–524. [Google Scholar]
- Jacobs, J.H.; Etman, L.F.P.; van Campen, E.J.J.; Rooda, J.E. Characterization of operational time variability using effective process time. IEEE Trans. Semicond. Manuf. 2003, 16, 511–520. [Google Scholar]
- Potoradi, J.; Winz, G.; Lee, W.K. Determining optimal lot-size for a semiconductor back-end factory. In Proceedings of the 31st Conference on Winter Simulation: Simulation-a bridge to the future, Phoenix, AZ, USA, 5–8 December 1999; pp. 720–726. [Google Scholar]
- Andersson, C.; Bellgran, M. Combining Overall equipment Efficiency (OEE) and productivity measures as drivers for production improvements. In Proceedings of the 4th Swedish Production Symposium, Lund, Sweden, 3–5 May 2011; pp. 20–29. [Google Scholar]
- Kaydos, W. Operational Performance Measurement: Increasing Total Productivity, 1st ed.; CRC Press: Boca Raton, FL, USA, 1998; pp. 85–86. [Google Scholar]
- Schoemig, A.K. On the corrupting influence of variability in semiconductor manufacturing. In Proceedings of the Winter Simulation Conference: Simulation—A Bridge to the Future, Phoenix, AZ, USA, 5–8 December 1999; pp. 837–842. [Google Scholar]
- SEMI. Standard for Definition and Measurement of Equipment Reliability, Availability and Maintainability; SEMI E10-0701: Milpitas, CA, USA, 2001. [Google Scholar]
Figure 1.
Semiconductor back-end processes.

Figure 2.
Decomposition of time elements related to overall equipment effectiveness (OEE) and its losses.
Figure 2.
Decomposition of time elements related to overall equipment effectiveness (OEE) and its losses.

Figure 3.
Loss frequency and loss duration time analysis in die attach process equipment.

Figure 4.
Alarm trend in die attach process equipment.

Figure 5.
The number of losses, the number of times the equipment stoppage (STOP), and the number of maintenance (MAINT) by die attach process equipment.
Figure 5.
The number of losses, the number of times the equipment stoppage (STOP), and the number of maintenance (MAINT) by die attach process equipment.

Figure 6.
Descriptive statistical analysis results between the die attach equipment faults and wafer sawing equipment.
Figure 6.
Descriptive statistical analysis results between the die attach equipment faults and wafer sawing equipment.

Figure 7.
Analysis of difference in the blade widths among the wafer sawing process equipment.

Figure 8.
Analysis of difference in the blade heights among the wafer sawing process equipment.

Figure 9.
Comparison of UPEHs of the wafer sawing process equipment.

Figure 10.
Scatter plots of four factors (parameters): (i) The number of losses (due to equipment fault, i.e., unexpected stoppage) that occurred in the die attach process equipment, (ii) the blade height of the wafer sawing process equipment, (iii) the blade width of the wafer sawing process equipment, and (iv) UPEHs of the die attach process equipment.

Figure 11.
Improvement effect of equipment faults versus the number of strips produced for the top 20% out of the die attach process equipment that caused equipment faults.
Figure 11.
Improvement effect of equipment faults versus the number of strips produced for the top 20% out of the die attach process equipment that caused equipment faults.


Table 1.
Main losses.
| Category | Loss Type | Description |
|---|---|---|
| Stoppage loss | Fault stoppage losses | A time loss that accompanies fault stoppage |
| Production preparation or adjustment losses | A time loss that accompanies preparing operations and replacing product types | |
| Efficiency loss | Idling or equipment fault losses | Losses caused by temporary fault or when idling occurs |
| Production slowdown losses | Losses caused by the difference between the theoretical cycle time and the actual cycle time | |
| Quality losses | Process fault losses | Product losses during the process period |
| Initial yield losses | Product losses during the early production period |
Table 2.
Alarm category (ALCD).
| Alarm Category | Definition |
|---|---|
| 0 | Not used |
| 1 | Personal safety |
| 2 | Equipment safety |
| 3 | Parameter control warning |
| 4 | Parameter control fault |
| 5 | Irrecoverable fault |
| 6 | Equipment status warning |
| 7 | Data integrity |
| 8 | Other category |
| 9–63 | Reserved |
Table 3.
Development method 1 of a new monitoring system.
| Definition | Description | Procedure |
|---|---|---|
| A method to reduce losses due to equipment faults, that is, the unscheduled downtime which influences the die attach availability | That is, to reduce the time-related losses caused by equipment faults, we figure out what kinds of losses are affecting the equipment, and analyze the causes regarding the failure times (i.e., the fault occurrence time and the fault termination time). | The sub-procedures of this method are shown below: (Procedure 1) Classify the types of losses in die attach process equipment (Procedure 2) Collect the die attach loss data through the semiconductor equipment communication standard (SECS) messages (Procedure 3) Analyze the collected data and classify the losses that affect the availability separately |
Table 4.
Development method 2 of a new monitoring system.
| Definition | Description | Procedure |
|---|---|---|
| A method to reduce reworks | The quality losses occur due to various equipment and process faults, but we use a method to minimize the reworks that are not usually classified as a loss. | The following sub-procedures are to draw out the reworks and the related causes: (Procedure 1) Analyze the hourly productivity of the die attach equipment (Procedure 2) Extract lots with losses, and then analyze the information of losses of the die attach equipment which are included in process history, recipe history, and equipment process history (Procedure 3) Identify a relationship between extracted lots with losses and processes undergone (e.g., descriptive statistics, correlation analysis, and regression analysis) (Procedure 4) Monitor and find the causal factor (or the causal parameter) of the previous processes using the analysis results |
Table 5.
Development procedure of quality loss analysis.
| Procedure | Actions |
|---|---|
| 1 | Investigate the unit per equipment hour (UPEH) in die attach process equipment, and monitor the equipment with the most losses. |
| 2 | Investigate the lots proceeded when the die attach process equipment fail, and analyze which lots were affected by the losses in the die attach process equipment. |
| 3 | Investigate whether the lots with losses are related to the previous process, that is, the wafer sawing process, and analyze the influence of the wafer sawing process equipment. |
| 4 | Analyze the relationship between the parameters of the wafer sawing process equipment and the die attach process equipment, and deduce the causes of the wafer sawing process equipment (that is, equipment parameters or factors). |
Table 6.
The die attach equipment data and the wafer sawing process equipment data.
| Die Attach Process Equipment ID Number | The Number of Equipment Faults Occurred in the Die Attach Equipment | UPEH of the Die Attach Process Equipment | Wafer Sawing Process Equipment Number | Blade Height (μm) | Blade Width (μm) |
|---|---|---|---|---|---|
| 1 | 20 | 1980 | 2 | 2.8 | 1.7 |
| 2 | 31 | 1970 | 2 | 2.7 | 1.6 |
| 3 | 40 | 1900 | 2 | 2.8 | 1.7 |
| 4 | 0 | 2000 | 3 | 2.9 | 1.8 |
| 5 | 3 | 1980 | 3 | 2.5 | 1.9 |
| 6 | 5 | 1970 | 3 | 2.3 | 2 |
| 7 | 7 | 1900 | 3 | 2.8 | 2.1 |
| 8 | 11 | 1892 | 2 | 2.3 | 1.6 |
| 9 | 115 | 1654 | 1 | 1.9 | 1.7 |
| 10 | 43 | 1980 | 2 | 2.9 | 1.8 |
| 11 | 20 | 1970 | 2 | 2.5 | 1.9 |
| 12 | 19 | 1900 | 2 | 2.3 | 2 |
| 13 | 211 | 1454 | 1 | 1.9 | 2.1 |
| 14 | 234 | 1454 | 1 | 2 | 1.7 |
| 15 | 10 | 2000 | 3 | 2.9 | 1.8 |
| 16 | 1 | 1980 | 3 | 2.5 | 1.9 |
| 17 | 2 | 1970 | 3 | 2.3 | 2 |
| 18 | 11 | 2000 | 2 | 2.8 | 2.1 |
| 19 | 34 | 1980 | 2 | 2.9 | 1.6 |
| 20 | 45 | 1970 | 2 | 2.5 | 1.7 |
| 21 | 14 | 2000 | 2 | 2.3 | 1.8 |
| 22 | 1 | 1980 | 3 | 2.5 | 1.9 |
| 23 | 102 | 1670 | 1 | 1.8 | 2 |
| 24 | 11 | 1900 | 2 | 2.5 | 2.1 |
Table 7.
Correlation coefficients matrix of four factors (parameters) of die attach process equipment and wafer sawing process equipment.
Table 7.
Correlation coefficients matrix of four factors (parameters) of die attach process equipment and wafer sawing process equipment.
| Die Attach Equipment Losses | Blade Height | Blade Width | Die Attach UPEH | |
|---|---|---|---|---|
| Die Attach Equipment Losses | −0.63 | −0.57 | −0.95 | |
| Blade Height | −0.63 | −0.20 | 0.75 | |
| Blade Width | −0.57 | −0.20 | 0.09 | |
| Die Attach UPEH | −0.95 | 0.75 | 0.09 |
© 2020 by the authors. Licensee MDPI, Basel, Switzerland. This article is an open access article distributed under the terms and conditions of the Creative Commons Attribution (CC BY) license (http://creativecommons.org/licenses/by/4.0/).
Share and Cite
MDPI and ACS Style
Park, Y.-J.; Hur, S. Improvement of Productivity through the Reduction of Unexpected Equipment Faults in Die Attach Equipment. Processes 2020, 8, 394. https://0-doi-org.brum.beds.ac.uk/10.3390/pr8040394
AMA Style
Park Y-J, Hur S. Improvement of Productivity through the Reduction of Unexpected Equipment Faults in Die Attach Equipment. Processes. 2020; 8(4):394. https://0-doi-org.brum.beds.ac.uk/10.3390/pr8040394
Chicago/Turabian StylePark, You-Jin, and Sun Hur. 2020. "Improvement of Productivity through the Reduction of Unexpected Equipment Faults in Die Attach Equipment" Processes 8, no. 4: 394. https://0-doi-org.brum.beds.ac.uk/10.3390/pr8040394
Note that from the first issue of 2016, this journal uses article numbers instead of page numbers. See further details here.