Numerical Modeling and Analysis of the Performance of an Aluminum-Air Battery with Alkaline Electrolyte

1
Research Center of Fluid Machinery Engineering and Technology, Jiangsu University, Zhenjiang 212013, China
2
School of Materials Science and Engineering, Jiangsu University, Zhenjiang 212013, China
*
Author to whom correspondence should be addressed.
Processes 2020, 8(6), 658; https://0-doi-org.brum.beds.ac.uk/10.3390/pr8060658
Submission received: 16 May 2020
/
Revised: 26 May 2020
/
Accepted: 29 May 2020
/
Published: 1 June 2020
(This article belongs to the Special Issue Monitoring and Simulation for Battery System)
Abstract
:A numerical model is created to simulate the discharge performance of aluminum-air batteries (AABs) with alkaline electrolyte. The discharge voltage and power density, as a function of the discharge current density, are predicted for the modeled AAB and compared with experimental measurements. A good agreement between model and experiment is found. The effect of various model parameters on the battery performance is studied by adjusting the parameters within a suitable range. The results show that electrolyte thickness is a key factor that can strongly increase the power density and the corresponding current density as the electrolyte thickness decreases. The peak of power density is increased by a factor of two if the electrolyte thickness is reduced from 7 mm to 3 mm. The alkaline concentration is also an important factor, since both the voltage and power density curves are significantly raised as the NaOH concentration is increased from 1 to 4 mol/L. The partial oxygen pressure plays a secondary role in performance improvement. The peak of power density is increased by 35% using pure oxygen in the air electrode. In addition, the active specific surface area of the catalyst layer also affects the discharge capability of the AAB system.
1. Introduction
Due to increasing environmental problems, which are caused largely by the continuous consumption of fossil fuel, it is important to develop new types of clean and sustainable energy systems. The vehicle industry that uses fossil resources as the main fuel has also accelerated its transition from fossil energy to electricity [1]. At present, the development and application of power batteries mainly focus on lithium-ion batteries and hydrogen fuel cells. However, both face great challenges in terms of cost, resources, infrastructure, recycling technology, and safety [2,3,4]. The strong demand for power batteries with high specific power density and cost-effectiveness, encourages a faster development of other types of batteries. The family of metal-air batteries, in particular, has received increasing attention in recent years because of its high theoretical specific power-density. Aluminum-air battery is viewed as the most potential solution thanks to its relative abundance on Earth, safety, and recyclability [5].
In 1962, Zaromb first reported the feasibility of an aluminum-air battery and built a battery with both high specific energy and high specific power [6]. Several experimental studies have shown that the AAB system can work with all three types of electrolytes: acid [7], neutral [8], and alkaline [9]. However, the experimental results show that AAB in alkaline electrolyte demonstrates the best performance in terms of discharge voltage, power density, and current density. Self-corrosion of the aluminum anode in the alkaline solution is the biggest problem because it can lead to material loss when the battery is in standby [10]. In order to mitigate self-corrosion of the aluminum anode in alkaline electrolytes, anodic alloying and electrolyte additives have been investigated in depth. Anode alloying generally uses the addition of Zn, In, Mg, Ga, Sn, Bi, B, and other elements to the aluminum anode, so that the formed aluminum alloy has a higher hydrogen evolution potential and corrosion resistance [11,12,13,14,15,16,17,18,19,20,21,22]. Furthermore, the addition of Cl−, F−, SO42−, In3+, Ga(OH)4−, MnO42−, ZnO, and other additives to the electrolyte were shown to improve the activation and corrosion resistance of aluminum anodes [23,24].
Recently, several alkaline AAB prototypes reported in the literature have shown excellent characteristics in their performance. For instance, Ilyukhina et al. [25] used 8 mol/L NaOH solution as the electrolyte to develop and test a 1.5 kW AAB stack with a specific capacity of 270 Wh/kg. The obtained maximum battery power was 195 mW/cm2. In 2018, Hopkins used a non-conductive oil to replace the electrolyte to suppress self-corrosion when the battery was idle. This ensured the system energy density was as high as 700 Wh/L and 900 Wh/kg, and a 11 kW battery module was built [26].
Although the AAB prototype was available, the battery performance was still designed by relying on the designers’ experience rather than mathematical models. It is difficult to peek into the internal discharging processes, especially for the testing cell and battery module. Similar to the design in many other fields, it is important for a computer-aided design or a numerical model to simulate the battery performance for optimization design. This study aims to build a new numerical model to simulate the discharge performance of an alkaline AAB. The model considers many physical processes in the electrochemical cell and can predict the discharge current density, voltage, and the resulting power density for different design variations. The basic principles of the numerical model are introduced in Section 2. Then, the numerical results are compared with experiments using the same design and operating conditions in the following section. Section 4 deals with the effect of different factors on the battery performance, and potential optimization schemes are proposed.
2. Mathematical Model
2.1. Mechanism of an AAB
The basic operating principle of an air battery is that the aluminum anode undergoes an oxidation reaction, releases electrons, and generates metal ions that are dissolved in the solution. At the same time, the oxygen that enters the air electrode through the diffusion effect absorbs electrons with the help of the catalyst, and a reduction reaction occurs, OH− is generated, which is dissolved in the electrolyte. All reaction formulas are summarized as below:
Anode reaction
Cathode reaction
Overall reaction
Hydrolysis reaction
The hydrolysis reaction cannot be avoided in the AAB system. However, it will not be modeled in this model because the hydrogen evolution self-corrosion is very small during battery discharge at moderate and high current densities [26], which are normally the operating condition of power batteries. Hence, ignoring its effects should not affect the accuracy of the simulation results significantly.
2.2. Physical Model of AAB
The battery cell consists of an aluminum anode plate, an electrolyte chamber, a PTFE separator, and the carbon cathode. 2D modeling was done because it can represent the battery cell well. The 2D single-cell model of the AAB battery is shown in Figure 1. The leftmost part of the model is an aluminum plate (Ι), followed by the electrolyte (ΙΙ), the PTFE separator, and the air electrode (ΙΙΙ). In order to make the simulation simple and fast without sacrificing accuracy, several assumptions were made for the model:
- (1)
- It was assumed that the battery operates in an isothermal environment, hence, the thermal effect of the battery discharge was not considered.
- (2)
- It was assumed that the electrolyte was always electrically neutral during battery discharge without a significant capacitance effect.
- (3)
- It was assumed that oxygen dissolved in the electrolyte very fast, and a saturated solution was always obtained.
- (4)
- It was assumed that no aluminum precipitate was formed in the electrolyte since a velocity filed was defined in the electrolyte domain to represent the phenomenon of circulating electrolyte as applied in common AAB prototypes [26].
The mathematic model consists of the current conservation equation, mass conservation equation, and electrochemical kinetics equation. These can be expressed as shown in the next section.
2.3. Governing Equations
(a) Governing equations of mass and current conservation
Based on Fick’s second law, a material balance equation for species i transport in the electrolyte can be expressed as:
where Ci is the concentration of the species i and Ri, the reaction source that represents the generation rate or consumption rate for the ion i in the electrolyte. Ni is the molar flux of the species i, which is a combination of the diffusion, migration, and convection effects. It can be expressed from the Nernst-Planck equation described below:
where Di is the diffusion coefficient of species i, Zi is the species charge number, F is the Faraday’s constant, φ is the electric potential and , the fluid velocity vector. The conduction of the current in the electrolyte is achieved by the movement of ions in the electrolyte. The following formula was used to describe the potential change in the electrolyte:
In the solid phase, the conduction of current depends on the transport of electrons, and Ohm’s law can be used to describe the change of the potential of the solid:
where is is the current density and σs is the electric conductivity of the solid phase. Furthermore, μi is the mobility coefficient for ion i, which can be related to the ion diffusion rate via the Nernst-Einstein relationship [27]:
where R is the molar gas constant and T, the modeling temperature.
In the porous air electrode, the macroscopic theory of the porous electrode was used to explain the internal mass transport [28]. The mass transport and mass conservation equation for the substance in the porous electrode is:
where ε represents the volume rate of the porous electrode occupied by the electrolyte. Both the effective diffusion coefficient Di,eff and effective migration coefficient µi,eff depend on the internal tortuosity of the porous electrode. The Bruggeman relationship is often used to correct the pore for the porous electrode effect [29]:
(b) Electrochemical reaction kinetics
The oxidation rate of the aluminum anode is usually described using the Butler-Volmer equation:
where ia,0 is the anode exchange current density, which represents the reversible redox current density of the electrode reaction when it is in equilibrium. Furthermore, aa and ac are the positive and negative transfer coefficients for the electrode reaction, respectively. They are expressed as the relative position of the activated ions in the electric double layer. η is the reaction activation overpotential, which is the main driving force for the electrode reaction. For a given current density, the difference between the electrode potential and the equilibrium potential can be expressed as:
where φs represents the electrode potential, φl is the electrolyte potential, and Eeq is the equilibrium potential of the electrode reaction. It can be calculated using the Nernst equation:
where ai is the chemical activity of species i, corrected by the activity coefficient γ:
The reduction reaction rate of the cathode oxygen considers the concentration diffusion of the reactant in the porous electrode. It is expressed by the modified Butler-Volmer equation as:
where a represents the active specific surface area of the porous electrode’s catalytic layer, ic,0 represents the cathode exchange current density, and COH−,ref and CO2,ref are the reference concentrations of OH− and oxygen in the porous cathode. All parameters are listed in Table 1.
(c) Boundary conditions and model settings
As shown in Figure 1, the two-dimensional model of the aluminum-air battery consists of 5 domains and 19 boundaries. Boundary 1 sets a reference electrode for the battery system, and the aluminum electrode surface is grounded (). Boundary 4 is the interface between the aluminum plate and the electrolyte. The electrochemical reaction kinetics is coupled with the equation of matter:
where Vi is the stoichiometric coefficient of the reactant, and n is the number of participating electrons.
Boundary 16 is the porous electrode collector with the externally applied current density. The porous electrode is in contact with the outside air for this boundary. Assuming that oxygen is saturated and dissolved in the electrolyte, it is supplied at a constant concentration. The solubility of oxygen concentration in the electrolyte can be calculated using the partial pressure for oxygen via Henry’s law:
where Pg, is the partial pressure of the gas, H is the Henry constant, and X is the molar solubility of the gas. All other external boundaries are insulated. The open-circuit voltage of the entire circuit is the difference between the electrode potential of the porous electrode and the aluminum electrode potential: . A constant velocity of v = 0.01 m/s along the positive Y-axis is defined in the domain II to represent a circulating electrolyte. The numerical model was validated by performing the simulation of the AAB design used in Ref. [26].
The mathematical model for the AAB was defined using COMSOL Multiphysics 5.4 with the modules for tertiary current distribution, Nernst-Planck, and the transport of diluted species. The model was solved in steady-state via the finite element method. The governing equations were iteratively solved under the defined boundary conditions until the battery voltage reaches a relatively stable state. A typical simulation takes 3 min using 4 nodes with 2.1 GHz.
3. Simulation Results
3.1. Modeling Validation
In the experiment [26], the anode is a nonporous aluminum foil (99.999 wt% purity, Sigma Aldrich), and the cell distance from anode to cathode was 7 mm. The electrolyte was a 4 mol/L NaOH solution (98 wt% purity, Sigma-Aldrich). The cathode was a QSI-Nano® manganese gas diffusion air electrode (Quantum Sphere). A hydrophilic oleophobic separator film (Advantec MFS, Inc.) was used to create a double electrolytic chamber. The modeling parameters are shown in Table 1.
Both the numerical and the experimental results [26] are presented in Figure 2. The simulation results are in good agreement with the experimental data. The open-circuit voltage was 1.906 V in the simulation and 1.834 V in the experiment, and the relative error was marginal. The curves for the discharge voltage under different current densities show a small discrepancy at low current densities, and the variation gradually diminishes as the current density increases. The deviation from the experimental data is attributed to the assumption that the hydrogen evolution reaction was ignored in the numerical simulation while its associated loss in discharge voltage was not marginal under low discharge current density. The decreasing discrepancy between the two voltage curves indicates the effect of hydrogen evolution reaction becomes marginal at moderate and high current densities [37]. The predicted maximum power density was 310 mW/cm2, and 307 mW/cm2 was measured in the experiment. The maximum relative errors for voltage and power density between simulation and experiment are 3.78% and 1.09%, respectively.
3.2. Internal Characteristics of the Alkaline AAB
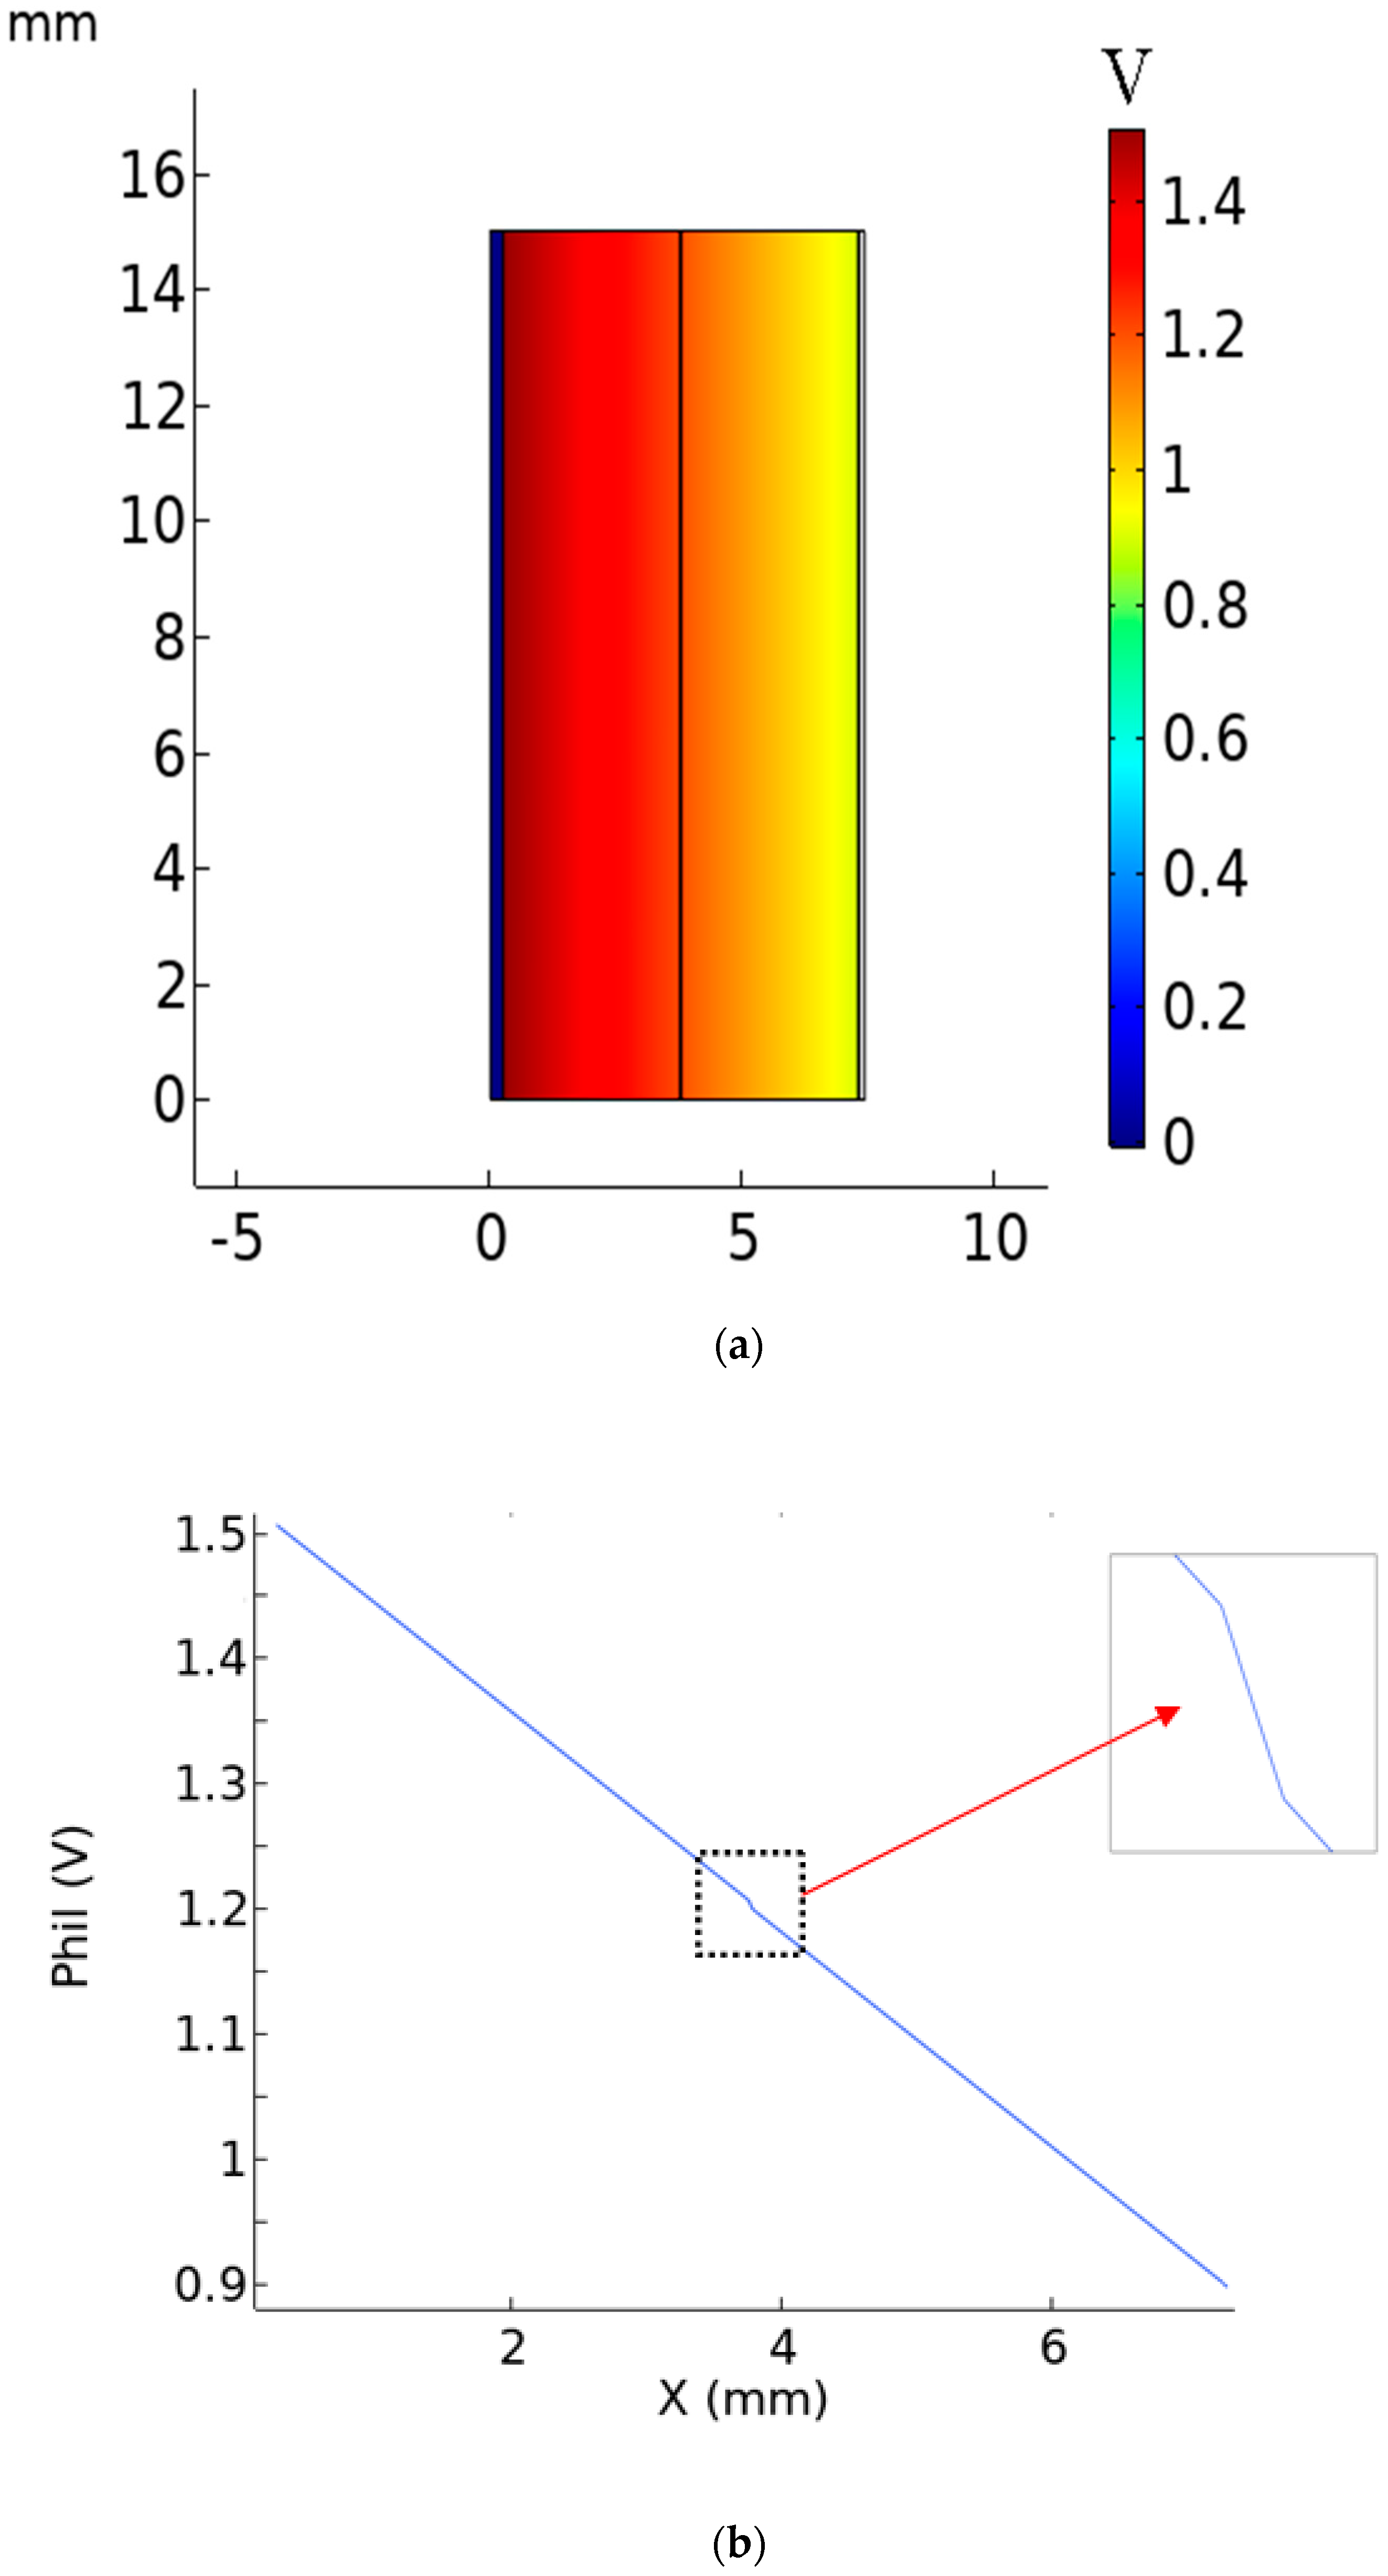
The internal characteristics, such as internal potential and ion distributions can be found in the simulation results. Figure 3a shows the potential in the interior of the battery for a discharge current density of 300 mA/cm2 with a discharge voltage of about 1 V (most frequent operating condition for AAB system [38]). The potential of the aluminum plate is zero because it is grounded, and potential jumps were found at both interfaces between the two electrodes and the electrolyte. This is considered to be the effect of an overpotential across the interface between the electrode and electrolyte. It can be seen that the potential is constant along the Y-axis. Therefore, a horizontal curve is created to depict the potential within as seen in Figure 3b. The potential jumps up to 1.51 V at the interface between the aluminum anode and the anolyte and then, the potential reduces toward the air electrode. However, the larger PTFE separator resistance produces a larger obstacle for the transportation of internal ions and results in a voltage jump in the membrane area. This is consistent with the conclusion that the discharge power of the battery without PTFE membrane was higher than with PTFE reported in Ref. [26].
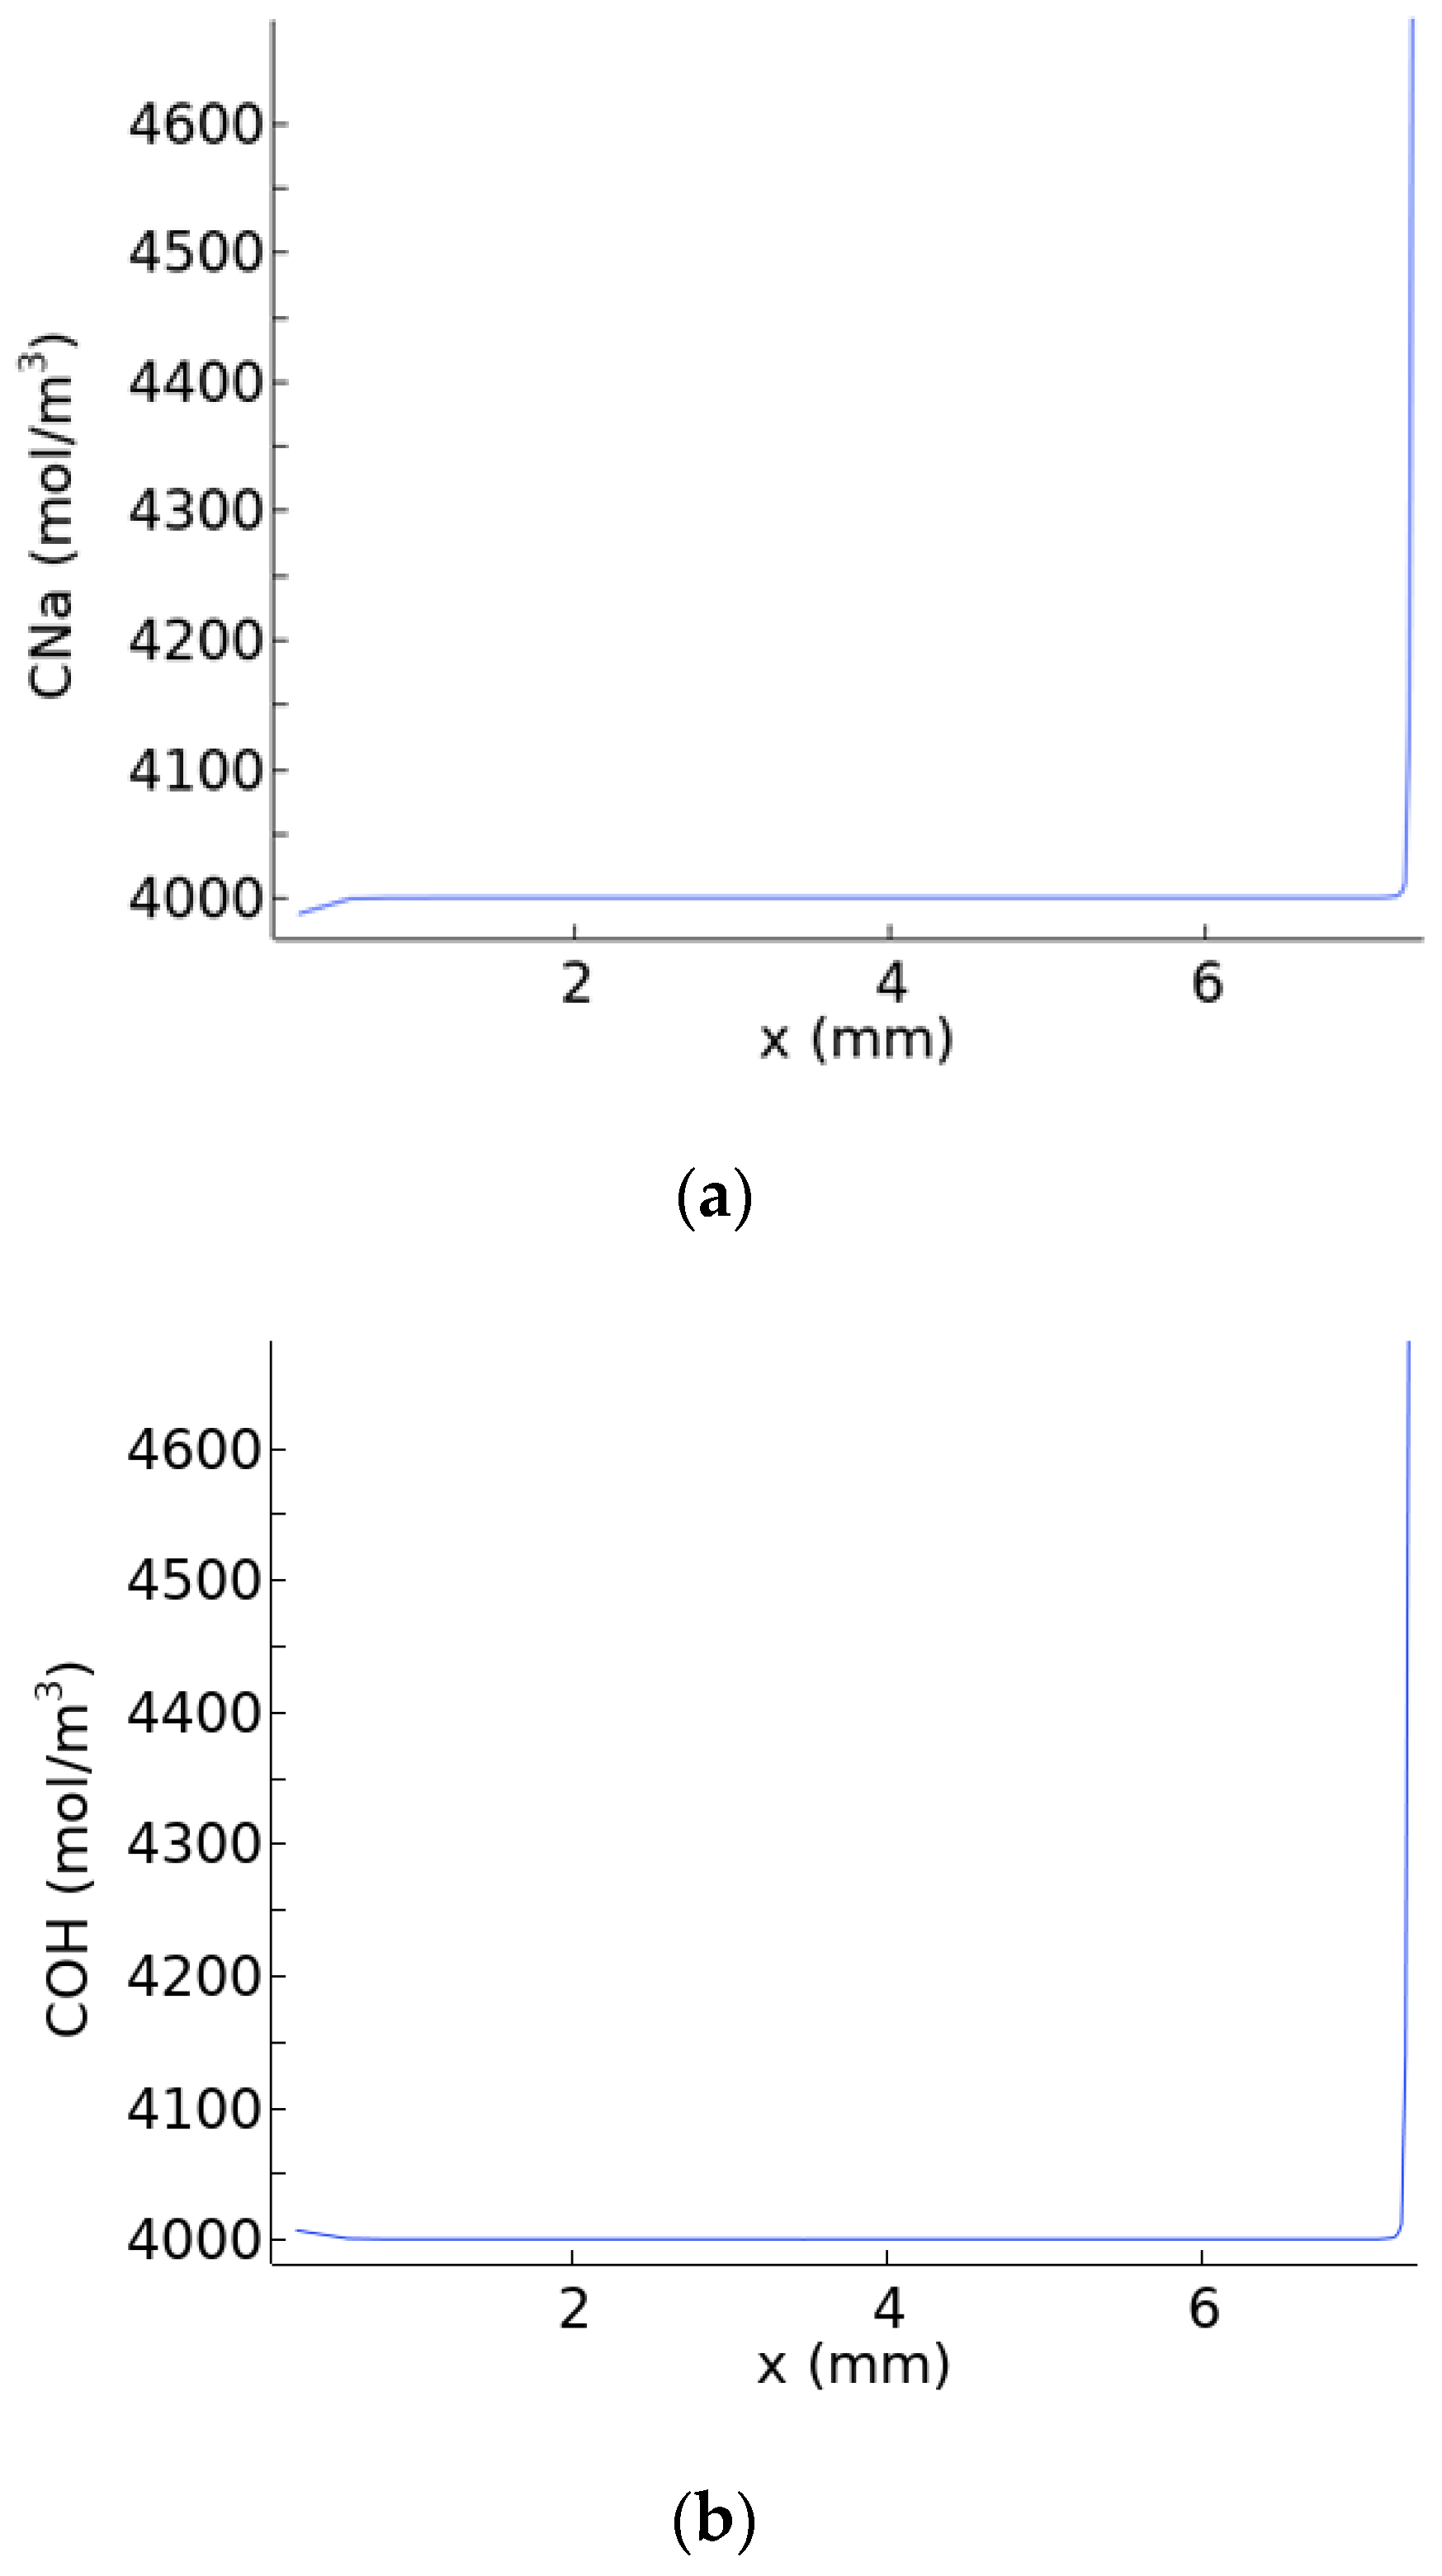
Figure 4 shows the distribution of different ion concentrations within the electrolyte with a discharge current density of 300 mA/cm2. The OH− concentration slightly increases near the aluminum electrode as seen in Figure 4b. This is because, in the vicinity of the aluminum electrode, the dissolved Al3+ ions strongly attract OH− ions. In the catholyte, oxygen in the air drives electrons in the cathode catalytic layer, thereby forming OH− ions that are dissolved in the electrolyte. As a result, the ion concentration on the cathode side increases. As shown in Figure 4a, the concentration distribution of Na+ slightly decreases near the aluminum anode. This is because a large amount of Al3+ dissolved near the aluminum anode and repelled Na+ to the cathode, which reduced the concentration near the anode. The intermediate region has a uniform fluid flow, and the ion concentration tends to be balanced. In the catholyte, the rapid increase in the Na+ concentration is due to the large number of OHˉ ion attraction, generated in the cathode pores.
4. Effects of Different Parameters on Battery Performance
The effect of each individual factor on the battery performance can be revealed using the numerical model. Then, the relative importance among them can be determined by evaluating the changes in the discharge curves of voltage and power density. In this section, we conduct single-factor tests of the battery design parameters to provide references to optimize battery performance. The modeled battery structure was modified by using a single chamber for the alkaline electrolyte, i.e., removing the PTFE separator of the validated case.
4.1. Effect of Electrolyte Thickness
At normal temperature and pressure, the internal resistance of the electrolyte is mainly determined by the length of the electrolyte cavity and the concentration of the electrolyte. In this section, the effects of battery pole distance and electrolyte concentration on the battery performance are discussed separately.
Figure 5 shows the predicted performance curves, when the electrolyte thickness is 3 mm, 5 mm, and 7 mm, respectively. It can be seen that when the length of the electrolyte is 3 mm, the peak power of the battery is 611 mW/cm2, and the peak current density is 710 mA/cm2. When the cavity length is 5 mm, the peak power of the battery is 418 mW/cm2 and the corresponding current density is 474 mA/cm2. When the cavity length is 7 mm, the peak power of the battery is 315 mW/cm2 and the corresponding current density is 354 mA/cm2. As the length of the electrolyte cavity decreases, the electrode distance of the battery decreases, and the internal resistance of the battery decreases accordingly. The battery can discharge at a greater current density, and both battery voltage and power increase significantly. The results demonstrate that the battery performance has a great potential to improve, as long as the thickness of the electrolyte chamber can be reduced.
4.2. Effect of NaOH Concentration
Figure 6 shows the discharge curves for voltage and power density at different NaOH concentrations. In this case, the thickness of the single electrolyte is 7 mm. It can be seen that, for NaOH concentrations of 1 mol/L, 2.5 mol/L, and 4 mol/L, the peak powers of the battery are 135 mW/cm2, 230 mW/cm2, and 315 mW/cm2, respectively. As the NaOH solution concentration increases, the battery power increases sequentially, and the battery open-circuit potential also increases. This is because, as the NaOH concentration increases, the number of conductive ions in the electrolyte increases, the internal resistance of the battery decreases, and the conductivity increases. In addition, the NaOH concentration also affects the equilibrium potential of the air cathode. Both the equilibrium potential of the oxygen reduction reaction and the ion activity of the electrolyte satisfy the Nernst equation:
It can be seen that the increase in αOH− will positively raise the equilibrium potential of the air electrode Eeq. The open-circuit voltage (OCV) of the entire circuit is defined as the difference between the electrode potential of the air cathode and the aluminum anode. Since the equilibrium potential of the aluminum anode is negative, the OCV will increase as the equilibrium potential of air cathode increases. In addition, the improvements in the voltage and power density curves weakened as the NaOH concentration exceeded 2.5 mol/L, as seen in Figure 6.
4.3. Effect of Partial Oxygen Pressure
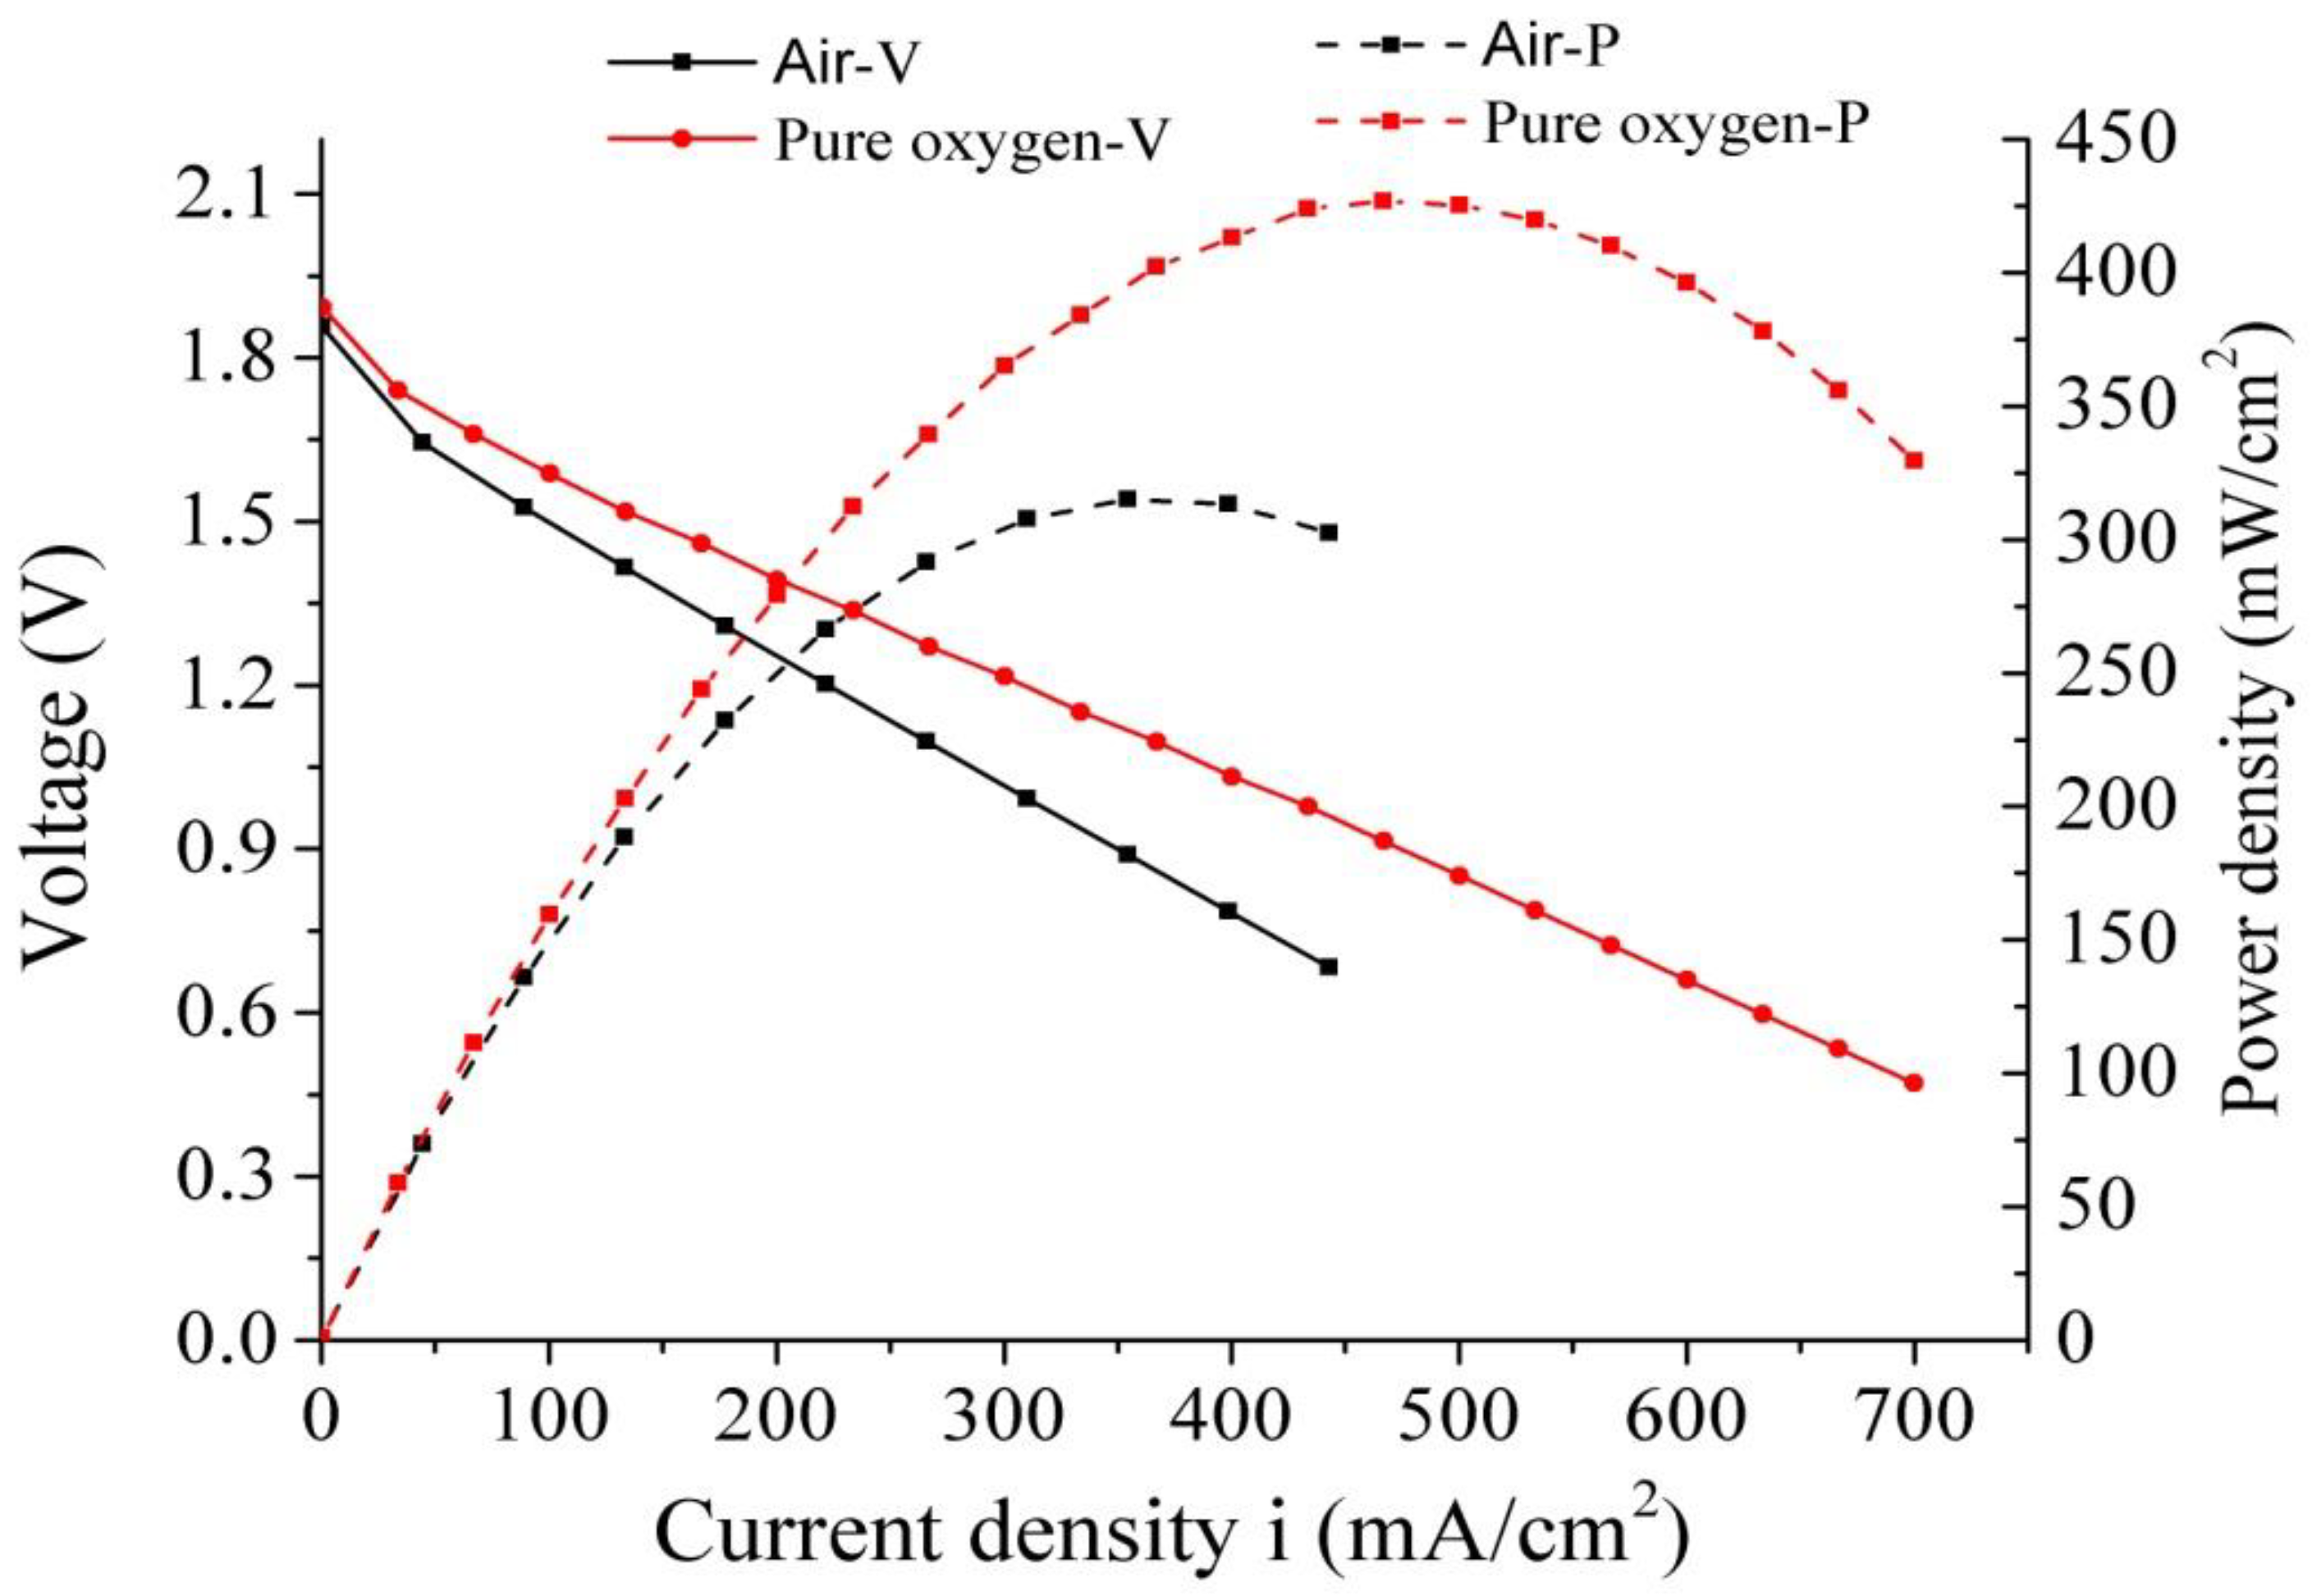
For the air electrode, the equilibrium potential of the oxygen reduction reaction and the partial pressure of the introduced oxygen satisfy the Nernst equation. It can be seen from Equation (17) that increasing the partial oxygen pressure in the air electrode can increase the electrode potential and reduce the battery polarization loss. To analyze the effect of different partial oxygen pressures on the battery performance, the discharge curves under pure oxygen and oxygen in air were simulated as seen in Figure 7. It can be seen that, when pure oxygen is supplied to the air electrode, the peak power of the battery is 426 mW/cm2 and the corresponding current density is 466 mA/cm2. This represents a significant improvement compared to air supply. The discharge power density curve shows that the discrepancy is small for small discharge current densities (<200 mA/cm2), while it increases continuously with increasing current density. This difference is attributed to the fact that the oxygen concentration becomes more important when the battery discharges at moderate and high current densities. The oxygen in air, on the other hand, is not sufficient for the reduction reaction in the air electrode.
4.4. Effect of the Specific Ratio of the Catalyst Layer
Figure 8 shows the discharge curves for voltage and power densities with different specific surface areas of the catalytic layers. The specific surface areas of the three different catalytic layers in the figure are referred to in [39,40,41], and the electrochemical parameters for the air cathode are appropriately adjusted. It can be derived from Equation (13) that, when current passes through the air electrode, the air polarization and reaction overpotential are reduced due to the increase in its specific surface area. Thus, the battery can produce a larger voltage. It can be seen from the figure that, as the specific area of the catalytic layer increases, the peak power of the aluminum-air battery and the open-circuit voltage also increase. This indicates a monotonous correlation. When the specific surface areas of the air electrode’s catalytic layer are 1 × 10⁴ 1/m, 2 × 10⁵ 1/m, 1 × 10⁶ 1/m, 6.8 × 10⁶ 1/m, the corresponding peak powers are 277 mW/cm2, 304 mW/cm2, 315 mW/cm2, 336 mW/cm2. It can be seen that the specific surface area of the catalytic layer has a certain effect on the battery performance, and this value should be increased as much as possible.
5. Conclusions
In the present work, a 2D numerical model was created to simulate the battery performance of an AAB cell with an alkaline electrolyte. The model was validated by comparing the predicted discharge curves for voltage and power density at different current densities with published experimental data. In addition, the effect of battery parameters on the battery performance was revealed using the single-factor simulation. By observing the changes in the discharge curves, the conclusions can be summarized.
The electrolyte thickness is the most important factor for the improvement of both power density and discharge current density. The power density peak can be increased by a factor of two if the electrolyte thickness was reduced from 7 mm to 3 mm, according to the simulation results. The alkaline concentration is also an important factor since the discharge voltage and power density were significantly enhanced as the NaOH concentration was increased from 1 to 4 mol/L. Oxygen pressure in the air electrode showed a secondary role for battery performance improvement. The discharge voltage showed a limited increase while the peak of power density can be increased by 35% under the pure oxygen in air electrode. The active specific surface area of the catalyst layer was also estimated, and a certain performance improvement was obtained when these parameters were increased. The simulation results in this work provide a theoretical foundation for further optimization of alkaline AAB systems in the future.
Author Contributions
J.X. and R.Z., conceptualization and prepared the first draft of the paper and J.X. and R.Z. editing the manuscript. J.Y. and R.Z. contributed to the supervision the study. J.X. and P.H. revised the paper. All authors have read and agreed to the published version of the manuscript.
Funding
This research was funded by the National Key R&D Program of China (No. 2017YFC0404203), the Aeronautical Science Fund (No. 201728R3001), the Key R&D Program of Jiangsu Province (No. BE2016163) and the Senior Talent Fund of Jiangsu University (Fund No. 5501440001).
Conflicts of Interest
The authors declare no conflict of interest.
References
- Larcher, D.; Tarascon, J.-M. Towards greener and more sustainable batteries for electrical energy storage. Nat. Chem. 2014, 7, 19–29. [Google Scholar] [CrossRef] [PubMed]
- Bandhauer, T.M.; Garimella, S.; Fuller, T.F. A Critical Review of Thermal Issues in Lithium-Ion Batteries. J. Electrochem. Soc. 2011, 158, R1. [Google Scholar] [CrossRef]
- Etacheri, V.; Marom, R.; Elazari, R.; Salitra, G.; Aurbach, D. Challenges in the development of advanced Li-ion batteries: A review. Energy Environ. Sci. 2011, 4, 3243–3262. [Google Scholar] [CrossRef]
- Gerssen-Gondelach, S.; Faaij, A.P. Performance of batteries for electric vehicles on short and longer term. J. Power Sources 2012, 212, 111–129. [Google Scholar] [CrossRef]
- Egan, D.; Ponce-De-Leon, C.; Wood, R.J.; Jones, R.; Stokes, K.; Walsh, F.C. Developments in electrode materials and electrolytes for aluminium–air batteries. J. Power Sources 2013, 236, 293–310. [Google Scholar] [CrossRef] [Green Version]
- Zaromb, S. The Use and Behavior of Aluminum Anodes in Alkaline Primary Batteries. J. Electrochem. Soc. 1962, 109, 1125. [Google Scholar] [CrossRef]
- Rota, M.; Comninellis, C.; Moller, S.; Holzer, F.; Haas, O. Bipolar Al/02 battery with planar electrodes in alkaline and acidic electrolytes. J. Appl. Electrochem. 1995, 25, 114–121. [Google Scholar] [CrossRef]
- Li, Q.; Bjerrum, N.J. Aluminum as anode for energy storage and conversion: A review. J. Power Sources 2002, 110, 1–10. [Google Scholar] [CrossRef]
- Macdonald, D.D.; English, C. Development of anodes for aluminium/air batteries—Solution phase inhibition of corrosion. J. Appl. Electrochem. 1990, 20, 405–417. [Google Scholar] [CrossRef]
- Chu, D.; Savinell, R.F. Experimental data on aluminum dissolution in KOH electrolytes. Electrochimica. Acta 1991, 36, 1631–1638. [Google Scholar] [CrossRef]
- Reboul, M.C.; Gimenez, P.; Rameau, J.J. A Proposed Activation Mechanism for Al Anodes. Corrosion 1984, 40, 366–371. [Google Scholar] [CrossRef]
- El Abedin, S.Z.; Saleh, A. Characterization of some aluminium alloys for application as anodes in alkaline batteries. J. Appl. Electrochem. 2004, 34, 331–335. [Google Scholar] [CrossRef]
- Ma, J.; Wen, J.; Li, Q.; Zhang, Q. Electrochemical polarization and corrosion behavior of Al–Zn–In based alloy in acidity and alkalinity solutions. Int. J. Hydrogen Energy 2013, 38, 14896–14902. [Google Scholar] [CrossRef]
- Jingling, M.A.; Ren, F.; Wang, G.; Xiong, Y.; Wen, J. Electrochemical performance of al-mg-sn-ga aluminum anode alloy. J. Chin. Soc. Corros. Prot. 2016, 36, 421–426. (In Chinese) [Google Scholar]
- Flamini, D.O.; Saidman, S. Polarisation behaviour of Al–Zn–Ga alloy in chloride medium. J. Appl. Electrochem. 2008, 38, 663–668. [Google Scholar] [CrossRef]
- Kharlamov, S.; Bobylev, A.V.; Galkin, P.S.; Dobroselsky, K.G.; Vlasenko, M.; Markovich, D.M. The influence of aluminum anode alloys and alkaline electrolyte composition on performance of aluminum-air cells for portable applications. J. Eng. Thermophys. 2015, 24, 313–321. [Google Scholar] [CrossRef]
- Kapali, V.; Iyer, S.V.; Balaramachandran, V.; Sarangapani, K.; Ganesan, M.; Kulandainathan, M.A.; Mideen, A.S. Studies on the best alkaline electrolyte for aluminium/air batteries. J. Power Sources 1992, 39, 263–269. [Google Scholar] [CrossRef]
- Wang, Q.; Miao, H.; Xue, Y.; Sun, S.; Li, S.; Liu, Z. Performances of an Al–0.15 Bi–0.15 Pb–0.035 Ga alloy as an anode for Al–air batteries in neutral and alkaline electrolytes. RSC Adv. 2017, 7, 25838–25847. [Google Scholar] [CrossRef] [Green Version]
- Moghadam, Z.; Shabani-Nooshabadi, M.; Behpour, M. Electrochemical performance of aluminium alloy in strong alkaline media by urea and thiourea as inhibitor for aluminium-air batteries. J. Mol. Liq. 2017, 242, 971–978. [Google Scholar] [CrossRef]
- Xiong, H.; Yu, K.; Yin, X.; Dai, Y.; Yan, Y.; Zhu, H. Effects of microstructure on the electrochemical discharge behavior of Mg-6wt%Al-1wt%Sn alloy as anode for Mg-air primary battery. J. Alloy. Compd. 2017, 708, 652–661. [Google Scholar] [CrossRef]
- Xiong, H.; Yin, X.; Yan, Y.; Dai, Y.; Fan, S.; Qiao, X.; Yu, K. Corrosion and Discharge Behaviors of Al-Mg-Sn-Ga-In in Different Solutions. J. Mater. Eng. Perform. 2016, 25, 3456–3464. [Google Scholar] [CrossRef]
- Ma, J.; Wen, J.; Gao, J.; Li, Q. Performance of Al−1Mg−1Zn−0.1Ga−0.1Sn as anode for Al-air battery. Electrochim. Acta 2014, 129, 69–75. [Google Scholar] [CrossRef]
- El Shayeb, H.A.; El Wahab, F.M.A.; El Abedin, S.Z. Electrochemical behaviour of Al, Al–Sn, Al–Zn and Al–Zn–Sn alloys in chloride solutions containing indium ions. J. Appl. Electrochem. 1999, 43, 655–669. [Google Scholar]
- El Shayeb, H.A.; El Wahab, F.M.A.; El Abedin, S.Z. Role of indium ions on the activation of aluminium. J. Appl. Electrochem. 1999, 29, 601–609. [Google Scholar] [CrossRef]
- Ilyukhina, A.; Kleymenov, B.; Zhuk, A. Development and study of aluminum-air electrochemical generator and its main components. J. Power Sources 2017, 342, 741–749. [Google Scholar] [CrossRef]
- Hopkins, B.J.; Shao-Horn, Y.; Hart, D.P. Suppressing corrosion in primary aluminum–air batteries via oil displacement. Science 2018, 362, 658–661. [Google Scholar] [CrossRef] [Green Version]
- Shah, A.; Watt-Smith, M.; Walsh, F.C. A dynamic performance model for redox-flow batteries involving soluble species. Electrochim. Acta 2008, 53, 8087–8100. [Google Scholar] [CrossRef] [Green Version]
- Newman, J.; Tiedemann, W. Porous-electrode theory with battery applications. AIChE J. 1975, 21, 25–41. [Google Scholar] [CrossRef] [Green Version]
- Bruggeman, D.A.G. Berechnung verschiedener physikalischer Konstanten von heterogenen Substanzen. I. Dielektrizitätskonstanten und Leitfähigkeiten der Mischkörper aus isotropen Substanzen. Ann. Phys. 1935, 416, 636–664. [Google Scholar] [CrossRef]
- Yeqing, L.; Shili, Z.; Shaona, W.; Hao, D.; Yi, Z. Structure and diffusivity of oxygen in concentrated alkali-metal hydroxide solutions: A molecular dynamics simulation study. Acta Phys. Chim. Sin. 2015, 31, 1045–1053. [Google Scholar] [CrossRef]
- Lyons, P.A.; Riley, J.F. Diffusion coefficients for aqueous solutions of calcium chloride and cesium chloride at 25°. J. Am. Chem. Soc. 1954, 76, 5216–5220. [Google Scholar] [CrossRef]
- Wang, C.-M.; Hsueh, K.-L.; Hsieh, C.-L.; Jalan, R. The Kinetic Reaction of Aluminum-Air Battery in Different Aqueous Solution. ECS Trans. 2013, 50, 29–35. [Google Scholar] [CrossRef]
- Sahapatsombut, U.; Cheng, H.; Scott, K. Modelling of electrolyte degradation and cycling behaviour in a lithium–air battery. J. Power Sources 2013, 243, 409–418. [Google Scholar] [CrossRef]
- Andrei, P.; Zheng, J.P.; Hendrickson, M.; Plichta, E.J. A physics-based drift-diffusion approach to model Li-air batteries with organic electrolyte. In Proceedings of the IEEE International Conference on Solid-state & Integrated Circuit Technology, Shanghai, China, 1 November 2010. [Google Scholar]
- Boxley, C.J.; White, H.S. Relationship Between Al[sub 2]O[sub 3] Film Dissolution Rate and the Pitting Potential of Aluminum in NaCl Solution. J. Electrochem. Soc. 2004, 151, B265. [Google Scholar] [CrossRef]
- Cao, Y.; Yang, H.; Ai, X.; Xiao, L. The mechanism of oxygen reduction on MnO2-catalyzed air cathode in alkaline solution. J. Electroanal. Chem. 2003, 557, 127–134. [Google Scholar] [CrossRef]
- Ilyukhina, A.V.; Zhuk, A.Z.; Kleymenov, B.V.; Ilyukhin, A.S.; Nagayama, M. The Influence of Temperature and Composition on the Operation of Al Anodes for Aluminum-Air Batteries. Fuel Cells 2016, 16, 384–394. [Google Scholar] [CrossRef]
- Wen, H.; Liu, Z.; Qiao, J.; Chen, R.; Zhao, R.; Wu, J.; Qiao, G.; Yang, J. High energy efficiency and high power density aluminum-air flow battery. Int. J. Energy Res. 2020. [Google Scholar] [CrossRef]
- Hua, X.L. Gas Field Modeling and Water Management of Proton Exchange Membrane Fuel Cell. Ph.D. Thesis, Wuhan University of Technology, Wuhan, China, 2005. [Google Scholar]
- Hu, G.L.; Liu, Y.J.; Fan, J.R.; Cen, K.F. Numerical simulation of transport phenomena in the proton exchange membrane fuel cell. J. Eng. Thermophys. 2004, 25, 828–830. [Google Scholar]
- Ubong, E.U.; Shi, Z.; Wang, X. Three-Dimensional Modeling and Experimental Study of a High Temperature PBI-Based PEM Fuel Cell. J. Electrochem. Soc. 2009, 156, B1276–B1282. [Google Scholar] [CrossRef] [Green Version]
Figure 1.
Schematic of the geometry for the numerical model.

Figure 2.
Voltage and power density versus current density of the simulation and experimental results.
Figure 2.
Voltage and power density versus current density of the simulation and experimental results.

Figure 3.
(a) Contour plot for the potential in the battery. (b) Distribution of the internal potential.
Figure 3.
(a) Contour plot for the potential in the battery. (b) Distribution of the internal potential.

Figure 4.
Distributions of (a) Na−, (b) OH− concentrations in the battery at a current density of 300 mA/cm2.
Figure 4.
Distributions of (a) Na−, (b) OH− concentrations in the battery at a current density of 300 mA/cm2.

Figure 5.
Voltage and power density versus current density for NaOH solutions with 3, 5, 7 mm thickness.
Figure 5.
Voltage and power density versus current density for NaOH solutions with 3, 5, 7 mm thickness.

Figure 6.
Voltage and power density versus current density for different concentrations of NaOH.

Figure 7.
Voltage and power density versus current density for different partial oxygen pressures.

Figure 8.
Voltage and power density versus current density for different specific ratios of the catalyst layer.
Figure 8.
Voltage and power density versus current density for different specific ratios of the catalyst layer.


Table 1.
Parameters used for the numerical model of the alkaline AAB.
| Physiological Meaning | Parameters | Values (Unit) |
|---|---|---|
| Thickness of aluminum anode | WA | 1 × 10⁻³ (m) [26] |
| Thickness of electrolyte | W | 7 × 10⁻³ (m) [26] |
| Thickness of membrane | WM | 2 × 10⁻⁵ (m) [26] |
| Thickness of catalyst layer | WP | 2 × 10⁻⁵ (m) |
| Height of the battery | h | 1.5 × 10⁻² (m) [26] |
| Diffusion coefficient of O2 in the alkaline solution | DO2 | 2.20 × 10⁻⁹ (m2/s) [30] |
| Diffusion coefficient of Na+ | DNa+ | 8.55 × 10⁻¹⁰ (m2/s) [30] |
| Diffusion coefficient of OH− | DOH− | 2.5 × 10⁻¹⁰ (m2/s) [30] |
| Diffusion coefficient of Al3+ | DAl3+ | 1.8 × 10⁻⁹ (m2/s) [31] |
| NaOH concentration | CNaOH | 1, 2.5, 4 (mol/L) |
| Exchange current density of aluminum anode | Ia0 | 2.29 × 10⁴ (A/m2) [32] |
| Anodic charge transfer coefficient of aluminum anode | αa | 0.024 [32] |
| Cathodic charge transfer coefficient of aluminum anode | ac | 0.015 [32] |
| Exchange current density of air electrode | Ic0 | 5 × 10⁻² (A/m2) [32] |
| Anodic charge transfer coefficient of air electrode with Pt catalyst | βa | 0.42 [32] |
| Cathodic charge transfer coefficient of air electrode with Pt catalyst | βc | 0.45 [32] |
| Specific surface area of cathode | a | 1 × 10⁶ (1/m) [33] |
| Operating temperature | T | 298 (K) [26] |
| Conductivity of aluminum | σA | 3.1 × 10⁷ (S/m) [26] |
| Conductivity of air electrode | σP | 9.825 (S/m) [34] |
| Positive electrode porosity | ε | 0.5 [34] |
| Reference of oxygen concentration | O2,ref | 1.23 (mol/L) |
| Reference of OH− concentration | COH−,ref | 4 (mol/L) [26] |
| External oxygen concentration | CO2,ext | 9.46 (mol/m3) [35] |
| Activity coefficient | γ | 0.78 [25] |
| Henry’s constant | H | 4.40 × 10⁶ (kPa) [25] |
| Anodic reaction order of air cathode | p | 0.5 [36] |
| Cathodic reaction order of air cathode | q | −1 [36] |
© 2020 by the authors. Licensee MDPI, Basel, Switzerland. This article is an open access article distributed under the terms and conditions of the Creative Commons Attribution (CC BY) license (http://creativecommons.org/licenses/by/4.0/).
Share and Cite
MDPI and ACS Style
Xie, J.; He, P.; Zhao, R.; Yang, J. Numerical Modeling and Analysis of the Performance of an Aluminum-Air Battery with Alkaline Electrolyte. Processes 2020, 8, 658. https://0-doi-org.brum.beds.ac.uk/10.3390/pr8060658
AMA Style
Xie J, He P, Zhao R, Yang J. Numerical Modeling and Analysis of the Performance of an Aluminum-Air Battery with Alkaline Electrolyte. Processes. 2020; 8(6):658. https://0-doi-org.brum.beds.ac.uk/10.3390/pr8060658
Chicago/Turabian StyleXie, Jiadong, Pan He, Ruijie Zhao, and Jianhong Yang. 2020. "Numerical Modeling and Analysis of the Performance of an Aluminum-Air Battery with Alkaline Electrolyte" Processes 8, no. 6: 658. https://0-doi-org.brum.beds.ac.uk/10.3390/pr8060658
Note that from the first issue of 2016, this journal uses article numbers instead of page numbers. See further details here.