Performance and Kinetics of Bioaugmentation, Biostimulation, and Natural Attenuation Processes for Bioremediation of Crude Oil-Contaminated Soils

Environmental Engineering, College of Engineering, Imam Abdulrahman Bin Faisal University, Dammam 34212, Saudi Arabia
Processes 2020, 8(8), 883; https://0-doi-org.brum.beds.ac.uk/10.3390/pr8080883
Submission received: 11 June 2020
/
Revised: 17 July 2020
/
Accepted: 21 July 2020
/
Published: 22 July 2020
(This article belongs to the Special Issue Study of Biodegradation and Bioremediation)
Abstract
:Bioremediation of contaminated sites is usually limited due to the inadequate availability of nutrients and microorganisms. This study was conducted to assess the impact of bioaugmentation (BA) and biostimulation (BS) on petroleum hydrocarbon degradation efficiency. In addition, treatment performance and kinetics of different remediation processes were investigated. For this purpose, four tanks containing oil-contaminated soils were tested. Tank 1 was operated as the natural attenuation process. Then, a microbial inoculum and nutrients were added to tank 2 to promote BA and BS. In tank 3, only the BA process was adopted, whereas in tank 4, only the BS process was adopted. After 63 days of operation, the total petroleum hydrocarbon (TPH) in tank 2 was reduced from 1674 to 430 mg/kg, with 74% reduction. Tank 1, tank 3, and tank 4 indicated TPH reductions of 35%, 41%, and 66%, respectively. Microbiological analysis of the inoculum indicated that Alcanivorax was the dominant bacterium. The population of TPH degrader bacteria in tank 2 soil was two orders of magnitude higher than in the control tank. Reaction rate data were fitted with a first-order reaction rate model. The Monod kinetic constants, maximum specific growth rate (µmax), and substrate concentration at half-velocity constant (Ks) were also estimated. This study showed that the TPH removal efficiency in the combined BA and BS process was higher than in other processes tested. The populations of TPH degrading microorganisms in soil tanks were positively related to TPH removal efficiency during bioremediation of petroleum-contaminated soils.

1. Introduction
Petroleum contamination in subsurface environments has become a serious global environmental hazard. Some of the main sources of this contamination are crude oil, refineries, and underground storage tanks (UST). Additionally, some of the chemicals in fossil fuels tend to remain in the environment for a long period of time. These persistent contaminants have several health risks to humans, animals, and other living organisms. When hydrocarbon-containing contaminants spill on land, degradation by indigenous microorganisms progresses slowly due to inadequate nutrients and microorganism populations [1]. Bioremediation is recognized as a cost-effective treatment technology for oil-contaminated soils [2]. For instance, bioaugmentation (BA) and biostimulation (BS) are the two main bioremediation technologies commonly used for soil clean-up [3,4,5,6,7,8]. Bioaugmentation works by introduction of exogenous microbial population to the contaminated environment [9,10,11]. Contaminated soils are inoculated with specially cultivated microorganisms with capabilities for the degradation of certain contaminants. The term biostimulation is used to describe the addition of essential electron acceptors such as nutrients to enhance the microbial growth [12,13,14]. On the other hand, natural attenuation (NA) can include chemical reactions, volatilization, adsorption, and biodegradation. Microorganisms responsible for degrading petroleum products are defined as either eukaryotic or prokaryotic organisms [15]. Several research studies have been conducted on the treatment of hydrocarbons by various microorganisms [3,4,5,6,16,17,18]. Some of the microorganisms that are effective on the biodegradation of petroleum hydrocarbons are the microorganisms from genera Pseudomonas, Acinetobacter, Flavobacterium, Achromobacter, Rhodococcus, Mycobacterium, Bacillus, Alcaligenes, Aspergillus, Mucor, Penicillium, and Candida [3,16,18].
This study was conducted to find a quick solution to soil contamination due to the leakages of crude oil from transmission pipelines, oil refineries, and underground storage tanks (USTs). Even a small crack on a UST or a pipe along the oil transmission pipelines causes leakages to natural soil and nearby surface waters. It is very common that several incidences of oil leakages occur every year. When these incidences occur, a remediation team reacts to the incident very fast before it spreads, and recovers the contaminated soil and treats them ex situ before final disposal. Generally, these contaminated soils are either incinerated or landfilled at hazardous waste landfills. However, the bioremediation and recovery of these contaminated soils should be preferred to prevent the loss of fertile soils. Therefore, rapid ex situ or in situ disposal of these soils is very crucial. This can be achieved by coupling different technologies. In this study, addition of a microbial inoculum (bioaugmentation) along with nitrogen, phosphorous, and potassium (NPK) nutrients (biostimulation) were performed in simulated soil tanks to treat the contaminated soil. The overall aims of this study were (1) to assess the efficiency of bioaugmentation with TPH-degrading bacteria Alcanivorax and biostimulation with addition of nutrients nitrogen and phosphorus, for TPH degradation and (2) to investigate the relationship between TPH degradation efficiency and microbial community in petroleum-contaminated soil. The specific objectives of this study were (1) to investigate the crude oil biodegradation efficiency in a freshly contaminated soil by combined bioaugmentation and biostimulation processes, bioaugmentation process alone, biostimulation process alone, and by natural attenuation; (2) to investigate the treatment time needed for each process; (3) to determine the changes in the number of hydrocarbon degraders for each process during the treatment; and (4) to determine the kinetic parameters for the treatment processes.
2. Materials and Methods
For each treatment process (BA+BS, BA, BS, and NA), experimental analysis included 3 replicates and were repeated 3 times.
2.1. Soil Sampling
A clean soil sample was obtained from a site where there was no previous history of contamination. Before loading the tanks, the soil sample was grinded and large particles were removed. Then, it was air-dried at room temperature for 48 h. The volume of clean soil sample for each process, tank 1 (NA), tank 2 (BA+BS), tank 3 (BA), and tank 4 (BS), was 0.4 m3.
2.2. Configuration of the Tanks
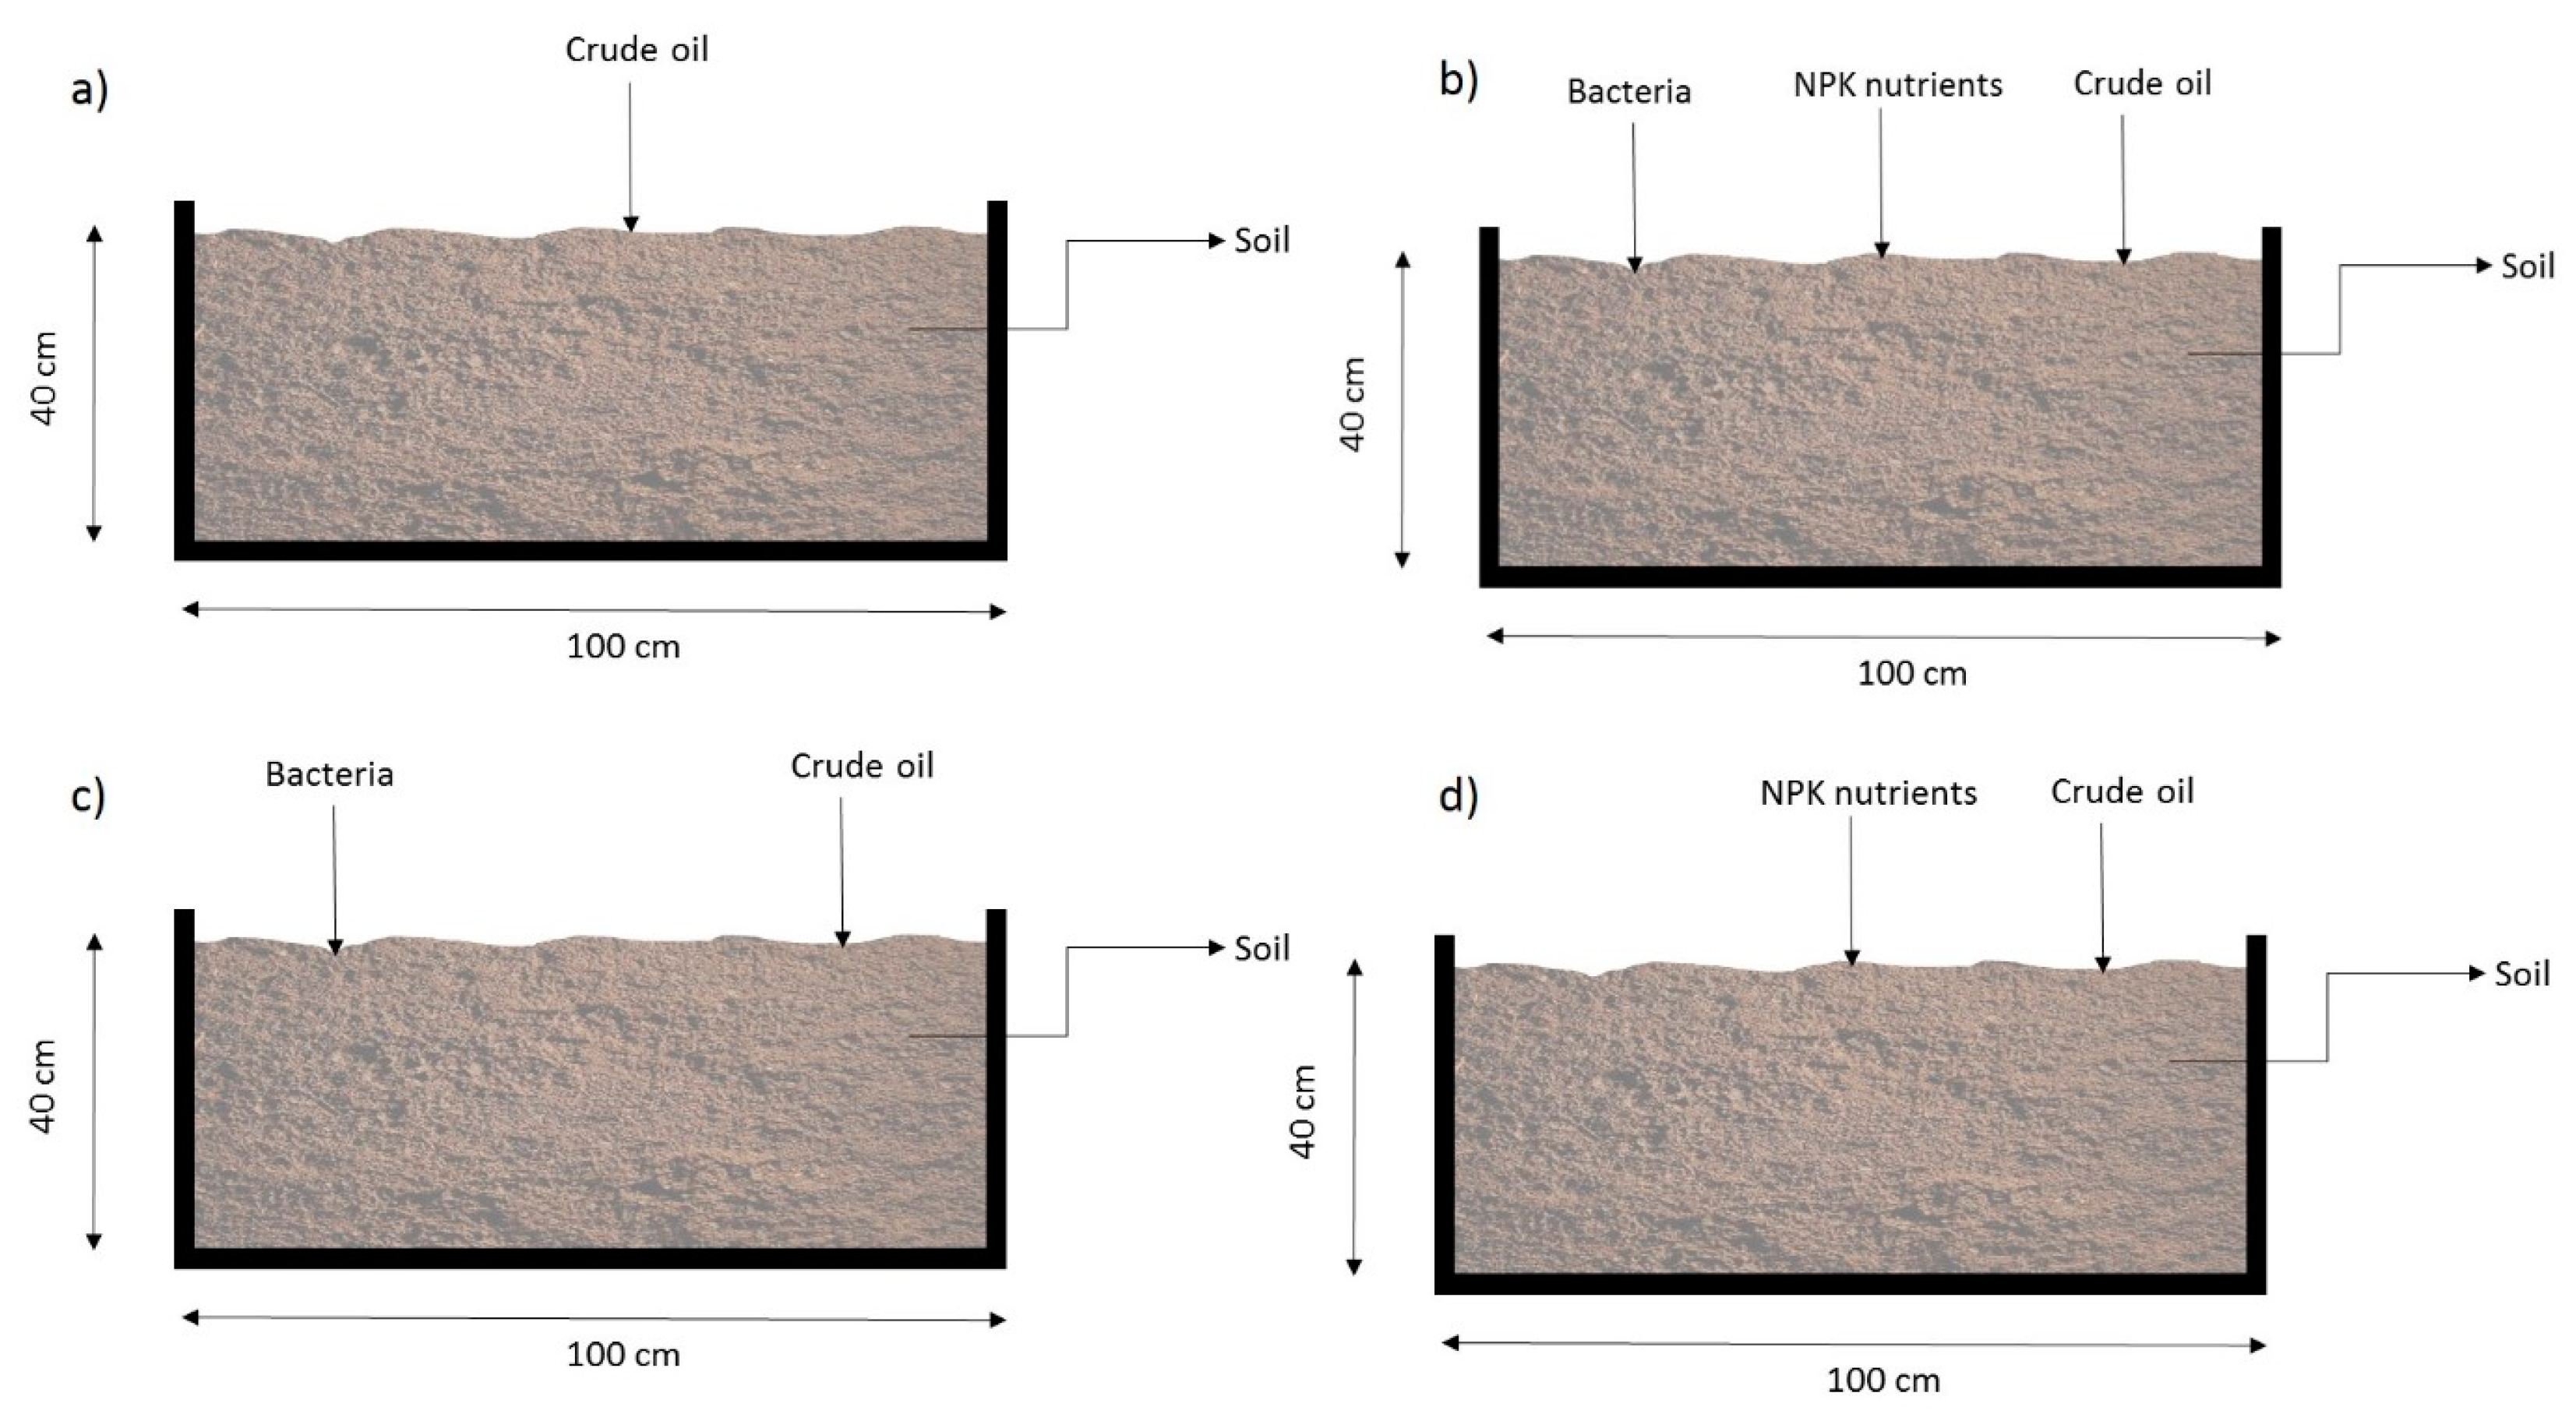
Simulated bioremediation tanks were designed and constructed for the remediation of soil by natural attenuation, bioaugmentation + biostimulation, bioaugmentation, and biostimulation (Table 1). Tanks were made of high-density polyethylene (HDPE). TPH was degraded in tank 1 under natural attenuation condition (control tank). On the other hand, TPH in tanks 2, 3, and 4 was degraded under the conditions of bioaugmentation and biostimulation (microbial inoculum and nutrients addition), bioaugmentation (microbial inoculum addition only), and biostimulation (nutrient addition only), respectively. The schematics of the pilot-scale bioremediation tanks were depicted in Figure 1. The dimensions of the tanks were 100 cm × 100 cm × 40 cm, with a volume of 0.4 m3.
2.3. Loading of the Tanks
Clean soil samples were placed in the tanks and mixed thoroughly by a shovel for homogenization. Afterwards, the soil samples were contaminated by adding 1 L of crude oil to each tank. Clean tap water was added to the tanks to sustain minimum of 20% water content. Then, the soil samples in all tanks were mixed again for homogenization.
2.4. Natural Attenuation (Tank 1)
Tank 1 was operated as a natural attenuation process for comparison with other tanks; therefore, no nutrients or microbial inoculum was added. However, 1 L of crude oil was added to tank 1 to contaminate the soil. Natural attenuation treatment is defined as a natural process where no specific remediation technology is used for the contaminated soil.
2.5. Bioaugmentation + Biostimulation (Tank 2)
Analysis of the contaminated soil indicated a C:N:P ratio of 10,000:0.0107.0:0.0027, which was very high as the soil contained low N and P concentrations. The amount of nutrient addition to tank 2 was calculated by using the C:N:P ratio, which was determined by calculating the mass concentration of the crude oil added. Alexander [19] suggested that a C:N:P ratio of 100:10:2 is optimal for the remediation of soil contaminated by petroleum hydrocarbon. Zhang, Cheng [20] and Alavi, Mesdaghinia [21] reported that a C:N:P ratio of 100:5:1 is also considered optimal. In this study, the C:N:P ratio of 100:5:1 was used as a reference value. This C:N:P ratio was reached by adding appropriate amounts of NH4Cl and KH2PO4 to tank 2. Since 1 L of crude oil was added to each tank, 50 g of N was added to satisfy the C:N ratio of 100:5. Since the fertilizer nutrient contains 20% N, 250 g of NH4Cl was added to reach the 50 g of N. Therefore, the initial N addition was 50 g, or 250 g of N NH4Cl that contains 50 g of N. Based on the C:N:P ratio of 100:5:1, 10 g of P was needed, which is equal to 100 g of KH2PO4 (%10 of K). The density of the soil used in the tanks was 1200 kg.m−3, which is equal to 480 kg of soil in each tank.
In bioremediation processes, microorganisms convert organic compounds such as crude oil into non-toxic substances such as CO2 and H2O. Any given bacteria can occur naturally and require essential nutrients. In most cases, naturally occurring microorganisms (indigenous microorganisms) are not in sufficient numbers for complete degradation. Thus, there exists an opportunity to enhance and accelerate the natural degradation by the introduction of additional microorganisms and nutrients. When mixed with water and applied as a slurry to contaminated soil, microorganisms break down the molecular structures of the targeted hydrocarbons by utilizing their mass as a source of energy. Because of the high degree of interface between bacteria and the hydrocarbon, the rate of degradation tends to be quite rapid at first, but gradually diminishes as the more biodegradable hydrocarbon is consumed.
The microbial inoculum used in this study was manufactured as a combination of naturally occurring species. Microbiological analysis of the inoculum indicated that Alcanivorax was the dominant bacterium. The bacteria/enzyme mixture used in this study is a combination of naturally occurring species and was manufactured in the U.S. The product contains dried mixed natural bacteria and enzymes combined in a mixture with micro-nutrients. Only naturally occurring, non-genetically modified microorganisms were included in the product. In the making of the product, further efforts were made to identify both the strains of microorganisms and the energy sources. The product is in the form of a free-flowing powder and is activated by the introduction of water. Based on the amounts of crude oil and fertilizers added, 50 g of microbial inoculum was added to 10 L of clean tap water and stirred to solubilize the product. This amount was determined according to the specifications provided by the manufacturer. The slurry then sat for 30 min to make sure that the microorganisms in the product were activated. Then, the slurry was sprayed over the surface of the soil in tank 2, while mixing the soil to make sure that the product was mixed homogenously with the soil.
2.6. Bioaugmentation (Tank 3)
Tank 3 (BA) was operated to measure the effects of bioaugmentation process on TPH removal rates and the number of TPH degrader bacteria, and then compared the results with tank 2 (BA+BS), tank 4 (BS), and tank 1 (NA). The amount of microbial inoculum addition to tank 3 was calculated exactly the same as it was calculated for tank 2. Nutrient addition was not carried out in tank 3, thus, only microbial inoculum addition was evaluated.
2.7. Biostimulation (Tank 4)
Tank 4 (BS) was operated to measure the effects of biostimulation process on TPH removal rates and the number of TPH degrader bacteria in the tanks, and then compared the results with other tanks. The amount of nutrient addition to tank 4 was calculated exactly the same as it was calculated for tank 2. Microbial inoculum addition was not carried out in tank 4.
2.8. Oxygen Supply and Moisture Content
Aeration through mixing the contaminated soil serves as a highly effective catalyst to speed up the degradation process. The product of microbial inoculum contains facultative strains; thus, they use either dissolved or chemically combined oxygen. Surely, they operate more effectively with dissolved oxygen because they can obtain more oxygen from it. Straight chained hydrocarbon molecules are broken down faster than those cross-linked and branched chained molecules. However, it takes longer to be broken down for many of the cyclic compounds. Therefore, aeration was done in tank 2, tank 3, and tank 4 by daily mixing to provide adequate oxygen to the system. Tank 1 was not aerated since it was used as a control.
All bacteria, either commercially produced or indigenous, need an aqueous environment for growth. For this reason, optimum moisture content must be maintained during the treatment program. Desired moisture content in all tanks was accomplished by wetting of the soils with clean tap water. By doing this, soil moisture content of at least 25% was maintained. Simultaneous mixing was performed during wetting of the soil to make sure that the water was mixed homogenously with the contaminated soil.
2.9. Soil Analyses
2.9.1. TPH Analysis
TPH was measured based on the carbon number of between C10 and C40 (diesel and oil range). Samples were collected from the tanks at the start of experiments, and every week further on for 63 days. The United States Environmental Protection Agency (USEPA) [22] sampling method 5035A was used to reduce the amount of disturbance during collecting of soil samples. Due to their chemical structure, petroleum compounds are vulnerable to sampling, transport, and analysis. The EPA method 5035A reduces the volatilization by using a sealed sample vial. Extraction of the samples was performed according to the EPA 3820 method [23]. About 10 g of wet soil sample was mixed with a reagent in a centrifuge tube. Then, it was capped and shaken vigorously for 1 min. The sample was then centrifuged, and the supernatant water was placed into a volumetric flask for TPH analysis. Then, TPH was measured according to the US EPA 8015B method [24]. One of the methods for hydrocarbon measurement is gas chromatography (GC), thus, it was used in this study. Then, 15 g of sample were extracted with acetone and a retention time window standard solution. Sample extracts were centrifuged to remove fine particles. The clear extracts were washed twice with 100 mL of water. The organic layer was collected and dried with sodium sulfate. An Agilent Intuvo 9000 Series Gas Chromatograph was used for the quantitative analysis of total petroleum hydrocarbon contamination in soil samples.
2.9.2. pH Analysis
For pH analysis, EPA’s 9045D method was used [25]. In this test, 20 g of soil sample was weighed in a beaker and 20 mL of distilled water was added. Then, the solution was mixed with a glass rod for 5 min and the beaker was left undisturbed for 1 h to allow suspended particles to settle. The liquid phase at the top of the beaker was separated with a pipette and transferred to 50 mL centrifuge tubes. These tubes were centrifuged at 9000 rpm for 10 min to separate the supernatant fraction from the solution. The supernatant fraction was collected in 100 mL beakers and the pH was measured with a previously calibrated pH meter.
2.9.3. Moisture Content
Collected samples were placed in an oven at 105 °C for 1 night. After removing the samples, they were left until their temperature had reached room temperature and then were weighed immediately. The samples were placed in the oven again for a few hours and weighed again until there was no difference between the measured weights of the samples [26,27].
2.9.4. Organic Matter
Organic matter in soil affects the water retaining ability, biological activity, and water/air infiltration rates. ASTM D 2974–standard test methods for organic matter of organic soils [28] was used to measure the organic content of the soil samples. A porcelain dish containing the soil sample was placed in a furnace, temperature of the furnace was increased to 440 °C, and the sample was left in the furnace overnight. Then, the organic fraction of the soil was determined by subtracting the mass of the burned soil (ash) from the mass of dry soil [29].
2.9.5. Organic Carbon
The quantity of organic carbon was determined by treating dried soil samples with phosphoric acid. Organic carbon was determined in the soil samples dried at 105 °C using a carbon analyzer. Prepared soil samples were combusted at 1350 °C in an oxygen atmosphere and carbon was oxidized to form CO2 [30].
2.9.6. Nutrients
Total nitrogen for the soil samples was determined according to the EN 13654 method [31]. This method is called wet acidic digestion (H2SO4) of nitrogen-containing soil samples. There are three steps involved in this method; digestion, distillation, and titration. The wet acidic digestion takes place in a digestion flask, causing transformation of nitrogen to NH4+ ions. In the distillation step, excess base was added to the acid digestion mixture to transform NH4+ to NH3. By titration, the amount of NH3 in the receiving solution was quantified. The total nitrogen in the sample was then determined from the quantified amount of ammonia ions in the solution. Total phosphorous in soil samples was determined by digesting with perchloric acid and then measuring by colorimetry [32]. The quantity of potassium in soil samples was determined according to the flame atomic emission spectrometry method [33].
2.10. Microbial Analysis
Collected soil samples from the tanks underwent microbiological analysis before and after the study. A fraction of soil sample (1 g) was placed in a bottle for microbial analysis. In this test, 1 g of soil was added to 10 mL of distilled water and vortexed, then sequentially diluted. The microbial density of bacteria was determined as explained by Nakasaki and Hirai [34]. Amphotericin B solution at a concentration of 100 μL/L was added to modified Luria- Bertani (LB) agar medium and incubated for 3 days to measure the growth of bacteria. Optimum growth temperature was seen at 30 to 35 °C. Cell morphology was studied under an Olympus U-pot microscope, using overnight culture of the strain grown on LB agar for gram staining. Colony forming unit (CFU) was determined by using the formula; CFU/g = (number of colonies × dilution factor)/volume of culture plate.
2.11. Kinetic Model
A mass balance in the experimental tanks was used to find a kinetic model for degradation of total petroleum hydrocarbon. The kinetic model can be defined as shown in Equation (1) [35]:
where;
- r: reaction rate,
- k: biodegradation rate,
- C: concentration,
- t: time,
- n: reaction order.
The constants, k and n, are found by plotting concentration vs. time and determining the best suitable line. The half time (t1/2) can be calculated as follows (Equation (2)) [36,37]:
Moreover, the growth of microorganisms can be determined by using the Monod equation as shown in Equation (3):
where;
- µ: specific growth rate,
- µmax: maximum specific growth rate,
- Ks: TPH value at half-time.
Then, r is shown as follows (Equation (4)):
where X shows the microorganism concentrations and Y is yield that is expressed as biomass formed per mass of substrate used.
The rate of reaction determined numerically was used to obtain µmax and Ks as defined in Equation (5):
3. Results
This section summarizes the experimental results, their interpretation, and the discussions that can be drawn.
3.1. Changes in Soil TPH Concentrations
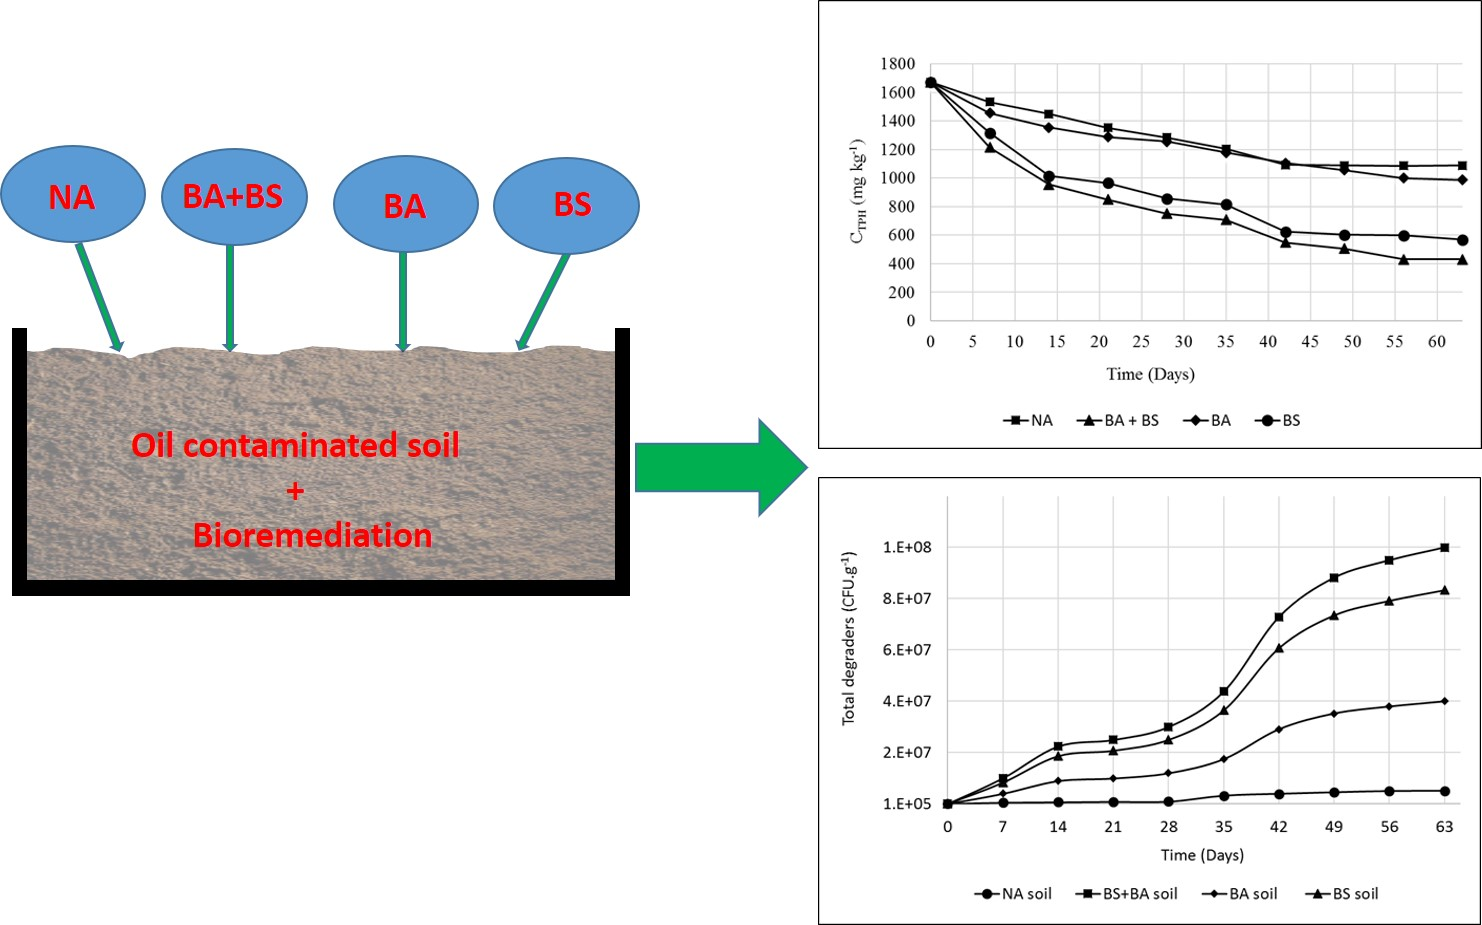
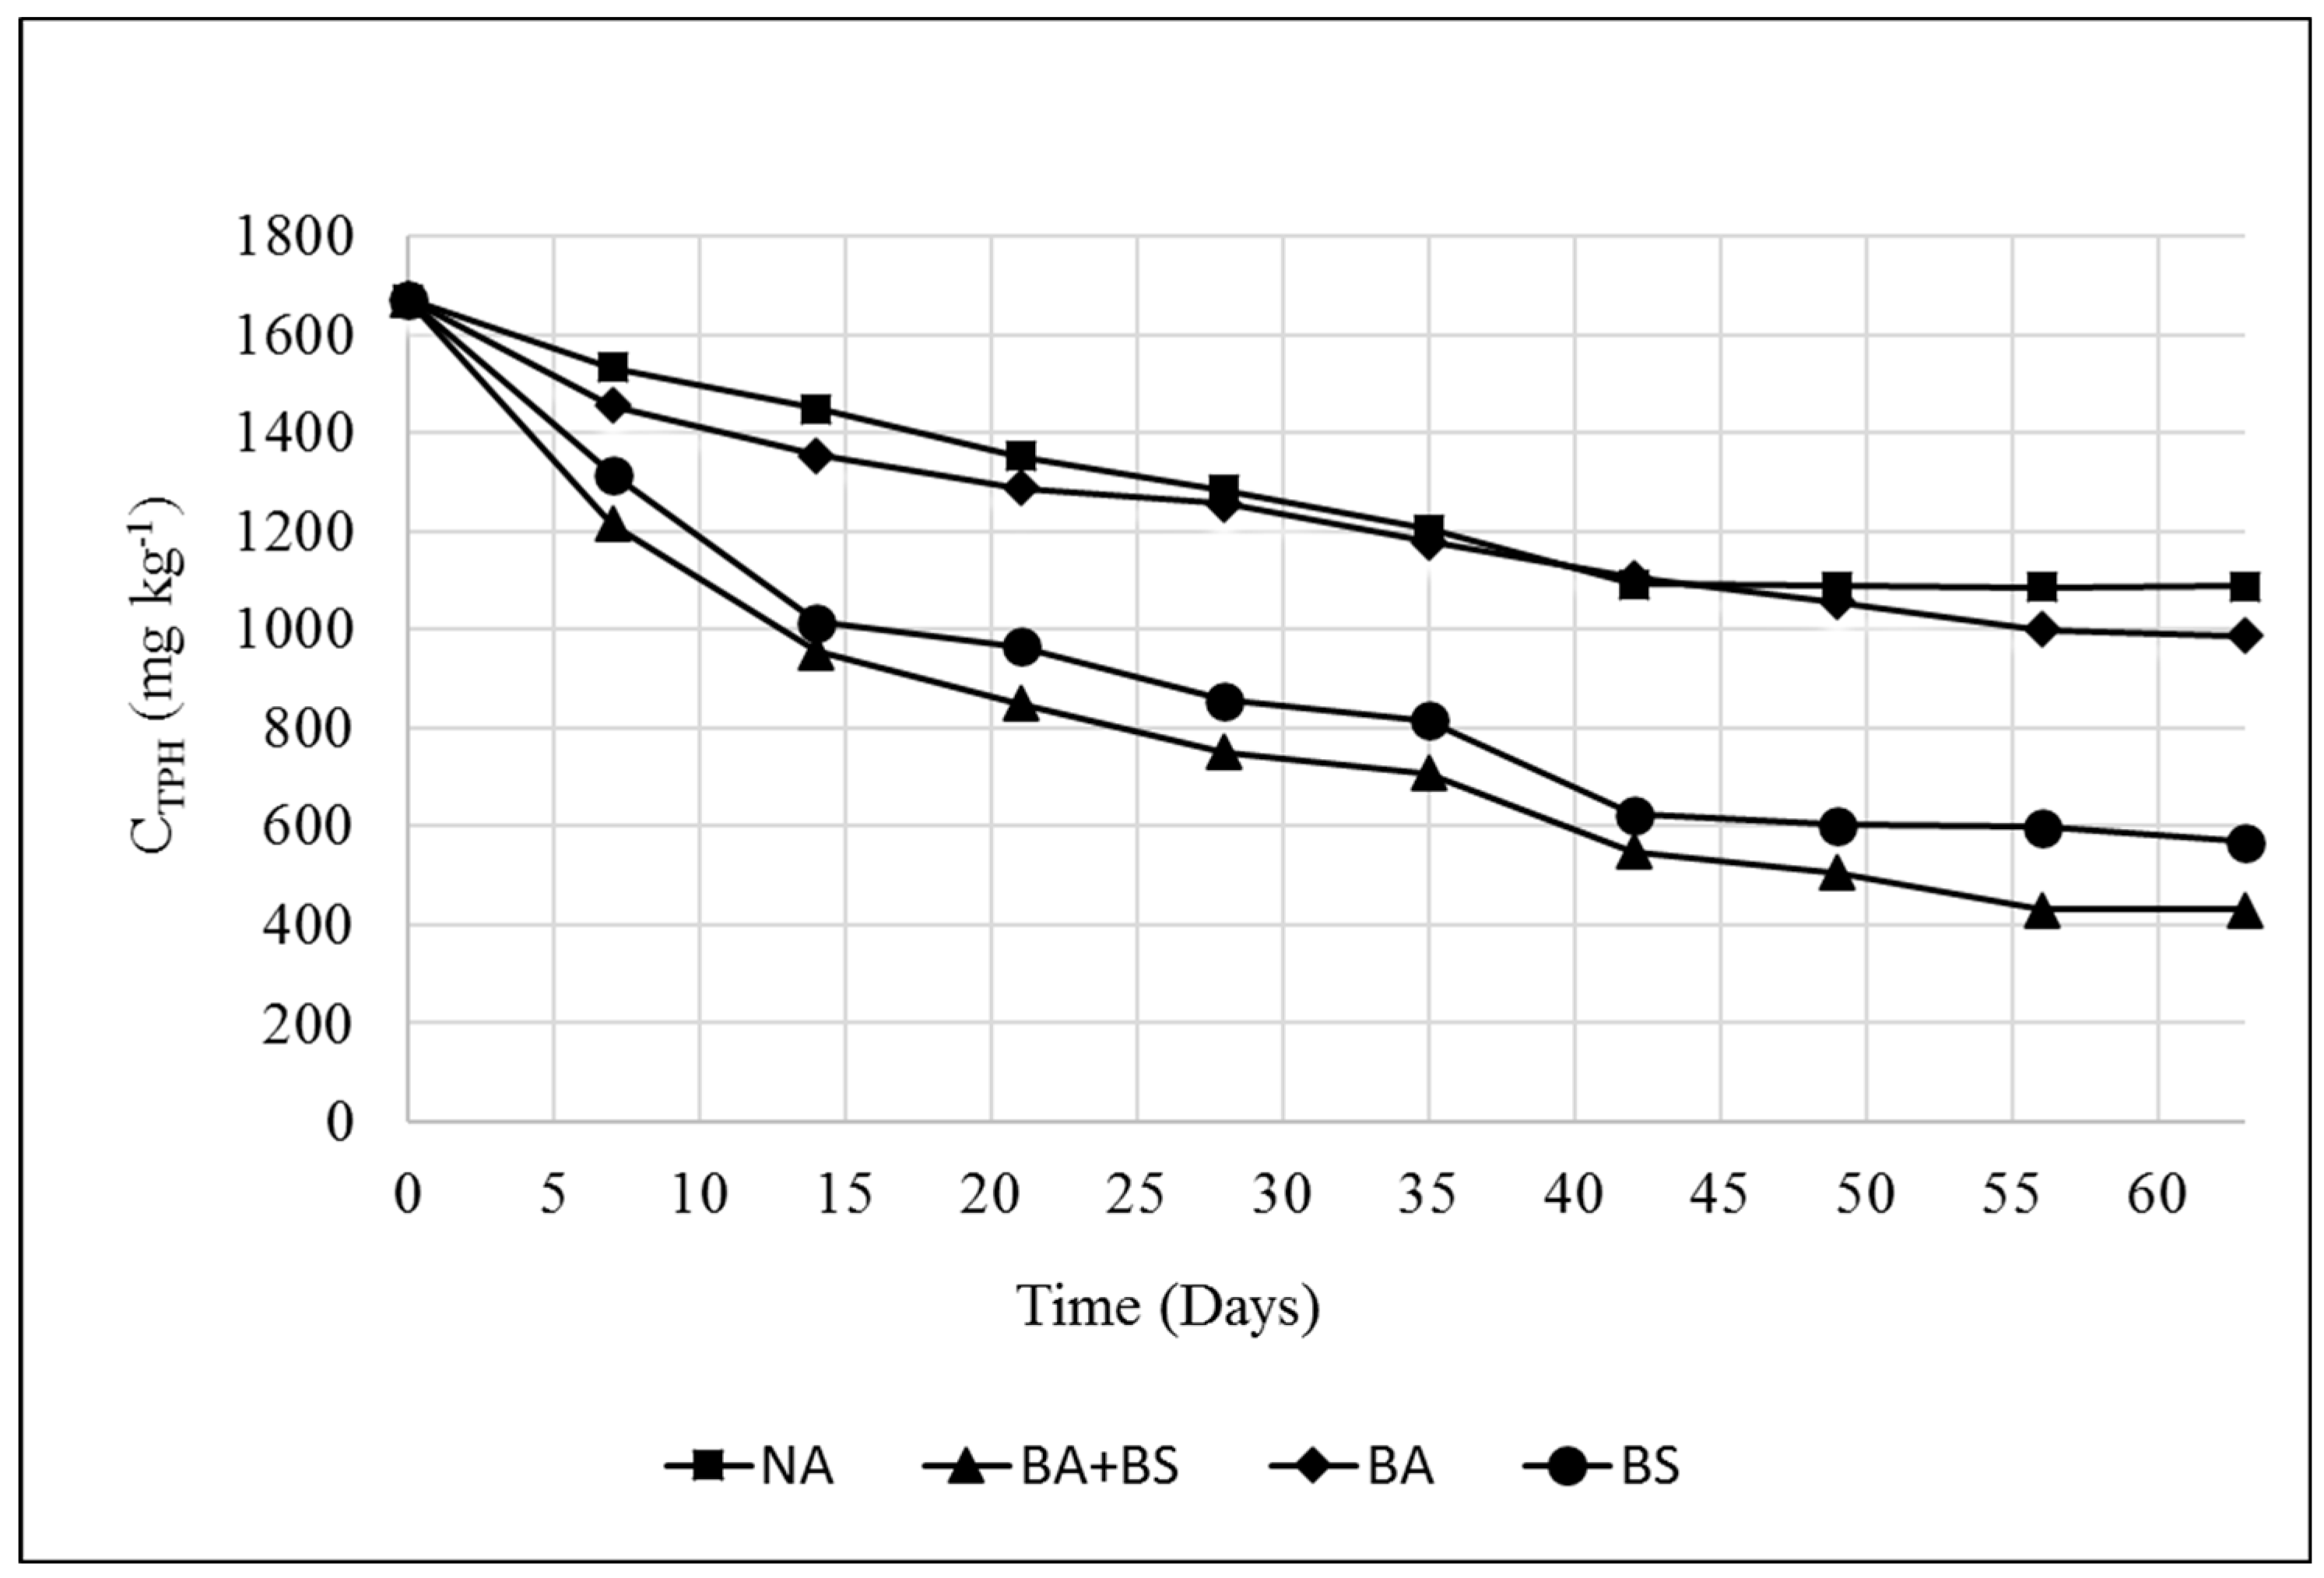
Table 2 shows the chemical characteristics of oil-contaminated soil used in the study. Figure 2 shows the concentrations of TPH for tank 1, tank 2, tank 3, and tank 4 before and after the treatment. TPH concentration in the initial soil for all tanks were 1674 ± 9.25 mg.kg−1. After 63 days of treatment, TPH concentrations were decreased from 1674 ± 9.25 mg.kg−1 to 1088 ± 5.22 mg.kg−1 by the natural attenuation treatment (tank 1), which represents a 35% removal efficiency. TPH was reduced to 430 ± 2.16 mg.kg−1 in the biostimulation and bioaugmentation treatment (tank 2), which represents a TPH removal efficiency of 74%. The other 2 reactors, tank 3 (BA) and tank 4 (BS), resulted in TPH removal rates of 41% and 66%, respectively. Compared to NA treatment in tank 1 (control), the highest removal rate for TPH was achieved with BA+BS treatment in tank 2 (74%), followed by BS treatment in tank 4 (66%). BA treatment alone was not as effective as BS treatment. The efficiency of biodegradation was the highest when the BS and BA processes were combined. Initial nutrient levels in the contaminated soil were not sufficient based on the selected C:N:P ratio of 100:5:1. This indicated that addition of nutrients to the contaminated soil would be beneficial. Biodegradation in each tank was not hampered by carbon content, pH, or moisture levels [38,39,40]. Microbial analysis showed that an active microbial population of 1 × 10⁵ (1.0E+05) CFU.g−1 was initially present in the soils prior to treatment. Therefore, bioaugmentation did not accelerate the rate of biodegradation over biostimulation.
3.2. Microbial Analysis
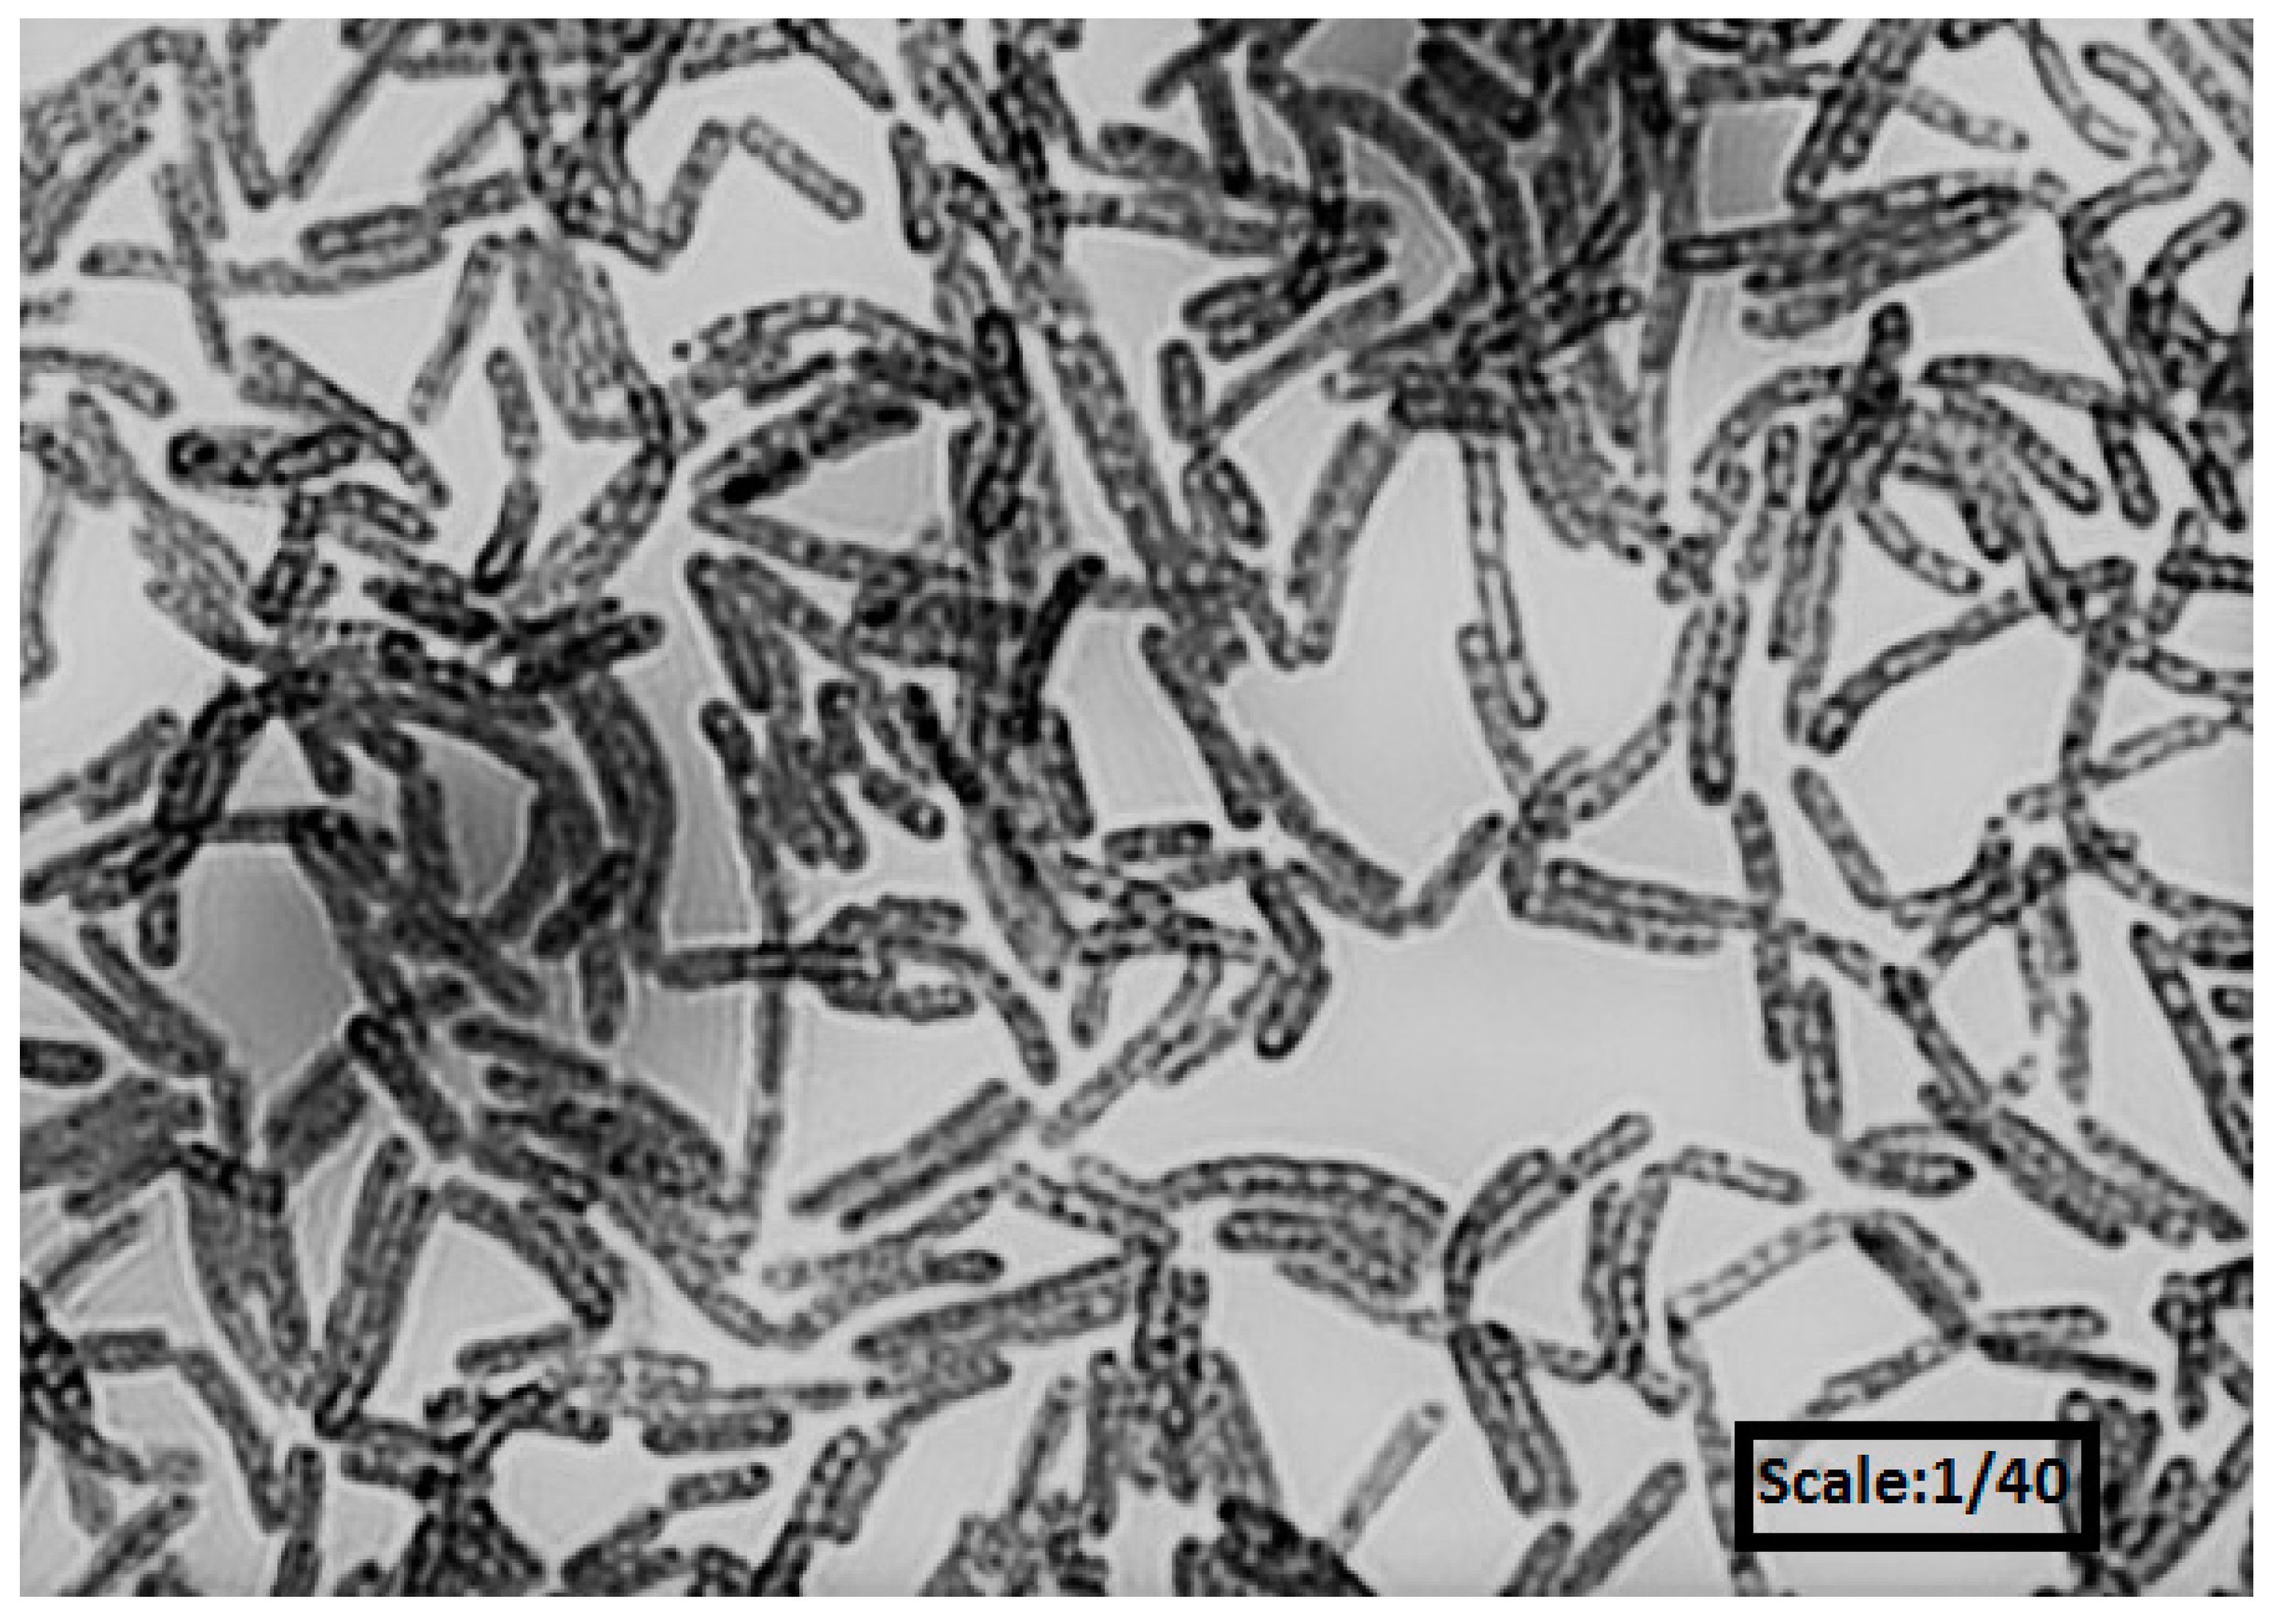
The total number of bacteria (microbial inoculum) added to bioaugmentation and biostimulation tank (tank 2) and bioaugmentation tank (tank 3) was determined. The colonies were counted and defined as the total colony forming units (CFU) g−1 dry powder product (microbial inoculum) [41]. As a result of microbial analysis, a bacterium belonging to genus, Alcanivorax, and a sub class of Proteobacteria was isolated from the sample, with a cell frequency unit (CFU) of 3 × 10⁷ (3.E+07) per gram of microbial inoculum sample (Figure 3). The strain was found to possess a cell-bound granule of glycolipids. Cells appeared to be granular, non-spore-forming, and Gram-negative rods. Colonies were small, non-pigmented, and slightly raised in the center. Optimum growth temperature was observed at 30 to 35 °C. The optimum NaCl required for growth was 4–7% NaCl.
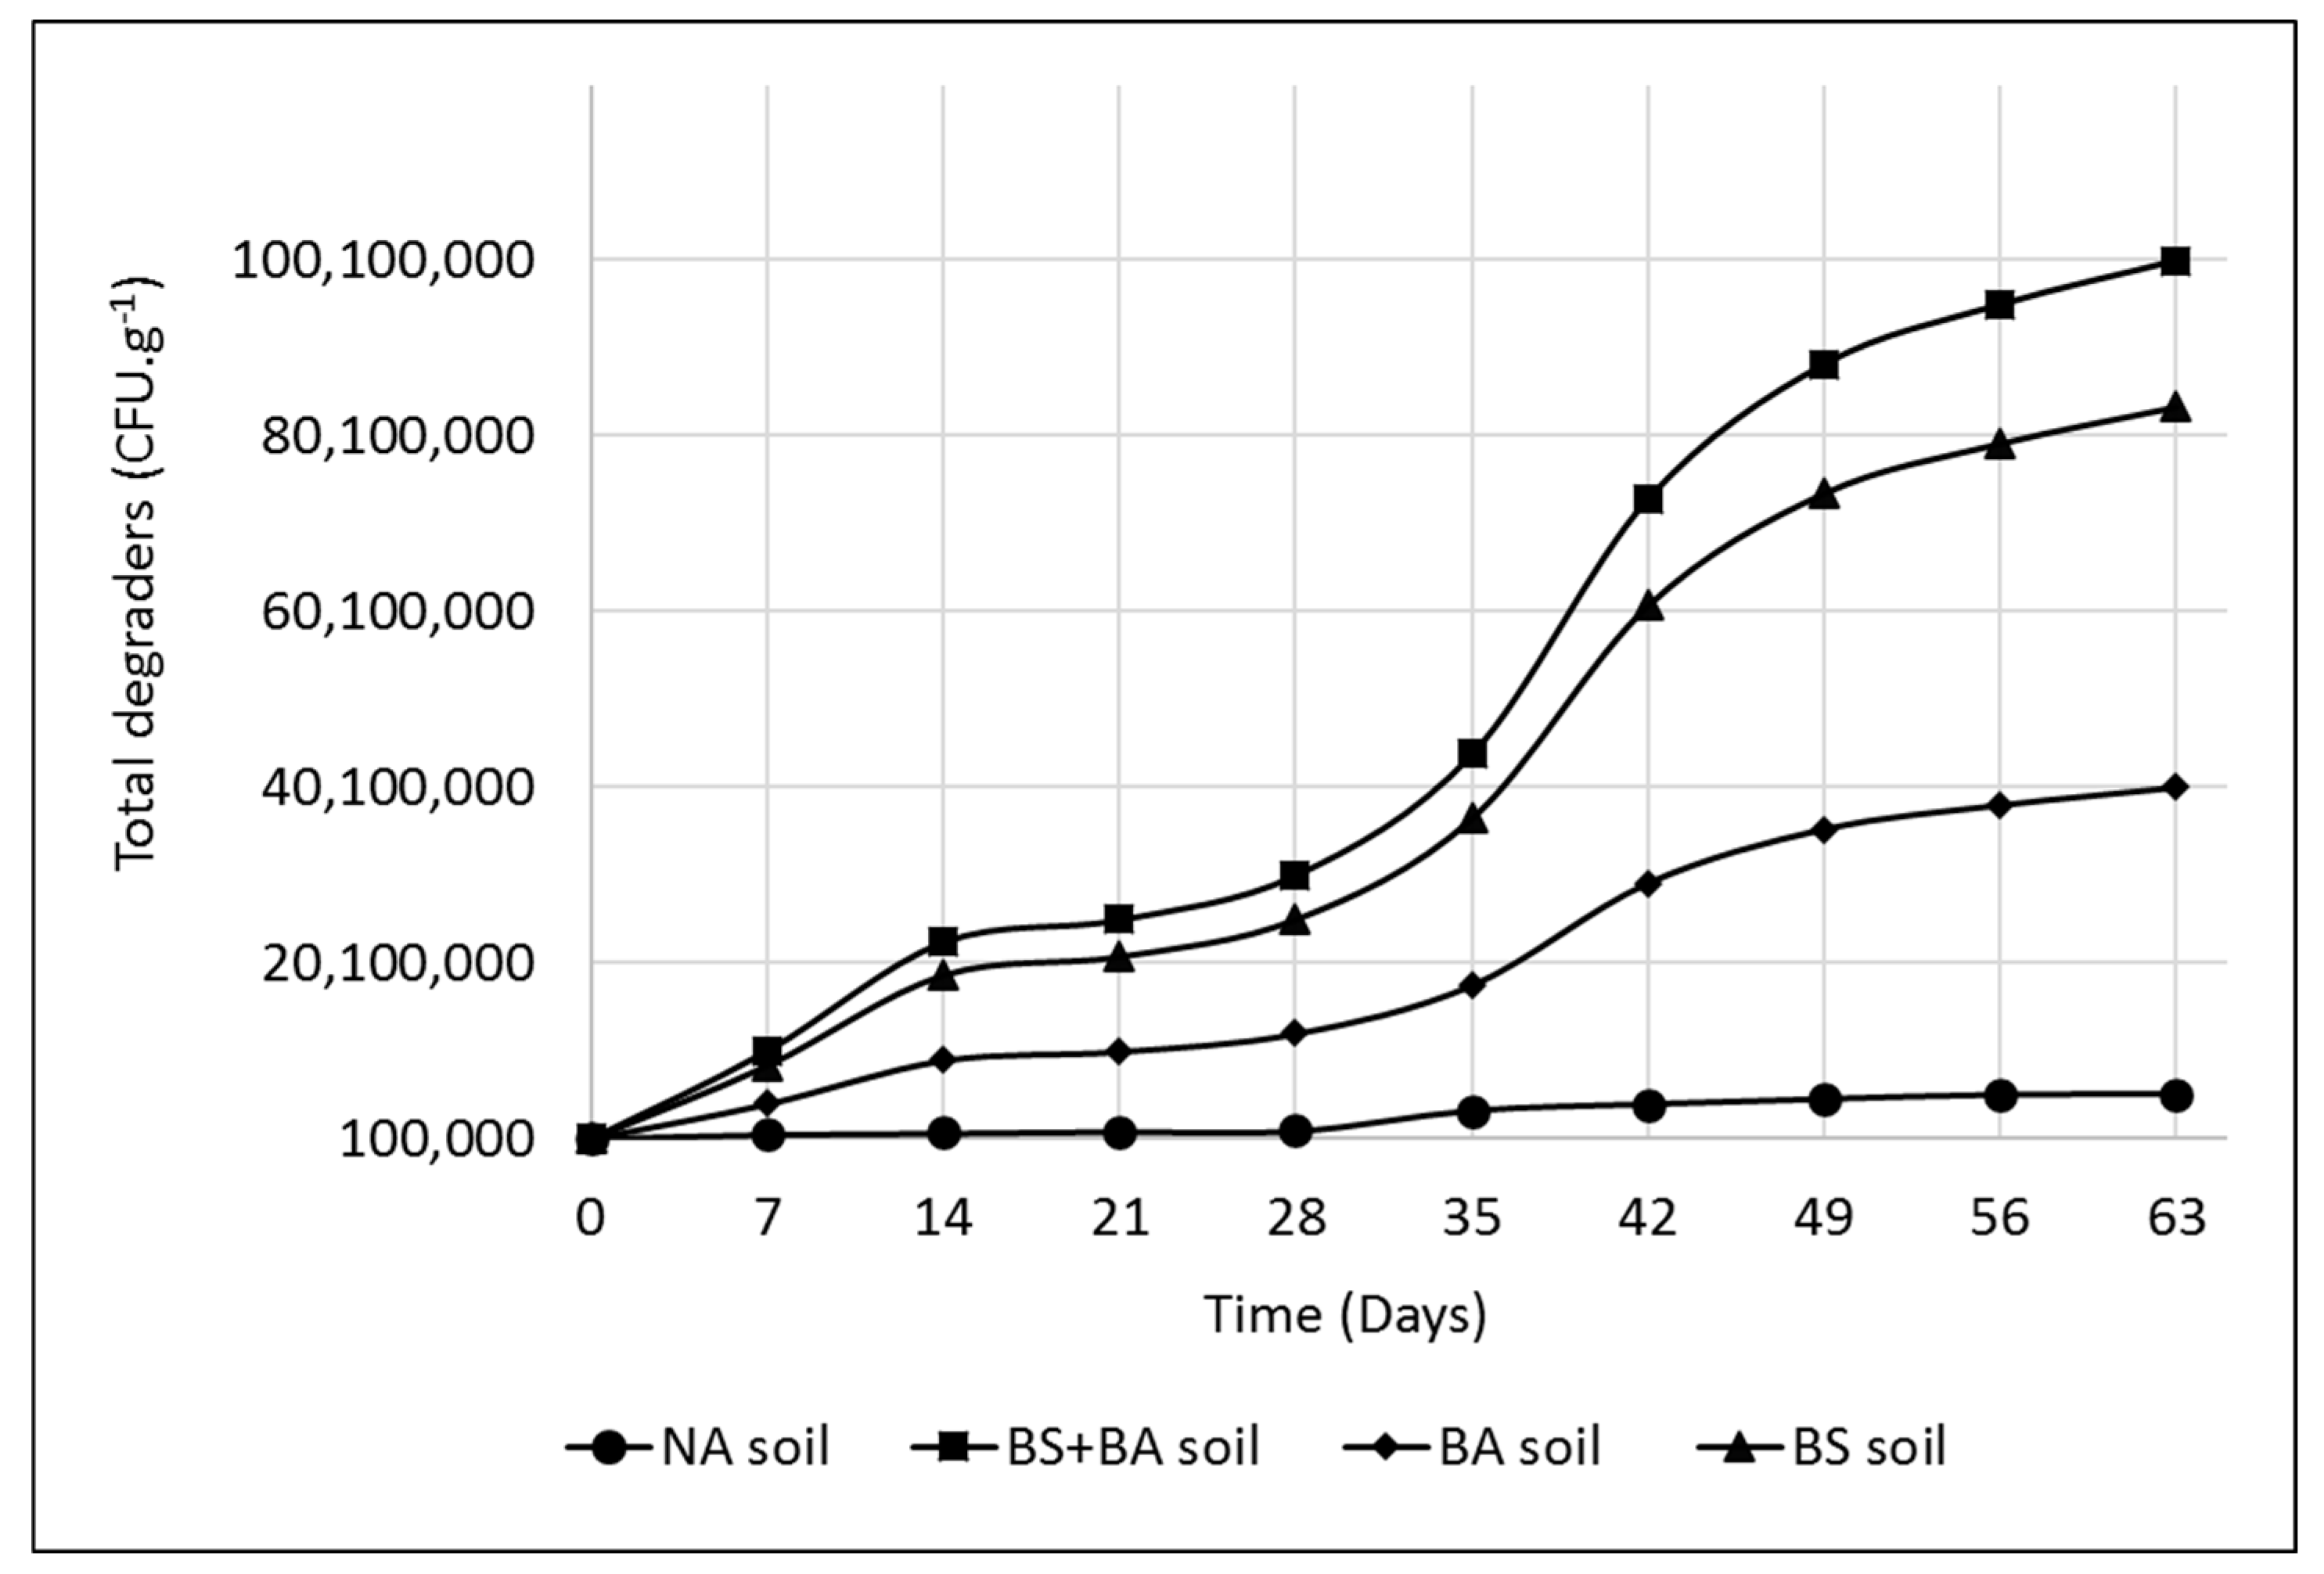
The initial microbial population in the tanks was 1 × 10⁵ (1.E+05) CFU g−1. Figure 4 shows the variations of microbial population in the treatment tanks during 63 days of operation. The number of total TPH degrader bacteria were measured by taking weekly samples. Continuous rise in microorganism population indicates that the number of microorganisms increased significantly by degrading TPH. This increase in the population was due to the available quantity of TPH, N, and P in the tanks. As the carbon source for microorganisms started to diminish, the microbial population reached a steady-state value at the end of the study. Compared to tank 1, a remarkable increase in TPH degrader bacteria was observed within 63 days in soil samples collected from tank 2 (BA+BS). Significantly higher number of degrader microbial counts was observed in the other two tanks, tank 3 (BA) and tank 4 (BS), compared to tank 1 (NA). At the end of the study, the hydrocarbon degrading bacteria numbers in BA+BS soils were two orders of magnitude higher than in control soils (NA).
3.3. Bioremediation Kinetics
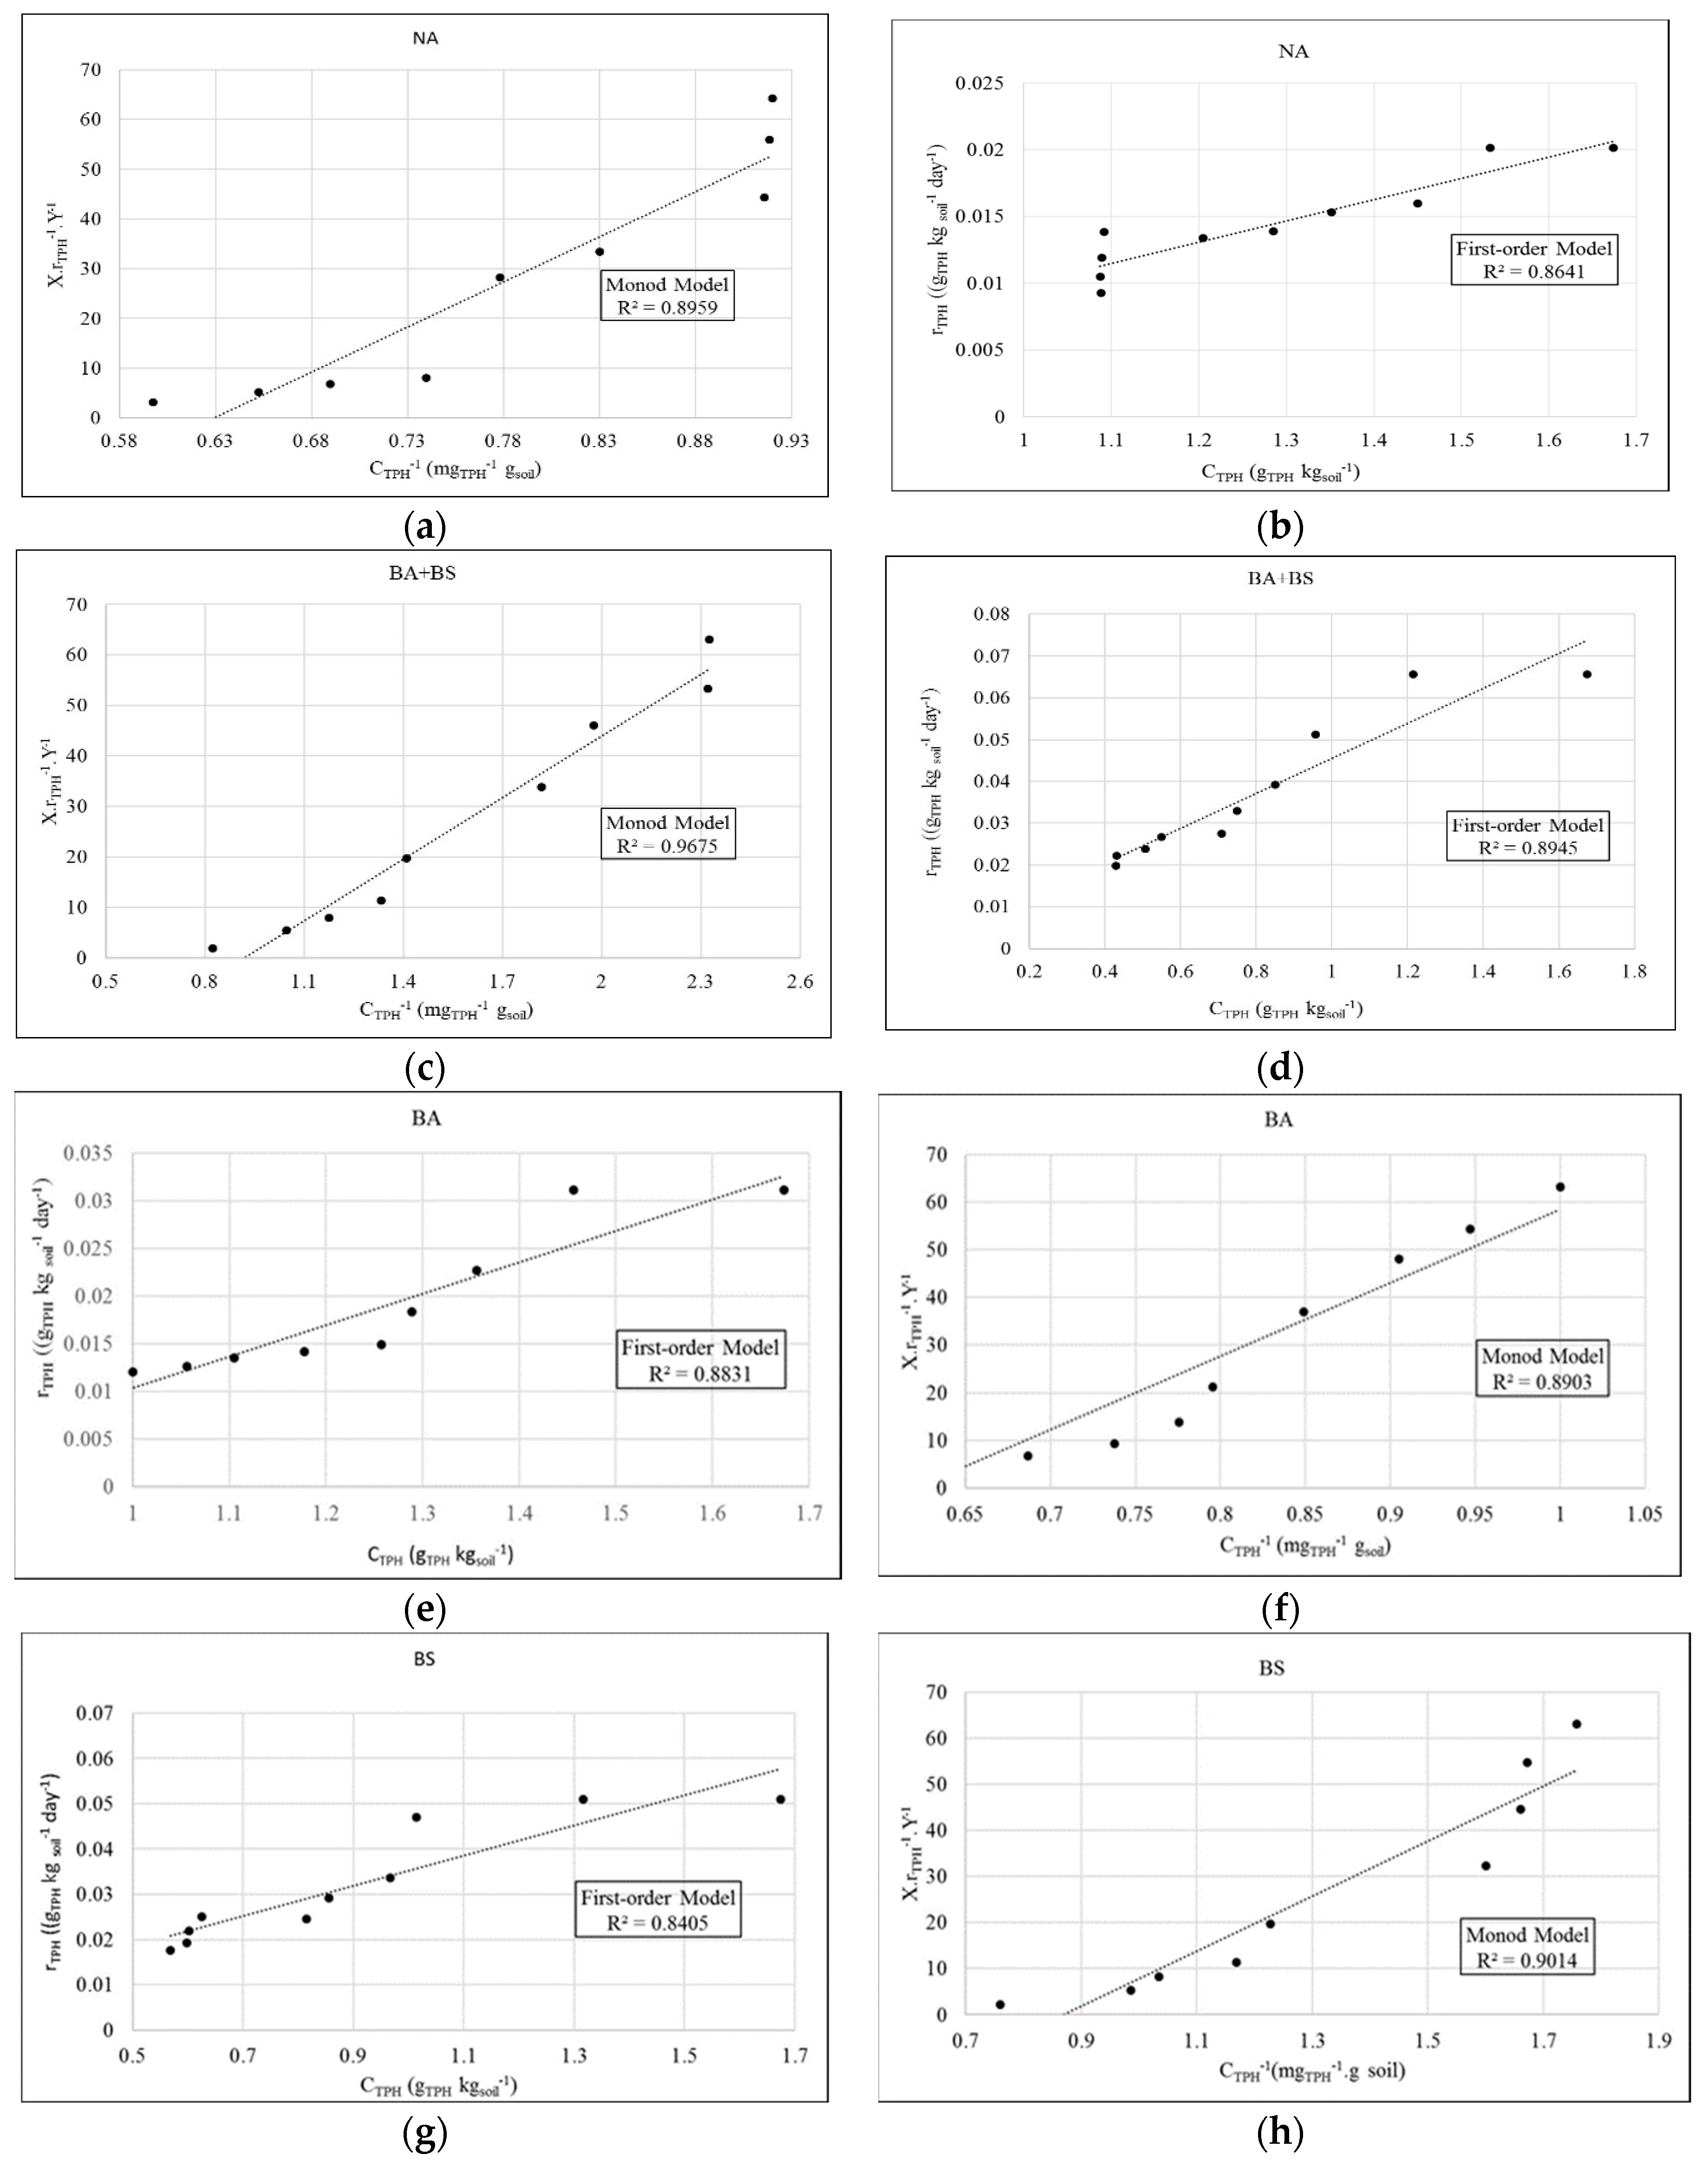
It has been reported by several investigators that first-order kinetics and Michaelis–Menten kinetic can be used for petroleum-hydrocarbon degradation [36,42,43,44]. The data obtained from the treatment tanks were applied to the first-order rate model and the Monod model. The yield values (Y), which define the microorganism concentrations in CFU per mg of TPH biodegraded, were determined from the values of CFU and TPH. The Y values for NA, BA+BS, BS, and BA processes were determined as 8530, 80,300, 58,200, and 78,300 CFU g−1 TPH, respectively. Figure 5 shows fits of the first-order and the Monod models to data from the NA, BS + BA, BS, and BA treatment processes. It is clearly seen from Figure 5 that the Monod model represents the data better than the first-order reaction rate model, which is validated by the R2 values. The reaction rate coefficient (k), maximum specific growth rate (µmax), half-reaction time (t1/2), and TPH value at half-time (Ks) were determined from the curves in Figure 5 and are summarized in Table 3 for each treatment process.
4. Discussion
The results obtained from this study showed that microorganisms can successfully biodegrade TPH, particularly when combined BS and BA processes are used. Results of this study also showed that BS has a higher effect on biodegradation efficiency than BA process. Adding nitrogen and phosphorus, along with microbial inoculation and aeration can create an optimum condition for microorganisms to degrade TPH.
Analysis of the contaminated soil indicated that the C:N:P ratio was 10,000:0.0107.0:0.0027. This ratio is considered high for C as the suggested C:N:P ratio for bioremediation varies between 100:10:1 and 100:5:1, which corresponds to the nutrients needed for microorganisms [19,45]. In addition, the initial soil contained low numbers of TPH biodegraders. Therefore, adding optimum amount of nutrients and introducing TPH degraders (addition of microbial inoculum) apparently increased the microbial populations in the contaminated soil, providing more efficient TPH biodegradation.
Earlier studies showed that bioremediation was a useful method for decomposing TPH in soils contaminated with weathered oil [46,47]. However, there are limited studies for quick bioremediation of TPH and population density of microbial community in freshly oil-contaminated soils. This study assessed the effectiveness of bioaugmentation combined with biostimulation process on a freshly oil-contaminated soil. The results of this work justified that the bioaugmentation and biostimulation combined provided the accelerated biodegradation of TPH from the contaminated soil through increased microbial biomass. Wu, Dick [17] reported that bioremediation of TPH was achieved between 34 and 60% in a local freshly petroleum contaminated soil after 10 weeks of treatment. However, weathered hydrocarbon contaminants were not readily available to biodegrading microorganisms [48]. This study revealed similar results to those previous works pointing out that biostimulation was more effective than bioaugmentation [1,13,14]. Moreover, several studies showed that the most efficient biodegradation method for TPH removal is a combination of bioaugmentation and biostimulation processes [10,46,47].
Several different bacterial species would be needed to effectively biodegrade hydrocarbons [11]. Single microbial species do not have the capacity to biodegrade more than two different compounds that are usually present in crude oil. Conventionally, the higher the hydrocarbon degrading microbial population, the more hydrocarbon biodegradation takes place [11,49]. It was shown in this work that the number of microorganisms were higher in BS tank than in BA tank, and contaminant removal was 66% for BS tank and 41% for BA tank. Thus, it can be stressed that there is a linear relationship between microbial population and TPH biodegradation.
The coefficients calculated from the first-order kinetics and the Michaelis–Menten kinetic models clearly showed that the Monod model fits better for the BS+BA process than the other treatment processes. For instance, the first-order reaction rate (k) in the BS+BA process was higher compared to NA, BA, and BS processes. The half-reaction time determined from the reaction rate (k) in the BA+BS process was thus smaller than in the other processes. In both models, maximum specific growth rate (µmax) was higher and TPH value at half-time (Ks) was lower in the BA+BS process, which indicates that BA+BS process had a faster reaction rate. The results of these both model applications indicated that BS and BA together achieved the best TPH removal efficiency.
5. Conclusions
Petroleum hydrocarbons remaining in soil for a long time after contamination along with costly treatment methods have made them one of the most important environmental pollutants. This study confirmed that it is possible to enhance the biodegradation of TPH in soil by using different treatment methods such as bioaugmentation and biostimulation alone or in combination. Analysis of TPH, microbial population, and kinetic models indicated that bioremediation of oil contaminated soil is very successful especially when BS and BA treatment are used together.
In this pilot study, the TPH degradation in the crude oil contaminated soil was improved by bioaugmentation with genus Alcanivorax and biostimulation with nitrogen and phosphorus. The study also showed that bioaugmentation and biostimulation resulted in effective TPH removal and effective recovery of soil’s fertility properties within 63 days of treatment. The study highlighted the importance of ex situ soil treatment combined with bioaugmentation and biostimulation as a suitable strategy.
Funding
This research was funded by Imam Abdulrahman bin Faisal University (IAU) project No. (2019-037-Eng) throughout the Deanship of Scientific Research (DSR).
Acknowledgments
The author would like to thank Abdulrahman bin Faisal University for academic support.
Conflicts of Interest
The author declares no conflict of interest.
References
- Abed, R.M.; Al-Sabahi, J.; Al-Maqrashi, F.; Al-Habsi, A.; Al-Hinai, M. Characterization of hydrocarbon-degrading bacteria isolated from oil-contaminated sediments in the sultanate of Oman and evaluation of bioaugmentation and biostimulation approaches in microcosm experiments. Int. Biodeterior. Biodegrad. 2014, 89, 58–66. [Google Scholar] [CrossRef]
- Cerqueira, V.S.; Peralba, M.D.C.R.; Camargo, F.A.D.O.; Bento, F.M. Comparison of bioremediation strategies for soil impacted with petrochemical oily sludge. Int. Biodeterior. Biodegrad. 2014, 95, 338–345. [Google Scholar] [CrossRef]
- Polyak, Y.M.; Bakina, L.G.; Chugunova, M.V.; Mayachkina, N.V.; Gerasimov, A.O.; Bure, V. Effect of remediation strategies on biological activity of oil-contaminated soil—A field study. Int. Biodeterior. Biodegrad. 2018, 126, 57–68. [Google Scholar] [CrossRef]
- Jiang, Y.; Brassington, K.J.; Prpich, G.; Paton, G.I.; Semple, K.T.; Pollard, S.J.; Coulon, F. Insights into the biodegradation of weathered hydrocarbons in contaminated soils by bioaugmentation and nutrient stimulation. Chemosphere 2016, 161, 300–307. [Google Scholar] [CrossRef] [Green Version]
- Ramadass, K.; Megharaj, M.; Venkateswarlu, K.; Naidu, R. Bioavailability of weathered hydrocarbons in engine oil-contaminated soil: Impact of bioaugmentation mediated by pseudomonas spp. on bioremediation. Sci. Total. Environ. 2018, 636, 968–974. [Google Scholar] [CrossRef]
- Safdari, M.-S.; Kariminia, H.-R.; Rahmati, M.; Fazlollahi, F.; Polasko, A.; Mahendra, S.; Wilding, W.V.; Fletcher, T.H. Development of bioreactors for comparative Study of natural attenuation, biostimulation, and bioaugmentation of petroleum-hydrocarbon contaminated Soil. J. Hazard Mater. 2018, 342, 270–278. [Google Scholar] [CrossRef] [PubMed]
- Hechmi, N.; Bosso, L.; El-Bassi, L.; Scelza, R.; Testa, A.; Jedidi, N.A.; Rao, M. Depletion of pentachlorophenol in soil microcosms with byssochlamys nivea and scopulariopsis brumptii as detoxification agents. Chemosphere 2016, 165, 547–554. [Google Scholar] [CrossRef]
- Tian, H.; Yan, M.; Treu, L.; Angelidaki, I.; Fotidis, I.A. Hydrogenotrophic methanogens are the key for a successful bioaugmentation to alleviate ammonia inhibition in thermophilic anaerobic Digesters. Bioresour. Technol. 2019, 293, 122070. [Google Scholar] [CrossRef]
- Łebkowska, M.; Zborowska, E.; Karwowska, E.; Miaśkiewicz-Pęska, E.; Muszyński, A.; Tabernacka, A.; Naumczyk, J.; Jęczalik, M. Bioremediation of soil polluted with fuels by sequential multiple injection of native microorganisms: Field-scale processes in Poland. Ecol. Eng. 2011, 37, 1895–1900. [Google Scholar] [CrossRef]
- Taccari, M.; Milanovic, V.; Comitini, F.; Casucci, C.; Ciani, M. Effects of biostimulation and bioaugmentation on diesel removal and bacterial community. Int. Biodeterior. Biodegrad. 2012, 66, 39–46. [Google Scholar] [CrossRef]
- Wu, M.; Chen, L.; Tian, Y.; Ding, Y.; Dick, W.A. Degradation of polycyclic aromatic hydrocarbons by microbial consortia enriched from three soils using two different culture media. Environ. Pollut. 2013, 178, 152–158. [Google Scholar] [CrossRef] [PubMed]
- Yu, K.; Wong, A.; Yau, K.; Wong, Y.; Tam, N.F. Natural attenuation, biostimulation and bioaugmentation on biodegradation of polycyclic aromatic hydrocarbons (PAHs) in mangrove sediments. Mar. Pollut. Bull. 2005, 51, 1071–1077. [Google Scholar] [CrossRef] [PubMed] [Green Version]
- Kauppi, S.; Sinkkonen, A.; Romantschuk, M. Enhancing bioremediation of diesel-fuel-contaminated soil in a boreal climate: Comparison of biostimulation and bioaugmentation. Int. Biodeterior. Biodegrad. 2011, 65, 359–368. [Google Scholar] [CrossRef]
- Sayara, T.; Borràs, E.; Caminal, G.; Sarrà, M.; Sánchez, A. Bioremediation of PAHs-contaminated soil through composting: Influence of bioaugmentation and biostimulation on contaminant biodegradation. Int. Biodeterior. Biodegrad. 2011, 65, 859–865. [Google Scholar] [CrossRef] [Green Version]
- Balba, M.; Al-Awadhi, N.; Al-Daher, R. Bioremediation of oil-Contaminated soil: Microbiological methods for feasibility assessment and field evaluation. J. Microbiol. Methods 1998, 32, 155–164. [Google Scholar] [CrossRef]
- Wu, M.; Ye, X.; Chen, K.; Li, W.; Yuan, J.; Jiang, X. Bacterial community shift and hydrocarbon transformation during bioremediation of short-term petroleum-contaminated soil. Environ. Pollut. 2017, 223, 657–664. [Google Scholar] [CrossRef]
- Wu, M.; Dick, W.A.; Li, W.; Wang, X.C.; Yang, Q.; Wang, T.; Xu, L.; Zhang, M.; Chen, L. Bioaugmentation and biostimulation of hydrocarbon degradation and the microbial community in a petroleum-contaminated soil. Int. Biodeterior. Biodegrad. 2016, 107, 158–164. [Google Scholar] [CrossRef]
- Nwankwegu, A.S.; Onwosi, C.O. Bioremediation of gasoline contaminated agricultural soil by bioaugmentation. Environ. Technol. Innov. 2017, 7, 1–11. [Google Scholar] [CrossRef]
- Alexander, M. Biodegradation and Bioremediation; Academic Press: San Diego, CA, USA, 1999. [Google Scholar]
- Zhang, X.-X.; Cheng, S.; Zhu, C.-J.; Sun, S.-L. Microbial PAH-degradation in soil: Degradation pathways and contributing factors. Pedosphere 2006, 16, 555–565. [Google Scholar] [CrossRef]
- Alavi, N.; Mesdaghinia, A.; Naddafi, K.; Mohebali, G.; Daraei, H.; Maleki, A.; Alaei, L. Biodegradation of petroleum hydrocarbons in a soil polluted sample by oil-based drilling cuttings. Soil Sediment Contam. Int. J. 2014, 23, 586–597. [Google Scholar] [CrossRef]
- USEPA. Test Methods for Evaluating Solid Waste, Physical/Chemical Methods SW-846; EPA Publication: Washington, DC, USA, 2015. [Google Scholar]
- USEPA. Hexadecane Extraction and Screening of Purgeable Organics; USEPA: Washington, DC, USA, 1986.
- USEPA. Method 8015B Nonhalogenated Organics Using GC/FID; USEPA: Washington, DC, USA, 2007.
- USEPA. Method 9045D Soil and Waste pH; USEPA: Washington, DC, USA, 2004.
- Shin, H.; Yu, J.; Wang, L.; Jeong, Y.; Kim, J. Spectral interference of heavy metal contamination on spectral signals of moisture content for heavy metal contaminated soils. IEEE Trans. Geosci. Remote. Sens. 2020, 58, 2266–2275. [Google Scholar] [CrossRef]
- Bosso, L.; Scelza, R.; Testa, A.; Cristinzio, G.; Rao, M. Depletion of pentachlorophenol contamination in an agricultural soil treated with byssochlamys nivea, scopulariopsis brumptii and urban waste compost: A laboratory microcosm study. Water Air Soil Pollut. 2015, 226, 183. [Google Scholar] [CrossRef]
- ASTM. ASTM D2974-14 Standard Test Methods for Moisture, Ash, and Organic Matter of Peat and Other Organic Soils; ASTM International: West Conshohocken, PA, USA, 2014. [Google Scholar]
- Xue, W.; Peng, Z.; Huang, D.-L.; Zeng, G.; Wan, J.; Xu, R.; Cheng, M.; Zhang, C.; Jiang, D.; Hu, Z. Nanoremediation of cadmium contaminated river sediments: Microbial response and organic carbon changes. J. Hazard Mater. 2018, 359, 290–299. [Google Scholar] [CrossRef] [PubMed]
- Bernard, B.B.; Bernard, H.; Brooks, J.M. Determination of TC, TOC, and TIC in Sediments; TDI Brooks International: College Station, TX, USA, 2004. [Google Scholar]
- Van Reeuwijk, L.P. Procedures for Soil Analysis; ISRIC: Wageningen, The Netherlands, 2002. [Google Scholar]
- Li, J.; Gong, J.; Fu, B.; Huang, Z.; Huang, Y.; Gui, L. Effect of land use conversion on soil organic carbon sequestration in the loess hilly area, loess plateau of China. Ecol. Res. 2006, 22, 641–648. [Google Scholar]
- Klaic, P.M.A.; Nunes, A.M.; Moreira, A.D.S.; Vendruscolo, C.; Ribeiro, A.S. Determination of Na, K, Ca and Mg in Xanthan gum: Sample treatment by acid digestion. Carbohydr. Polym. 2011, 83, 1895–1900. [Google Scholar] [CrossRef]
- Nakasaki, K.; Hirai, H. Temperature control strategy to enhance the activity of yeast inoculated into compost raw material for accelerated composting. Waste Manag. 2017, 65, 29–36. [Google Scholar] [CrossRef]
- Komilis, D.; Vrohidou, A.-E.K.; Voudrias, E.A. Kinetics of aerobic bioremediation of a diesel-contaminated sandy soil: Effect of nitrogen addition. Water Air Soil Pollut. 2009, 208, 193–208. [Google Scholar] [CrossRef]
- Chemlal, R.; Tassist, A.; Drouiche, M.; Lounici, H.; Mameri, N.; Drouiche, N. Microbiological aspects study of bioremediation of diesel-contaminated soils by biopile technique. Int. Biodeterior. Biodegrad. 2012, 75, 201–206. [Google Scholar] [CrossRef]
- Tellez, G.T.; Nirmalakhandan, N.; Gardeatorresdey, J.L. Evaluation of biokinetic coefficients in degradation of oil-field produced water under varying salt concentrations. Water Res. 1995, 29, 1711–1718. [Google Scholar] [CrossRef]
- Eweis, J.B.; Ergas, S.J.; Chang, D.P.Y.; Schroeder, E.D. Bioremediation Principles; McGraw-Hill Book Company Europe: Maidenhead, UK, 1998; p. 296. [Google Scholar]
- Coulon, F.; Brassington, K.J.; Bazin, R.; Linnet, P.E.; Thomas, K.A.; Mitchell, T.R.; Lethbridge, G.; Smith, J.W.N.; Pollard, S.J. Effect of fertilizer formulation and bioaugmentation on biodegradation and leaching of crude oils and refined products in soils. Environ. Technol. 2012, 33, 1879–1893. [Google Scholar] [CrossRef] [Green Version]
- Wu, G.; Kechavarzi, C.; Li, X.; Sui, H.; Pollard, S.J.; Coulon, F. Influence of mature compost amendment on total and bioavailable polycyclic aromatic hydrocarbons in contaminated soils. Chemosphere 2013, 90, 2240–2246. [Google Scholar] [CrossRef] [PubMed]
- Shahsavari, E.; Adetutu, E.M.; Anderson, P.; Ball, A.S. Necrophytoremediation of phenanthrene and pyrene in contaminated soil. J. Environ. Manag. 2013, 122, 105–112. [Google Scholar] [CrossRef] [PubMed]
- Brook, T.R.; Stiver, W.H.; Zytner, R.G. Biodegradation of diesel fuel in soil under various nitrogen addition regimes. Soil Sediment Contam. Int. J. 2001, 10, 539–553. [Google Scholar] [CrossRef]
- Shewfelt, K.; Lee, H.; Zytner, R.G. Optimization of Nitrogen for Bioventing of Gasoline Contaminated Soil. J. Environ. Eng. Sci. 2005, 4, 29–42. [Google Scholar] [CrossRef]
- Rončević, S.; Dalmacija, B.; Ivancev-Tumbas, I.; Tričković, J.; Petrovic, O.; Klasnja, M.; Agbaba, J. Kinetics of degradation of hydrocarbons in the contaminated soil layer. Arch. Environ. Contam. Toxicol. 2005, 49, 27–36. [Google Scholar] [CrossRef]
- Li, H.; Zhang, Y.; Kravchenko, I.; Xu, H.; Zhang, C.-G. Dynamic changes in microbial activity and community structure during biodegradation of petroleum compounds: A Laboratory experiment. J. Environ. Sci. 2007, 19, 1003–1013. [Google Scholar] [CrossRef]
- Mancera-López, M.; Esparza-García, F.; Chávez-Gómez, B.; Rodríguez-Vázquez, R.; Saucedo-Castañeda, G.; Barrera-Cortés, J. Bioremediation of an aged hydrocarbon-contaminated soil by a combined System of biostimulation–bioaugmentation with filamentous fungi. Int. Biodeterior. Biodegrad. 2008, 61, 151–160. [Google Scholar] [CrossRef]
- Suja, F.; Rahim, F.; Taha, M.R.; Hambali, N.; Razali, M.R.; Khalid, A.; Hamzah, A. Effects of local microbial bioaugmentation and biostimulation on the bioremediation of total petroleum hydrocarbons (TPH) in crude oil contaminated soil based on laboratory and field observations. Int. Biodeterior. Biodegrad. 2014, 90, 115–122. [Google Scholar] [CrossRef]
- Smith, M.J.; Lethbridge, G.; Burns, R.G. Fate of phenanthrene, pyrene and benzo[a]pyrene during biodegradation of crude oil added to two soils. FEMS Microbiol. Lett. 1999, 173, 445–452. [Google Scholar] [CrossRef]
- Krutz, L.J.; Beyrouty, C.A.; Gentry, T.J.; Wolf, D.C.; Reynolds, C.M. Selective enrichment of a pyrene degrader population and enhanced pyrene degradation in Bermuda grass rhizosphere. Biol. Fertil. Soils 2005, 41, 359–364. [Google Scholar] [CrossRef]
Figure 1.
Schematics of soil treatment tanks (a) Natural attenuation (NA), (b) Biostimulation+Bioaugmentation (BS+BA), (c) Bioaugmentation (BA), (d) Biostimulation (BS).
Figure 1.
Schematics of soil treatment tanks (a) Natural attenuation (NA), (b) Biostimulation+Bioaugmentation (BS+BA), (c) Bioaugmentation (BA), (d) Biostimulation (BS).

Figure 2.
Changes in Total petroleum hydrocarbon (TPH) concentrations in the treatment tanks.

Figure 3.
Olympus U-pot microscope picture of the microbial inoculum at 40× magnification.

Figure 4.
Total degrader bacteria numbers in soil samples over 63 days.

Figure 5.
Reaction rate data for the treatment modes. (a) The first-order model for NA, (b) the Monod model for NA, (c) the first-order model for BA+BS, (d) the Monod model for BA+BS, (e) the first-order model for BA, (f) the Monod model for BA, (g) the first-order model for BS, (h) the Monod model for BS.


Table 1.
Configuration of the treatment tanks.
| Microbial Inoculum Addition (Bioaugmentation) | Nutrients Addition (Biostimulation) (%20 N, %10 P, %10 K) | Crude Oil Addition | |
|---|---|---|---|
| Tank 1 (NA) | No | No | Yes |
| Tank 2 (BS + BA) | Yes | Yes | Yes |
| Tank 3 (BA) | Yes | No | Yes |
| Tank 4 (BS) | No | Yes | Yes |
Table 2.
Chemical characteristics of oil-contaminated soil used in the study.
| Parameters | Unit | Values |
|---|---|---|
| pH | 7.8 ± 0.11 | |
| Total Petroleum Hydrocarbon | mg/kg | 1674 ± 9.25 |
| Organic matter content of soil (foc) | % | 3 ± 0.31 |
| Organic matter | g/kg | 3.20 ± 0.25 |
| Organic carbon | g/kg | 1.86 ± 0.15 |
| Total Nitrogen | mg/kg | 0.002 ± 0.0 |
| C/N ratio (adjusted) | 20 ± 0.36 | |
| Total phosphorous | mg/kg | 0.0005 ± 0.0 |
| Potassium | mg/kg | 0.0005 ± 0.0 |
| Moisture content | % | 10 ± 0.12 |
Table 3.
Calculated reaction rate factors for the first-order and the Monod models.
| Treatment Type | First Order Model | Monod Model |
|---|---|---|
| NA | k:0.0159 d−1 | µmax:0.00875 d−1 |
| t1/2:43.6 d | Ks:1114 mg kg−1 | |
| R2:0.86 | R2:0.90 | |
| BA+BS | k:0.0419 d−1 | µmax:0.02675 d−1 |
| t1/2:16.54 d | Ks:918 mg kg−1 | |
| R2:0.89 | R2:0.97 | |
| BA | k:0.033 d−1 | µmax:0.0104 d−1 |
| t1/2:21.0 d | Ks:1289 mg kg−1 | |
| R2:0.88 | R2:0.89 | |
| BS | k:0.0333 d−1 | µmax:0.0193 d−1 |
| t1/2:20.8 d | Ks:965 mg kg−1 | |
| R2:0.84 | R2:0.90 |
© 2020 by the author. Licensee MDPI, Basel, Switzerland. This article is an open access article distributed under the terms and conditions of the Creative Commons Attribution (CC BY) license (http://creativecommons.org/licenses/by/4.0/).
Share and Cite
MDPI and ACS Style
Yaman, C. Performance and Kinetics of Bioaugmentation, Biostimulation, and Natural Attenuation Processes for Bioremediation of Crude Oil-Contaminated Soils. Processes 2020, 8, 883. https://0-doi-org.brum.beds.ac.uk/10.3390/pr8080883
AMA Style
Yaman C. Performance and Kinetics of Bioaugmentation, Biostimulation, and Natural Attenuation Processes for Bioremediation of Crude Oil-Contaminated Soils. Processes. 2020; 8(8):883. https://0-doi-org.brum.beds.ac.uk/10.3390/pr8080883
Chicago/Turabian StyleYaman, Cevat. 2020. "Performance and Kinetics of Bioaugmentation, Biostimulation, and Natural Attenuation Processes for Bioremediation of Crude Oil-Contaminated Soils" Processes 8, no. 8: 883. https://0-doi-org.brum.beds.ac.uk/10.3390/pr8080883
Note that from the first issue of 2016, this journal uses article numbers instead of page numbers. See further details here.