Fabrication and Analysis of Polydimethylsiloxane (PDMS) Microchannels for Biomedical Application

 , , , and
Abstract
:1. Introduction
1.1. Sterilization and Toxicity of Polymeric Implants
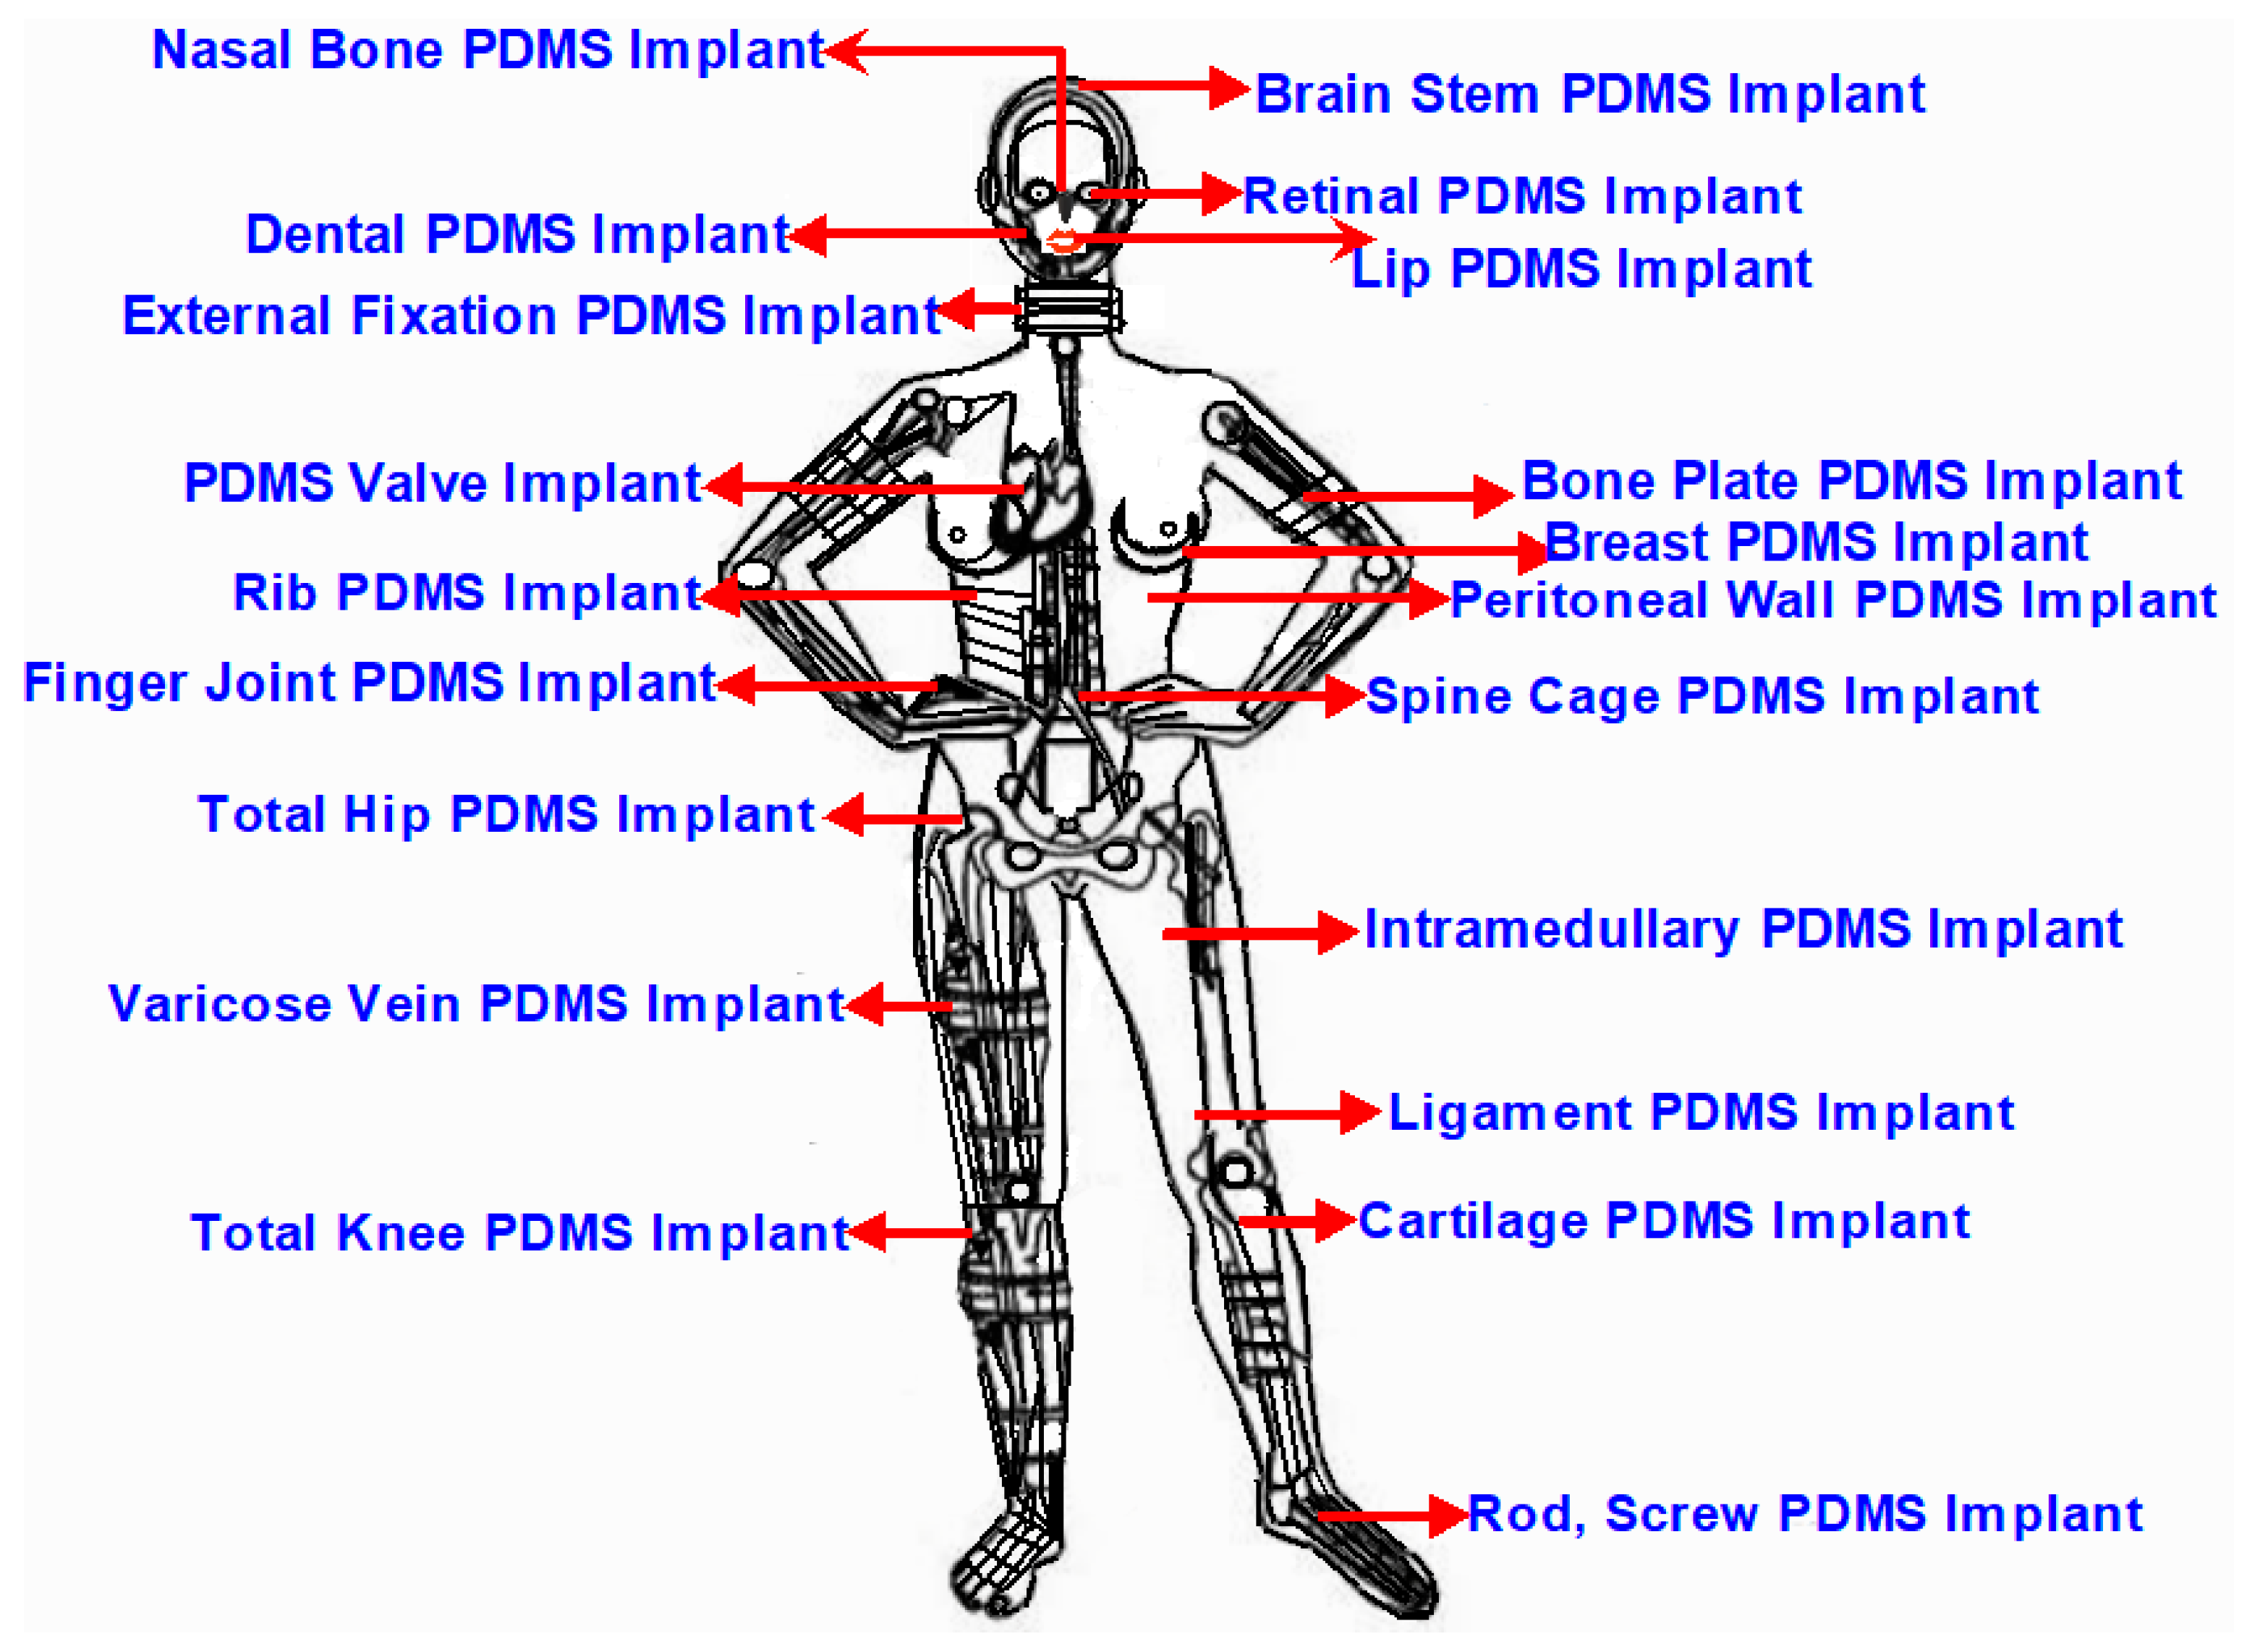
1.2. Surgical Polymeric Implants (PDMS)
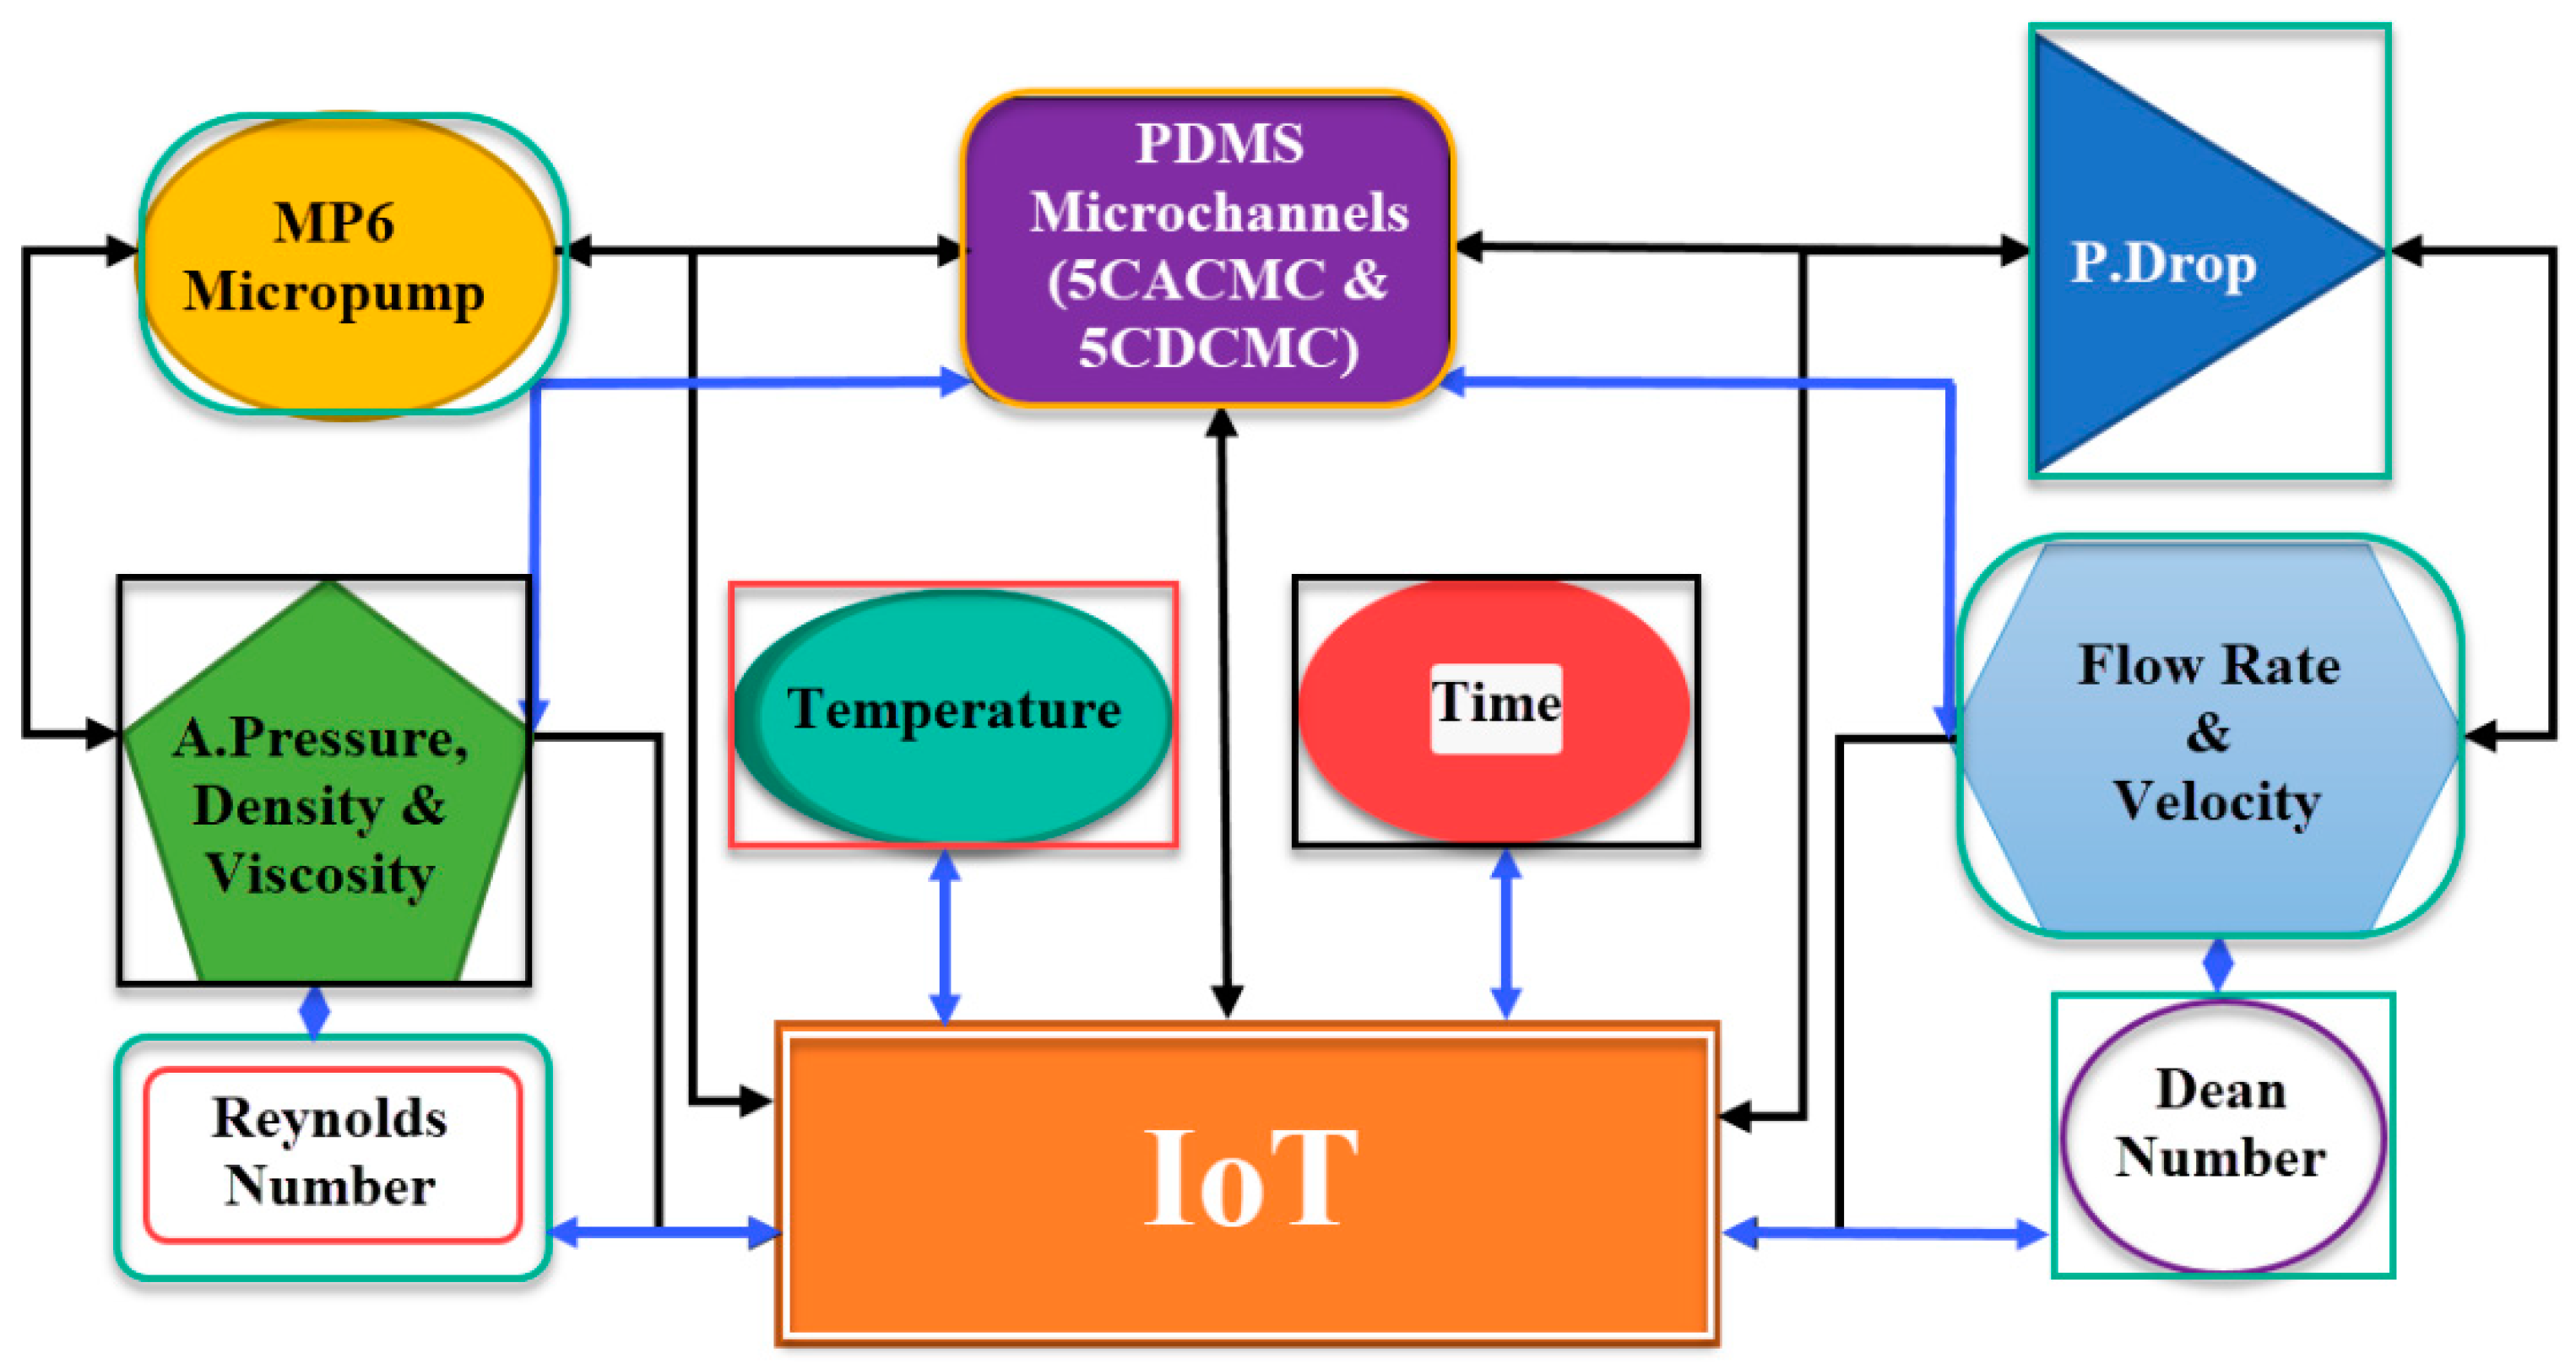
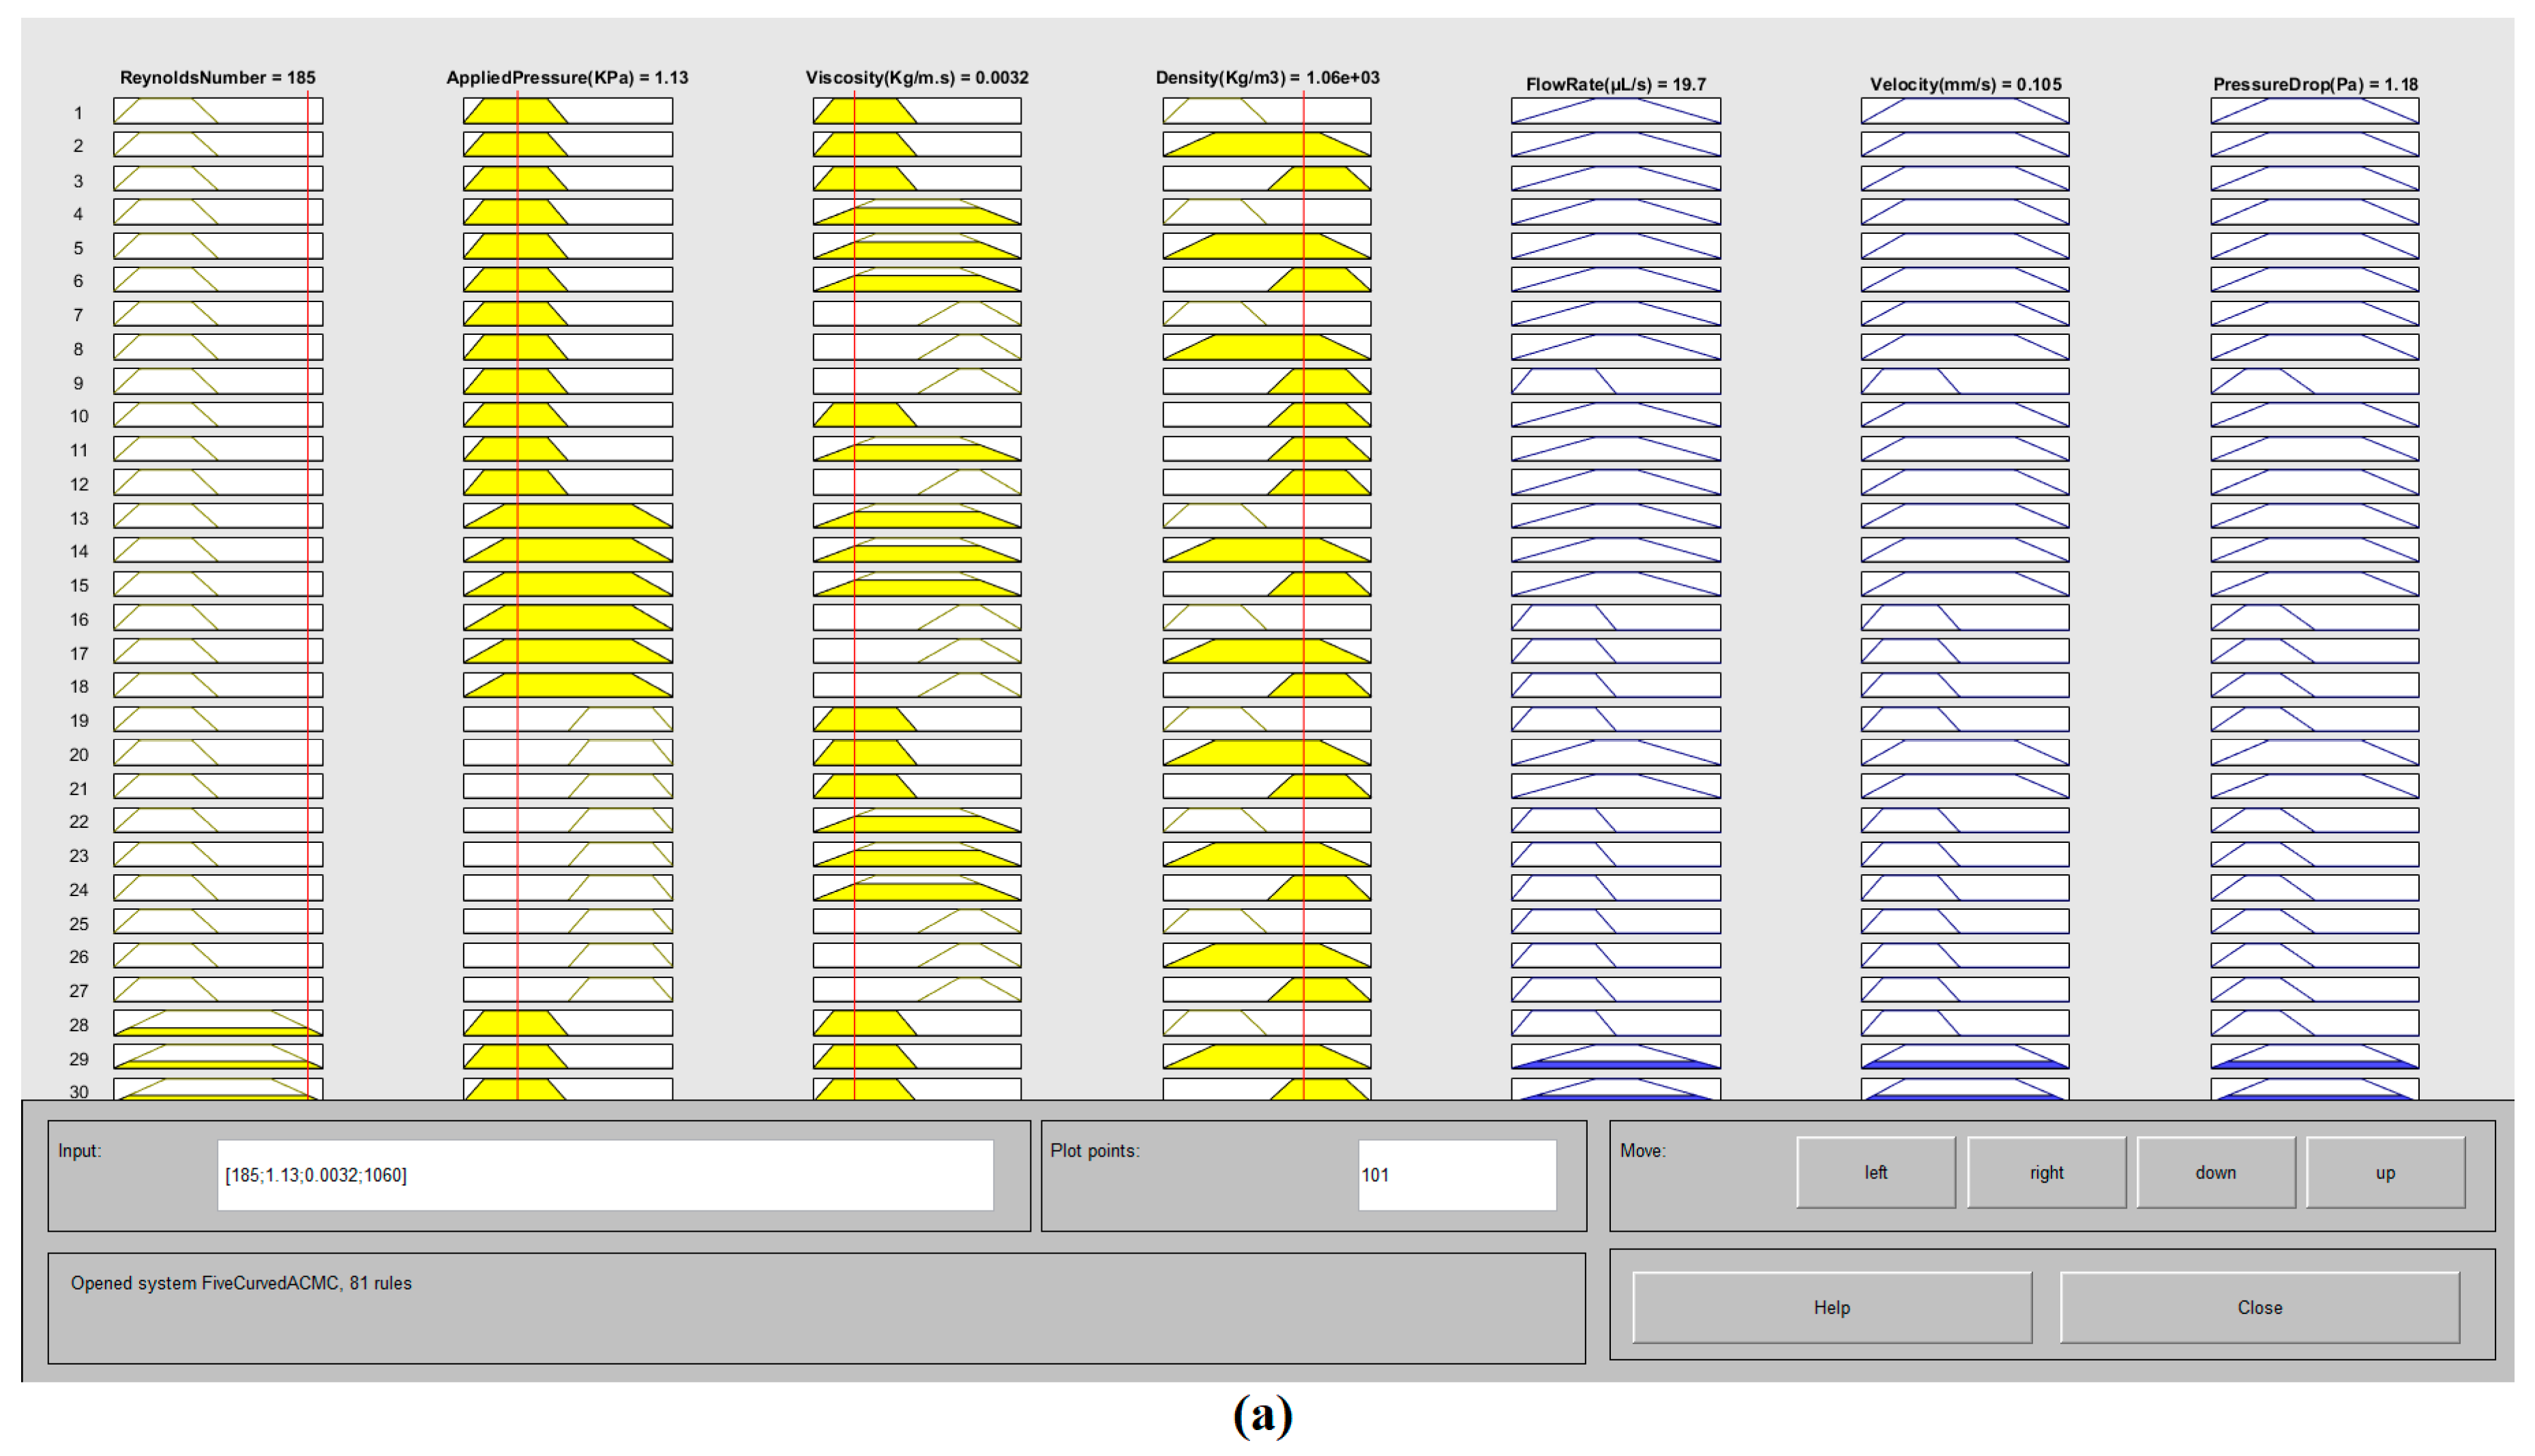
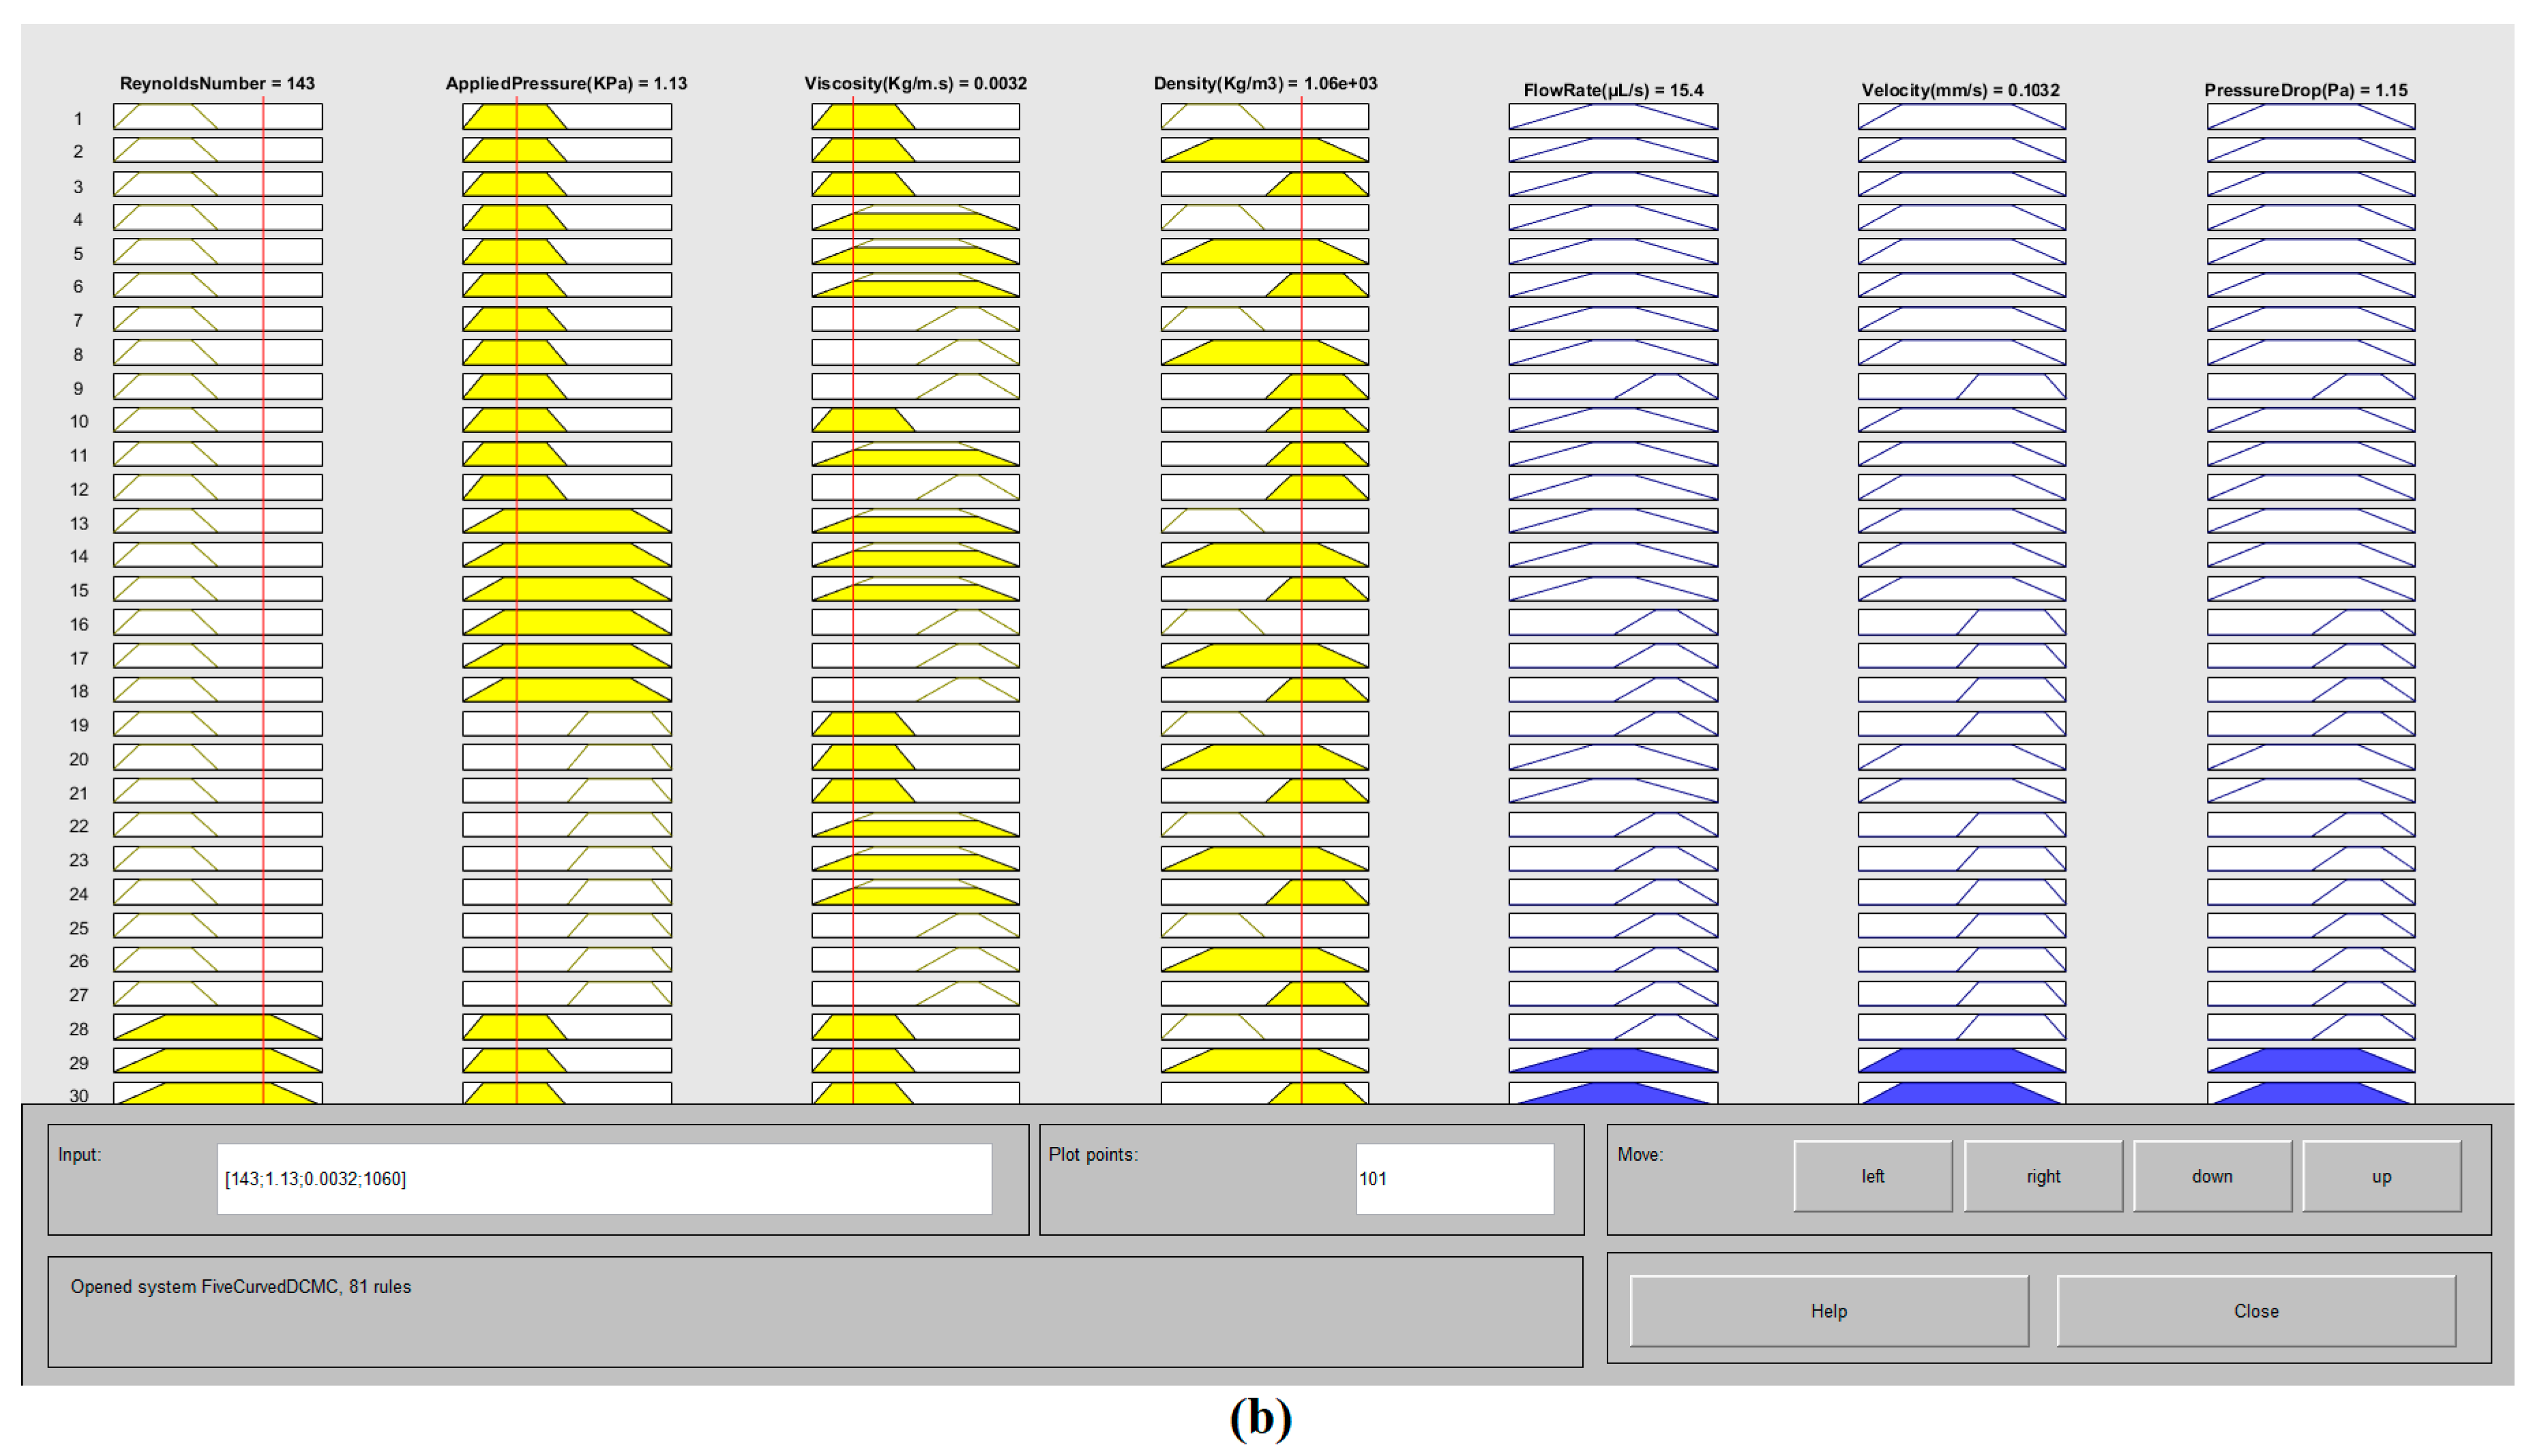
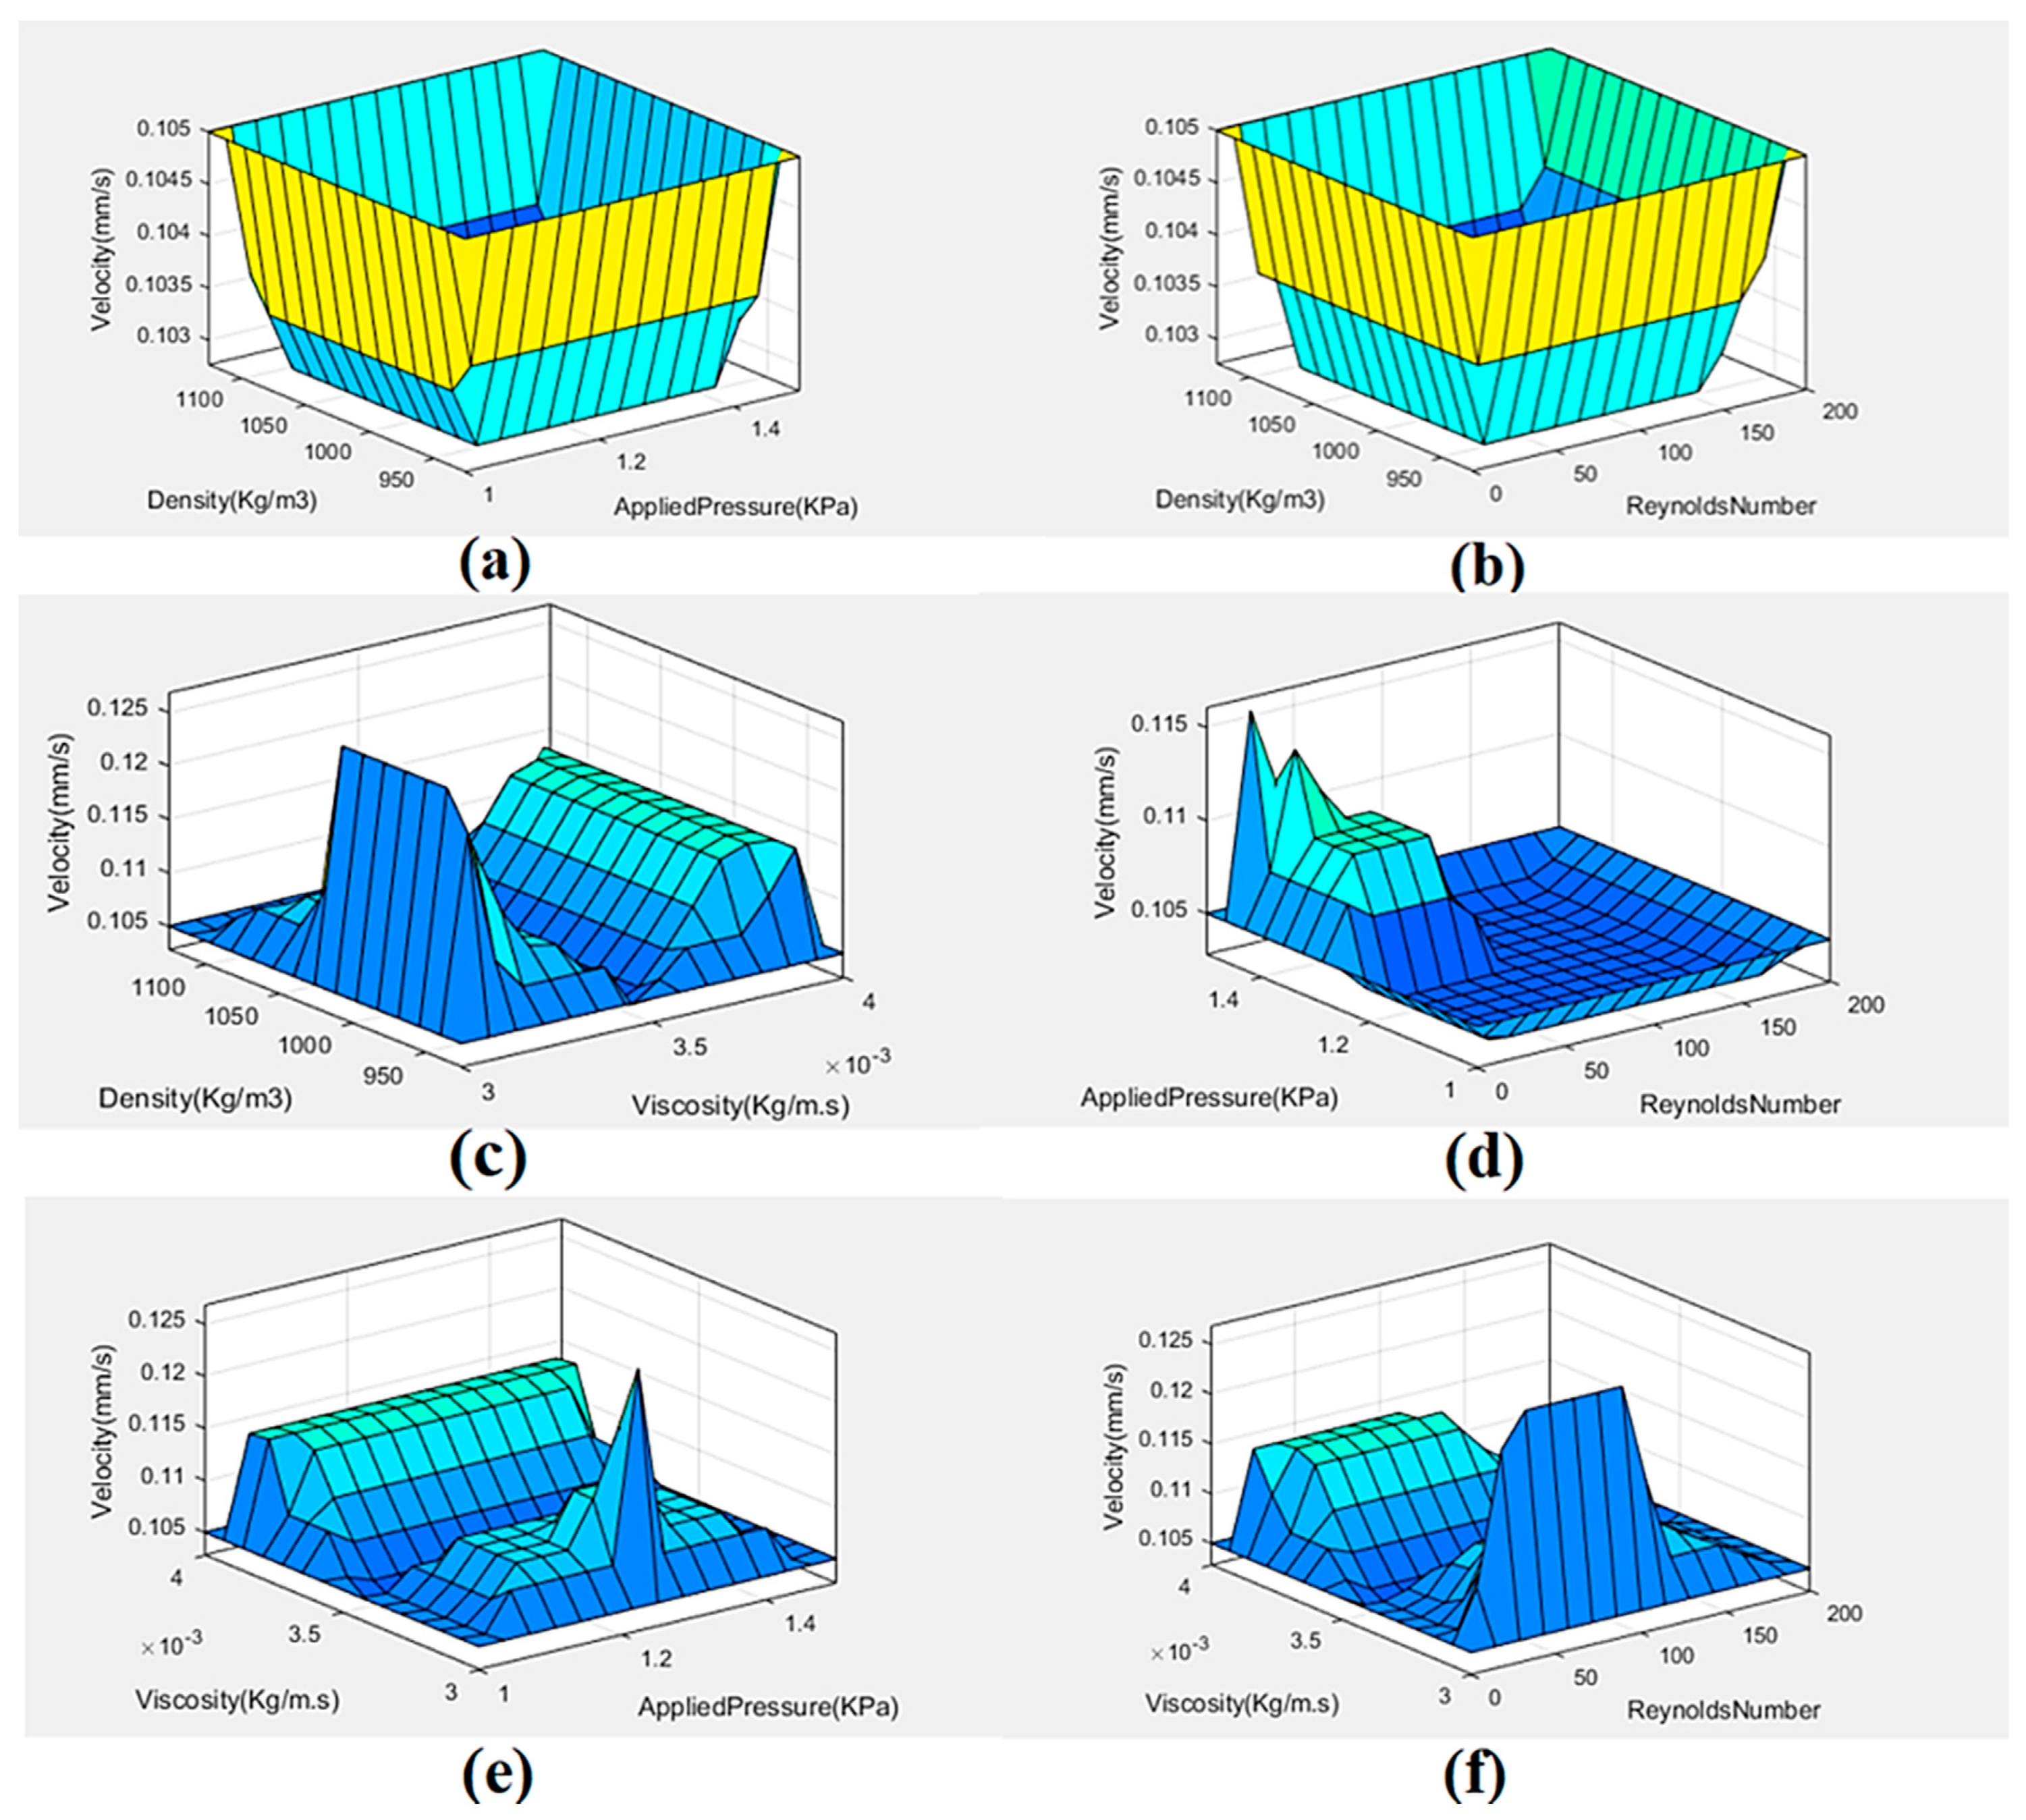
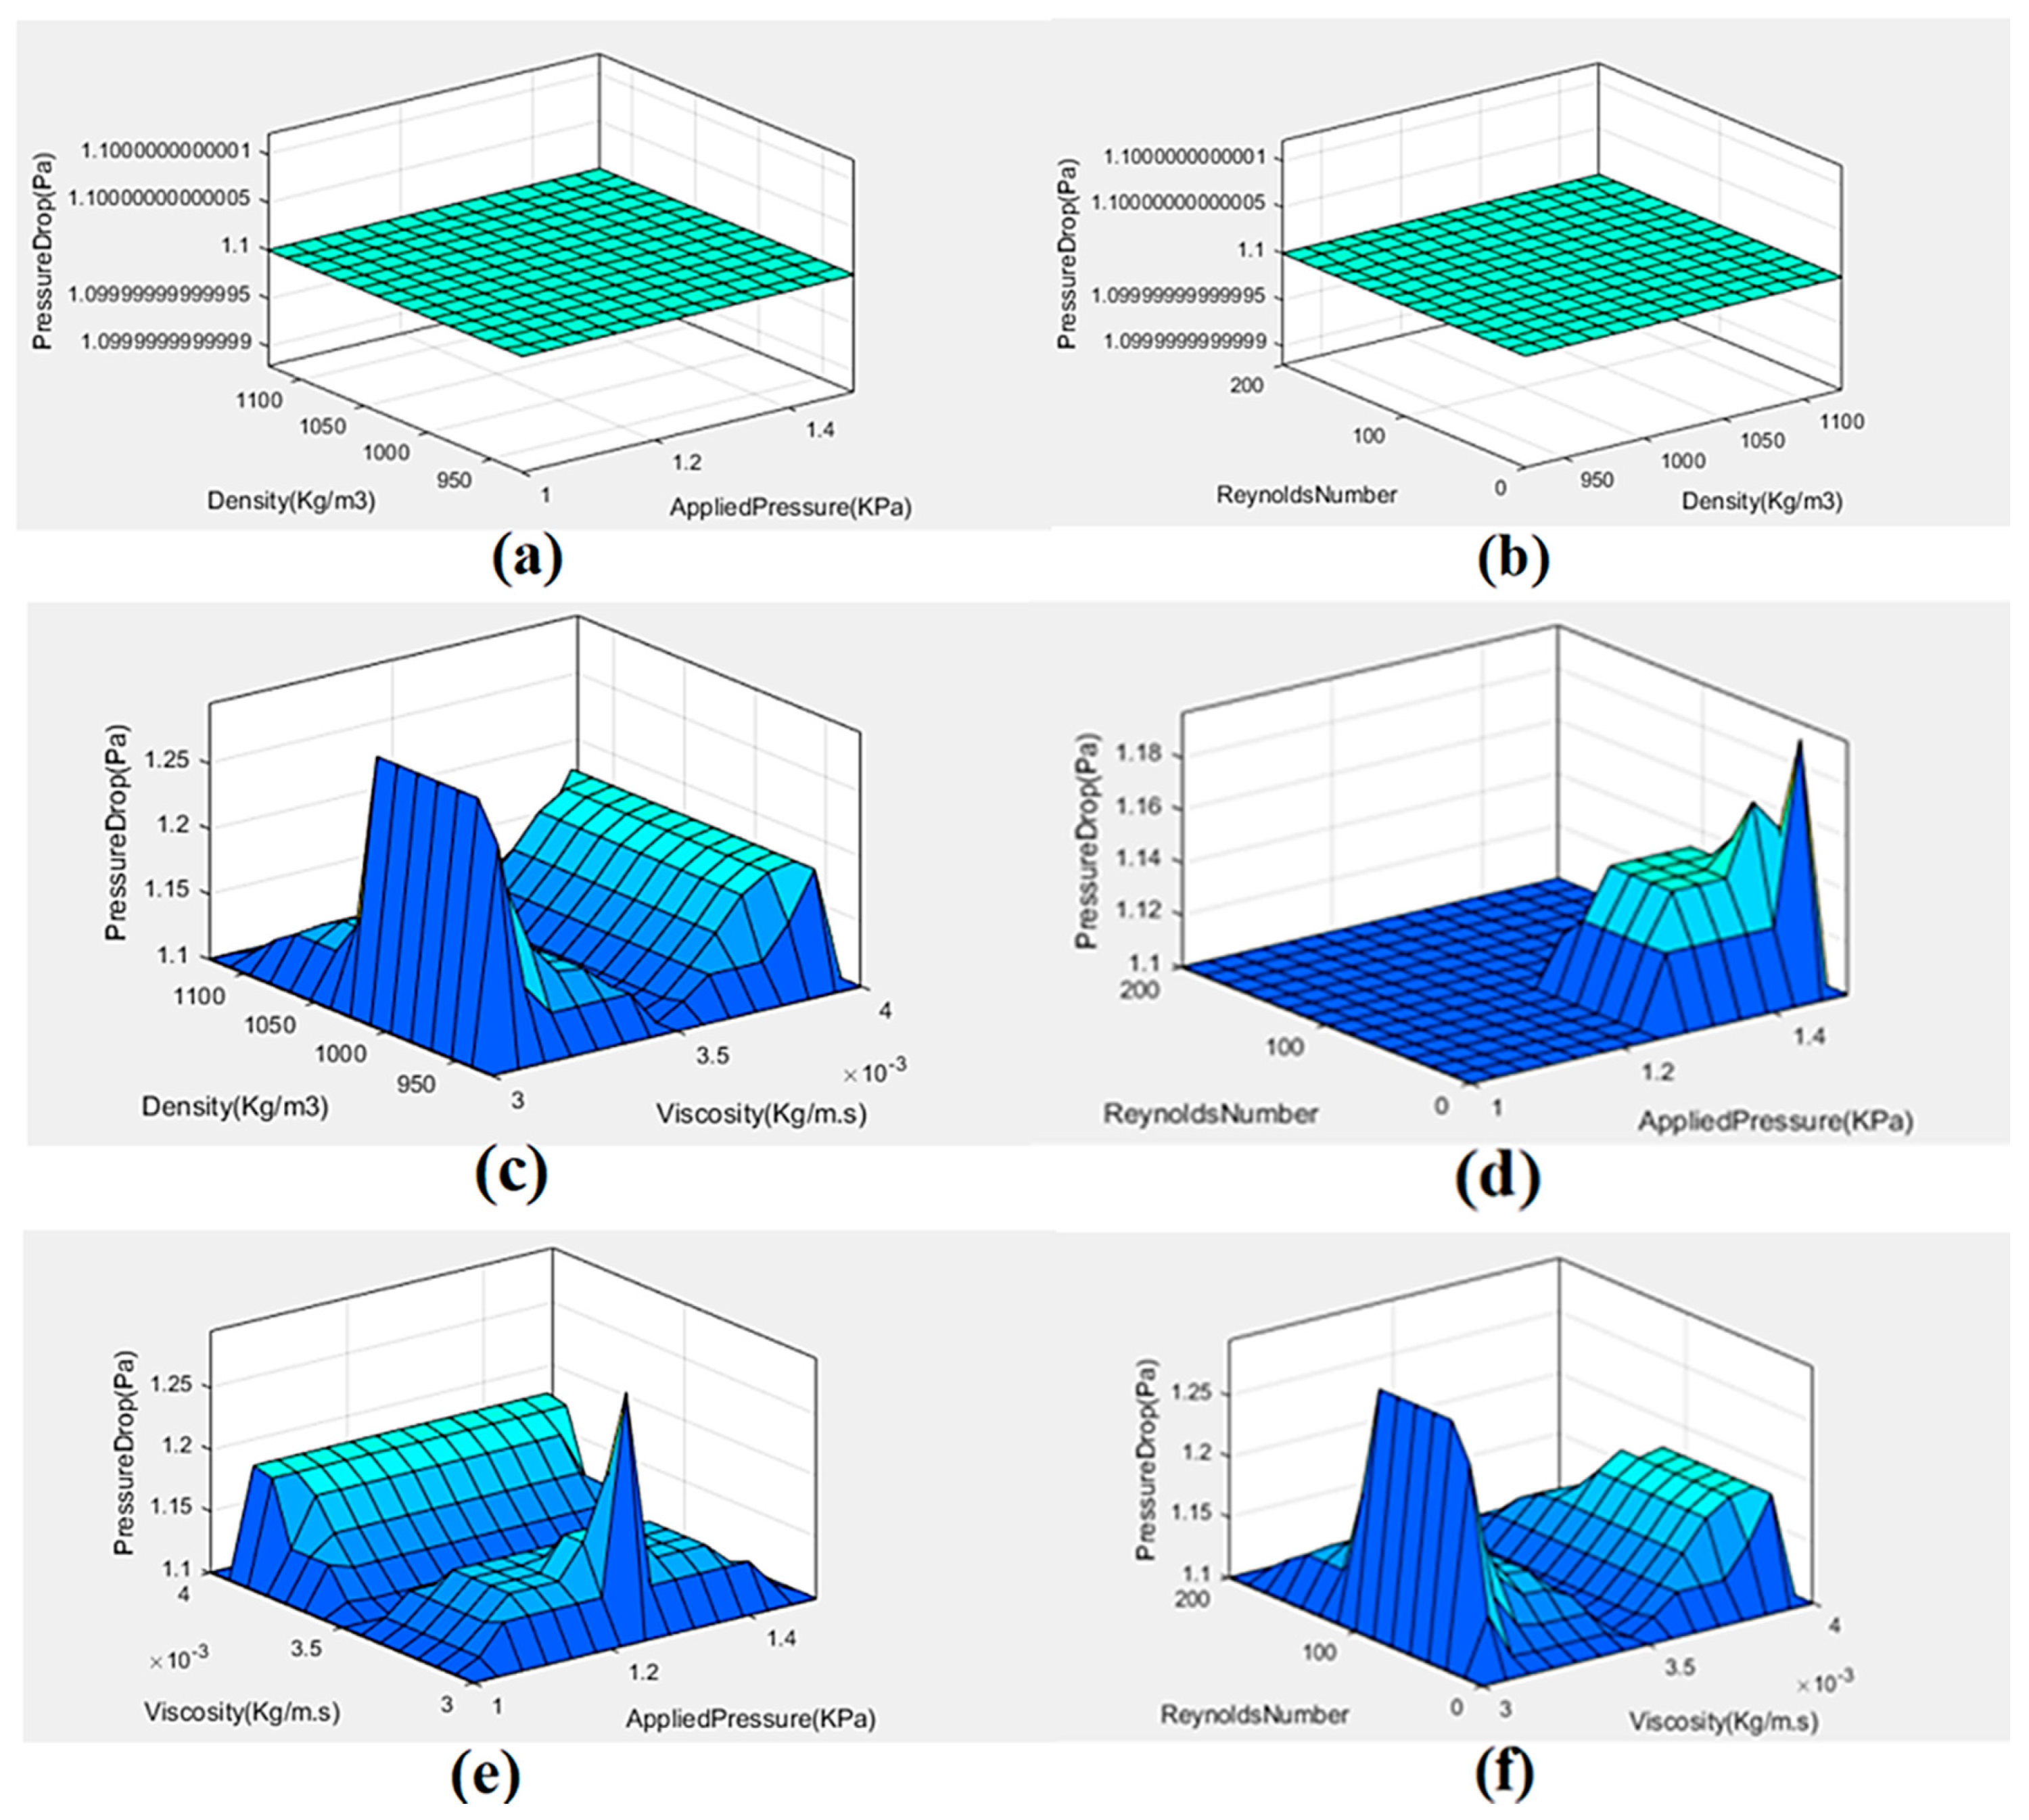
2. Fuzzy Logic Simulation for 5CACMC and 5CDCMC
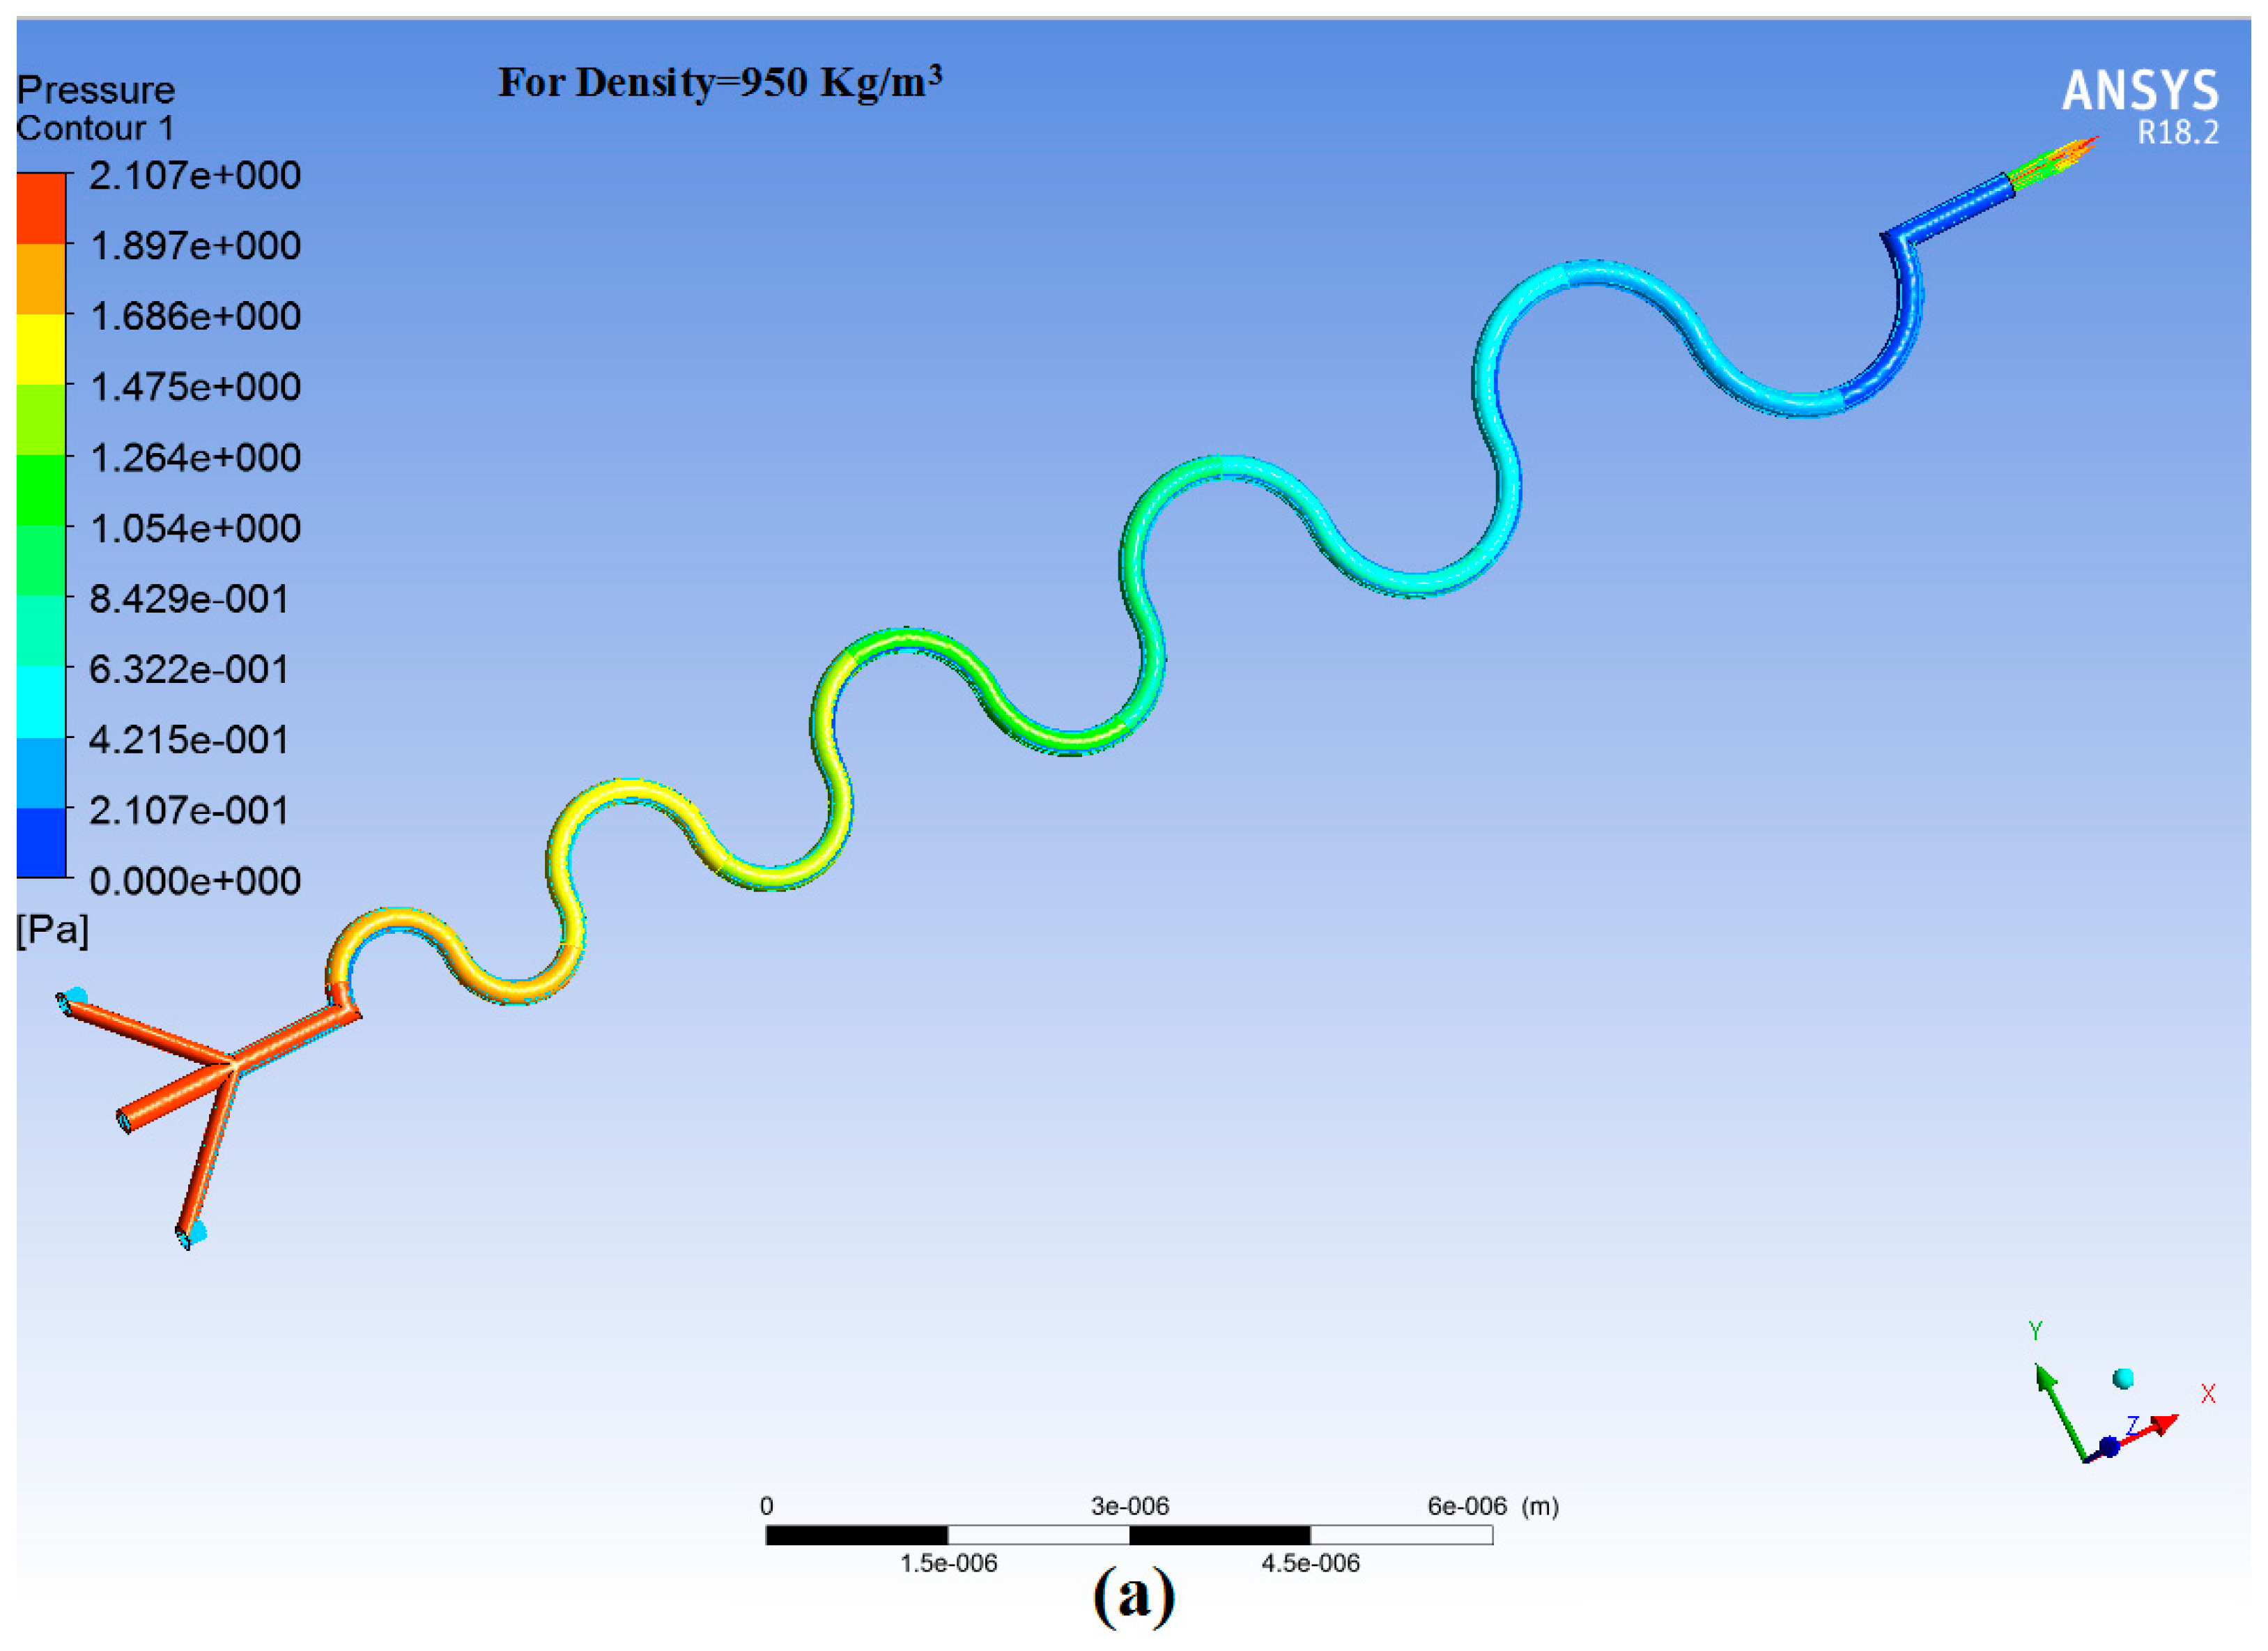
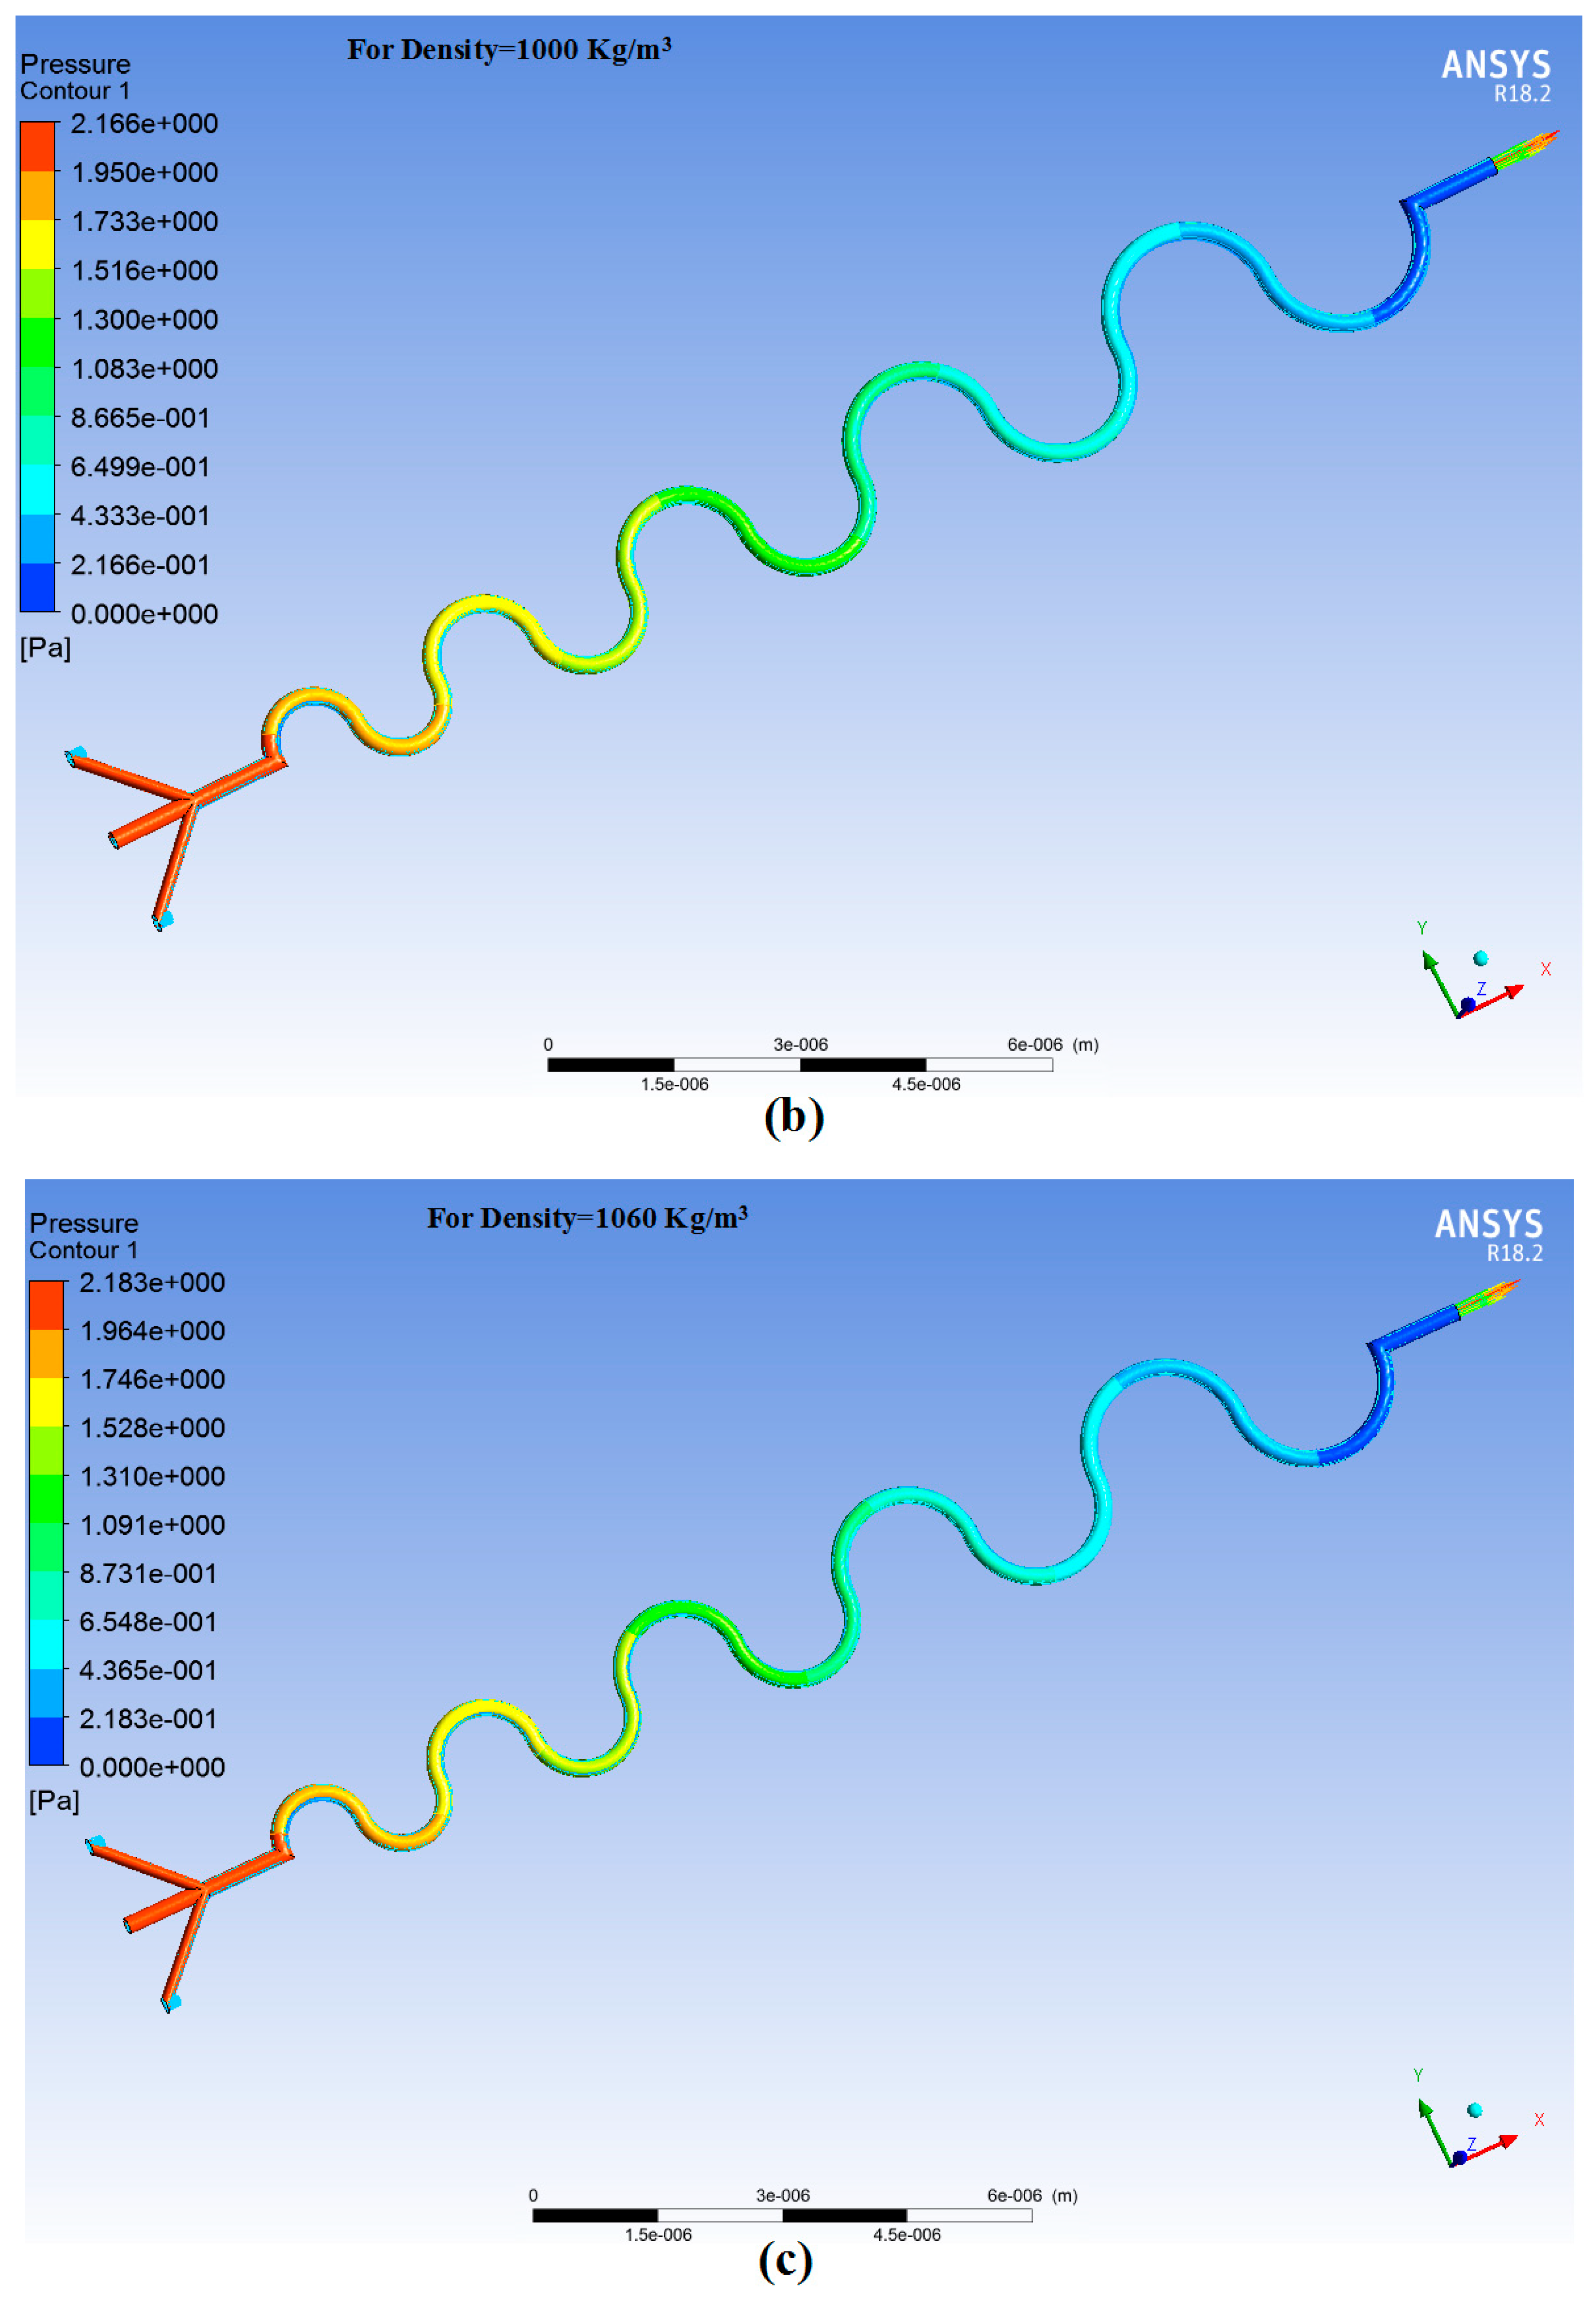
3. ANSYS Simulation of 5CACMC and 5CDCMC
4. Fabrication
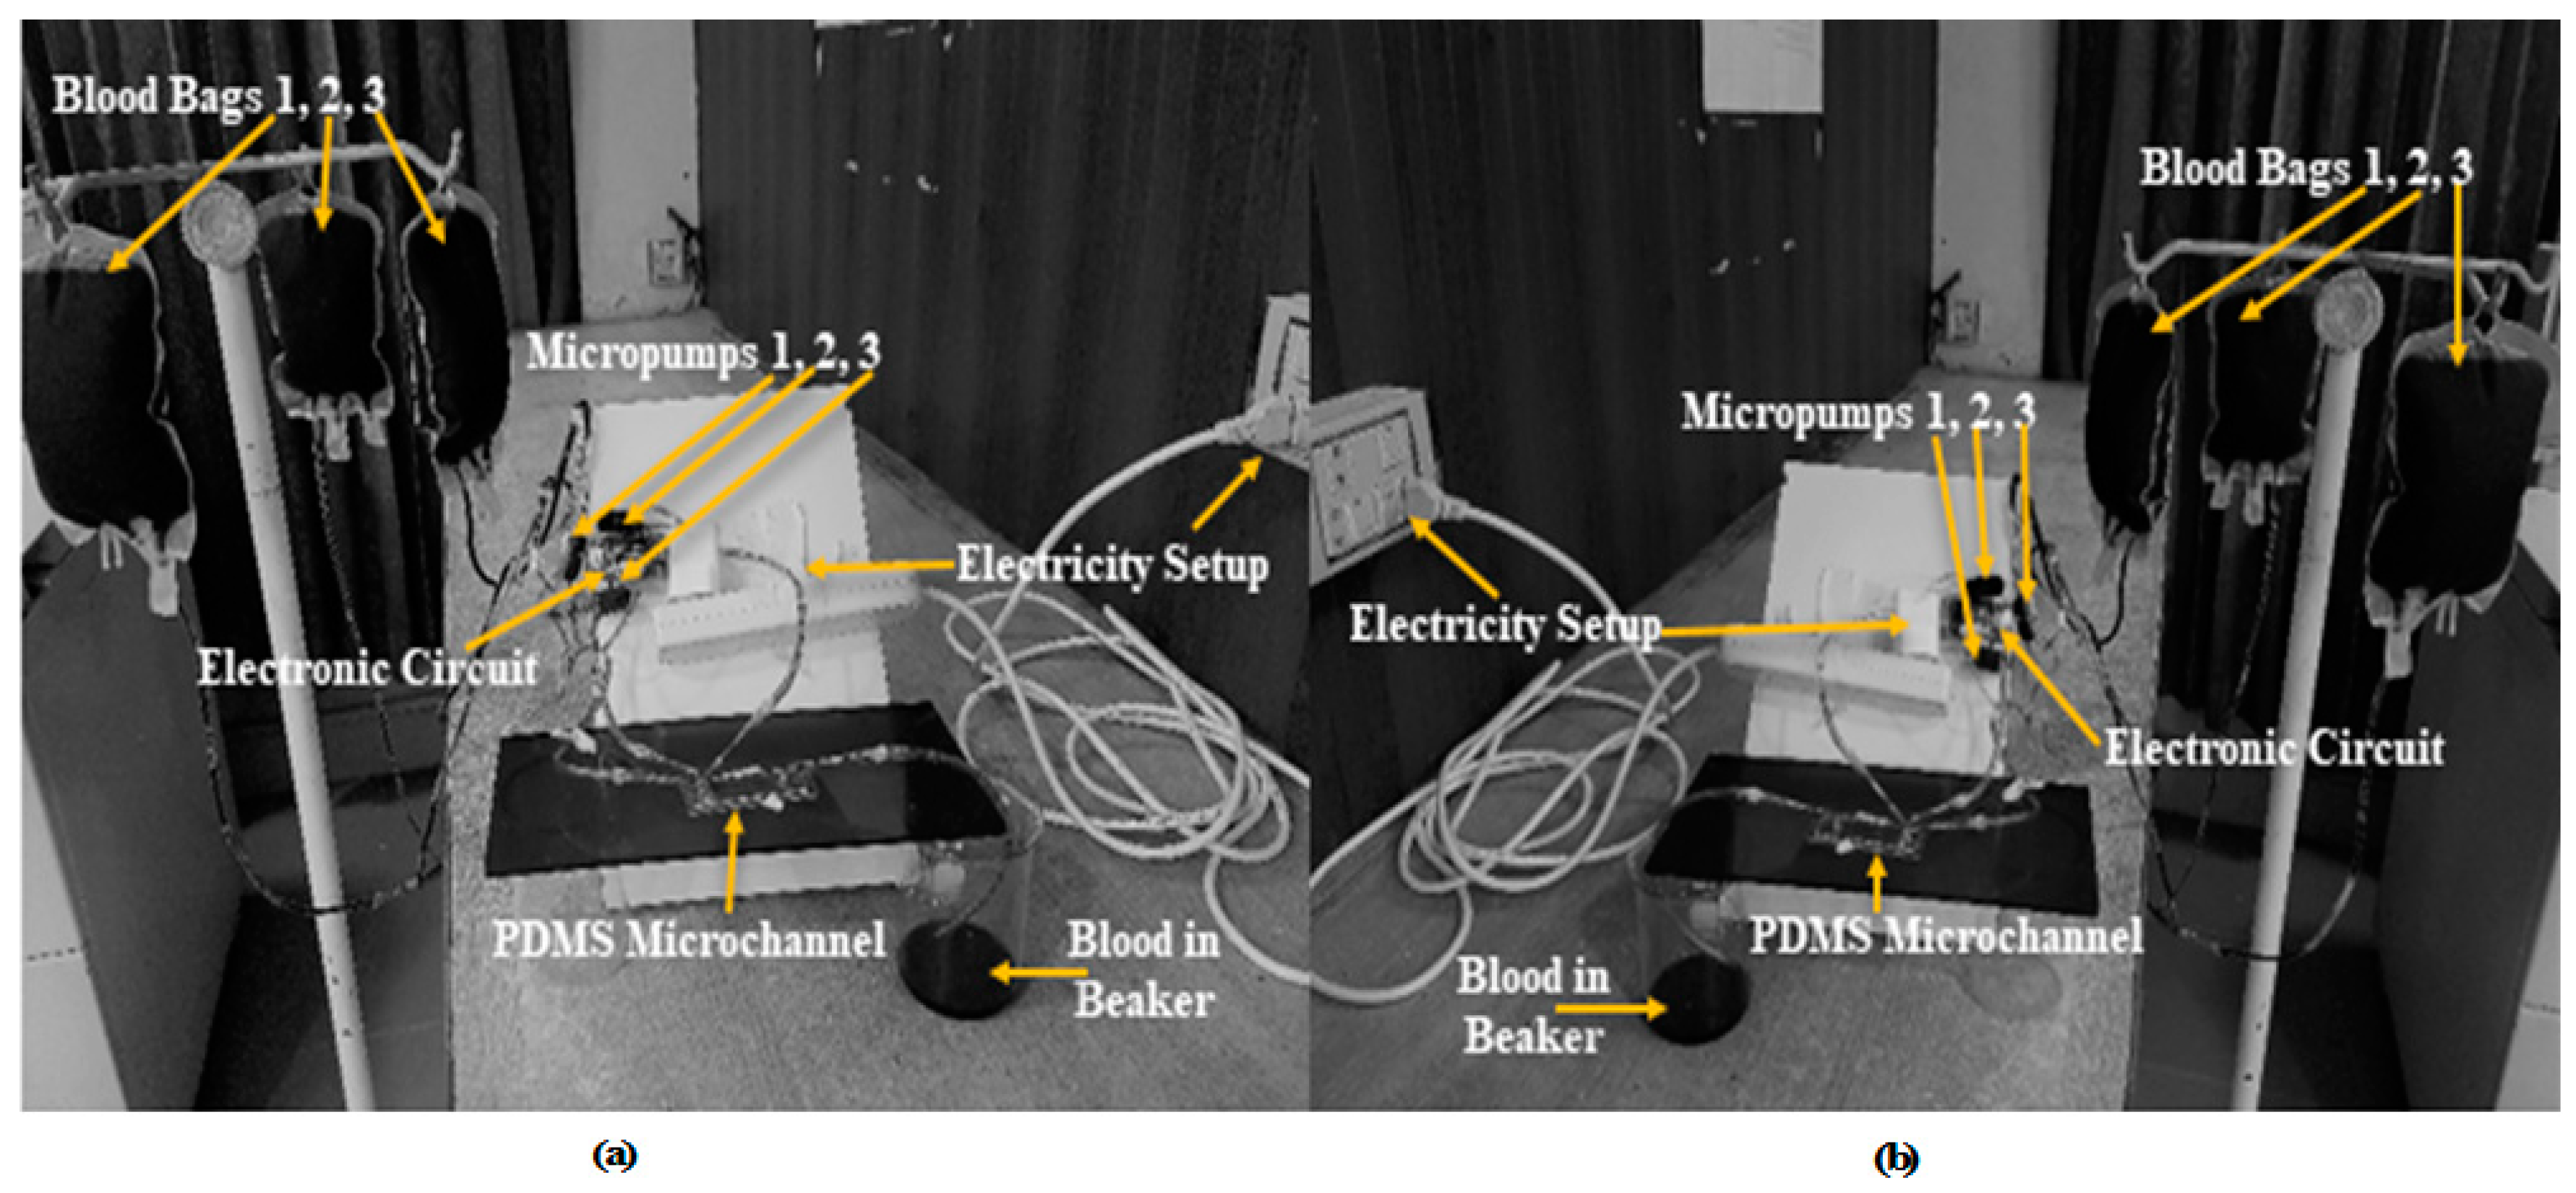
5. Experimental Verification of Simulation Results
6. Results and Discussion
7. Conclusions
- Simulation was conducted with the real and natural conditions by MATLAB and ANSYS.
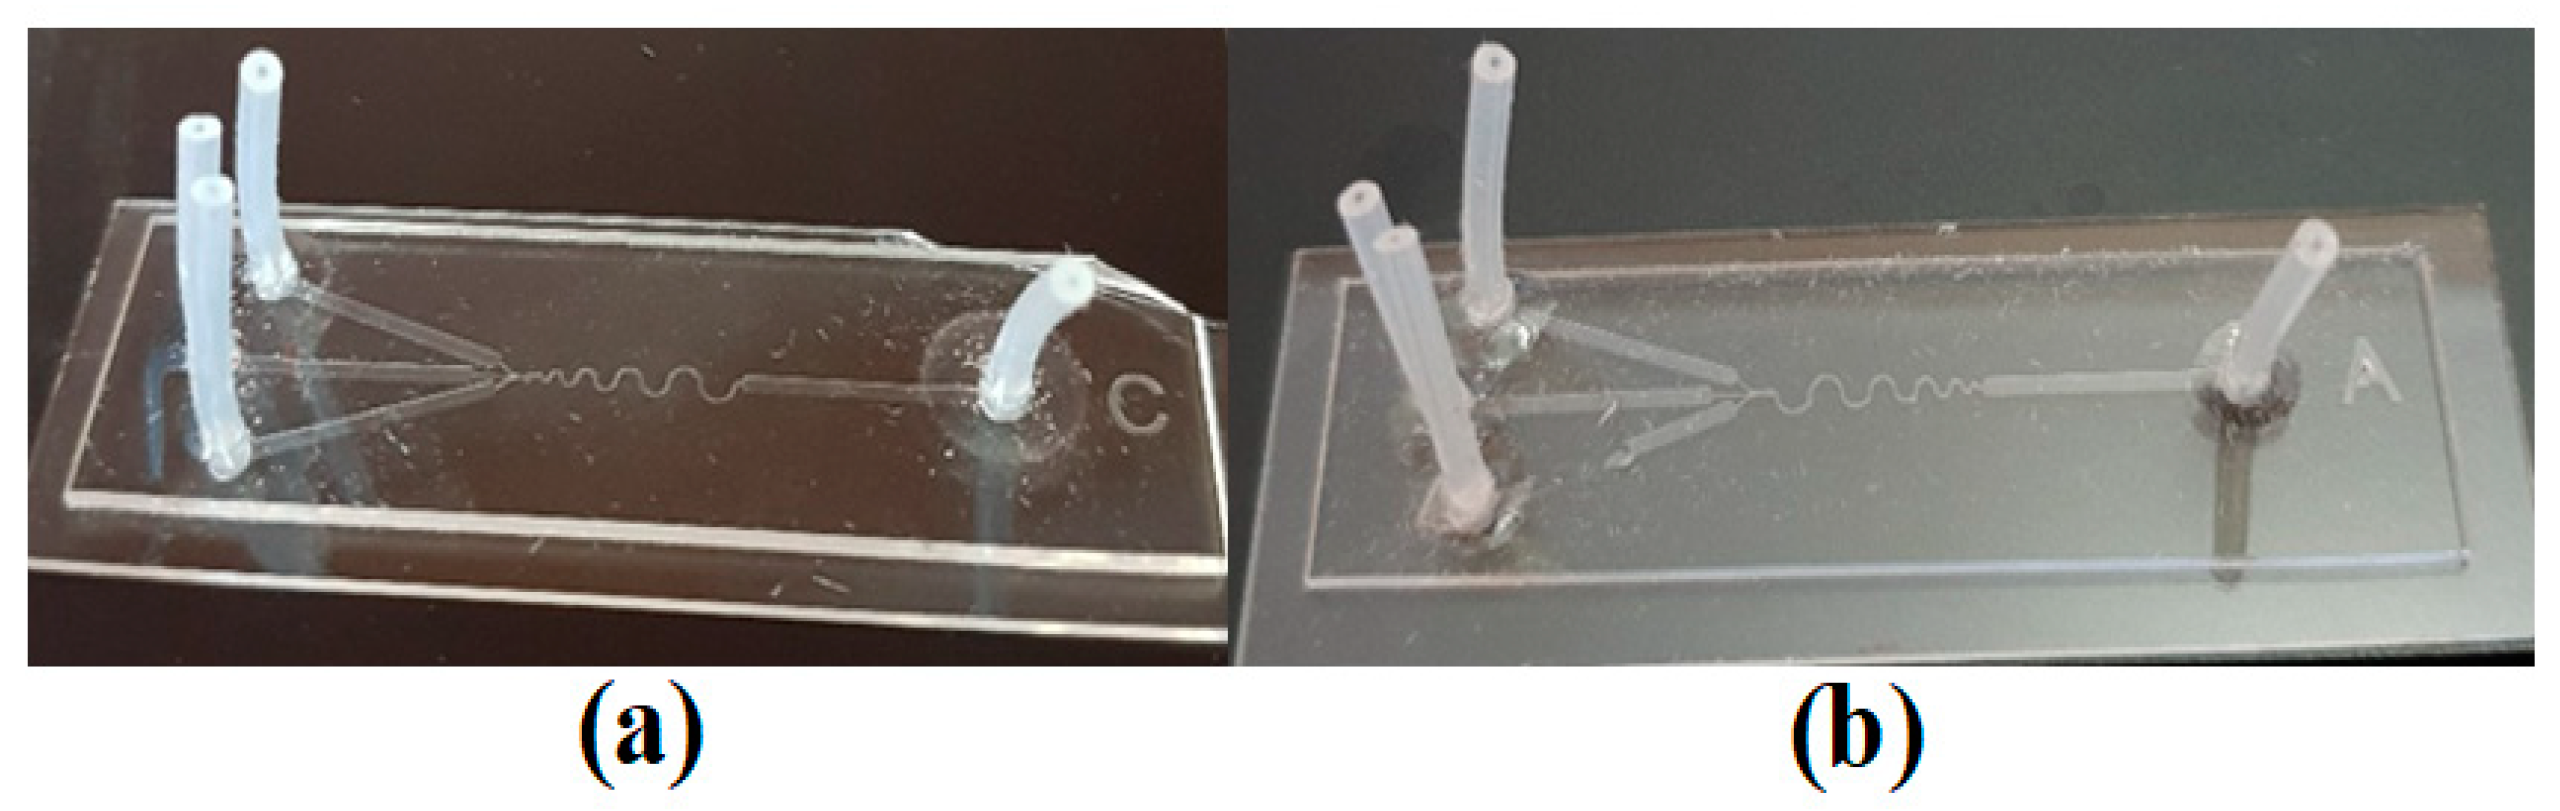
- After simulated results, the fabrication of 5CACMC and 5CDCMC with PDMS material has been completed.
- An experimental confirmation has been done for both channels. These bioengineered veins could be inflated and become swollen with blood flow just like healthy veins because of the high flexibility of thin PDMS veins.
- These channels must be separated from the substrate for the surgical option.
- The fabricated PDMS microchannels could be a good alternative to varicose veins for good blood flow.
Author Contributions
Funding
Conflicts of Interest
References
- Yuan, Y.; Feng, S.; Alahi, M.E.E.; Nag, A.; Afsarimanesh, N.; Zhang, H.; He, S. Development of an Internet of Things Based Electrochemical Microfluidic System for Free Calcium Detection. Appl. Sci. 2018, 8, 1357. [Google Scholar] [CrossRef] [Green Version]
- Mahesh, C.; Arumugam, A.; Kannan, E.; Logesh, K. Atmospheric-temperature-based cooling system control for electronic devices using internet of things. Int. J. Ambient Energy 2020, 41, 112–116. [Google Scholar] [CrossRef]
- Narendran, G.; Gnanasekaran, N.; Perumal, D.A. A review on recent advances in microchannel heat sink configurations. Recent Pat. Mech. Eng. 2018, 11, 190–215. [Google Scholar] [CrossRef]
- Dudala, S.; Dubey, S.K.; Goel, S. Microfluidic Soil Nutrient Detection System: Integrating Nitrite, pH and Electrical Conductivity Detection. IEEE Sens. J. 2020, 20, 4504–4511. [Google Scholar] [CrossRef]
- Fehring, T.K.; Chaffin, J.H., III; Kennedy, R.L. Enhanced Biocompatible Implants and Alloys. Google Patents US6187045B1, 13 February 2001. [Google Scholar]
- Dalle Mura, M.; Dini, G.; Lanzetta, M.; Rossi, A. An Experimental Analysis of Laser Machining for Dental Implants. Procedia CIRP 2018, 67, 356–361. [Google Scholar] [CrossRef]
- Kheir, J.N.; Leslie, L.F.; Fulmer, N.L.; Edlich, R.F.; Gampper, T.J. Polydimethylsiloxane for augmentation of the chin, malar, and nasal bones. J. Long-Term Eff. Med. Implant. 1998, 8, 55–67. [Google Scholar]
- Ashraf, M.W.; Tayyaba, S.; Afzulpurkar, N.; Nisar, A. Fabrication and analysis of tapered tip silicon microneedles for mems based drug delivery system. Sens. Transducers 2010, 122, 158. [Google Scholar]
- Ashraf, M.W.; Tayyaba, S.; Afzulpurkar, N.; Nisar, A.; Bohez, E.L.; Tuantranont, A. Structural and microfluidic analysis of MEMS based out-of-plane hollow silicon microneedle array for drug delivery. In Proceedings of the 2010 IEEE Conference on Automation Science and Engineering (CASE), Toronto, ON, Canada, 21–24 August 2010; pp. 258–262. [Google Scholar]
- Tayyaba, S.; Ashraf, M.W.; Afzulpurkar, N. Simulation and fabrication of blood filtration system for patients with kidney diseases. IET Commun. 2012, 6, 3213–3221. [Google Scholar] [CrossRef]
- Tayyaba, S.; Ashraf, M.W.; Khan, M.S.; Afzulpurkar, N.; Imran, M. Sinusoidal Microchannel Simulation for Cell Sorting System. Bahria Univ. J. Inf. Commun. Technol. 2013, 6, 37. [Google Scholar]
- Afzal, M.J.; Tayyaba, S.; Ashraf, M.W.; Sarwar, G. Simulation of fuzzy based flow controller in ascending sinusoidal microchannels. In Proceedings of the 2016 2nd International Conference on Robotics and Artificial Intelligence (ICRAI), Rawalpindi, Pakistan, 1–2 November 2016; pp. 141–146. [Google Scholar]
- Hanabusa, K.; Nakashima, M.; Funatsu, E.; Kishi, S.; Suzuki, M. A Safe, Simple, and Facile Staining Method Using Polysiloxanes for High-Contrast Visualization of Gelator Aggregates by Transmission Electron Microscopy. Bull. Chem. Soc. Jpn. 2018, 91, 1176–1185. [Google Scholar] [CrossRef]
- Chen, J.; Fine, J.D.; Mullin, C.A. Are organosilicon surfactants safe for bees or humans? Sci. Total Environ. 2018, 612, 415–421. [Google Scholar] [CrossRef]
- Norfatriah, A.; Syamaizar, A.S.A.; Zuruzi, A.S. Application of Porous Polydimethylsiloxane (PDMS) in oil absorption. In Proceedings of the IOP Conference Series: Materials Science and Engineering, Pekan, Malaysia, 1–2 March 2018; p. 012050. [Google Scholar]
- Liu, C.; Zhang, Q.; Wang, D.; Zhao, G.; Cai, X.; Li, L.; Ding, H.; Zhang, K.; Wang, H.; Kong, D. High Performance, Biocompatible Dielectric Thin-Film Optical Filters Integrated with Flexible Substrates and Microscale Optoelectronic Devices. Adv. Opt. Mater. 2018, 6, 1800146. [Google Scholar] [CrossRef]
- Stevens, M.M. Biomaterials for bone tissue engineering. Mater. Today 2008, 11, 18–25. [Google Scholar] [CrossRef]
- Hastings, G. Biomaterials and artificial organs: Royal College of Surgeons, London, 7 March 1980. Med. Eng. Phys. 1980, 2, 229–230. [Google Scholar]
- Burg, K.J.; Porter, S.; Kellam, J.F. Biomaterial developments for bone tissue engineering. Biomaterials 2000, 21, 2347–2359. [Google Scholar] [CrossRef]
- Rahman, N.A.A.; Matori, K.A.; Zaid, M.H.M.; Zainuddin, N.; Ab Aziz, S.; Khiri, M.Z.A.; Jalil, R.A.; Jusoh, W.N.W. Fabrication of Alumino-Silicate-Fluoride based bioglass derived from waste clam shell and soda lime silica glasses. Results Phys. 2019, 12, 743–747. [Google Scholar] [CrossRef]
- Pocivavsek, L.; Ye, S.H.; Pugar, J.; Tzeng, E.; Cerda, E.; Velankar, S.; Wagner, W.R. Active wrinkles to drive self-cleaning: A strategy for anti-thrombotic surfaces for vascular grafts. Biomaterials 2019, 192, 226–234. [Google Scholar] [CrossRef]
- Kim, H.S.; Kim, D.Y.; Kwak, J.H.; Kim, J.H.; Choi, M.; Kim, D.H.; Lee, D.W.; Kong, D.S.; Park, J.; Jung, S. Microwave-welded single-walled carbon nanotubes as suitable electrodes for triboelectric energy harvesting from biomaterials and bioproducts. Nano Energy 2019, 56, 338–346. [Google Scholar] [CrossRef]
- Middleton, J.C.; Tipton, A.J. Synthetic biodegradable polymers as orthopedic devices. Biomaterials 2000, 21, 2335–2346. [Google Scholar] [CrossRef]
- Fang, J.; Fowler, P.; Escrig, C.; Gonzalez, R.; Costa, J.; Chamudis, L. Development of biodegradable laminate films derived from naturally occurring carbohydrate polymers. Carbohydr. Polym. 2005, 60, 39–42. [Google Scholar] [CrossRef]
- Costoya, A.; Becerra, L.E.V.; Meléndez-Ortiz, H.I.; Díaz-Gómez, L.; Mayer, C.; Otero, A.; Concheiro, A.; Bucio, E.; Alvarez-Lorenzo, C. Immobilization of antimicrobial and anti-quorum sensing enzymes onto GMA-grafted poly (vinyl chloride) catheters. Int. J. Pharm. 2019, 558, 72–81. [Google Scholar] [CrossRef]
- Ramachandran, B.; Chakraborty, S.; Kannan, R.; Dixit, M.; Muthuvijayan, V. Immobilization of hyaluronic acid from Lactococcus lactis on polyethylene terephthalate for improved biocompatibility and drug release. Carbohydr. Polym. 2019, 206, 132–140. [Google Scholar] [CrossRef]
- Orenstein, S.B. Permanent Prosthetics: Polypropylene, Polyester, ePTFE, and Hybrid Mesh. In The SAGES Manual of Hernia Surgery; Springer: Berlin/Heidelberg, Germany, 2019; pp. 57–69. [Google Scholar]
- Caplin, J.D.; García, A.J. Implantable Antimicrobial Biomaterials for Local Drug Delivery in Bone Infection Models. Acta Biomater. 2019, 93, 2–11. [Google Scholar] [CrossRef]
- Sefat, F.; Raja, T.I.; Moghadam, Z.S.; Milan, P.B.; Samadikuchaksaraei, A.; Mozafari, M. Nanoengineered biomaterials for bladder regeneration. In Nanoengineered Biomaterials for Regenerative Medicine; Elsevier: Berlin/Heidelberg, Germany, 2019; pp. 459–474. [Google Scholar]
- Navaei, T.; Milan, P.B.; Davari, H.R.; Samadikuchaksaraei, A.; Mozafari, M. Nanoengineered biomaterials for diaphragm regeneration. In Nanoengineered Biomaterials for Regenerative Medicine; Elsevier: Berlin/Heidelberg, Germany, 2019; pp. 345–362. [Google Scholar]
- Oran, D.C.; Gokulu, I.S.; Kizilel, S. Nanoengineered biomaterials for pancreas regeneration. In Nanoengineered Biomaterials for Regenerative Medicine; Elsevier: Berlin/Heidelberg, Germany, 2019; pp. 443–457. [Google Scholar]
- Zhao, W.; He, B.; Zhou, A.; Li, Y.; Chen, X.; Yang, Q.; Chen, B.; Qiao, B.; Jiang, D. D-RADA16-RGD-Reinforced Nano-Hydroxyapatite/Polyamide 66 Ternary Biomaterial for Bone Formation. Tissue Eng. Regen. Med. 2019, 16, 177–189. [Google Scholar] [CrossRef]
- Zhu, Y.; Wagner, W.R. Design Principles in Biomaterials and Scaffolds. In Principles of Regenerative Medicine; Elsevier: Berlin/Heidelberg, Germany, 2019; pp. 505–522. [Google Scholar]
- Ji, M.; Chen, X.; Luo, J.; Wan, Y. Improved blood compatibility of polysulfone membrane by anticoagulant protein immobilization. Colloids Surf. B Biointerfaces 2019, 175, 586–595. [Google Scholar] [CrossRef]
- Sun, T.; Guo, X.; Zhong, R.; Ma, L.; Li, H.; Gu, Z.; Guan, J.; Tan, H.; You, C.; Tian, M. Interactions of oligochitosan with blood components. Int. J. Biol. Macromol. 2019, 124, 304–313. [Google Scholar] [CrossRef]
- Hannula, M.; Narra, N.; Paakinaho, K.; Haaparanta, A.M.; Kellomäki, M.; Hyttinen, J. µCT Based Characterization of Biomaterial Scaffold Microstructure Under Compression. In Proceedings of the World Congress on Medical Physics and Biomedical Engineering, Prague, Czech Republic, 3–8 June 2018; pp. 165–169. [Google Scholar]
- Zhang, C.; Yuan, Y.; Fang, L.; Xuan, Y. Promotion of osteogenesis by bioactive glass–ceramic coating: Possible involvement of the Hedgehog signaling pathway. J. Orthop. Sci. 2019, 24, 731–736. [Google Scholar] [CrossRef]
- Nate, K.; Tentzeris, M.M. A novel 3-D printed loop antenna using flexible NinjaFlex material for wearable and IoT applications. In Proceedings of the 2015 IEEE 24th Electrical Performance of Electronic Packaging and Systems (EPEPS), San Jose, CA, USA, 25–28 October 2015; pp. 171–174. [Google Scholar]
- Paracha, K.N.; Butt, A.D.; Alghamdi, A.S.; Babale, S.A.; Soh, P.J. Liquid Metal Antennas: Materials, Fabrication and Applications. Sensors 2020, 20, 177. [Google Scholar] [CrossRef] [Green Version]
- He, S.; Feng, S.; Nag, A.; Afsarimanesh, N.; Han, T.; Mukhopadhyay, S.C. Recent Progress in 3D Printed Mold-Based Sensors. Sensors 2020, 20, 703. [Google Scholar] [CrossRef] [Green Version]
- Langer, K.; Jönsson, H. DRAFT-Robotic automation of production and the recovery of cell spheroids. BioRxiv 2019, 552687. [Google Scholar] [CrossRef]
- Afzal, M.J.; Tayyaba, S.; Ashraf, M.W.; Hossain, M.K.; Uddin, M.J.; Afzulpurkar, N. Simulation, Fabrication and Analysis of Silver Based Ascending Sinusoidal Microchannel (ASMC) for Implant of Varicose Veins. Micromachines 2017, 8, 278. [Google Scholar] [CrossRef] [Green Version]
- Afzal, M.J.; Ashraf, M.W.; Tayyaba, S.; Hossain, M.K.; Afzulpurkar, N. Sinusoidal Microchannel with Descending Curves for Varicose Veins Implantation. Micromachines 2018, 9, 59. [Google Scholar] [CrossRef] [Green Version]
- Morent, R.; De Geyter, N.; Axisa, F.; De Smet, N.; Gengembre, L.; De Leersnyder, E.; Leys, C.; Vanfleteren, J.; Rymarczyk-Machal, M.; Schacht, E. Adhesion enhancement by a dielectric barrier discharge of PDMS used for flexible and stretchable electronics. J. Phys. D Appl. Phys. 2007, 40, 7392. [Google Scholar] [CrossRef]
- Cong, H.; Pan, T. Microfabrication of conductive PDMS on flexible substrates for biomedical applications. In Proceedings of the 2009 4th IEEE International Conference on Nano/Micro Engineered and Molecular Systems, Shenzhen, China, 5–8 January 2009. [Google Scholar]
- Zhao, B.; Moore, J.S.; Beebe, D.J. Pressure-sensitive microfluidic gates fabricated by patterning surface free energies inside microchannels. Langmuir 2003, 19, 1873–1879. [Google Scholar] [CrossRef]
- Pinho, D.; Lima, R.; Pereira, A.I.; Gayubo, F. Automatic tracking of labeled red blood cells in microchannels. Int. J. Numer. Methods Biomed. Eng. 2013, 29, 977–987. [Google Scholar] [CrossRef] [Green Version]
- Chang, L.; Howdyshell, M.; Liao, W.C.; Chiang, C.L.; Gallego-Perez, D.; Yang, Z.; Lu, W.; Byrd, J.C.; Muthusamy, N.; Lee, L.J.; et al. Magnetic Tweezers-Based 3D Microchannel Electroporation for High-Throughput Gene Transfection in Living Cells. Small 2015, 11, 1818–1828. [Google Scholar] [CrossRef]
- Chen, C.H.; Lu, Y.; Sin, M.L.; Mach, K.E.; Zhang, D.D.; Gau, V.; Liao, J.C.; Wong, P.K. Antimicrobial susceptibility testing using high surface-to-volume ratio microchannels. Anal. Chem. 2010, 82, 1012–1019. [Google Scholar] [CrossRef] [Green Version]
- Li, J. Computational Analysis of Nanofluid Flow in Microchannels with Applications to Micro-Heat Sinks and bio-MEMS. Ph.D. Thesis, North Carolina State University, Raleigh, NC, USA, 2008. [Google Scholar]
- Laporte, M.; Montillet, A.; Belkadi, A.; Della Valle, D.; Loisel, C.; Riaublanc, A.; Hauser, J. Investigation of gas/shear-thinning liquids flow at high throughput in microchannels with the aim of producing biosourced foam. Chem. Eng. Process. Process Intensif. 2020, 148, 107787. [Google Scholar] [CrossRef]
- Perkins, J.J.; Perkins, B.J.J. Principles and Methods of Sterilization in Health Sciences; Academic Press Inc.: London, UK, 1969. [Google Scholar]
- White, L.J.; Keane, T.J.; Smoulder, A.; Zhang, L.; Castleton, A.A.; Reing, J.E.; Turner, N.J.; Dearth, C.L.; Badylak, S.F. The impact of sterilization upon extracellular matrix hydrogel structure and function. J. Immunol. Regen. Med. 2018, 2, 11–20. [Google Scholar] [CrossRef]
- Tipnis, N.P.; Burgess, D.J. Sterilization of implantable polymer-based medical devices: A review. Int. J. Pharm. 2018, 544, 455–460. [Google Scholar] [CrossRef]
- Laurencin, C.; Pierre-Jacques, H.; Langer, R. Toxicology and biocompatibility considerations in the evaluation of polymeric materials for biomedical applications. Clin. Lab. Med. 1990, 10, 549–570. [Google Scholar]
- Kim, S.H.; Moon, J.H.; Kim, J.H.; Jeong, S.M.; Lee, S.H. Flexible, stretchable and implantable PDMS encapsulated cable for implantable medical device. Biomed. Eng. Lett. 2011, 1, 199. [Google Scholar] [CrossRef]
- Teo, A.J.; Mishra, A.; Park, I.; Kim, Y.J.; Park, W.T.; Yoon, Y.J. Polymeric biomaterials for medical implants and devices. ACS Biomater. Sci. Eng. 2016, 2, 454–472. [Google Scholar] [CrossRef]
- Petrovskaya, T.; Toropkov, N.; Mironov, E.; Azarmi, F. 3D printed biocompatible polylactidehydroxyapatite based material for bone implants. Mater. Manuf. Process. 2018, 33, 1899–1904. [Google Scholar] [CrossRef]
- Colucci, F.; McKeegan, P.; Picton, H.; Pensabene, V. Mouse embryo assay to evaluate polydimethylsiloxane (PDMS) embryo-toxicity. In Proceedings of the IEEE 40th Annual International Conference of the Engineering in Medicine and Biology Society (EMBC 2018), Honolulu, Hawaii, 17–21 July 2018. [Google Scholar]
- Siproudhis, L.; Morcet, J.; Laine, F. Elastomer implants in faecal incontinence: A blind, randomized placebo-controlled study. Aliment. Pharmacol. Ther. 2007, 25, 1125–1132. [Google Scholar] [CrossRef]
- Losi, P.; Munaò, A.; Spiller, D.; Briganti, E.; Martinelli, I.; Scoccianti, M.; Soldani, G. Evaluation of a new composite prosthesis for the repair of abdominal wall defects. J. Mater. Sci. Mater. Med. 2007, 18, 1939–1944. [Google Scholar] [CrossRef]
- Tunc, M.; Humayun, M.; Cheng, X.; Ratner, B.D. A reversible thermosensitive adhesive for retinal implants: In vivo experience with plasma-deposited poly (N-isopropyl acrylamide). Retina 2008, 28, 1338–1343. [Google Scholar] [CrossRef]
- Kuo, C.K.; Marturano, J.E.; Tuan, R.S. Novel strategies in tendon and ligament tissue engineering: Advanced biomaterials and regeneration motifs. BMC Sports Sci. Med. Rehabil. 2010, 2, 20. [Google Scholar] [CrossRef] [Green Version]
- Defrere, S.; Mestagdt, M.; Riva, R.; Krier, F.; van Langendonckt, A.; Drion, P.; Jerome, C.; Evrard, B.; Dehoux, J.; Foidart, J.; et al. In vivo biocompatibility of three potential intraperitoneal implants. Macromol. Biosci. 2011, 11, 1336–1345. [Google Scholar] [CrossRef]
- França, D.C.C.; de Castro, A.L.; Soubhia, A.M.P. Evaluation of the Biocompatibility of Silicone Gel Implants–Histomorphometric Study. Acta Inform. Med. 2013, 21, 93. [Google Scholar] [CrossRef] [Green Version]
- Suchý, T.; Rýglová, Š.; Balík, K.; Smetana, K.; Šupová, M.; Sucharda, Z.; Filová, E.; Havlíková, J.; Bačáková, L.; Martynková, G.S. Biological evaluation of polydimethylsiloxane modified by calcium phosphate nanoparticles for potential application in spine surgery. Sci. Adv. Mater. 2013, 5, 484–493. [Google Scholar] [CrossRef]
- Lim, E.H.; Sardinha, J.P.; Myers, S. Nanotechnology biomimetic cartilage regenerative scaffolds. Arch. Plast. Surg. 2014, 41, 231. [Google Scholar] [CrossRef]
- Singh, J.; Inaty, H.; Mukhopadhyay, S.; Mehta, A.C. Chronic Pulmonary Silicone Embolism from Breast Augmentation Is Not a Common Finding in Explanted Lungs. Pulm. Med. 2018, 2018, 1–5. [Google Scholar] [CrossRef]
- Zhang, B.; Lai, B.F.L.; Xie, R.; Huyer, L.D.; Montgomery, M.; Radisic, M. Microfabrication of AngioChip, a biodegradable polymer scaffold with microfluidic vasculature. Nat. Protoc. 2018, 13, 1793–1813. [Google Scholar] [CrossRef]
- Holmes, G. Augmented Reality Assisted Orthopaedic Surgery. Master’s Thesis, Stellenbosch University, Stellenbosch, South Africa, 2018. [Google Scholar]
- Merrill, E.W.; Pelletier, G.A. Viscosity of human blood: Transition from Newtonian to non-Newtonian. J. Appl. Physiol. 1967, 23, 178–182. [Google Scholar] [CrossRef]
- Athanasiou, K.A.; Niederauer, G.G.; Agrawal, C.M. Sterilization, toxicity, biocompatibility and clinical applications of polylactic acid/polyglycolic acid copolymers. Biomaterials 1996, 17, 93–102. [Google Scholar] [CrossRef]
- Tayyaba, S.; Afzal, M.J.; Sarwar, G.; Ashraf, M.W.; Afzulpurkar, N. Simulation of flow control in straight microchannels using fuzzy logic. In Proceedings of the 2016 International Conference on Computing, Electronic and Electrical Engineering (ICE Cube), Quetta, Pakistan, 11–12 April 2016; pp. 213–216. [Google Scholar]
- Afzal, M.J.; Javaid, F.; Tayyaba, S.; Ashraf, M.W.; Ashiq, M.; Akhtar, A. Simulation of a Nanoneedle for Drug Delivery by Using MATLAB Fuzzy Logic. Biologia 2018, 64, 75. [Google Scholar]
- Afzal, M.J.; Javaid, F.; Tayyaba, S.; Ashraf, M.W.; Punyasai, C.; Afzulpurkar, N. Study of Charging the Smart Phone by Human Movements by Using MATLAB Fuzzy Technique. In Proceedings of the 2018 15th International Conference on Electrical Engineering/Electronics, Computer, Telecommunications and Information Technology (ECTI-CON), Nakhonpathom, Thailand, 11–13 July 2018; pp. 411–414. [Google Scholar]
- Afzal, M.J.; Javaid, F.; Tayyaba, S.; Sabah, A.; Ashraf, M.W. Fluidic simulation for blood flow in five curved Spiral Microchannel. Biologia 2019, 65, 1. [Google Scholar]
- Ashraf, M.; Tayyaba, S.; Nisar, A.; Afzulpurkar, N.; Bodhale, D.; Lomas, T.; Poyai, A.; Tuantranont, A. Design, fabrication and analysis of silicon hollow microneedles for transdermal drug delivery system for treatment of hemodynamic dysfunctions. Cardiovasc. Eng. 2010, 10, 91–108. [Google Scholar] [CrossRef]
- Sivanandam, S.; Sumathi, S.; Deepa, S. Introduction to Fuzzy Logic Using MATLAB; Springer: Berlin/Heidelberg, Germany, 2007; Volume 1. [Google Scholar]
- Afzal, M.J.; Tayyaba, S.; Ashraf, M.W.; Hossain, M.K.; Afzulpurkar, N. Fluidic simulation and analysis of spiral, U-shape and curvilinear nano channels for biomedical application. In Proceedings of the 2017 IEEE International Conference on Manipulation, Manufacturing and Measurement on the Nanoscale (3M-NANO), Shanghai, China, 7–11 August 2017; pp. 190–194. [Google Scholar]
- Martinez, R.; Fierro, C.A.; Shireman, P.K.; Han, H.C. Mechanical buckling of veins under internal pressure. Ann. Biomed. Eng. 2010, 38, 1345–1353. [Google Scholar] [CrossRef] [PubMed]
- Wewala, W.; Kasi, J.K.; Kasi, A.K.; Afzulpurkar, N. Design, simulation and comparison of ascending and descending curvilinear microchannels for cancer cell separation from blood. Biomed. Eng. Appl. Basis Commun. 2013, 25, 1350037. [Google Scholar] [CrossRef]
- Germano, M. The Dean equations extended to a helical pipe flow. J. Fluid Mech. 1989, 203, 289–305. [Google Scholar] [CrossRef]
- Dean, W. LXXII. The stream-line motion of fluid in a curved pipe (Second paper). Lond. Edinb. Dublin Philos. Mag. J. Sci. 1928, 5, 673–695. [Google Scholar] [CrossRef]
- Storbeck, G.T.; Hingston, J.A.; Merkling, S.M.; Hiller, J.A.; Corcoran, K.; Manning, K.L.; Roye, G.D.; Vithiananthan, S.; Ryder, B. Devices and Methods for Modulating Intestinal Flow. Google Patents US 2018/0110641 A1, 26 April 2018. [Google Scholar]
- Aktas, F.; Ceken, C.; Erdemli, Y.E. IoT-based healthcare framework for biomedical applications. J. Med. Biol. Eng. 2018, 38, 966–979. [Google Scholar] [CrossRef]
- Kim, T.; Im, D.; Kwon, K. 360-μW 4.1-dB NF CMOS MedRadio receiver RF front-end with current-reuse Q-boosted resistive feedback LNA for biomedical IoT applications. Int. J. Circuit Theory Appl. 2020. [Google Scholar] [CrossRef]
- Zagan, I.; Găitan, V.G.; Petrariu, A.I.; Iuga, N.; Brezulianu, A. Design, Fabrication, and Testing of an IoT Healthcare Cardiac Monitoring Device. Computers 2020, 9, 15. [Google Scholar] [CrossRef] [Green Version]


| Biomaterial | Usage |
|---|---|
| Synthetic polymers [23] | Encompasses water-repelling materials |
| Naturally occurring polymers [24] | Blood purification, dental-related problems |
| Polyvinylchloride [25] | The bag containing blood and solutions |
| Polyethylene [26] | Bone related implants |
| Polypropylene [27] | Disposed syringes, artificial vascular grafts. |
| Polymethylmethacrylate [28] | Making pumps used to pump blood and reservoirs |
| Polystyrene [29] | Making filter devices (bladder regeneration) and flasks used for tissue culture |
| Polytetrafluoroethylene [30] | Making Catheter and artificial vascular grafts (diaphragm regeneration) |
| Polyurethane [31] | Making films used for packaging (pancreas regeneration) |
| Polyamide [32] | Sutures and molds |
| Polyethylene terephthalate [33] | Making Implantable sutures and heart valve |
| Polyethersulfone [34] | Catheters and Lumen tubing |
| Polyetherimide [35] | Skin staplers used in surgery |
| Composite biomaterials [36] | Filling teeth, bone cement |
| Ceramic biomaterials [37] | Muscular systems and skeletal systems are repaired and replaced |
| Reference | PDMS Implant | Cause |
|---|---|---|
| Siproudhis et al. [60] | Elastomer | Faecal incontinence |
| Losi et al. [61] | Abdominal | Intestinal infections |
| Tunc et al. [62] | Retinal | Retina bleeding |
| Franca et al. [65] | Breast | Low weight |
| Suchy et al. [66] | Spine | Spine Cage repair |
| Lim et al. [67] | Cartilage | Low regeneration |
| Kuo et al. [63] | Ligament | Regenerative strategies |
| Zhang et al. [69] | Vascular | Cardiac arrest |
| Microchannel | Reynolds Number | Applied Pressure (Kpa) | Viscosity (Kg/ms) | Density (kgm−3) | Quantity | Flow Rate (µLs−1) | Velocity (mm/s) | Pressure Drop(Pa) |
|---|---|---|---|---|---|---|---|---|
| Mamdani’s value | 19.72 | 0.106 | 1.19 | |||||
| 5CACMC | 185 | 1.13 | 0.0032 | 1060 | Fuzzy simulation | 19.7 | 0.105 | 1.18 |
| Dissimilarity | 0.02 | 0.001 | 0.01 | |||||
| %Error | 0.09% | 0.9% | 0.89% | |||||
| Mamdani’s value | 15.41 | 0.1042 | 1.16 | |||||
| 5CDCMC | 143 | 1.13 | 0.0032 | 1060 | Fuzzy simulation | 15.4 | 0.1032 | 1.15 |
| Dissimilarity | 0.01 | 0.001 | 0.01 | |||||
| %Error | 0.04% | 0.9% | 0.86% |
| Channel | Applied Pressure (KPa) | Blood Viscosity (Kg/ms) | Average Blood Density (kgm−3) | Reynolds Number | Flow Rate (µLs−1) | Max. Channel Pressure (Pa) | Velocity (mm/s) | Pressure Drop (Pa) |
|---|---|---|---|---|---|---|---|---|
| 5CACMC | 1.13 | 0.0032 | 1060 | 185 | 19.3 | 2.183 | 0.1543 | 1.6 |
| 5CDCMC | 143 | 15.0 | 3.738 × 10² | 0.120 | 1.22 |
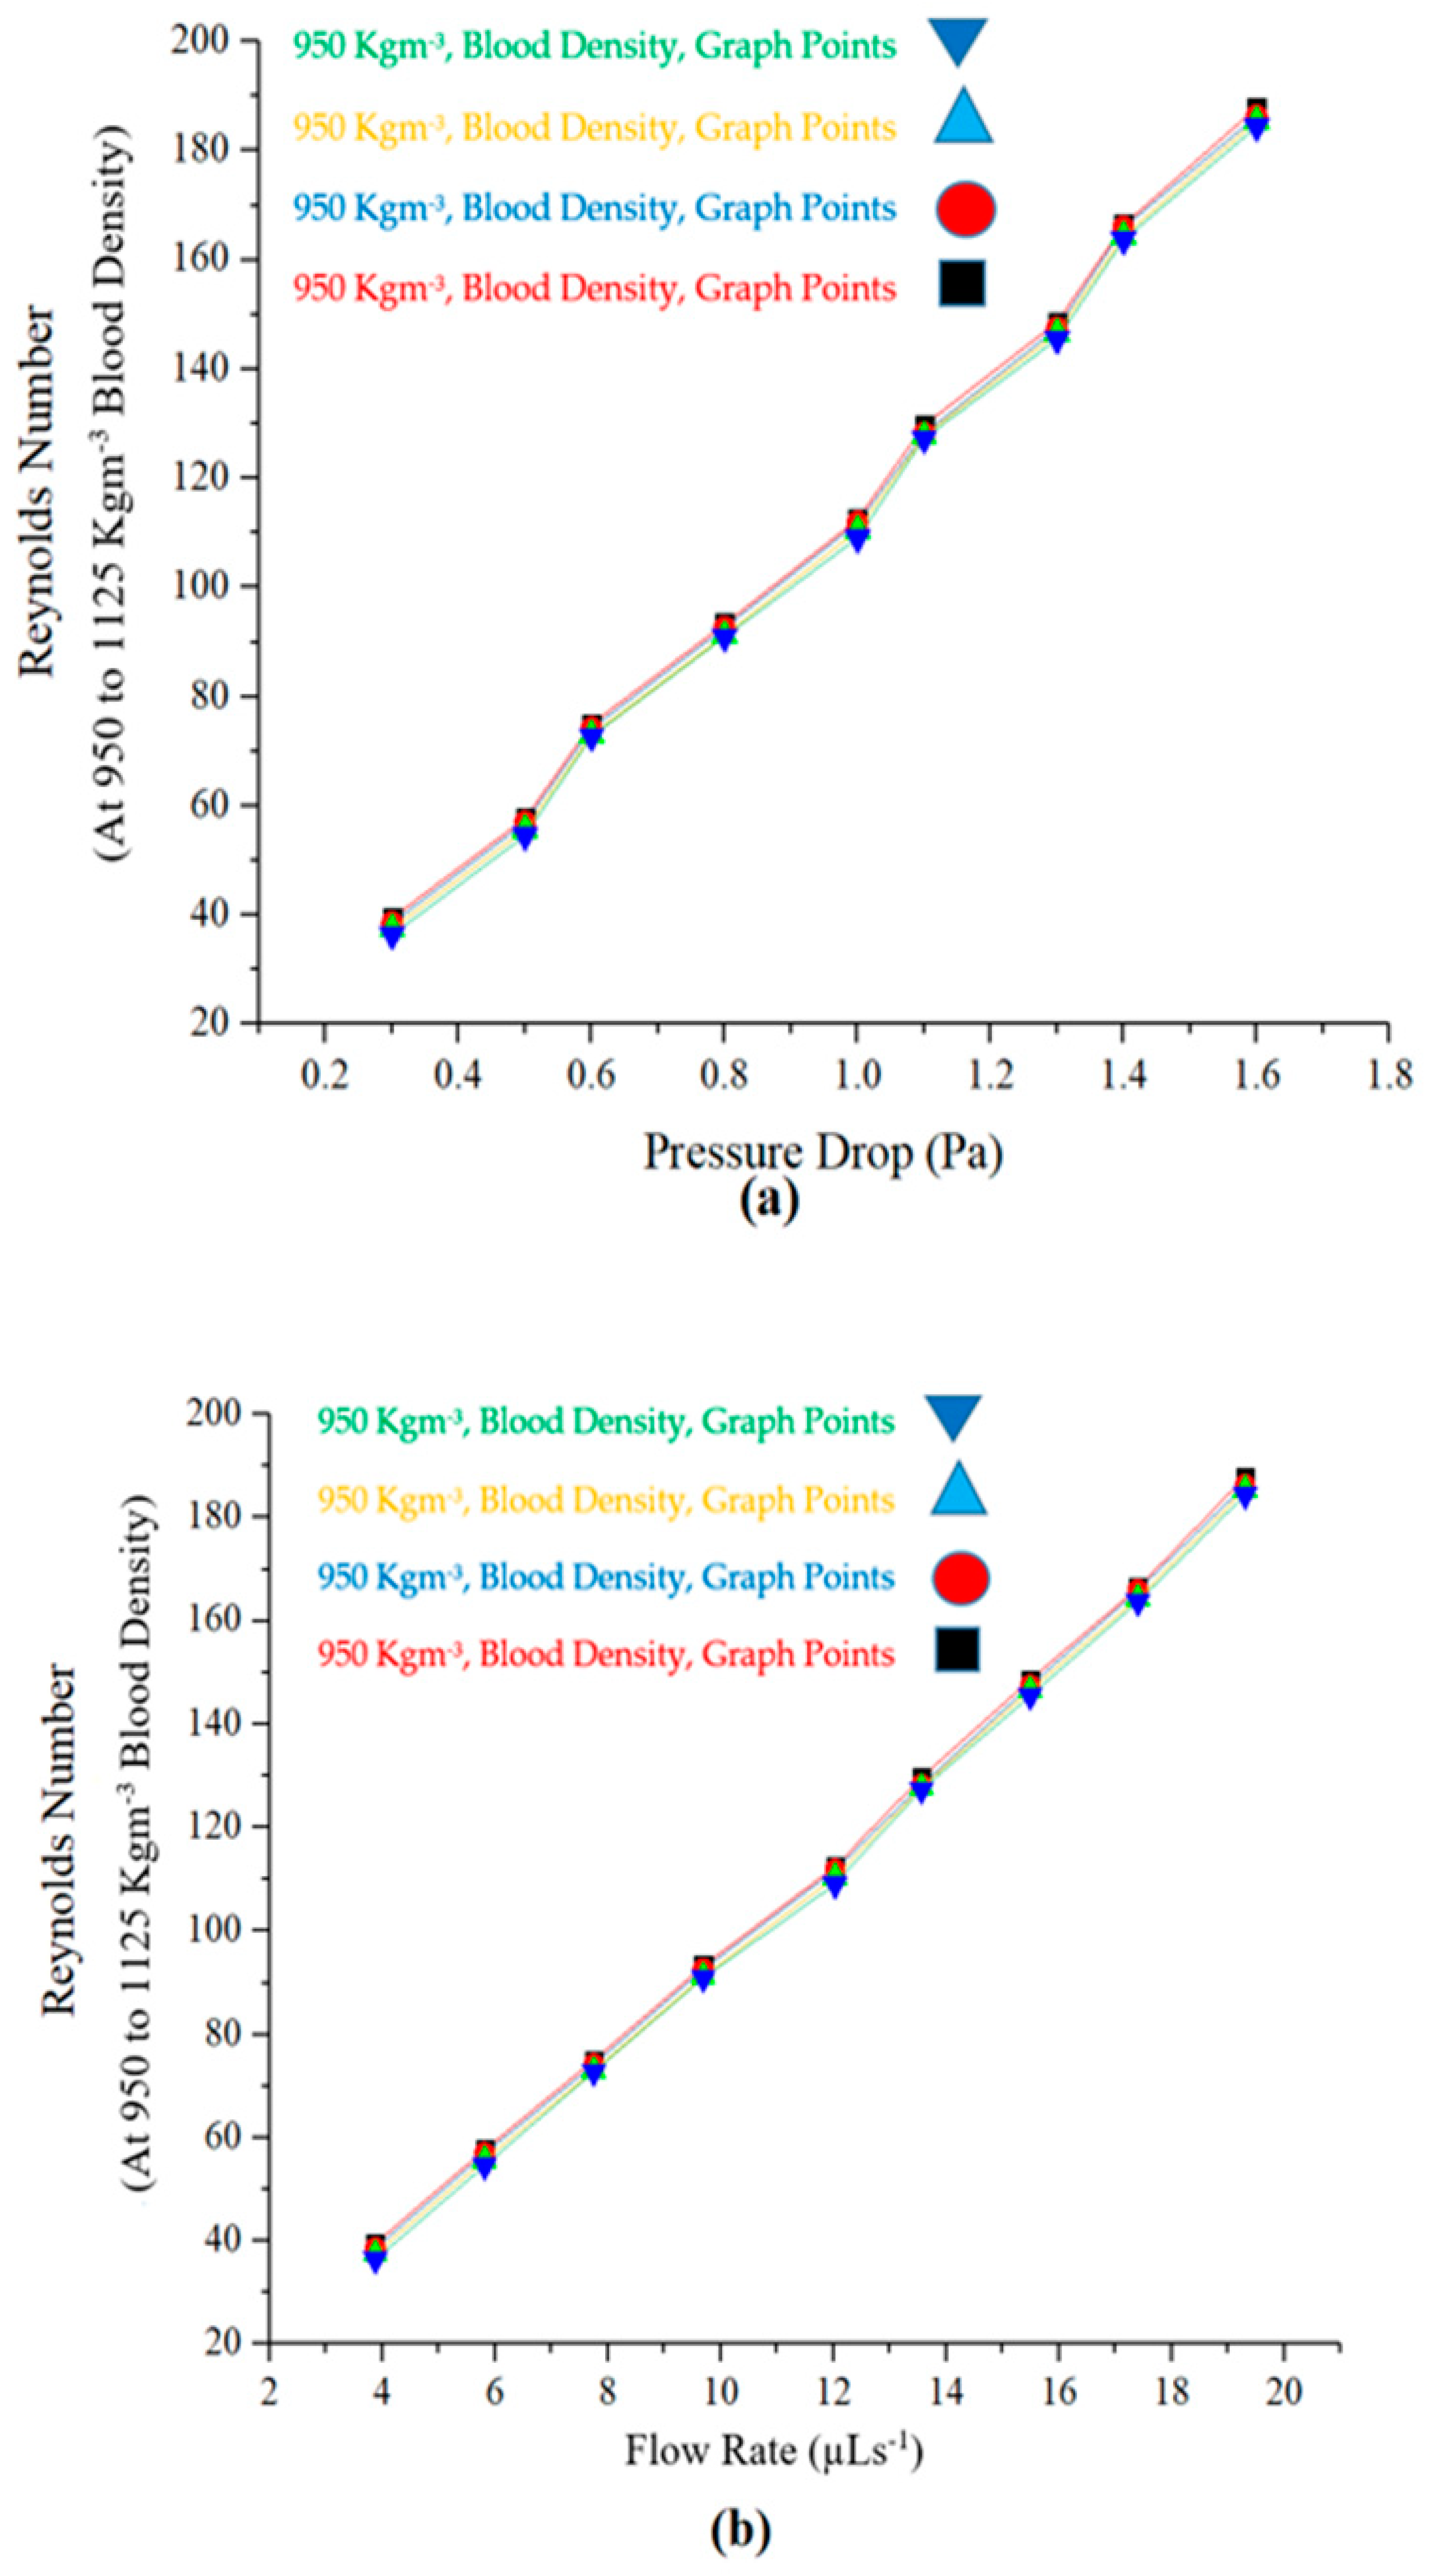
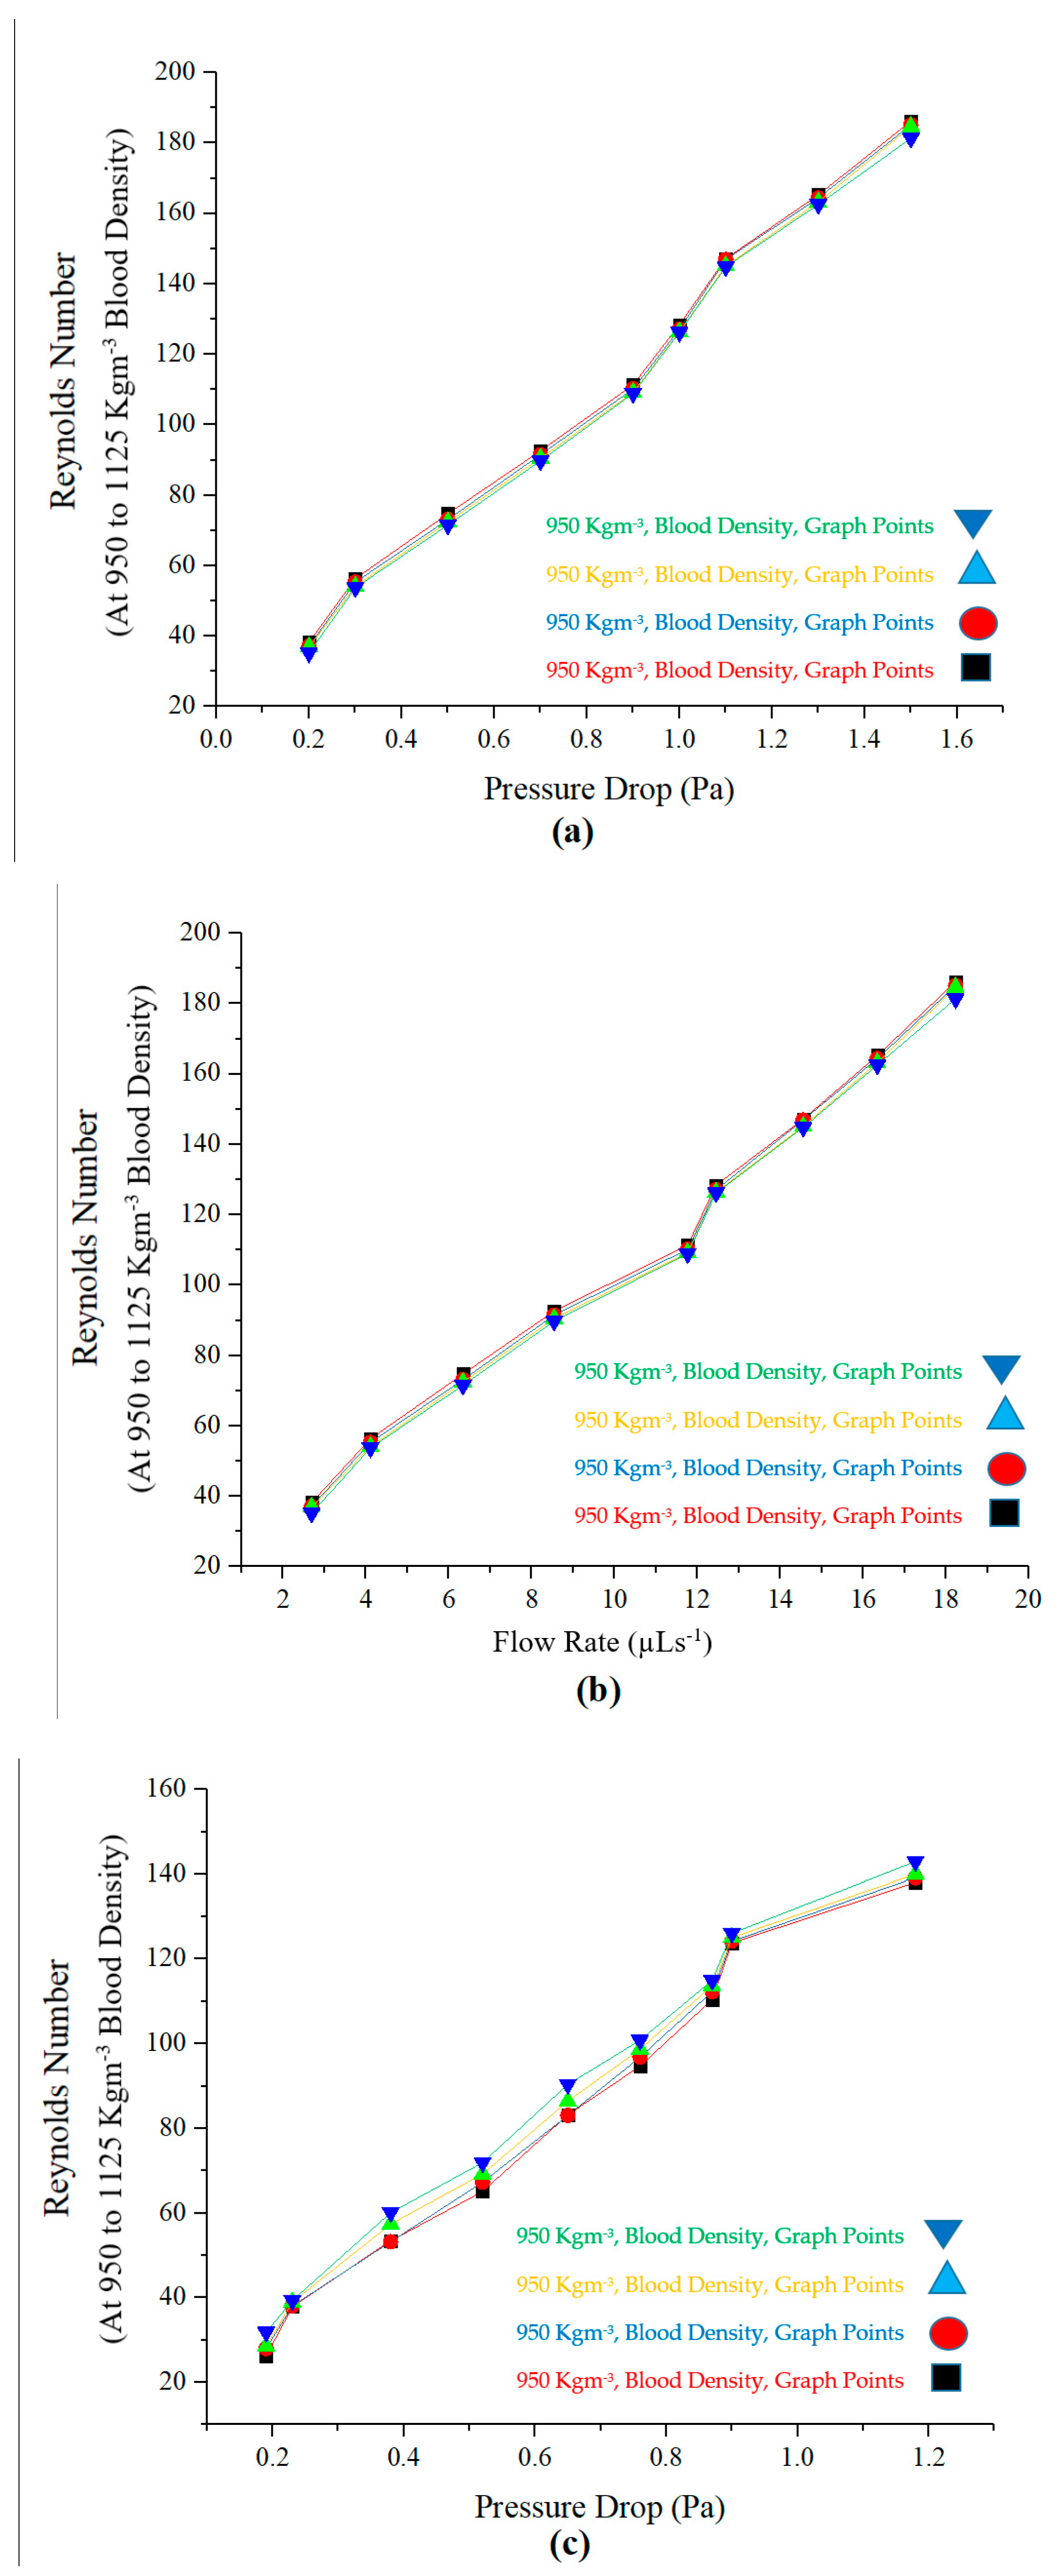
| De at 950 Kg/m3 | De at 1000 Kg/m3 | De at 1060 Kg/m3 | De at 1125 Kg/m3 |
|---|---|---|---|
| 181.34 | 184.65 | 185.13 | 186.19 |
| 162.57 | 163.24 | 164.39 | 165.24 |
| 144.85 | 145.16 | 146.95 | 147.16 |
| 126.23 | 126.47 | 127.12 | 128.37 |
| 108.91 | 109.25 | 110.19 | 111.35 |
| 89.76 | 90.56 | 91.51 | 92.62 |
| 71.54 | 72.45 | 73.12 | 74.75 |
| 53.78 | 54.17 | 55.34 | 56.37 |
| 35.22 | 36.95 | 37.16 | 38.25 |
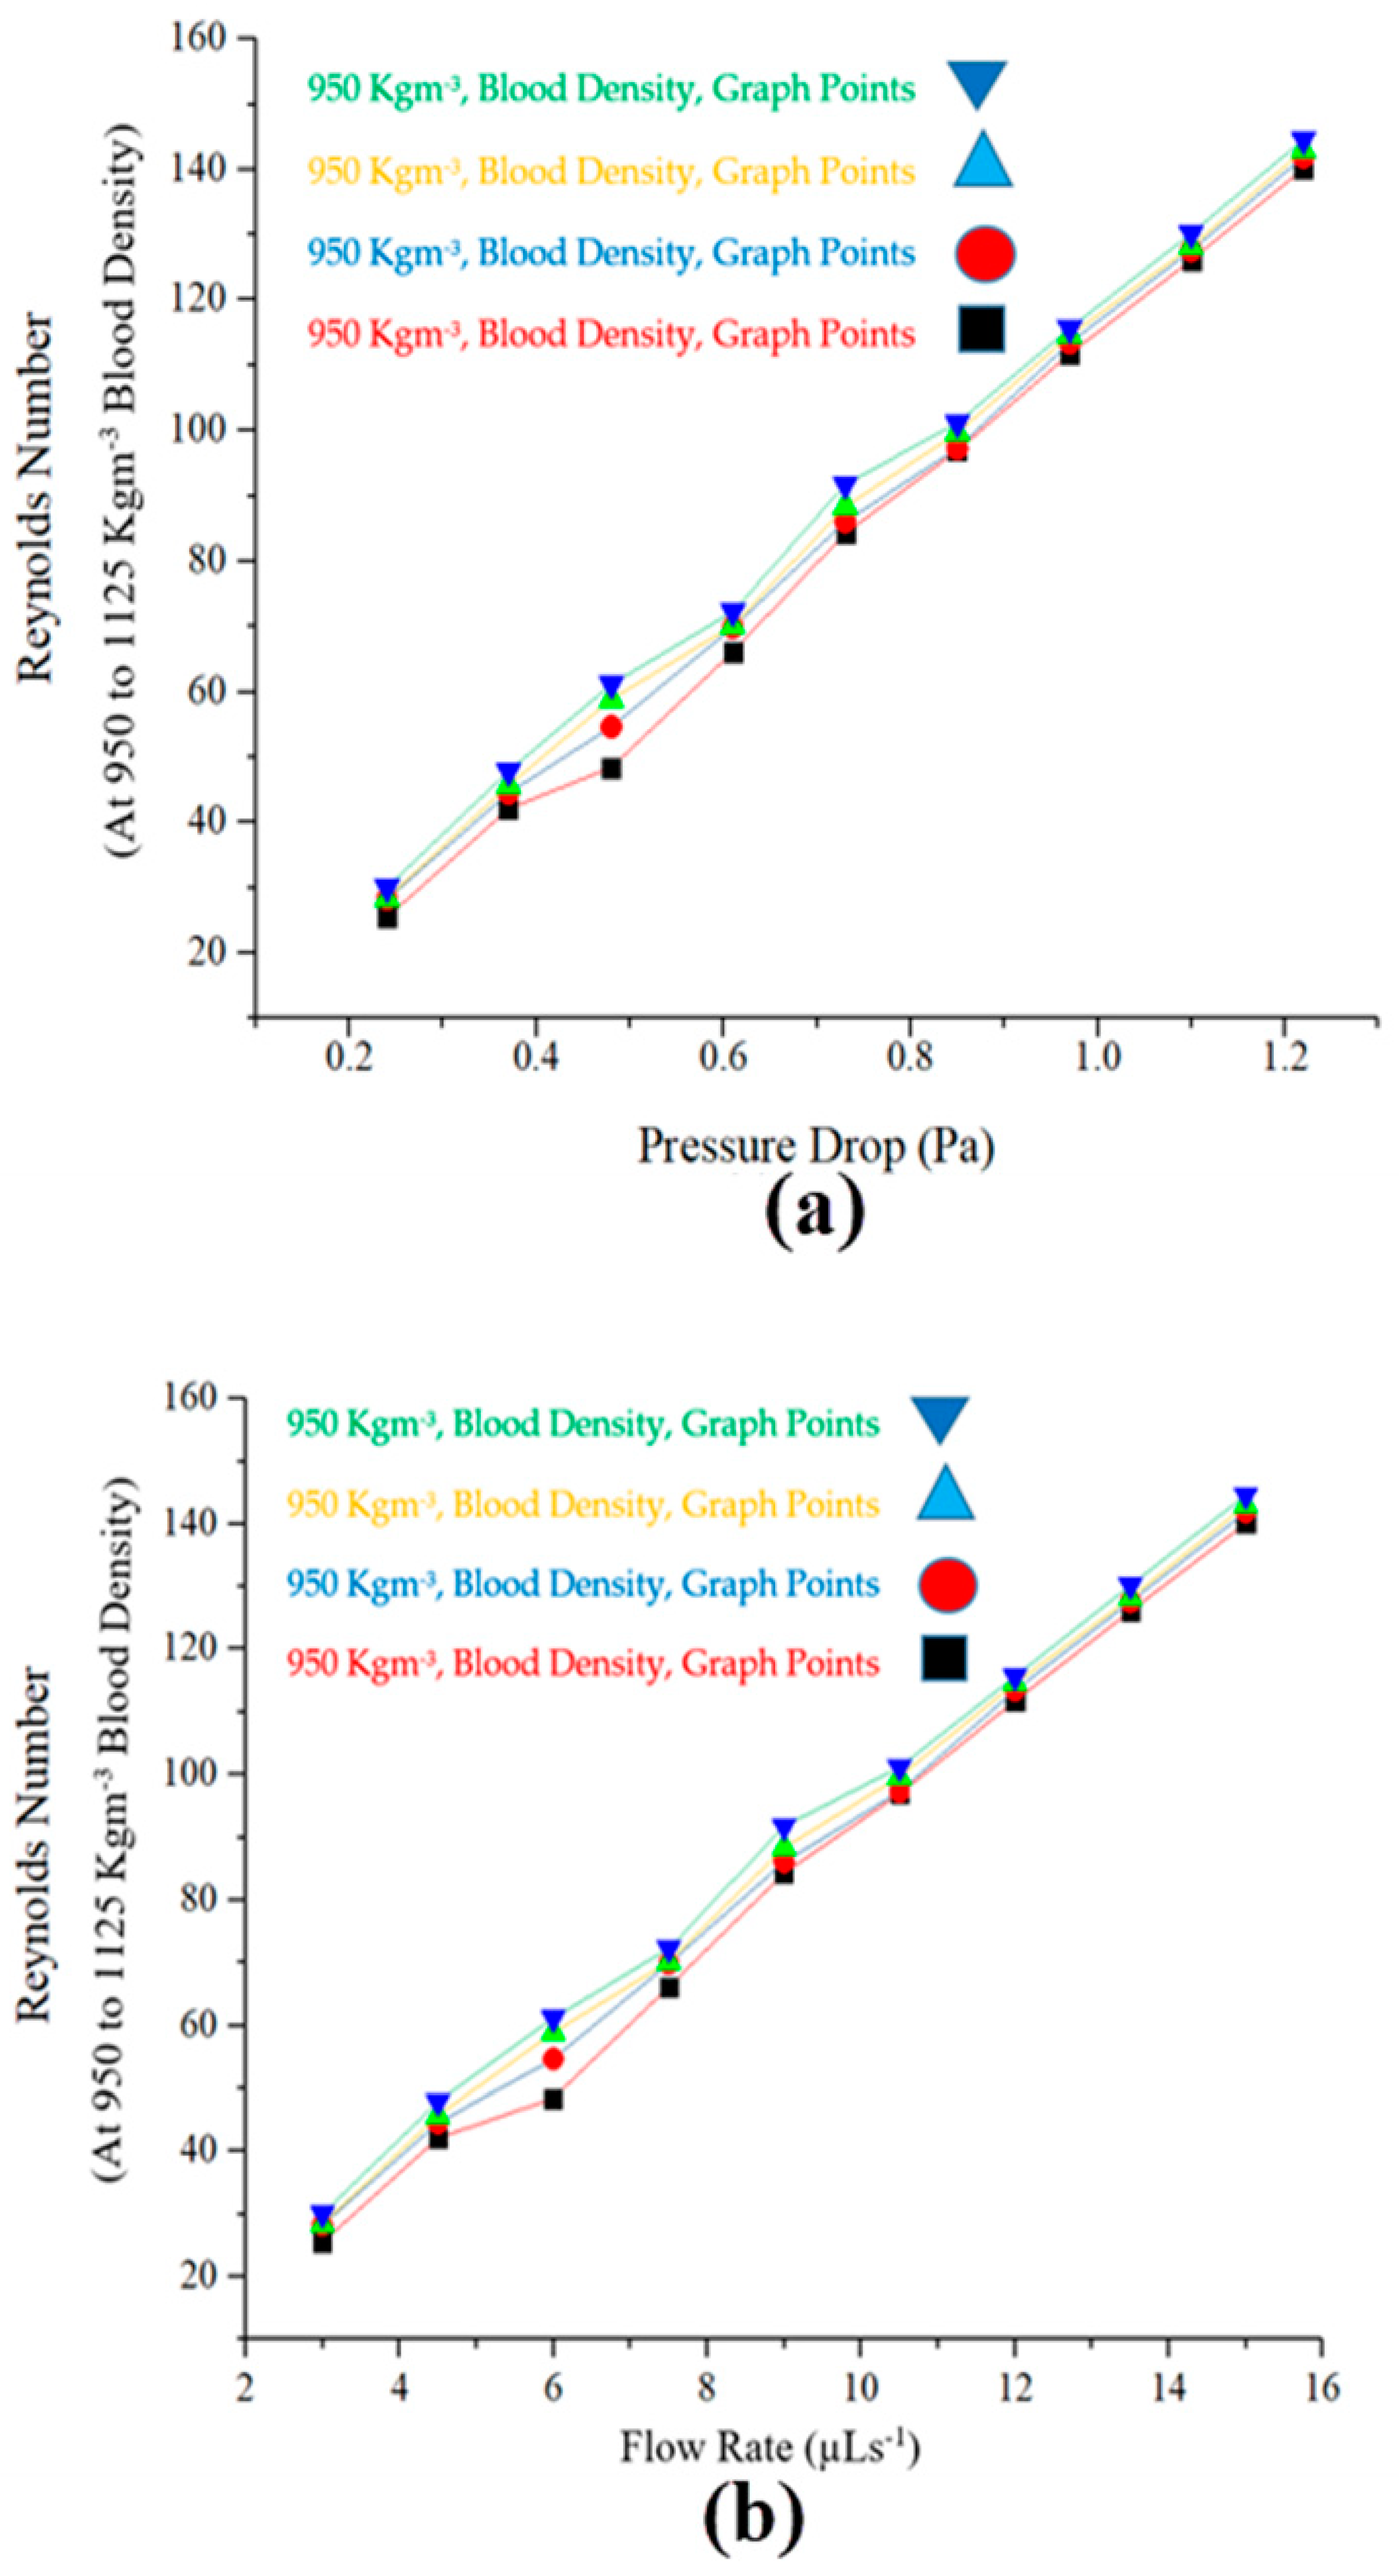
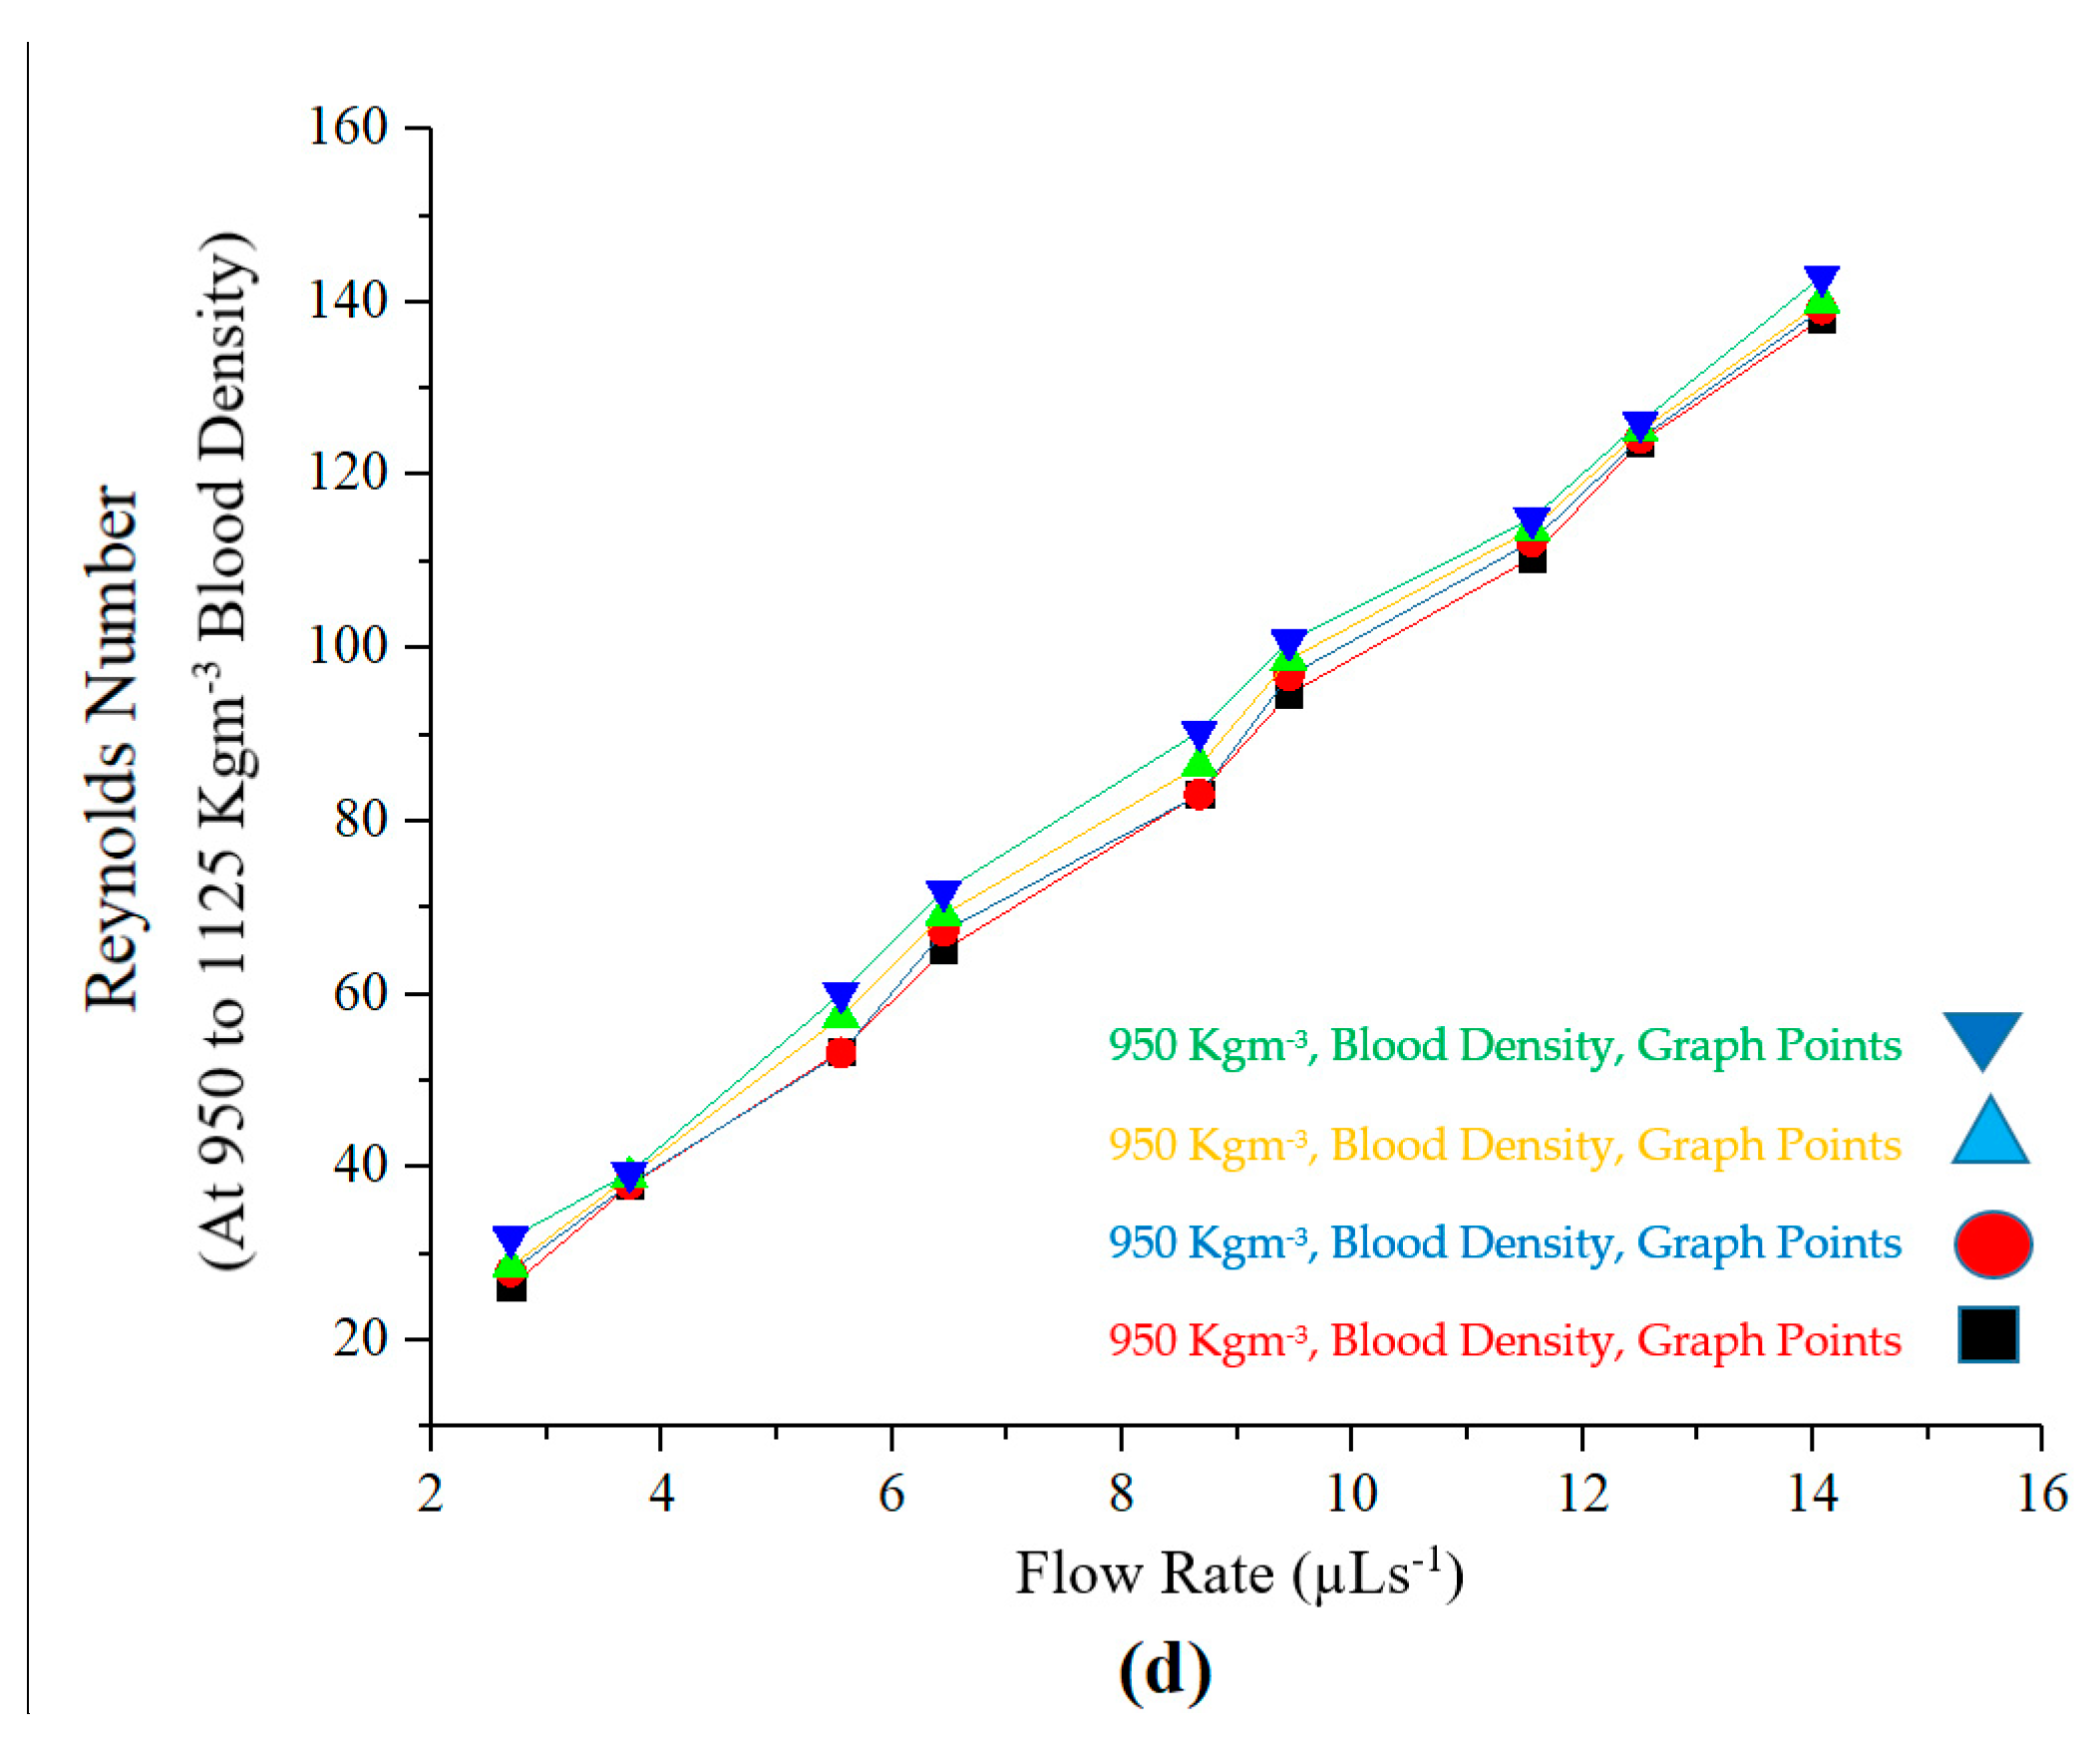
| De at 950 Kg/m3 | De at 1000 Kg/m3 | De at 1060 Kg/m3 | De at 1125 Kg/m3 |
|---|---|---|---|
| 138.11 | 139.19 | 140 | 142.96 |
| 123.82 | 124.26 | 125.12 | 126.12 |
| 110.48 | 112.35 | 113.76 | 114.97 |
| 94.72 | 96.83 | 98.72 | 100.82 |
| 83.21 | 83.11 | 86.44 | 90.38 |
| 65.12 | 67.29 | 69.24 | 71.93 |
| 53.45 | 53.27 | 57.39 | 60.12 |
| 37.93 | 38.11 | 39.01 | 39.39 |
| 26.25 | 27.98 | 28. | 31.88 |
| Channel | Category | Fuzzy Simulation | Fluent Simulation | Experimental Values |
|---|---|---|---|---|
| 5CACMC | Flow Rate (µLs−1) | 19.7 | 19.3 | 18.28 |
| Velocity (mm/s) | 0.105 | 0.1543 | 0.1332 | |
| Pressure Drop (Pa) | 1.18 | 1.6 | 1.6 | |
| 5CDCMC | Flow Rate (µLs−1) | 15.4 | 15.0 | 14.08 |
| Velocity (mm/s) | 0.1032 | 0.120 | 0.105 | |
| Pressure Drop (Pa) | 1.15 | 1.22 | 1.22 |
Publisher’s Note: MDPI stays neutral with regard to jurisdictional claims in published maps and institutional affiliations. |
© 2020 by the authors. Licensee MDPI, Basel, Switzerland. This article is an open access article distributed under the terms and conditions of the Creative Commons Attribution (CC BY) license (http://creativecommons.org/licenses/by/4.0/).
Share and Cite
Tayyaba, S.; Ashraf, M.W.; Ahmad, Z.; Wang, N.; Afzal, M.J.; Afzulpurkar, N. Fabrication and Analysis of Polydimethylsiloxane (PDMS) Microchannels for Biomedical Application. Processes 2021, 9, 57. https://0-doi-org.brum.beds.ac.uk/10.3390/pr9010057
Tayyaba S, Ashraf MW, Ahmad Z, Wang N, Afzal MJ, Afzulpurkar N. Fabrication and Analysis of Polydimethylsiloxane (PDMS) Microchannels for Biomedical Application. Processes. 2021; 9(1):57. https://0-doi-org.brum.beds.ac.uk/10.3390/pr9010057
Chicago/Turabian StyleTayyaba, Shahzadi, Muhammad Waseem Ashraf, Zubair Ahmad, Ning Wang, Muhammad Javaid Afzal, and Nitin Afzulpurkar. 2021. "Fabrication and Analysis of Polydimethylsiloxane (PDMS) Microchannels for Biomedical Application" Processes 9, no. 1: 57. https://0-doi-org.brum.beds.ac.uk/10.3390/pr9010057