Article

An Optimization Framework for Low-Carbon Oriented Integrated Energy System Management in Commercial Building under Electric Vehicle Demand Response

1
Power Grid Technology Center, State Grid Jibei Electric Power Research Institute, Beijing 100045, China
2
School of Control and Computer Engineering, North China Electric Power University, Beijing 102206, China
*
Author to whom correspondence should be addressed.
Submission received: 9 August 2021 / Revised: 16 September 2021 / Accepted: 24 September 2021 / Published: 28 September 2021

Abstract

:
As the carbon emissions of commercial buildings are attracting considerable attention, the integrated energy system (IES) has become a promising low-carbon method in response. In this paper, an optimization framework for low-carbon oriented integrated energy system management under electric vehicles (EV) demand response is proposed. After analyzing the charging behavior, EV charging demand is simulated. Then, the low-carbon integrated energy system model is proposed with the optimization framework considering carbon reduction. Subsequently the objective function containing carbon emission is obtained for the whole operation optimization. The results of the studied case show that the optimization framework proposed can reduce the carbon emission greatly as well as moderate economic cost, which declined because of the revenue from charging demand response. In general, the optimization of low-carbon oriented IES in commercial buildings is feasible.

1. Introduction

The commercial building sector consumes a huge amount of energy with considerable carbon emissions [1]. In the United States, the commercial building sector consumes nearly 40% of all energy accounting for nearly a half of carbon emission, more than the transportation or industrial sectors [2]. In fact, the energy required by shopping malls is large not only in quantity, but also in variety [3].
The integrated energy system (IES), as a newly emerging energy technology, can greatly promote energy saving and carbon reduction [4]. For commercial buildings IES, Braun et al. [5] achieved a buffer of peak energy consumption of commercial buildings by establishing building-integrated photovoltaics and regulating them. Eleanor S. Lee et al. [6] used distributed energy systems and control dynamic facades to achieve the integration of building energy. However, due to the instability of renewable energy itself, researchers will add other units [7] to the system to enhance reliability. Giovanni Barone et al. [8] studied the coupling of photovoltaic systems to collector systems. Sushant Varghese et al. [9] have improved the reliability of integrated energy systems by combining a photovoltaic power generation system with energy storage system. All in all, the current research on commercial building energy systems focuses on the consumption of renewable energy to achieve carbon reduction. It is still difficult to achieve energy self-sufficiency due to the instability of renewable energy sources. However, there has been a lot of research on the application of distributed energy systems with CCHP (Combined Cooling Heating and Power) as the core in various fields, which could emit less carbon than power from the gird [10,11]. The research of Fukang Ren et al. verified the feasibility of CCHP integrated energy system operation in different buildings [12]. Salvador Acha et al.’s research [13] on food distribution centers pointed out that the CCHP system can have better revenue as well as less emission with higher energy reliability than pure photovoltaic distribution. Therefore, the application of CCHP is a promising option for the integrated energy system in a commercial center.
On the other hand, flexible load has a huge impact on the operating in IES. With the rapid development of electric vehicles in cities, electric vehicle charging demand [14] has become the most common flexible load. There are many related studies [15,16,17,18,19,20] on this stage. Many studies have noticed the interactive connection between electric vehicles and urban commercial buildings. A collaborative energy sharing optimization model among electric vehicle charging stations, commercial buildings, and the power grid [21] was constructed by Md Abdul’s team. Robert J. Flores et al. pointed out that the charging of electric vehicles will have a negative impact on the energy supply of buildings [22]. Therefore, in order to stabilize the energy of the building itself, it is necessary to design a suitable mechanism to ensure its own energy reliability. Carla B. Robledo et al. built an energy supply model [20] through photovoltaic power generation systems. Pei huang et al. [23] use energy storage to build a coordinated control to improve performance for a building cluster considering energy storage, electric vehicles, and energy sharing. Compared with a separate isolated energy system, Hai Yang Lin et al. built a model of electric vehicle charging and energy hub connection, verifying the feasibility of electric vehicles demand response in integrated energy systems [24]. Also, Erick Guerra’s research [25] points out that owners of electric vehicles are willing to pay appropriate fees for the convenience of parking and charging. This verifies the commercial feasibility of the integrated energy system with response to electric vehicles charging demand in the commercial building.
Since the charging behavior of electric vehicles (EV) under different climatic conditions in different seasons tend to fluctuate, the changing demand influenced by them is also a great challenge for optimizing the operation of integrated energy systems. Also, as carbon emissions are attracting increasing attention, research about how to integrate and optimize EV demand response with integrated energy systems and further applying this integrated framework in real commercial buildings is insufficient. Thus, this paper models the charging behavior of electric vehicles considering charging factors. An optimal solution model considering the total carbon emission target is developed for the integration of electric vehicles and integrated energy systems. The simulation solution is carried out in a real case to verify the effectiveness of the proposed model in terms of carbon reduction.
The article first establishes an electric vehicle charging model, combined with actual scenarios, using the Monte Carlo method to simulate the charging load of electric vehicles in various seasons in Section 2. After that, the integrated energy system model is established, as well as the equipment covering the energy generation and conversion in Section 3. After proposing the objective function of operation considering carbon emission, for the commercial building with EV charging demand, an overall mathematical model of low-carbon optimization framework is established in Section 4. In Section 5, for the case study of the optimization framework, this paper analyzes the output of each piece of equipment, and the carbon emissions as well as the economic effectiveness of the integrated energy system in a commercial building with electric vehicle charging demand response.
As shown in Figure 1, the integrated energy system offers energy for the commercial building and electricity for the EV charging. Then, the operation optimization of the integrated energy system can be solved under the fluctuant EV charging demand.
As shown in Figure 2, season, different hours in a day, and number are considered when modelling the charging behavior. Then, based on Monte Carlo simulation method, the charging load demand is obtained, which is the input parameters for the integrated energy system model (containing micro turbine, absorption refrigerator, gas boiler, waste heat boiler and etc.). After equipment modelling and establishing a low-carbon framework, the solution can be solved in a typical case.

2. Electric Vehicle Demand Model

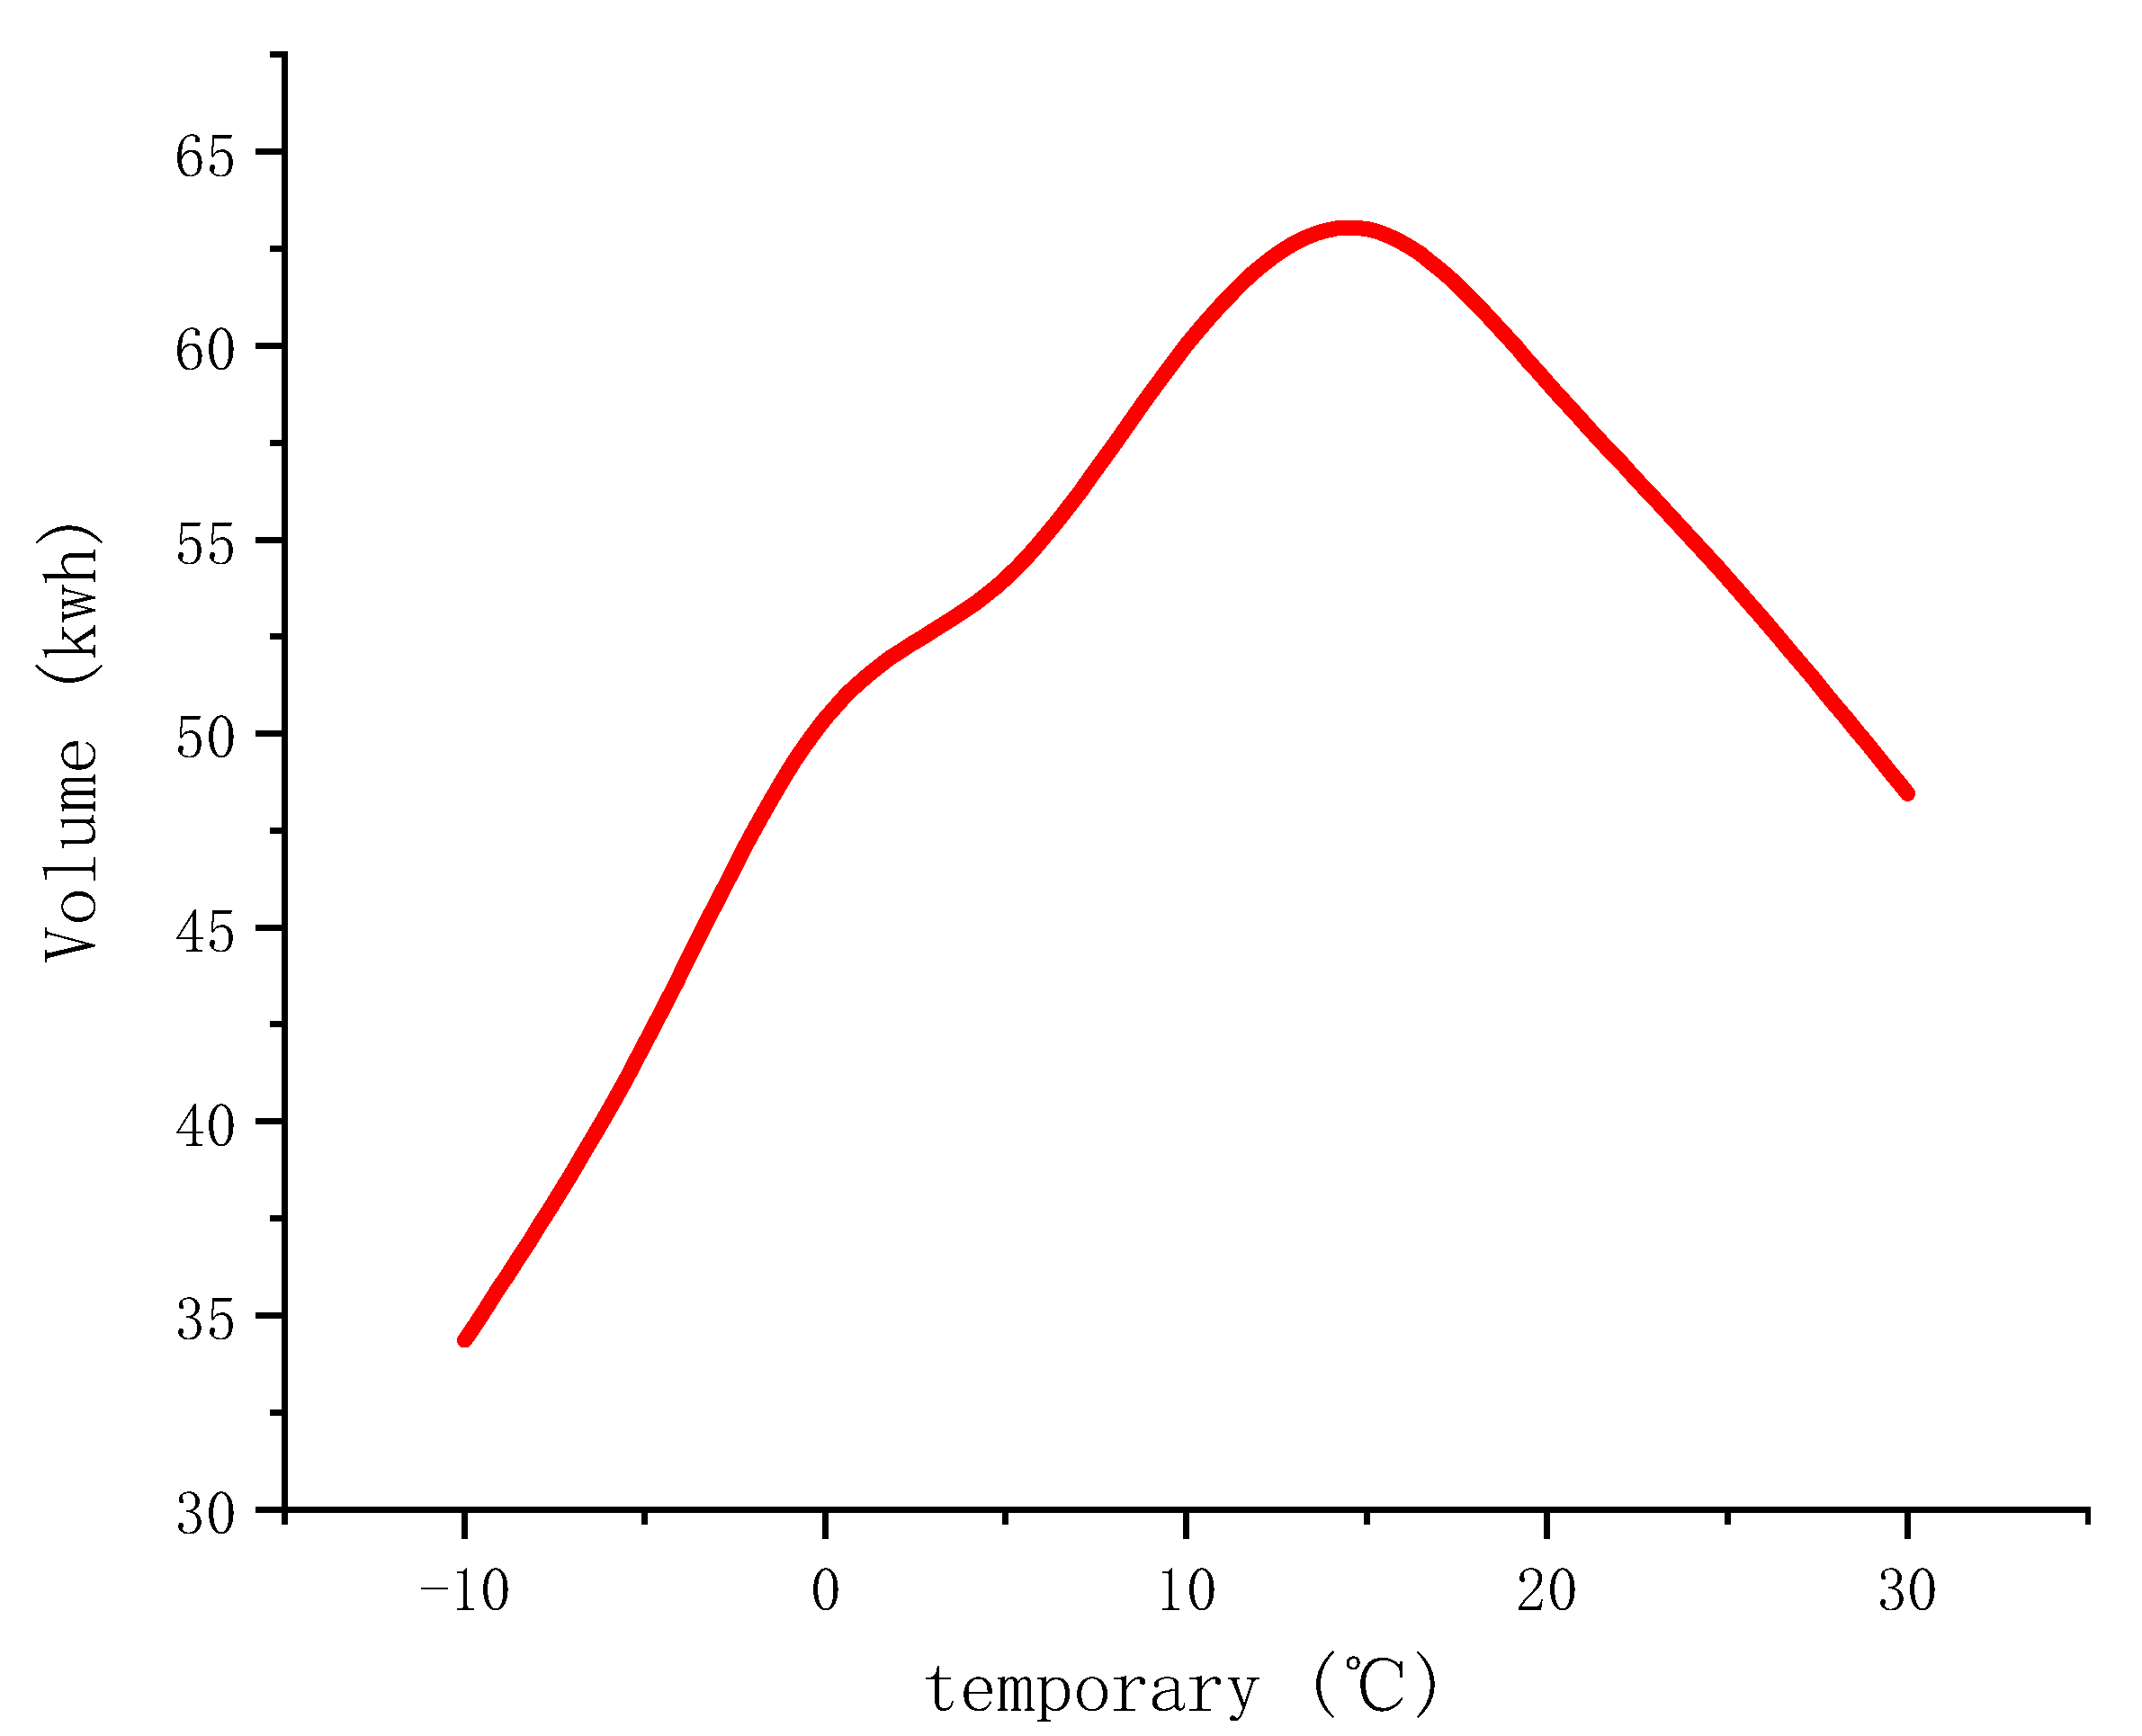
2.1. Electric Vehicle Behavior Model

Parking behavior is generally considered as a dominant factor which directly affects the distribution of charging demand of electric vehicles. In order to analyze the charging behavior of electric vehicles in a commercial center, it is necessary to study the parking behavior of electric vehicles in the center. As described by the existing research, the parking behavior of electric vehicles can be described jointly by the distribution curve of the arrival times and stopping time of electric vehicles over a period of time [26].
In real life, the probability of consumers choosing electric vehicles to travel is affected by actual weather, temperature, and holidays [27]. Hot or cold weather, for example, can increase the number of people who choose to drive. However, at the same time, due to the cool nights in Beijing in summer, the tendency to travel by car will be reduced compared with the daytime peak period, and the proportion of traveling by car will be reduced in winter when the night is colder. The following figure shows the temperature of the three seasons.
The typical scene set in this paper is in Beijing (116°20′ E, 39°56′ N, semi-humid and semi-arid monsoon climate in warm temperate zone), and the following Figure 3 is the temperature in typical seasons in Beijing.
In this paper, as shown in Figure 3, three typical seasonal scenarios (summer, winter, spring and autumn) are considered, and the average number of cars arriving at the commercial center by consumers under different conditions of working days and holidays are considered. This can be easily obtained from historical data in the actual operation of shopping malls.
The parking time of consumers is an incalculable amount. The article selects a common type of electric vehicle (battery capacity 60 KWh, charging time one hour) [25]. Although the parking time is affected by the charging time, it is determined more by the time consumers spend in the commercial center, which is difficult to estimate. In the model, as shown in Figure 4, we assume that when consumers use this type of electric car to travel, their parking time in the mall can be represented by a set of normal distribution curves [23], as shown in Formula (1), with an average of 1 h, as Figure 5 shows.
f ( x ) = 1 2 π σ e x p ( ( x μ ) 2 2 σ 2 )

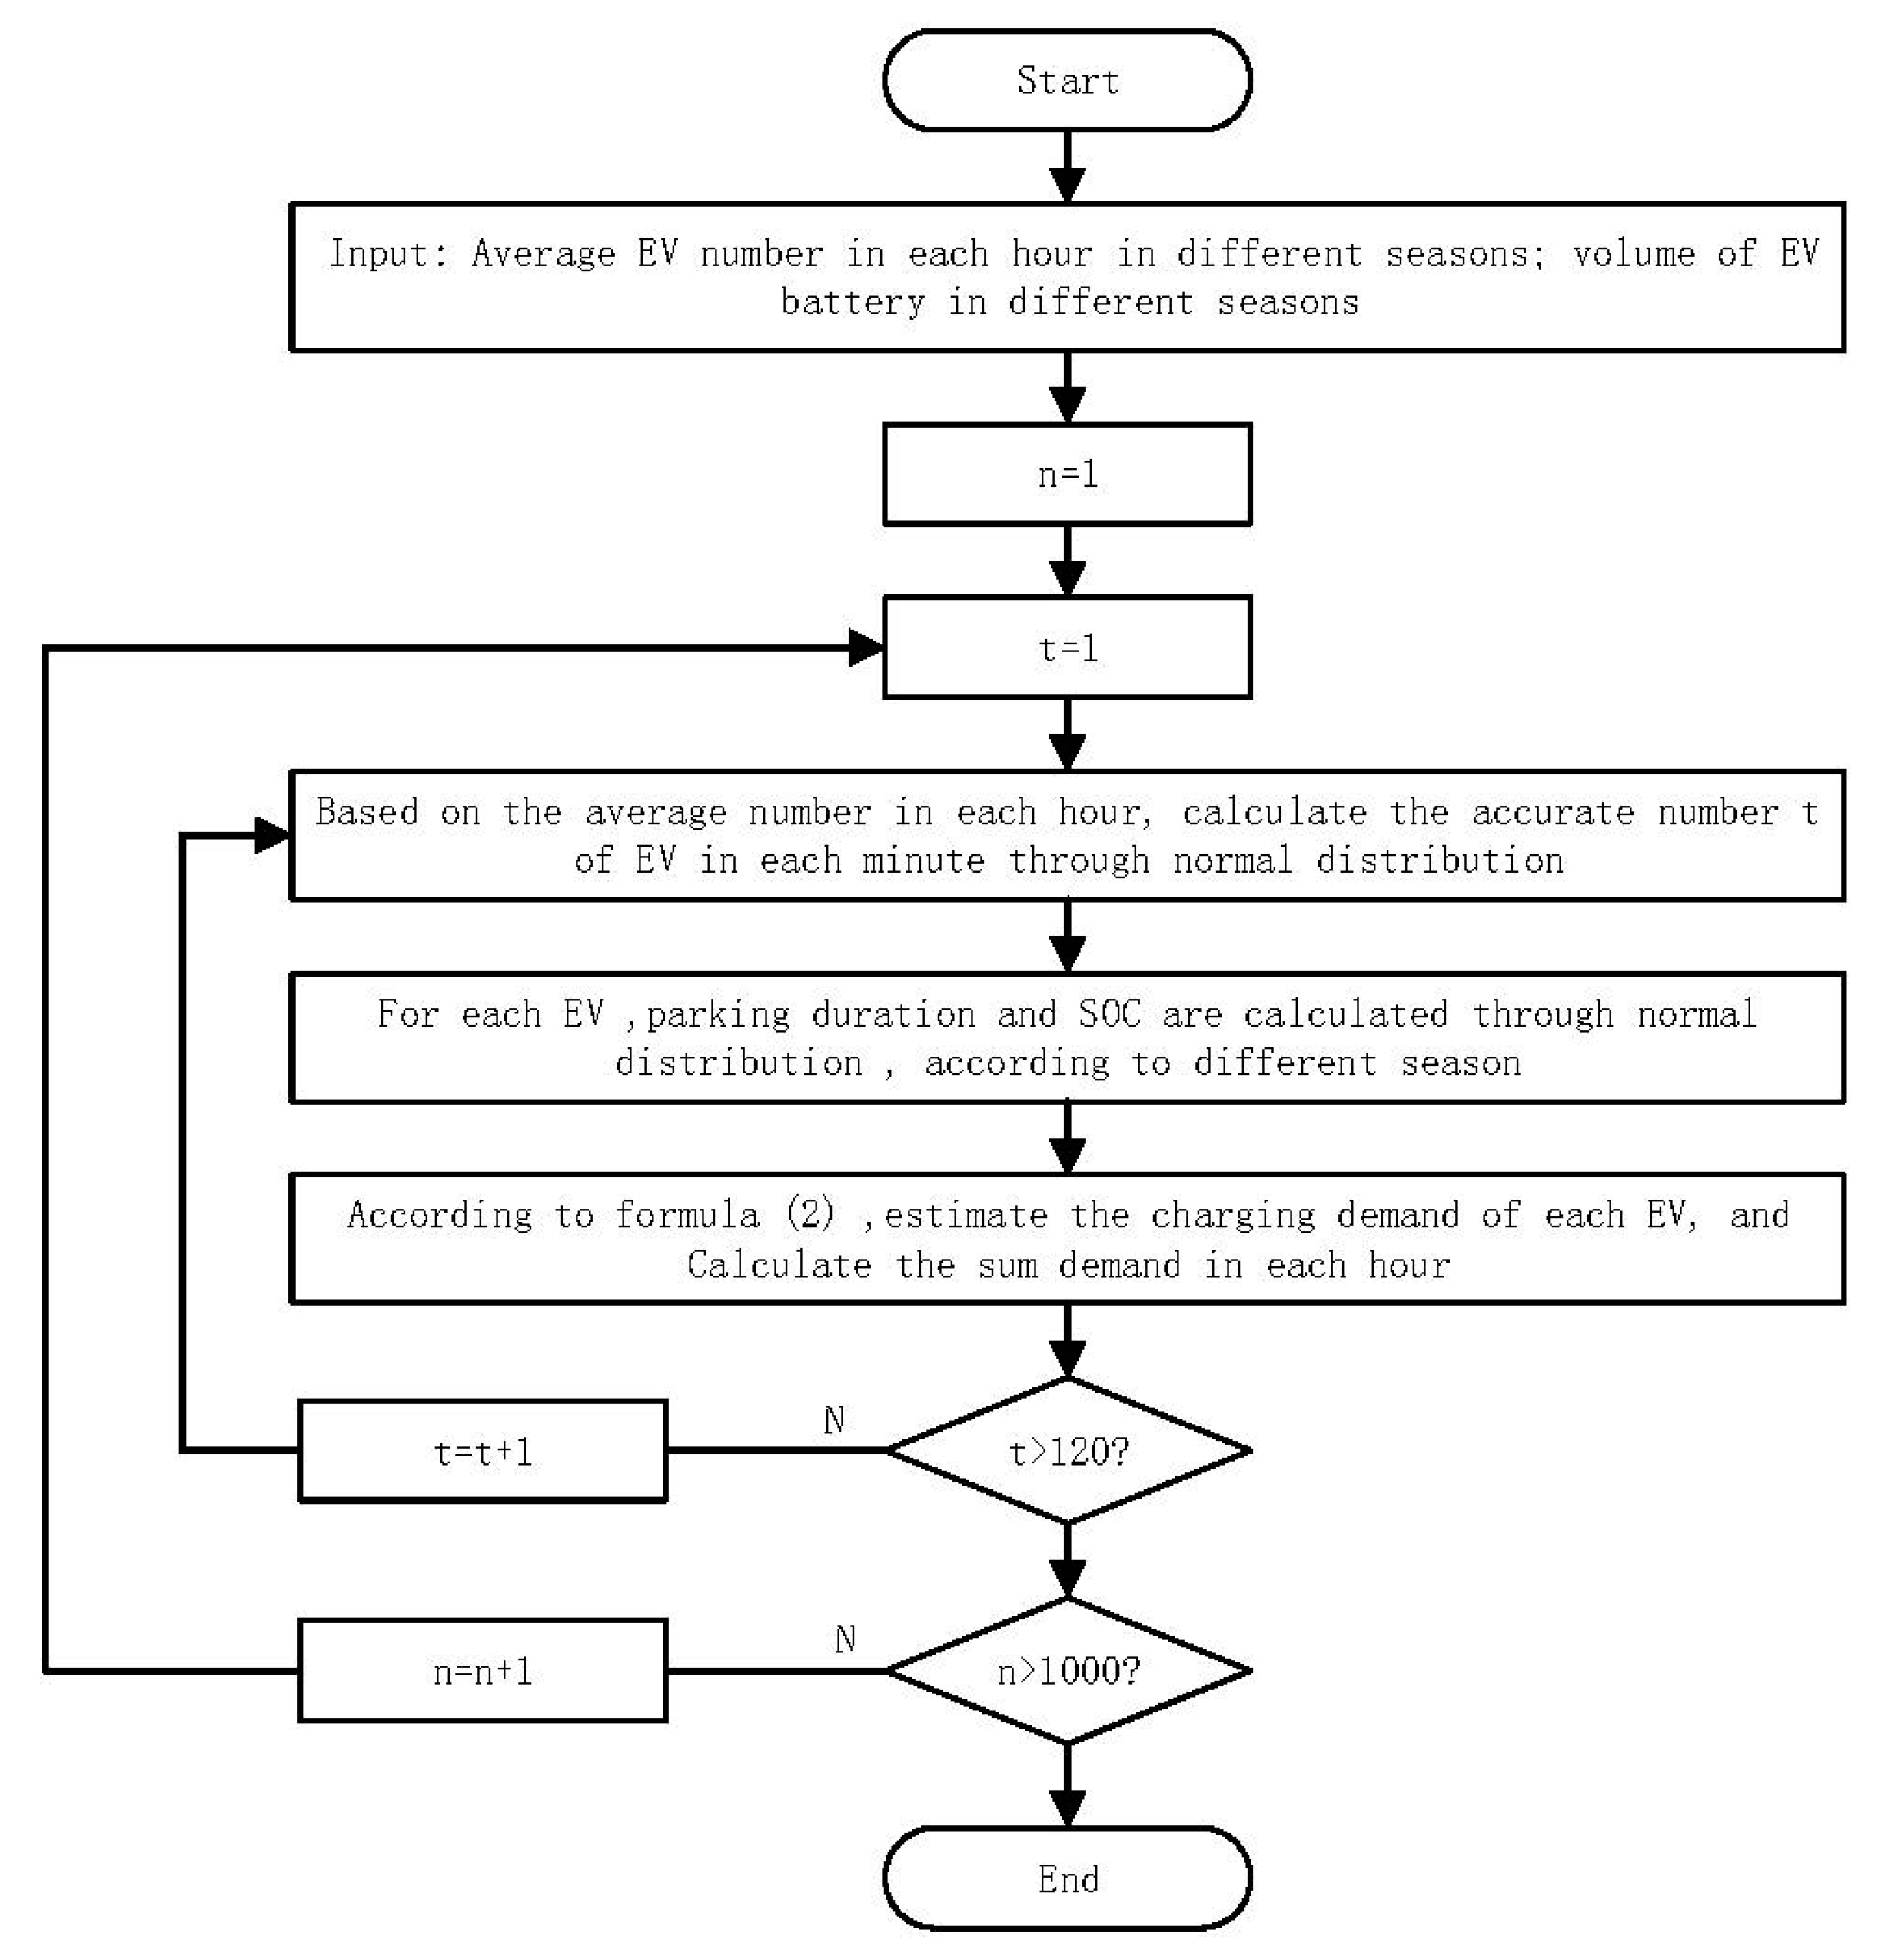
2.2. Charging Demand Model

If a consumer’s electric car is fully charged for the rest of the trip while charging in a commercial center, the consumer may simply stop. But if the car’s charge is less than enough for the rest of the trip, consumers will choose to charge it. In most cases, consumers will charge at the beginning of the stop time and stop charging at the end of the stop time. Therefore, based on the above estimation of consumers’ parking time, the charging behavior of consumers can be described completely as long as the electric quantity of consumers’ electric vehicles is estimated. To describe consumers’ charging behavior, we use the following Formula (2):
T i E V = { 0 SoC ω 1 SoC i 1 1 S O C i C H i SoC ω 2 SoC i SoC ω 1 P T i E V 0 SoC i SoC ω 2
where λ represents each EV car, T λ E V represents charging time, SOC represents State of Charge, SoC ω 1 and SoC ω 2 are the boundaries of three different states, ω 1 is the state without charging demand, ω 2 is the state with charging until leaving.
Taking into account the changes in the total power of electric vehicles under different temperature conditions [28,29,30,31], the SoC curve is as shown in Figure 6.
After establishing the above model, we assume that the charging power is constant during the charging time, and then we use the Monte Carlo method [32,33,34] (as shown in the Figure 7 below) to perform 1000 simulations to obtain the consumer’s electric vehicle charging behavior under different weather conditions model to handle the uncertainty of parameters [35,36].

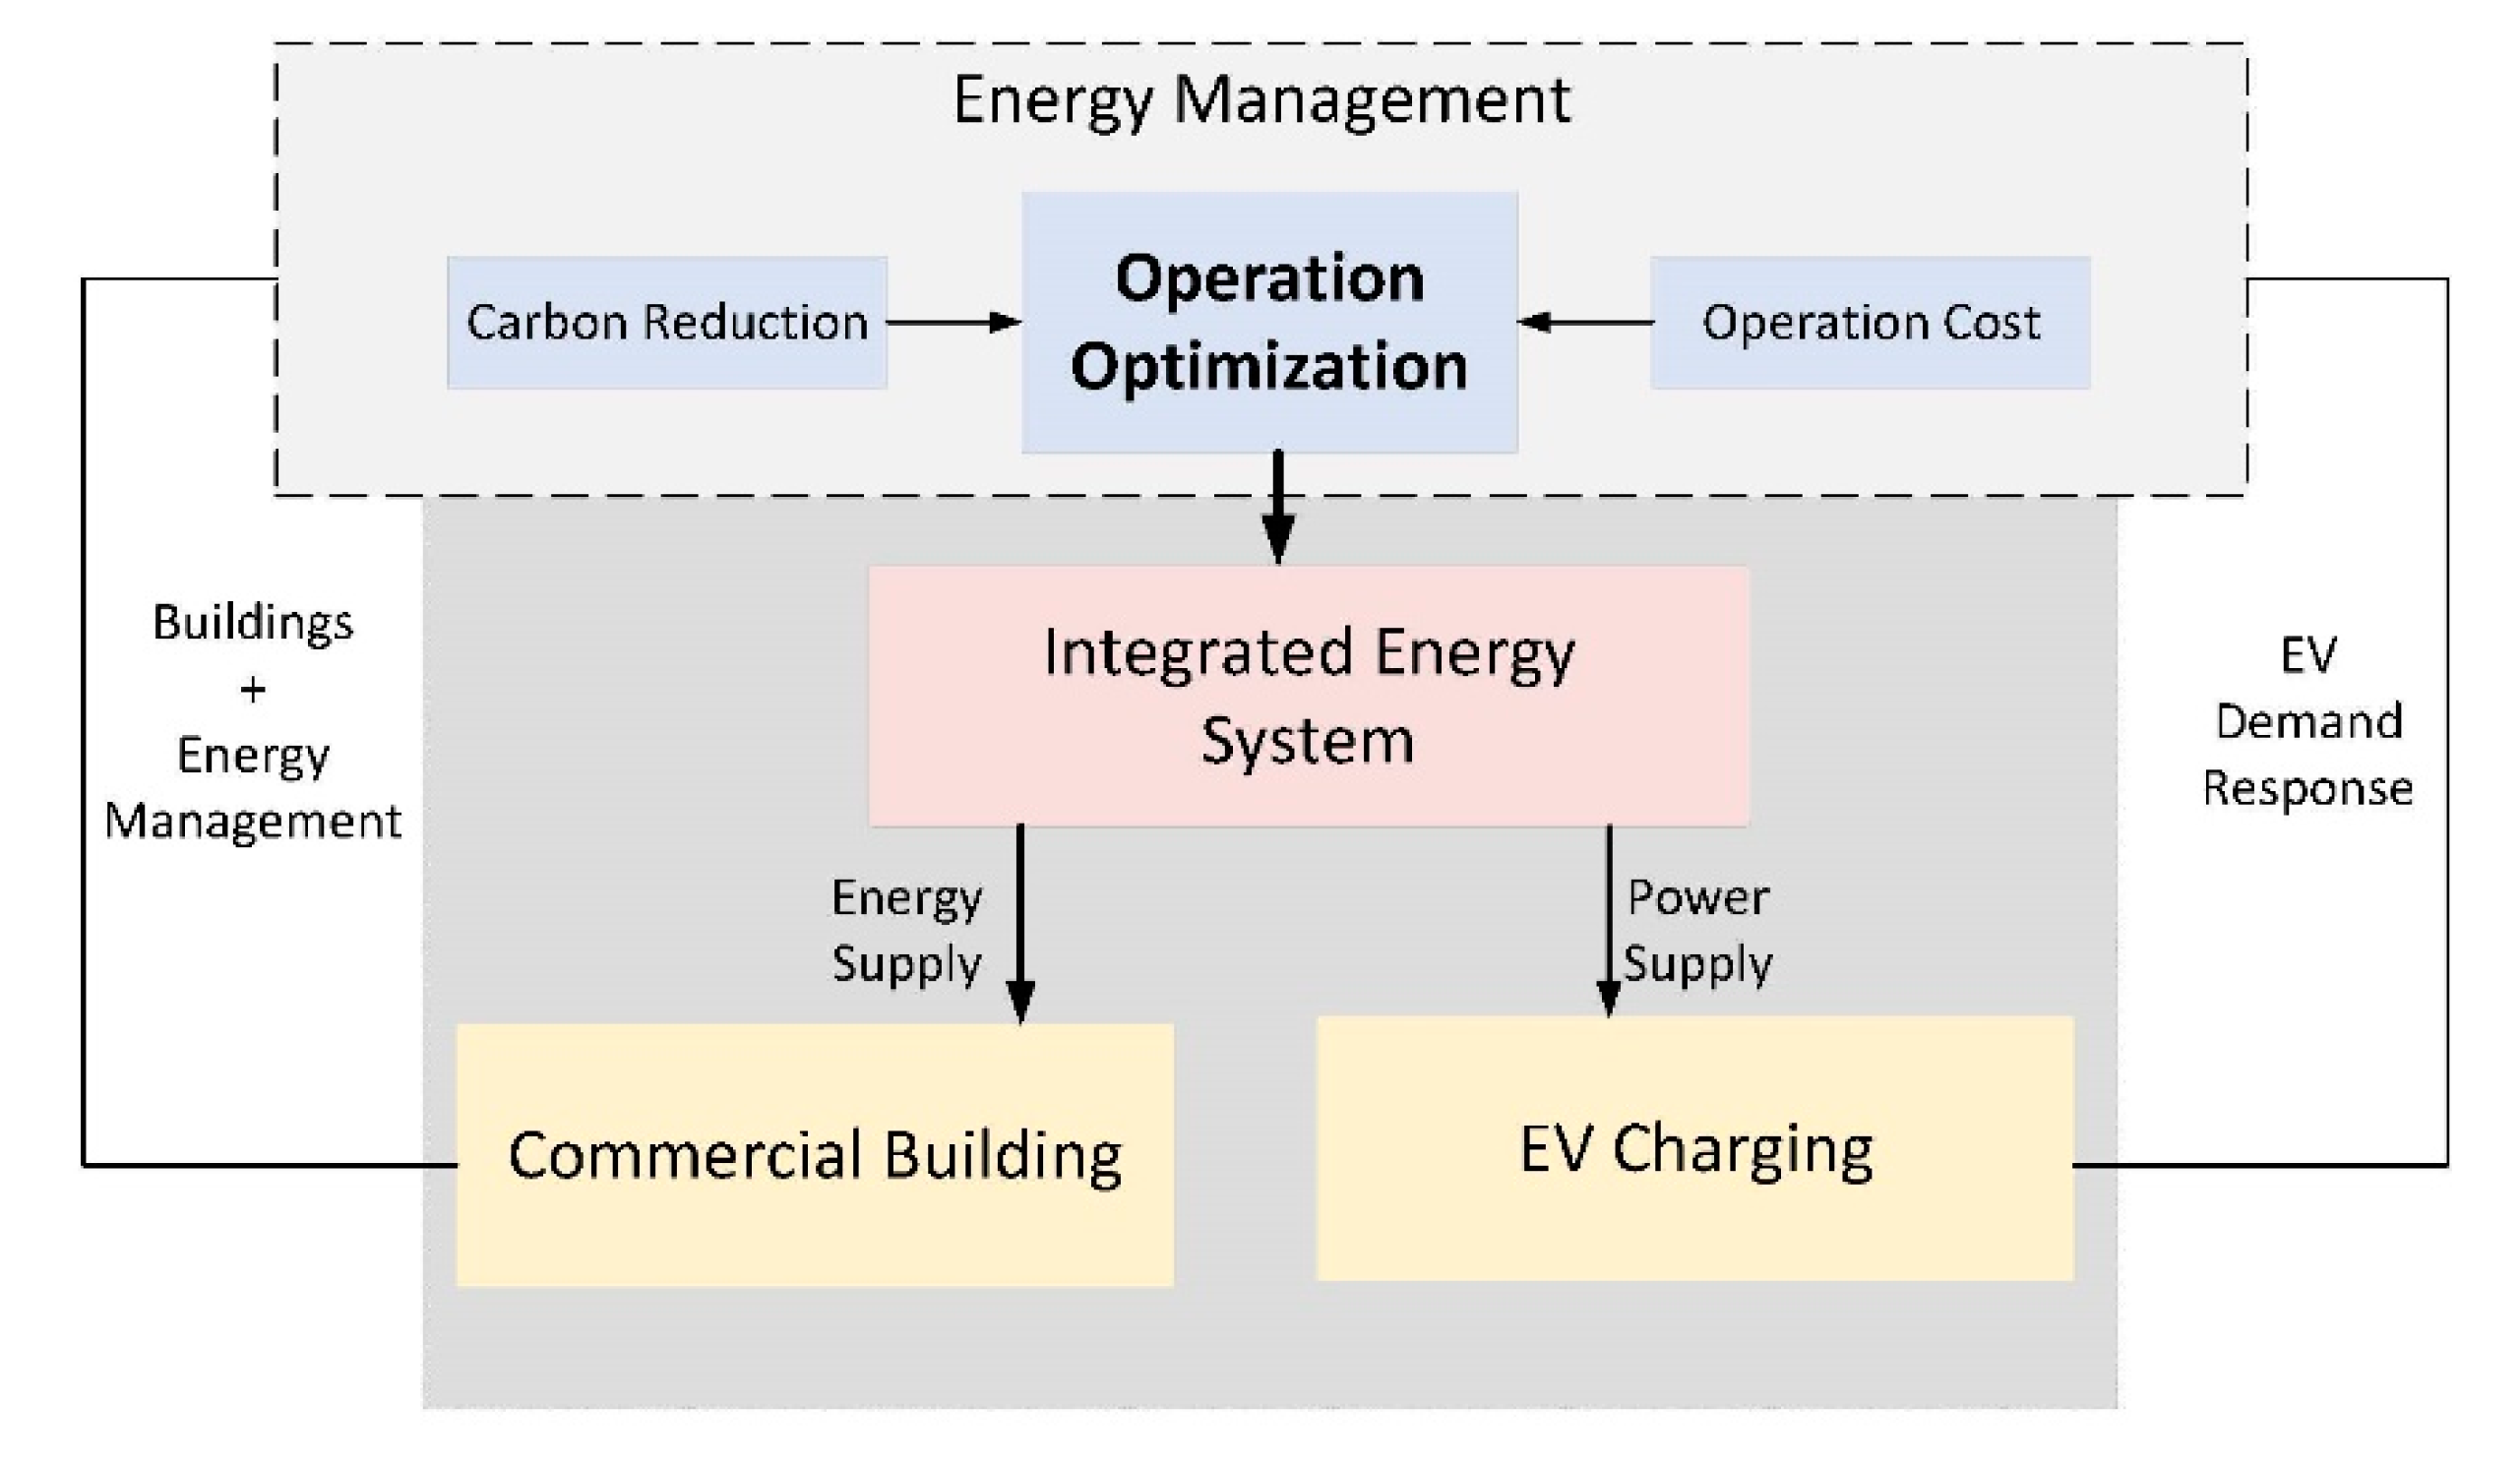
3. Integrated Energy System in Commercial Building

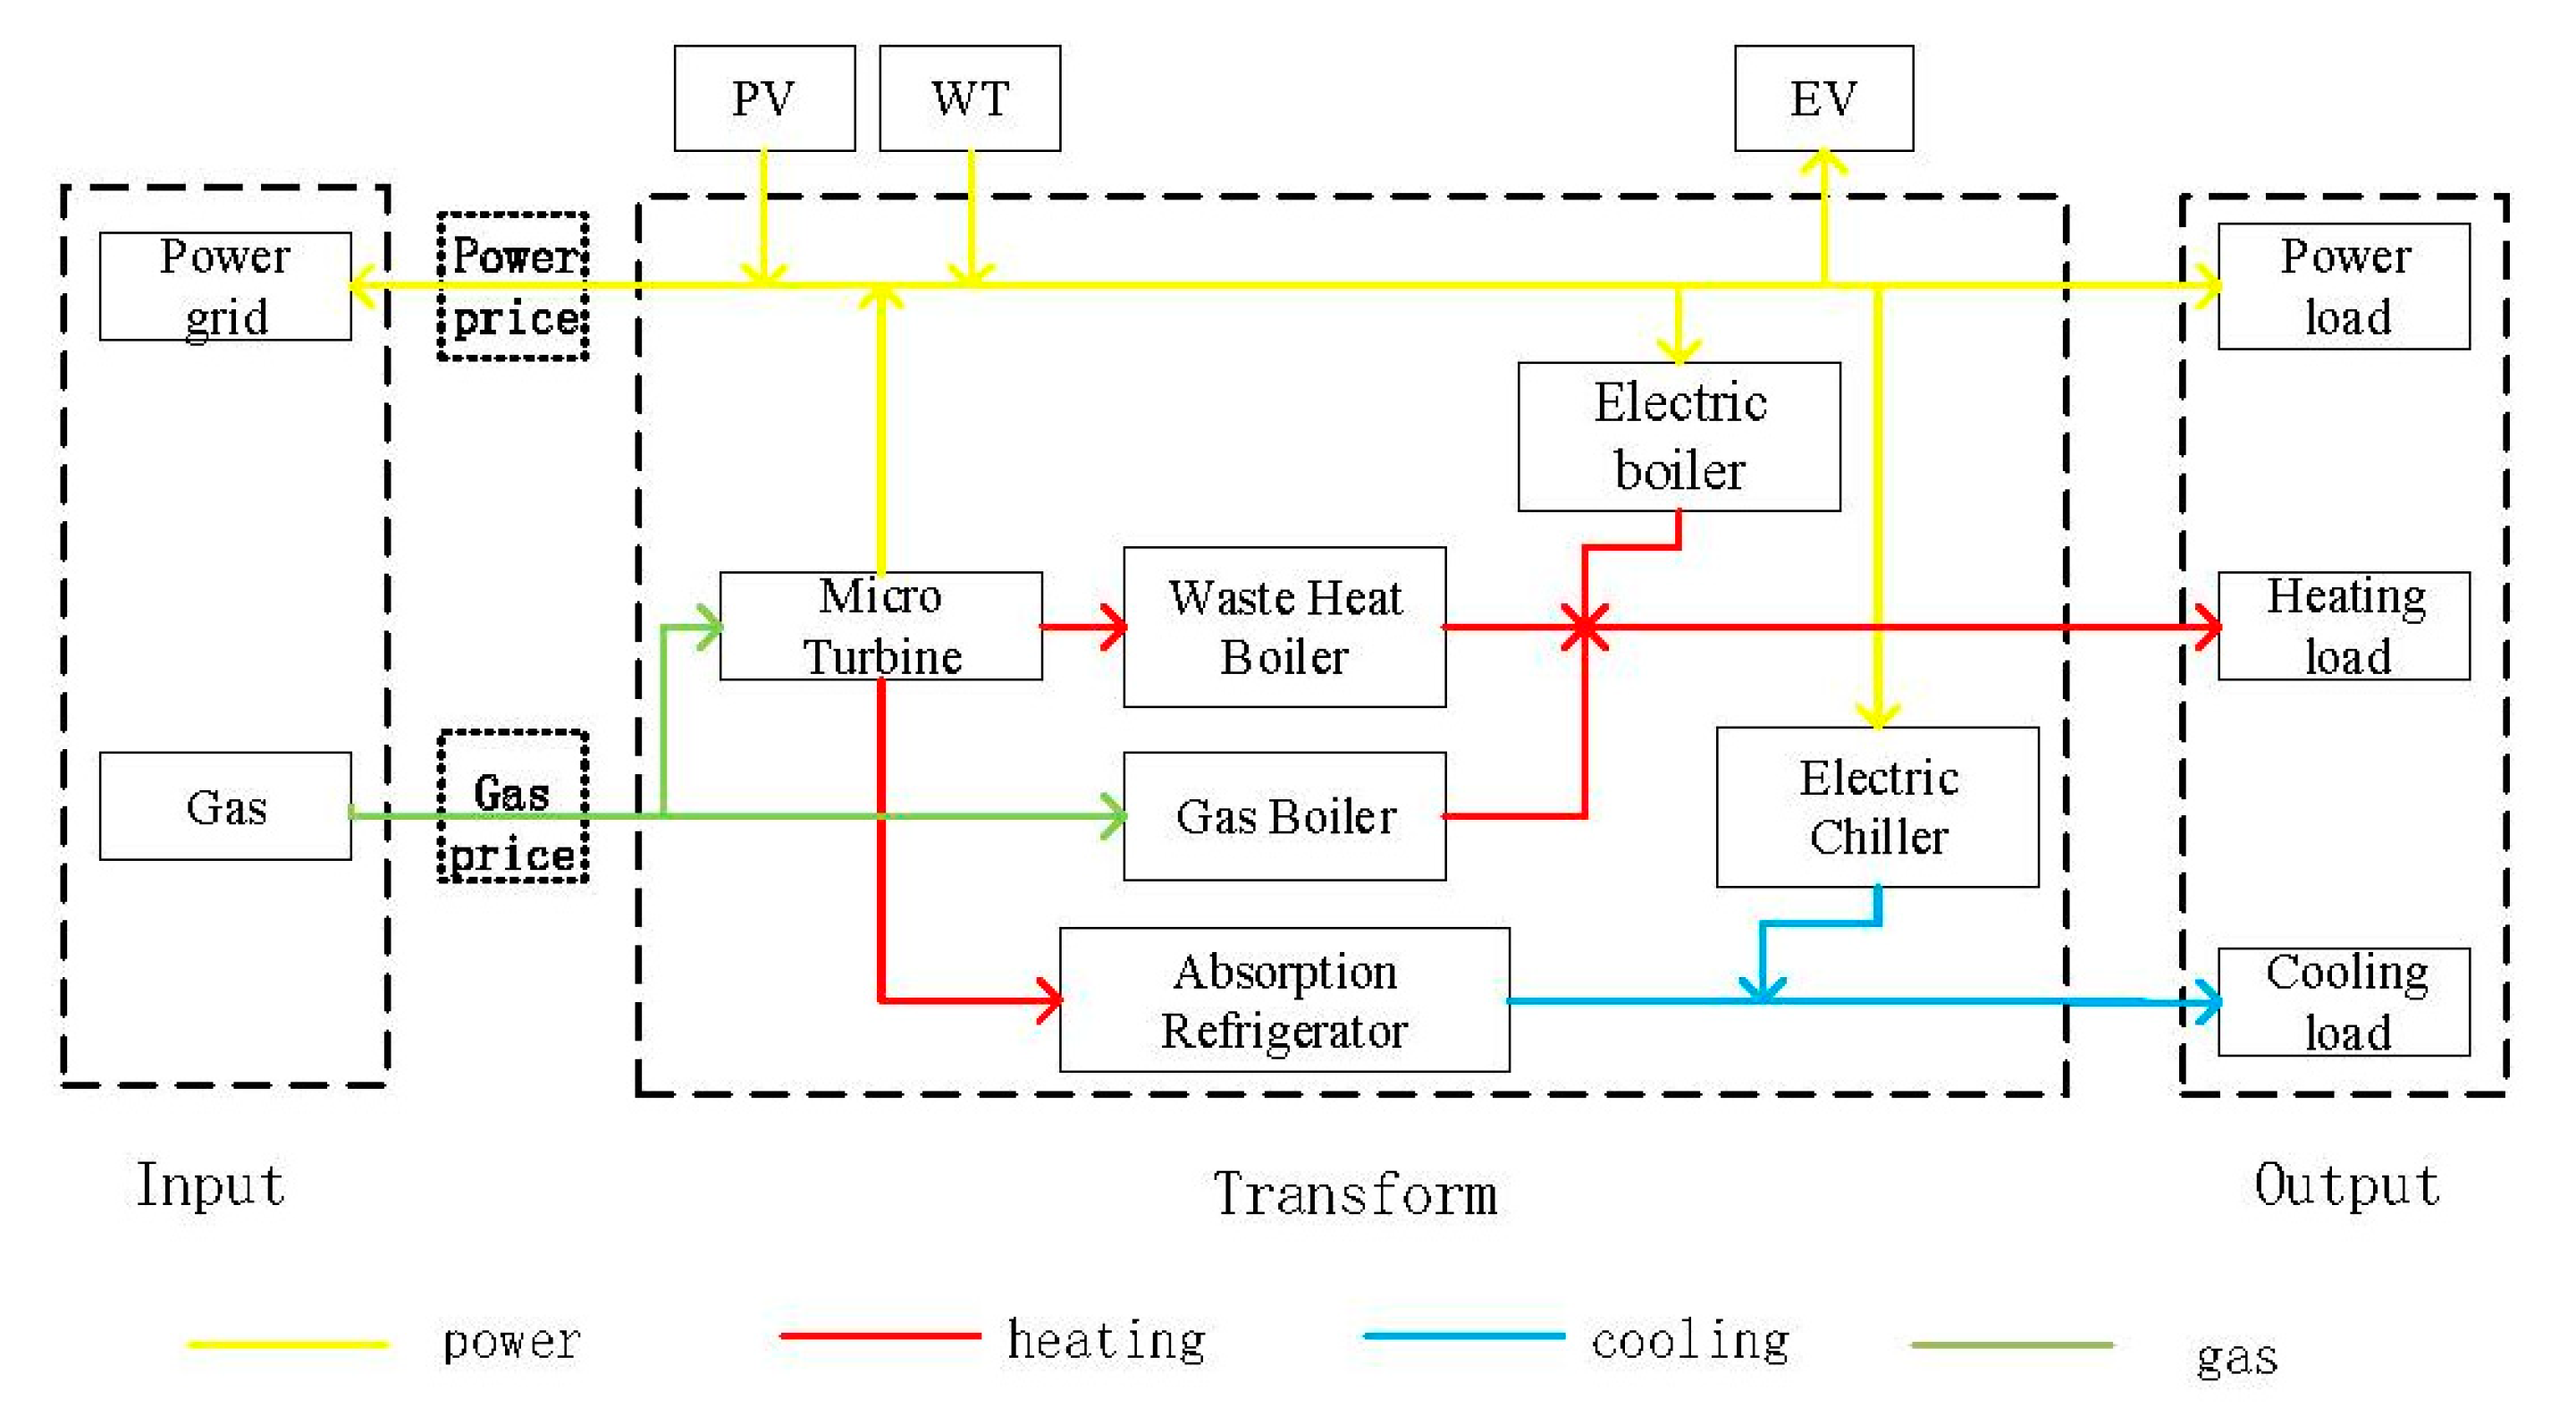
3.1. Integrated Energy System Model

In actual commercial building scenarios, huge fluctuations in shopping and catering consumption behavior caused by differences in the flow of people to and from work will change dramatically within one day. During the week, there will be huge changes due to differences in working days and holidays. The difference, during the year, there will be big changes due to the seasonal temperature and other differences [3]. Therefore, the changes in the various energy requirements of commercial buildings have posed a challenge to the operation of the integrated energy system. The structure of the integrated energy system (IES) is shown in Figure 8.
A combined cooling, heating and power (CCHP) system is a kind of co-production and supply system based on the concept of cascade utilization of energy, which takes natural gas as primary energy to produce heat, electricity and cooling. The main equipment includes a gas turbine, waste heat boiler and absorption refrigerator. A gas turbine, which is the core of the CCHP unit, is a device that converts the chemical energy of the fuel to electrical energy, with natural gas, biogas, as the fuel, by micro gas turbine combustion power generation. The rest of the smoke gas carries the heat to drive a waste heat boiler, and an absorption refrigerating machine can generate heat and cold respectively, to complete electrical trigeneration of cold and hot load requirements.
Micro turbine uses gas to generate electricity and generate a lot of waste heat. The micro turbine (MT) is constructed as follows:
P M T ( t ) = η M T Q g a s L H Δ τ
where P M T (kW) is the output work in a certain time interval t , Q g a s (kW) is the amount of gas used by the gas turbine; η M T is the efficiency coefficient of power generation, LH (kJ) is the low calorific value of gas, Δ τ is the operating time of equipment.
The mathematical model of an absorption refrigerator is as follows:
Q a r ( t ) = H a r ( t ) C O P a r
where Q a r ( t ) (kW) is the output of absorption refrigerator (kW), H a r ( t ) is the heating it absorbed (kW), C O P a r is the energy efficiency ratio of the equipment.
A gas boiler (GB) uses gas as fuel to convert the internal energy of gas into thermal energy, as shown in the mathematical model below:
H g b ( t ) = η g b Q g a s L H Δ τ
where H g b ( t ) (kW) is the output heat in a certain time interval t , Q g a s (kW) is the amount of gas used by the gas turbine; η g b is the efficiency coefficient of power generation, LH is the low calorific value of gas, Δ τ is the operating time of equipment.
In this paper, the waste heat boiler (HE) is mainly used to recover and utilize the heat energy of the gas-fired boiler for heating or feeding it to the absorption refrigerating machine for refrigeration and cooling load. Its mathematical model is as follows:
H h e ( t ) = P M T ( t ) ( 1 η M T ( t ) η l ) η M T ( t ) η h e C O P h e x ( t )
where η l is the coefficient of heat dissipation, η h e is the heat recovery efficiency, and C O P h e is the energy efficiency ratio of waste heat boiler. The mathematical model of electric refrigerator (EC) is as follows:
Q e c ( t ) = P e c ( t ) C O P e c
where Q e c (kW) is the output of electric refrigerator, Q e c (kW) is the electricity it consumed, C O P e c is the energy efficiency ratio of the equipment. The electric boiler (EB) converts heat by consuming electric energy to supply heat load, and its mathematical model is:
H e b ( t ) = P e b ( t ) C O P e b
where H e b (kW) is the output of electric refrigerator, P e b (kW) is the electricity it consumed, C O P e b is the energy efficiency ratio of the equipment.
In the actual generation process, the relationship between the actual power output P w t of a wind turbine (WT) and the actual wind speed v ( t ) can be expressed as:
P w t = { 0 v ( t ) < v c i v c i 3 v r 3 v c i 3 v ( t ) 3 P r v r 3 v c i 3 P t v c i < v ( t ) < v r P r v r < v ( t )
where v r , v c i (m/s) are the rated and cut-in wind speed of WT, respectively.
The actual effect of photovoltaic power generation is modeled as follows. The PV (photovoltage) power is shown in Formula (10), where P p v (kW) is the real-time power, ( G G m a x ) is the maximum illumination intensity.
P p v = 0 G m a x d G / G m a x P p v ( t ) f ( G G m a x )
In the combined cooling, heating and power (CCHP) system, the micro gas turbine (MT) is not only constrained by the interval of power, but also constrained by the variation of upper and lower rows, as shown in Formula (11) below:
{ U ( t ) P M T m i n P M T ( t ) U ( t ) P M T m a x P M T ( t 1 ) P M T ( t ) P d o w n P M T ( t ) P M T ( t 1 ) P u p
U ( t ) is a 0–1 variable, which represent whether it is working.

3.2. System Operation Constraints

For the output of the absorption refrigerator (AC), gas boiler (GB), and waste heat boiler (HE), there are the following constraints, as shown by Equations (12)–(14):
U ( t ) Q a c m i n Q a c ( t ) U ( t ) Q a c m a x
U ( t ) H b m i n H b ( t ) U ( t ) H b m a x
U ( t ) H h e m i n H h e ( t ) U ( t ) H h e m a x
In the heat pump system, the output of electric refrigerator (EC) and electric boiler (EB) meet the constraints of the following formula:
{ U ( t ) Q e c m i n Q e c ( t ) U ( t ) Q e c m a x U ( t ) H e b m i n H e b ( t ) U ( t ) H e b m a x

4. Low-Carbon Optimization Framework

4.1. Carbon Emission and Economic Cost

Meanwhile, based on the carbon dioxide emission calculation method in the literature [31], the carbon emission reduction effect of the above four cases is calculated by the following formula.
C E = C E e v + C E e l e + C E H + C E Q
That is, the total carbon emissions C E (g) from supplying electricity, heating and cooling to the commercial center with supplying electric vehicle charging are calculated. For EVs that cannot meet their charging needs in the integrated framework, it is approximated that their charging needs are met elsewhere by relying on grid charging.
The micro turbine, the core equipment of CCHP, burns gas for heat and energy, which is used for generating electricity or supplying a waste heat boiler and absorption refrigerator. Gas boilers use natural gas to burn heat. When the power is known, the amount of gas consumed can be known.
The gas cost at a certain point can be expressed as:
Cos t g a s Φ ( t ) = P M T ( t ) η M T L H R g a s + P g b ( t ) η g b L H R g a s
where Φ = MT , H B and R g a s is the price of gas.
This mainly represents the operation and maintenance cost of each piece of equipment, including gas turbine, gas boiler, electric refrigerator, electric boiler, absorption refrigerator, waste heat boiler and photovoltaic wind power maintenance cost.
Cos t m a Θ ( t ) = Θ R Θ P Θ ( t )
where Θ = MT , G B , E C , E H , H E , A R , P V , W T represents the maintenance cost of energy generated by the gas turbine, gas boiler, electric refrigerator, electric boiler, waste heat boiler and absorption refrigerator under working conditions.
Electricity purchase cost of the grid:
Cos t g r i d ( t ) = k M k P G R k ( t ) k
k is for different transformers. When the comprehensive energy system of the commercial system cannot fully meet its own energy needs, the energy operator purchases electricity from outside to meet the electricity needs of the commercial center, or the cooling and heating needs. The transformer types set are in Table 1. For general lighting and power load, 800 kVA and 1000 kVA transformers are used. For refrigeration and heating, 1000 kVA transformers are used. According to the policy of the Chinese power grid, different transformers are priced differently. According to the type of use, lighting transformers in commercial centers can be divided into commercial non-residential lighting transformers, refrigeration and heating transformers, and non-industrial and non-preferential electricity.
Electric vehicle charging revenue:
M r e v e n u e ( t ) = n t ( G E V W E V + S E V W E V )
When charging an EV, the energy operator will settle the charging fee according to the total power consumption of the EV, and charge the service fee according to the power consumption of the EV.

4.2. Objective Function and Overall Optimization Constraints

Cos t s y s = Φ t = 0 23 Cos t g a s Φ ( t ) + Θ t = 0 23 Cos t m a Θ ( t ) + t = 0 23 Cos t g r i d ( t ) t = 0 23 M r e v e n u e ( t ) + χ C E
where, χ is the coefficient of the price (CHY) per carbon emission(g), 0.5 CHY/g [37]. The integrated energy service provider signs a contract with the energy-supplied commercial center, and generally pays the overall energy supply cost at one time. Under such a mechanism, the lower the operating cost, the higher the profit of the integrated energy service provider.
The operating cost is the sum of the natural gas cost, equipment maintenance cost, and electricity purchase cost. The overall operating cost can be obtained by subtracting the revenue of electric vehicles.
Firstly, the load balance of the three energy flows is analyzed. Cooling load balancing constraints:
H a c ( t ) C O P a c + P e c ( t ) C O P e c = Q L l ( t )
H a c is the thermal power consumed by the absorption chiller in time period t ; C O P a c is the energy efficiency ratio of the absorption refrigerating machine, and P e c is the electric power consumed by the electric refrigerating machine in time period t ; C O P a c is the energy efficiency ratio of the electric refrigerator where Q L l ( t ) is the cooling load demand in time period t .
H e h ( t ) + H b ( t ) + H h e ( t ) H a c ( t ) = H L l ( t )
H e h , H b , H h e and H a c are, respectively, the heating power output of the electric boiler, the heating power output of the waste heat boiler, the heat power of the gas boiler, and the heat power consumed by the absorption refrigerator. H L l ( t ) is the cooling load demand in time period t .
P w t l ( t ) + P p v l ( t ) + P M T ( t ) + P g r i d ( t ) P e c ( t ) P e h ( t ) P e v ( t ) = P L l ( t )
P w t l , P p v l , P M T , P g r i d , P e c , P e h , P e v are, respectively, the output power of the wind turbine, PV output power, the active power generated by the micro-turbine, power purchased from the power grid, and the electric power consumed by the electric refrigerator and the electric boiler. P L l ( t ) is the cooling load demand in time period t .

5. Case Study

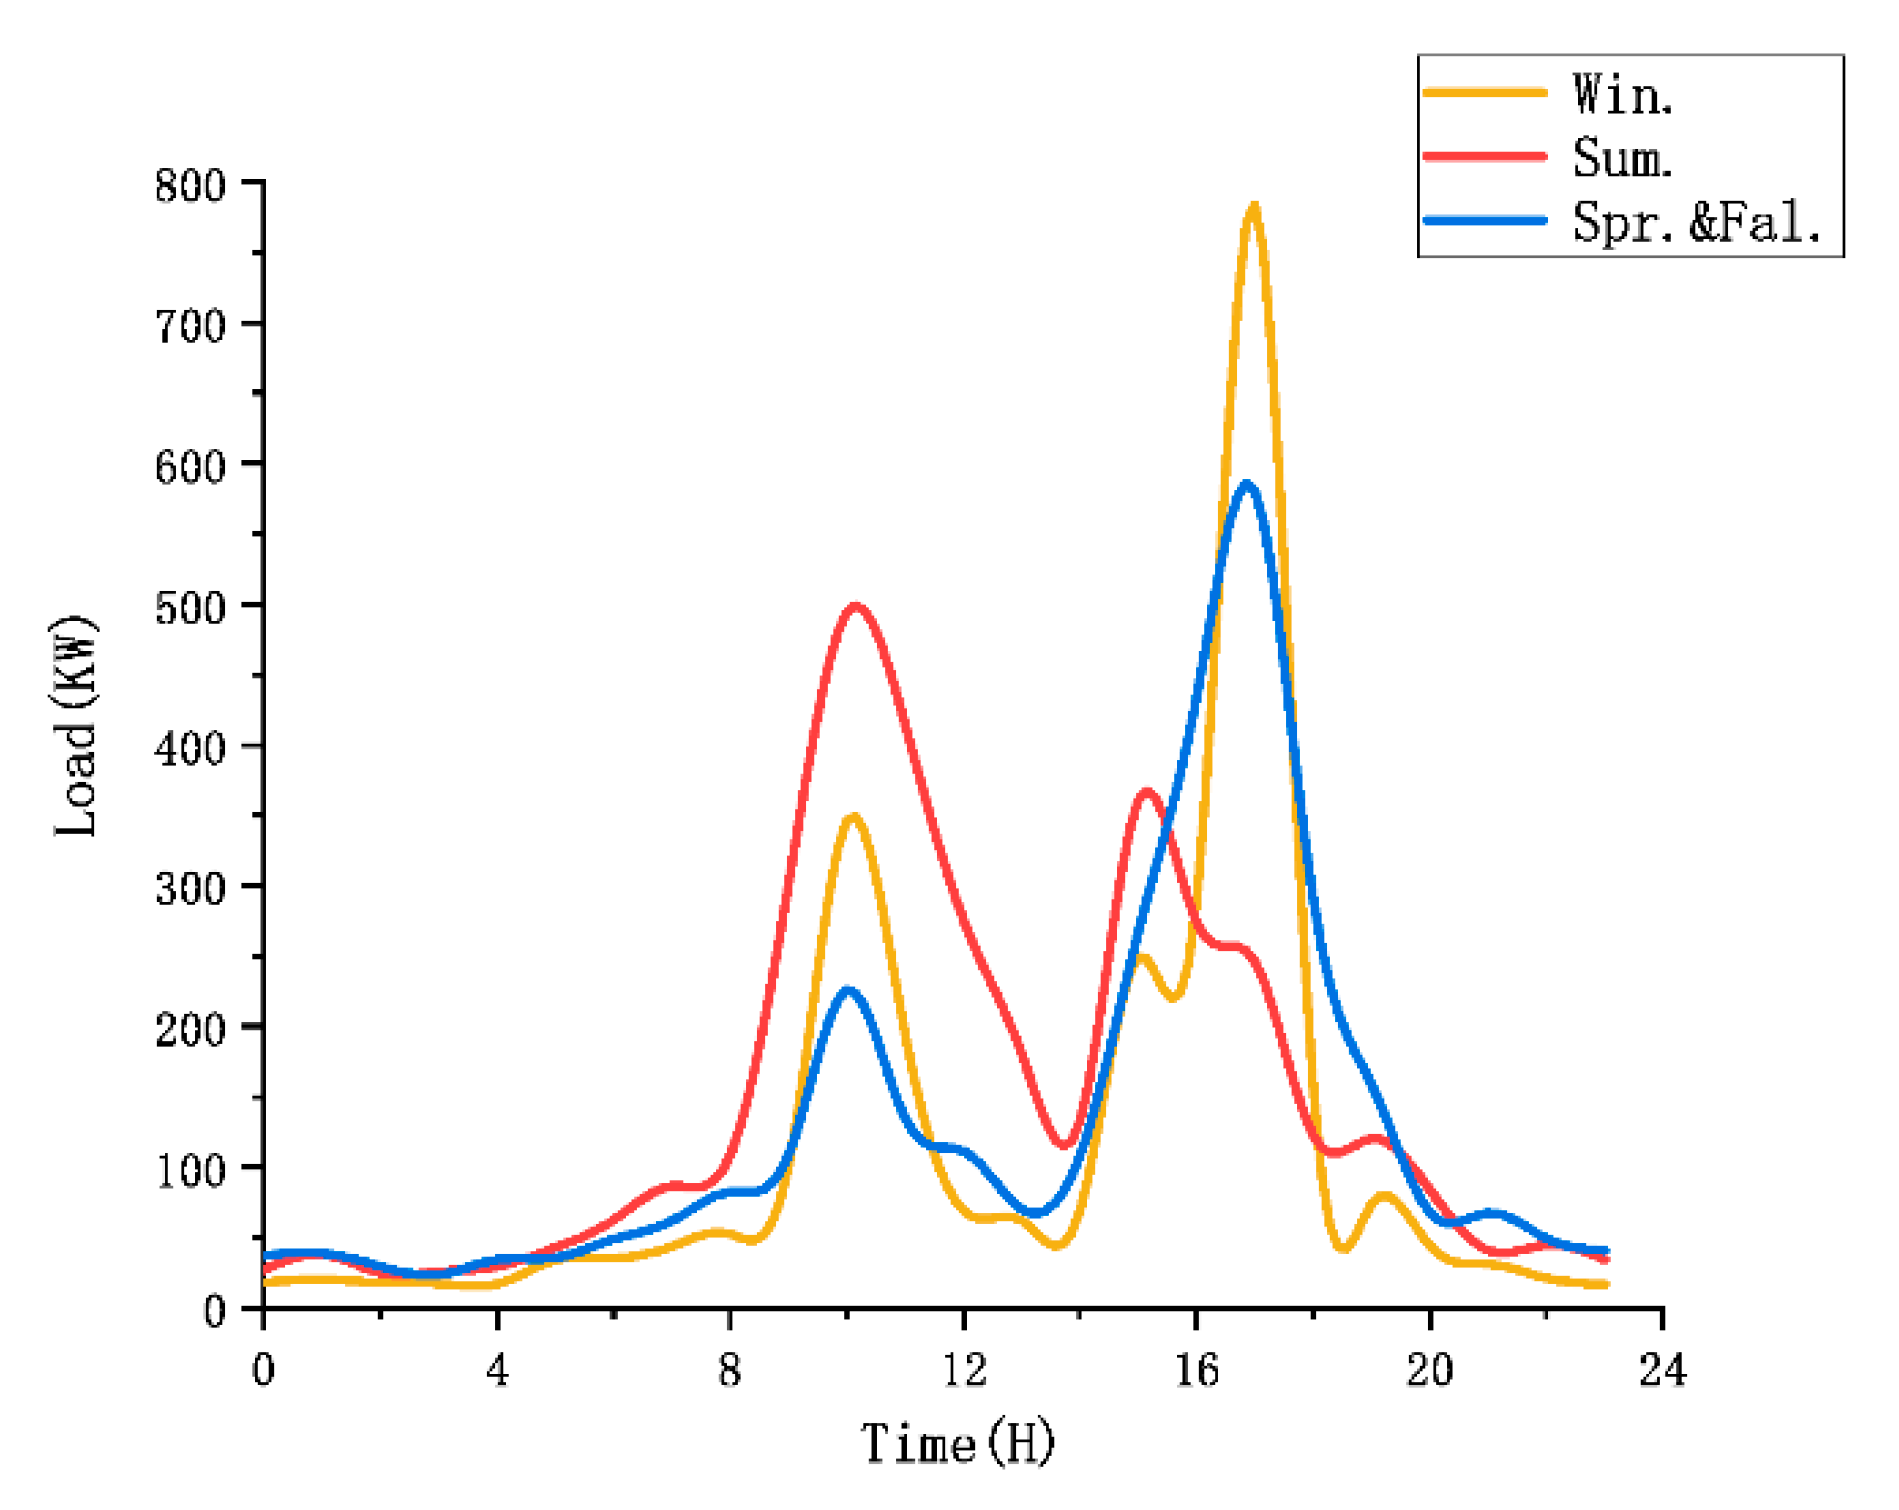
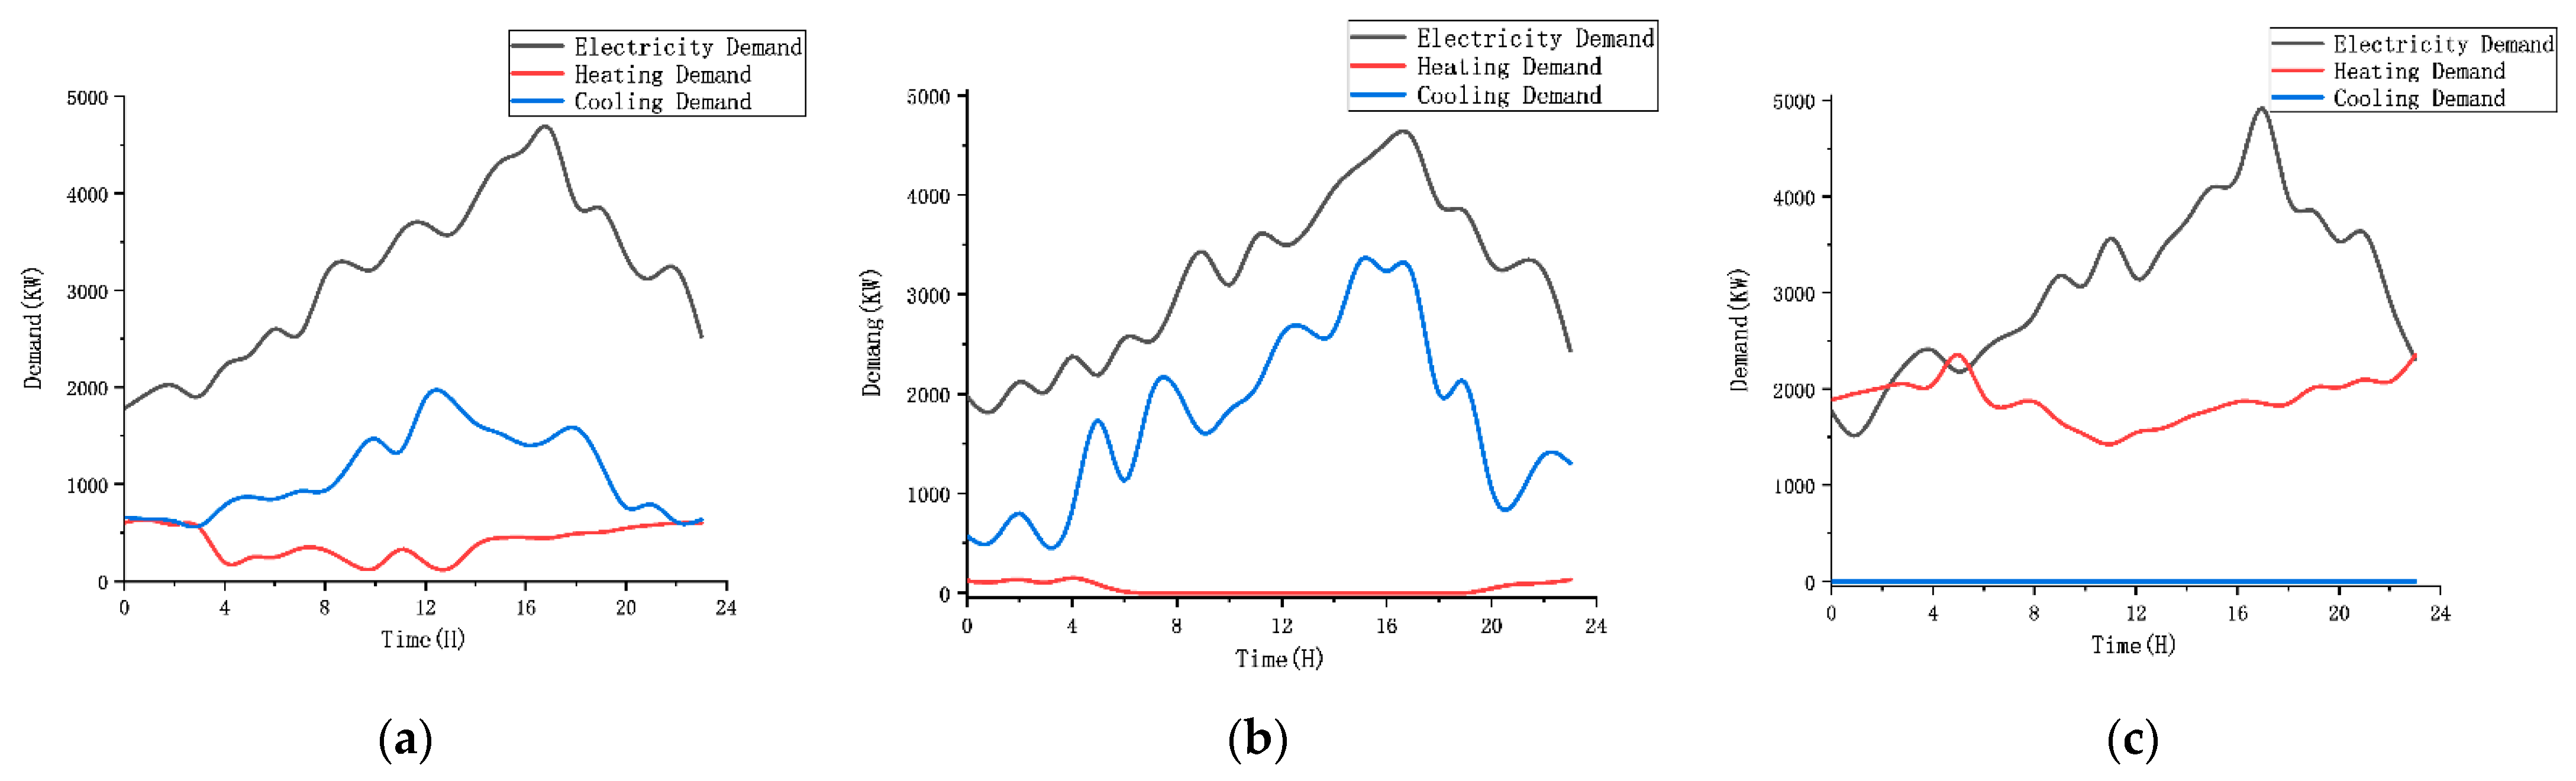
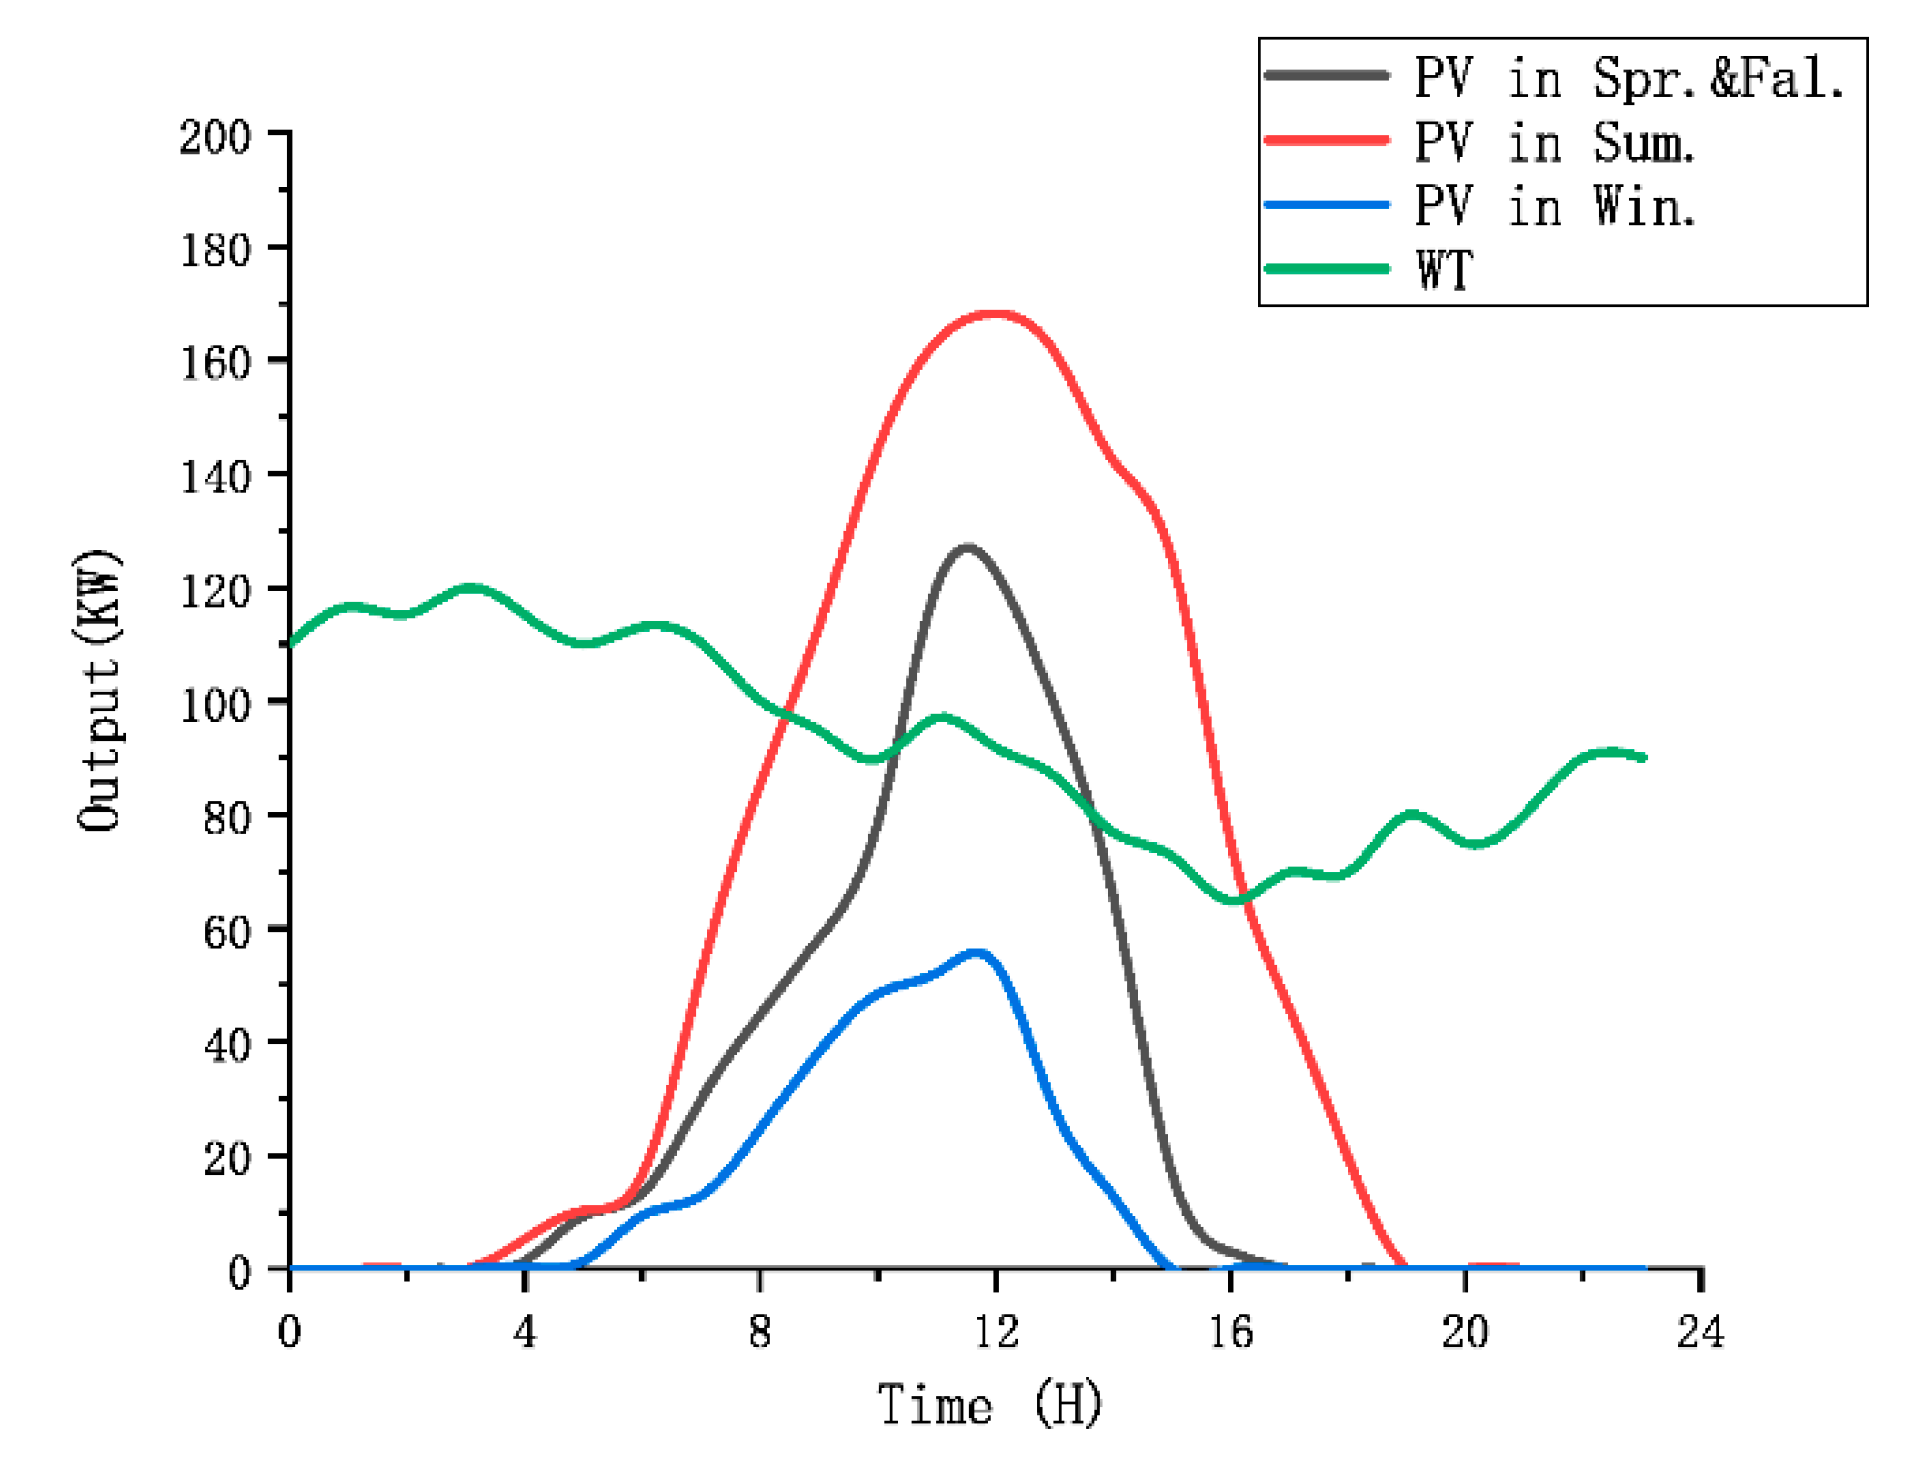
5.1. Overview of the Case Study
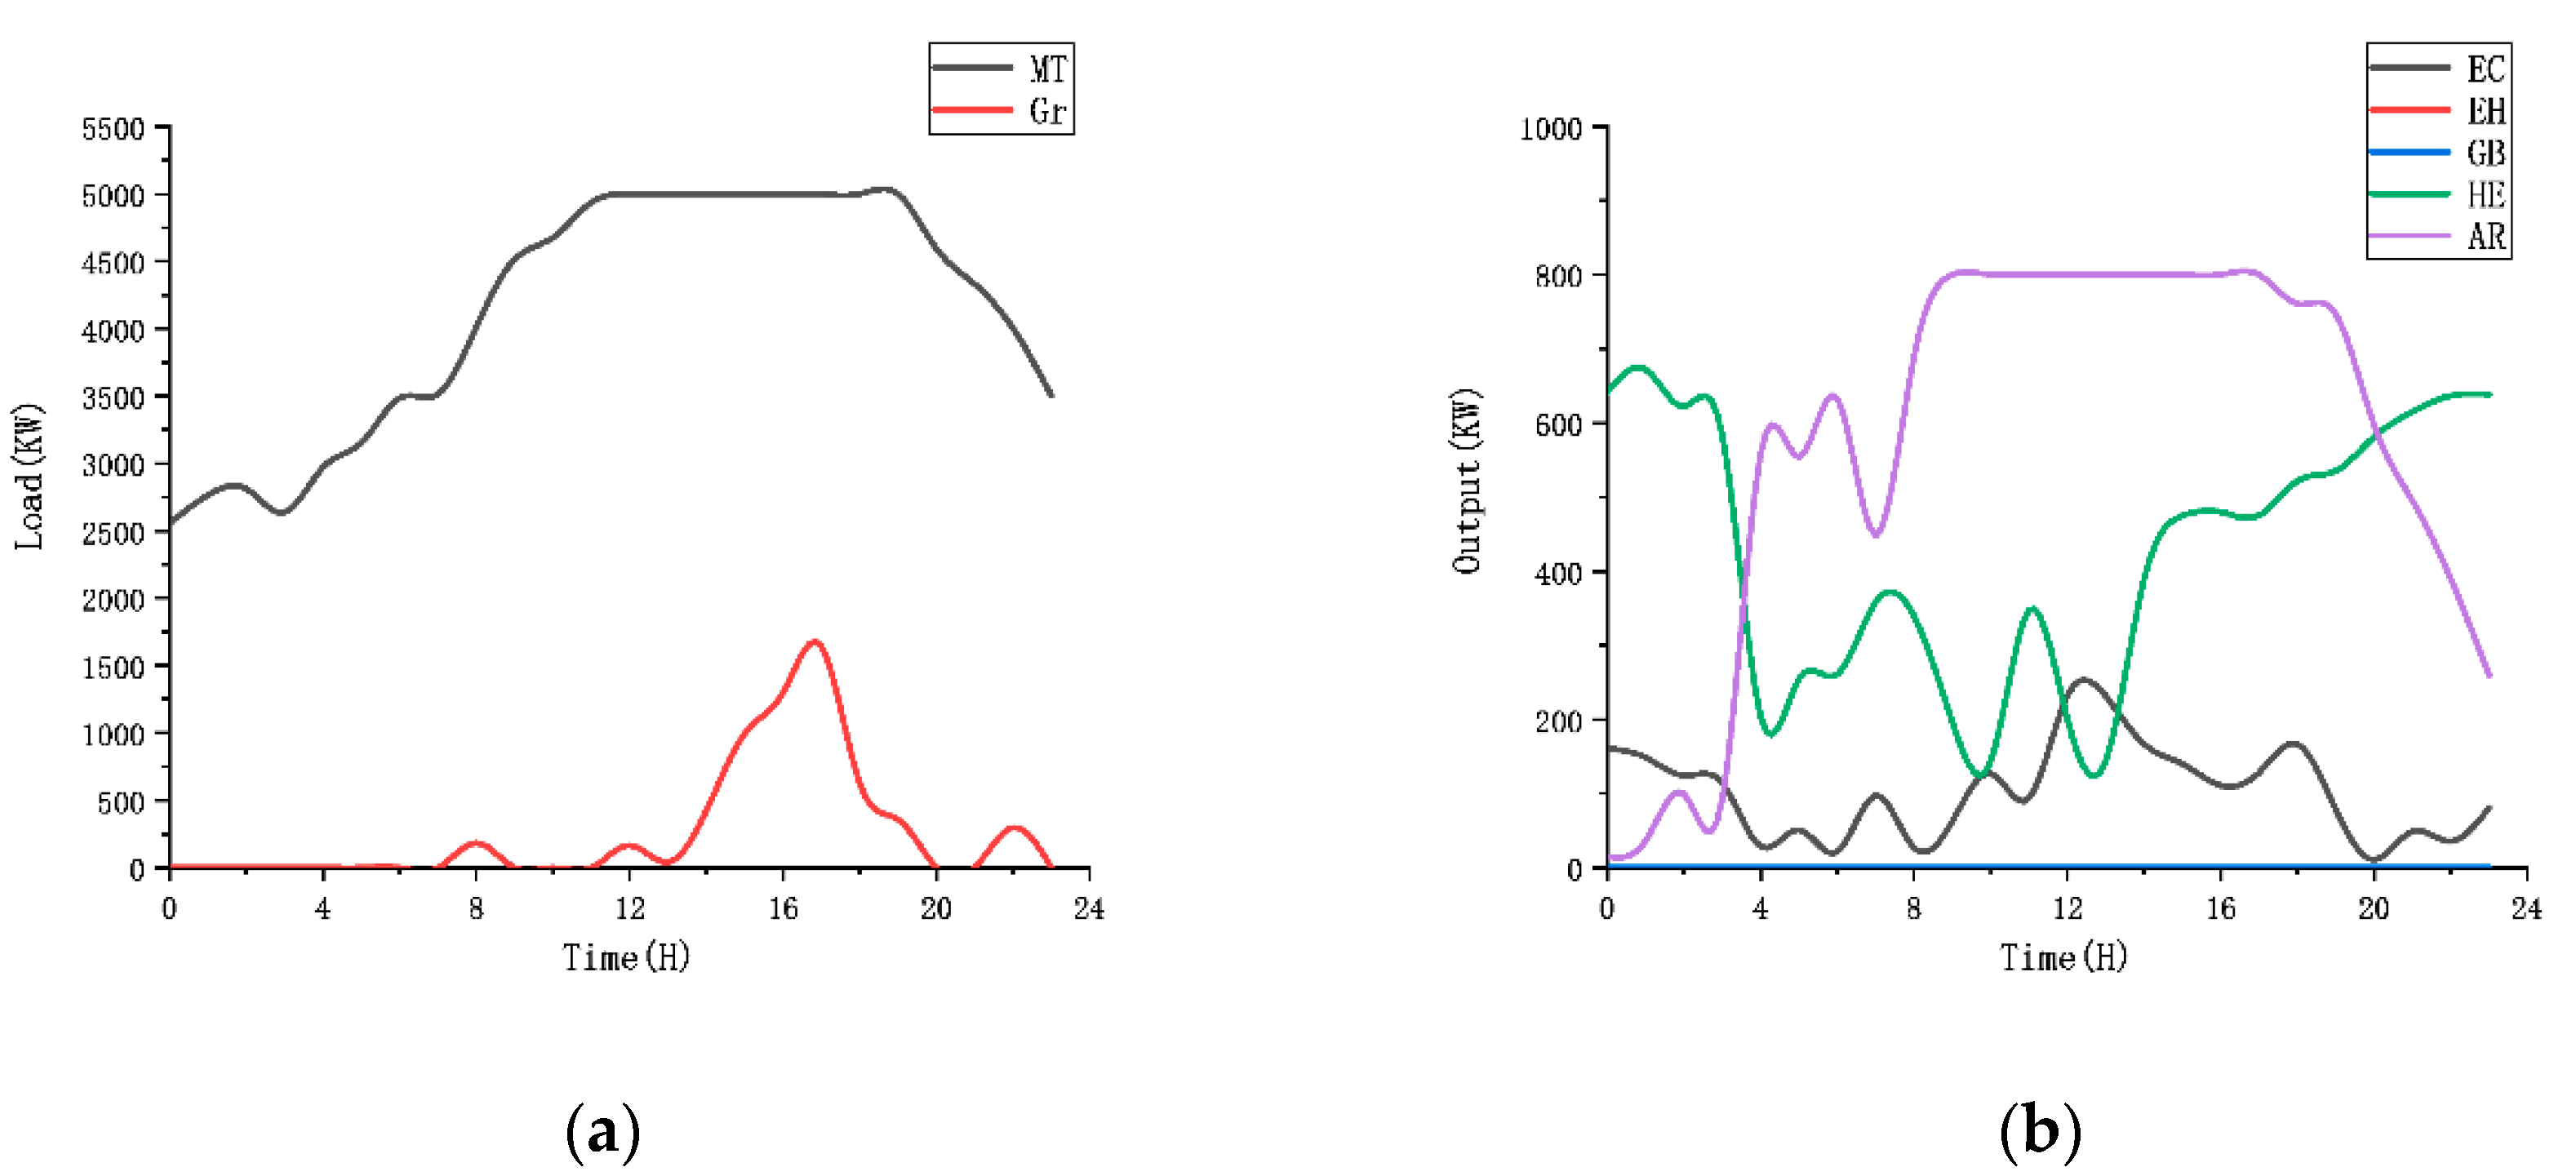
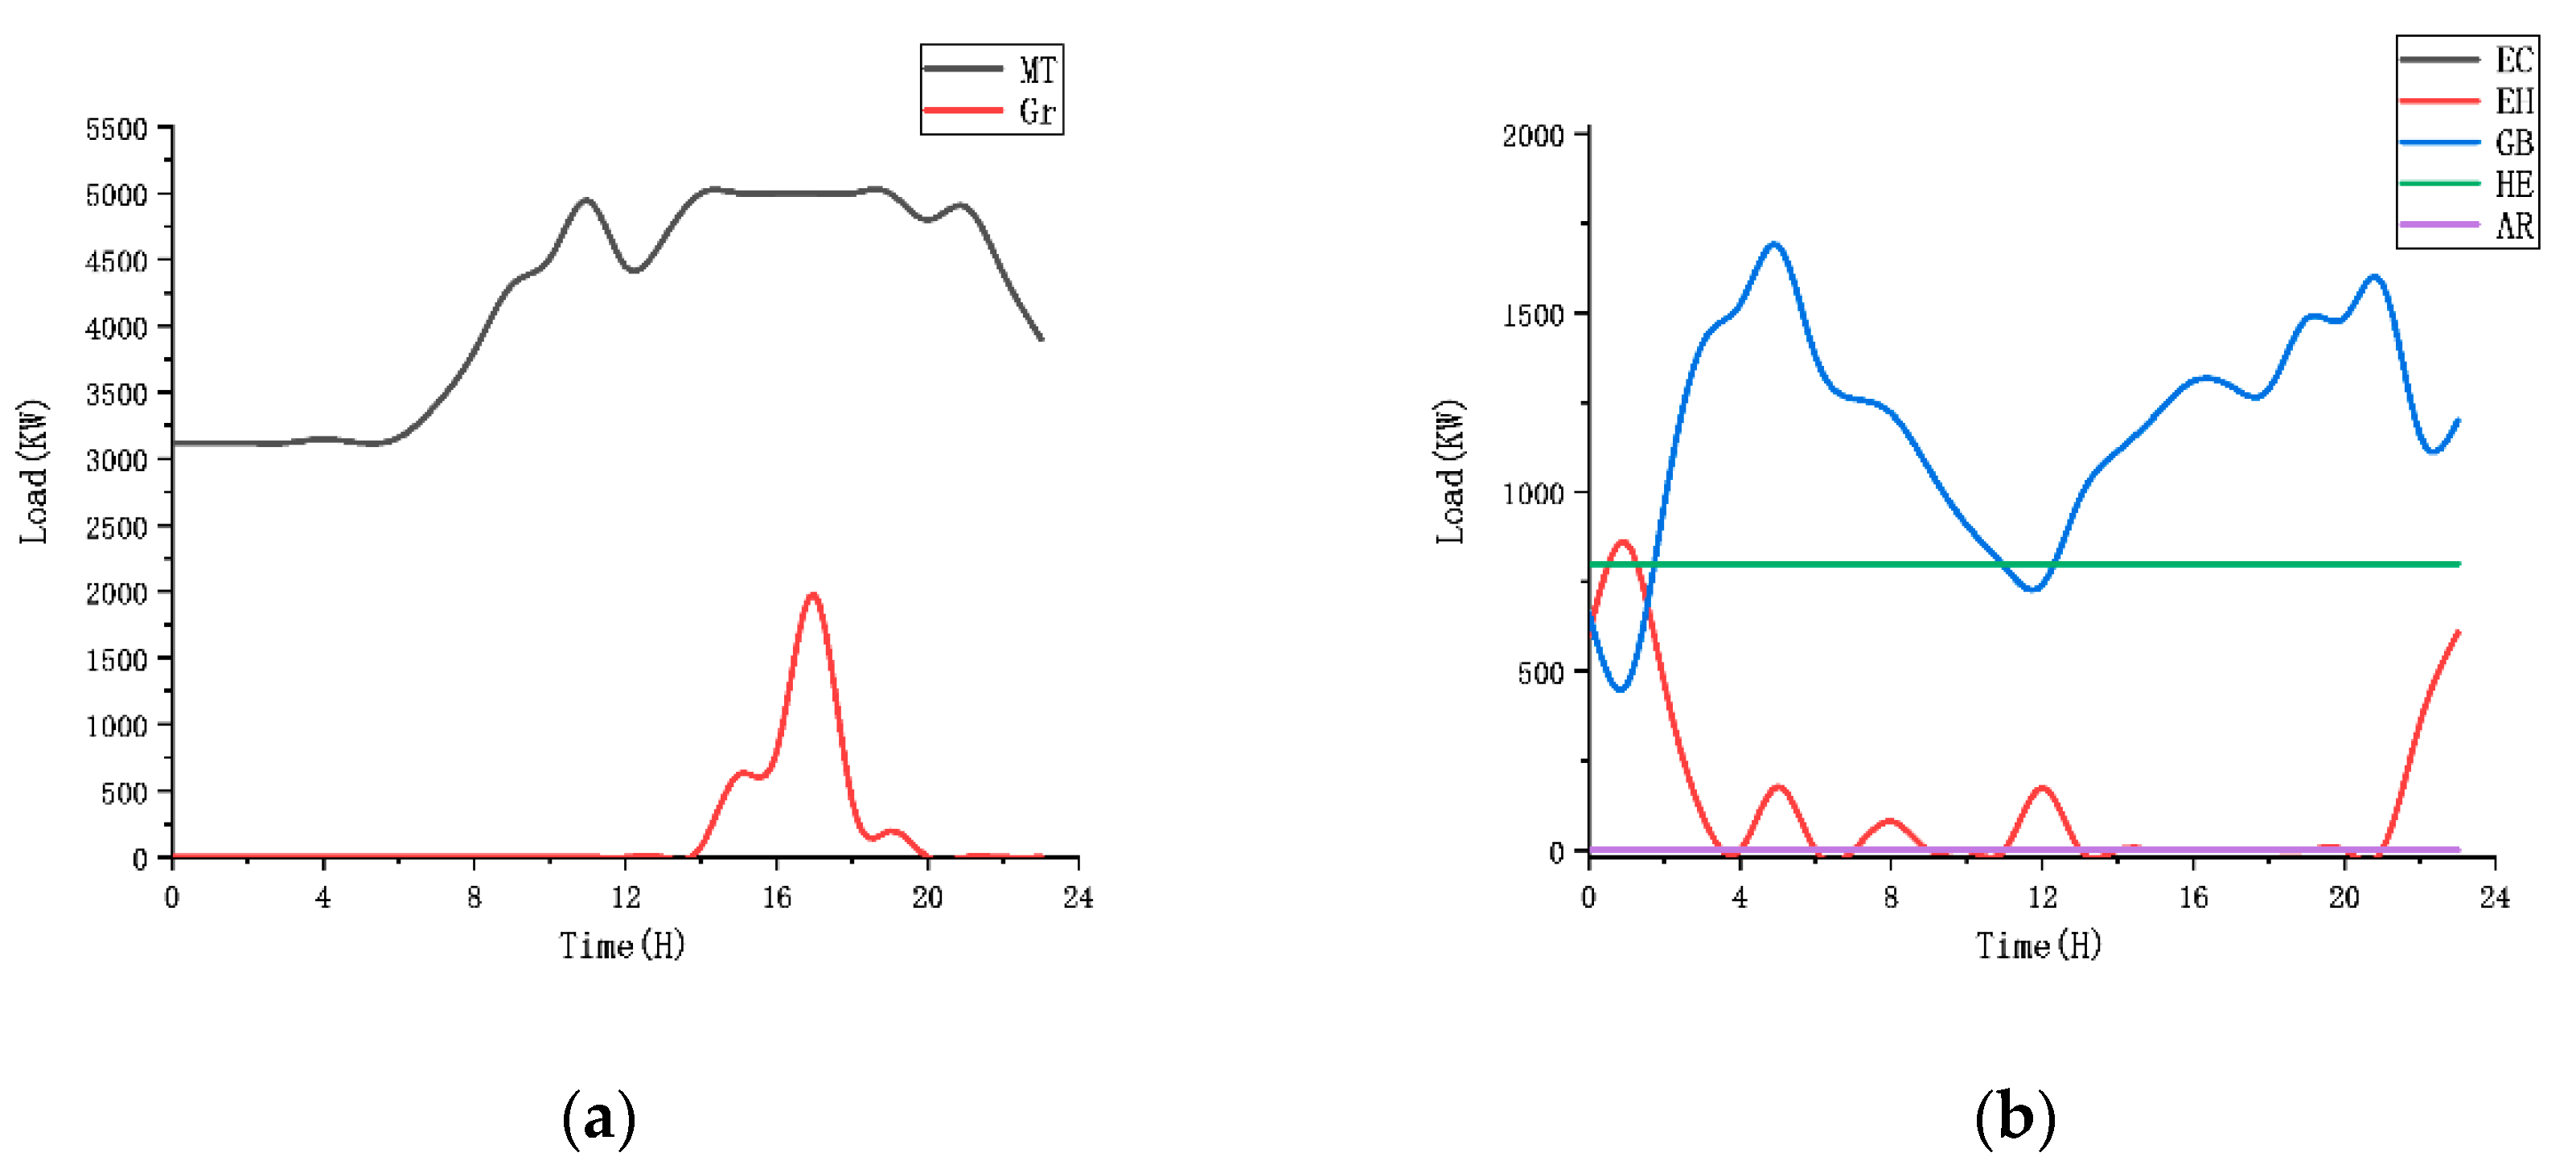
The typical commercial center selected in this article is divided into two parts, the department store building area is 20,387.4 square meters, and the shopping center building area is 69,473.5 square meters [38].
Through the Monte Carlo simulation above, the charging demand load curve of electric vehicles in different seasons is obtained in Figure 9.
As Figure 10 shows, Figure 10a is the load forecast curve of the commercial center at different times in typical spring and autumn which can be obtained from historical data [39,40], and Figure 10b is the commercial center in a typical load forecast curve at different times in summer. Figure 10c is the load forecast curve at different times in a typical winter. The electric load represented by the black curve has always maintained the highest value, and reached the highest value in the 16.00–18.00 interval, because at this time, the off-duty peak, the flow of people in the commercial center is at its maximum. Whether it is for lighting or commercial activities, more energy is needed.
Looking specifically at the demand for cooling and heating, during the spring and autumn seasons, as shown in Figure 10a, there are two peaks in cold energy, one is the 12.00–14.00 time period, the other is the 16.00–18.00 time period, and the first time period is due to noon. The temperature is high, so enough cooling power is needed to cool down. Another time period of high cooling demand is due to the large number of people. The interior of the mall needs to maintain a suitable temperature, so more cooling load is also needed. In summer, as shown in Figure 10b, the peak of refrigeration demand mainly occurs in the 15.00–18.00 time period. The superposition of the flow of people and high temperature makes the demand for refrigeration extremely high. In winter, as shown in Figure 10c, the heating demand is relatively stable, because the coldest time occurs in the early morning when the flow of people is scarce. At this time, the heating capacity increases slightly, but at the peak of the flow of people, the temperature is relatively high. Superimposed on the flow of people, heating demand is relatively low.
Under the conditions of different seasons, mainly because of the difference solar radiant energy, distributed renewable energy output of the system is also different, as Figure 11 shows; the green curve represents the typical output of wind power generation system, black curve is a photovoltaic power generation in the power of a typical Spring and Fall, the red curve is the power of a photovoltaic power generation system in a typical summer, and the blue curve is the power of photovoltaic power generation system in a typical winter.

5.2. Results

For the solution of an integrated energy system, most of the current research focuses on heuristic intelligent algorithm and mixed integer programming. Heuristic algorithms mostly rely on the algorithm design of swarm intelligence, and under a series of constraints, solve the relative optimal results for the designed objective function. In practice, however, in this approach often swarm intelligence algorithms themselves tend to fall into the local optimal, and the results are not optimal.
In contrast, mixed integer programming is more reliable, which is solved by researchers through formula derivation, self-programming or using integrated programming software. The Cplex series planning program from IBM is very mature and reliable in practical applications.
In this paper, the Yalmip tool of Cplex is used to solve the whole system. Under the direction of the minimum objective function, combined with the constraints in 4.3, the optimal running state of the integrated energy system is obtained. The following figures, Figure 12, Figure 13 and Figure 14, are the output of each equipment of integrated energy and external power purchase.
As can be seen from the above three figures, a micro gas turbine, as the core energy equipment, plays a leading role. Especially during the 16.00–20.00 period when the load demand is most concentrated, the micro gas turbine is always working at full load. It can be seen from the figure that even in different seasons, the period from 16.00 to 20.00 is always the peak demand of electric energy. At the same time, considering the load of electric vehicles in the figure, there is also a sharp peak in the period from 16.00 to 18.00 due to the off-duty shopping peak. The superposition of several factors greatly impacts the operation of the energy supply system of the whole shopping mall. At this point, integrated energy operators buy electricity from outside sources to meet peak energy demand. Therefore, in the above three figures, we can see clearly that the external variables of the electricity purchasing, the yellow Gr curve segment, within the period of 16.00–20.00 appeared with an extremely sharp peak, and Gr in other time periods are of low value (most of the time close to zero), which shows that the integrated energy system for most of the time period can be completely energy self-sufficient, during the peak period, and also can fully cope with peaks.
To be specific, in a typical spring and autumn, waste heat boilers and absorption chiller supplied by waste heat from micro gas turbines can output enough cooling power and heating power to meet the needs of heating and cooling in a typical spring and autumn, because the load of cooling and heating demand is relatively low, but the demand of electric energy is high. The electric refrigerating machine, electric boiler and gas boiler are in shutdown state.
In a typical winter, due to the high heating demand, the waste heat boiler is always in the highest output state and cannot meet the heating demand, so the gas-fired boiler and the electric boiler are always in the working state. The difference is that gas-fired boilers use primary energy heating directly, which is more economical than electric boilers that rely on secondary energy heating. Therefore, gas-fired boilers operate at a high level all the time, but electric boilers operate only when there is a high demand for heating. The refrigerating equipment is always inactive during the winter.
In a typical summer, due to the cooling load being higher, the absorption chiller is in heavy-duty operation, especially during the 08.00 to 20.00 period, the whole day at the highest load operation. The rest of the cooling demand, by the electric machine is met. Therefore, we can see the output of the electric machine in the process of 08.00~20.00 slowly going up and down, and refrigeration demand fluctuations are consistent. Due to the low temperature at night, the market also has a certain heat production demand, which is provided by waste heat boilers instead of gas-fired boilers, because waste heat boilers provide heat more economically.

5.3. Carbon Emission and Economic Benefit Analysis

The carbon emission is analyzed in Table 2 between integrated energy systems (IES) and grid, also the economic benefit is analyzed in Table 3.
Regardless of the season, the comprehensive energy supply method greatly reduces the emission of pollutants. In the foreseeable future, with the implementation of a series of policies such as the carbon trading environmental tax, the comprehensive energy operation method will become more effective. Compared to a grid, the carbon emissions of IES have been reduced 41.1%, 42.1%, and 54.2%, respectively in Spring and Fall, winter, and summer.
As Table 3 shows, it is obvious that the energy supply of integrated energy system is much cheaper than that of traditional energy supply mode relying on an external power grid. At the same time, it is noted that the charging of electric vehicles also brings considerable benefits to comprehensive energy service providers, which further enriches the benefits of comprehensive energy operators. Compared to the grid, the operation cost of IES has been reduced by 50.9%, 51.9%, and 46.9% respectively in Spring and Fall, winter, and summer.

6. Conclusions

This paper first analyzes the charging demand of electric vehicles, and establishes the time and load model of electric vehicle charging demand based on the modeling of parking behavior and parking time. After that, the low-carbon oriented integrated energy system model in commercial building was established. Combined with the consideration of the electric vehicle charging demand response, an optimization framework was proposed. Through the analysis of the solution of the operation model, the feasibility of the proposed optimization framework in terms of carbon emissions and economic benefits is verified, which shows far better performance than the traditional operation mode of commercial building.
For renewable energy output and the stochasticity of different loads in the system, further research in the future can give more consideration to the methodological study of complex stochasticity. Meanwhile, with the further development of carbon policy in the carbon market, the proposed method can be combined with carbon trading and other models based on the framework of this paper to give the proposed method better adaptability in the future. The development of energy storage technology and V2G and other technologies have a better impact on energy system management, so they can be further combined in the future research on integrated energy system management.

Author Contributions

Conceptualization, Z.W. and X.L.; methodology, Z.W.; software, X.L.; validation, X.L., Y.L.; formal analysis, T.Z.; investigation, T.Z. resources, X.X.; data curation, X.X.; writing—original draft preparation Z.W.; writing—review and editing, H.Z.; visualization, X.L.; supervision, Y.L.; project administration, Y.L.; funding acquisition, X.X. All authors have read and agreed to the published version of the manuscript.

Funding

This work was supported by State Grid Corporation of China “Research on large-scale flexible resource of demand side interaction response technology to cope with high proportion of renewable energy” (No. 5100-202114296A-0-0-00).

Institutional Review Board Statement

Not applicable.

Informed Consent Statement

Not applicable.

Data Availability Statement

Not applicable.

Conflicts of Interest

The authors declare no conflict of interest.

References

  1. Barnes, E.; Parrish, K. Small buildings, big impacts: The role of small commercial building energy efficiency case studies in 2030 Districts. Sustain. Cities Soc. 2016, 27, 210–221. [Google Scholar] [CrossRef] [Green Version]
  2. US Department of Energy. Buildings Energy Data Book; Energy Efficiency & Renewable Energy Department: Washington, DC, USA, 2011; p. 286.
  3. Rafsanjani, H.N.; Moayedi, S.; Ahn, C.R.; Alahmad, M. A load-disaggregation framework to sense personalized energy-use information in commercial buildings. Energy Build. 2020, 207, 109633. [Google Scholar] [CrossRef]
  4. Jiang, P.; Dong, J.; Huang, H. Optimal integrated demand response scheduling in regional integrated energy system with concentrating solar power. Appl. Therm. Eng. 2020, 166, 114754. [Google Scholar] [CrossRef]
  5. Braun, P.; Rüther, R. The role of grid-connected, building-integrated photovoltaic generation in commercial building energy and power loads in a warm and sunny climate. Energy Convers. Manag. 2010, 51, 2457–2466. [Google Scholar] [CrossRef]
  6. Lee, E.S.; Gehbauer, C.; Coffey, B.E.; McNeil, A.; Stadler, M.; Marnay, C. Integrated control of dynamic facades and distributed energy resources for energy cost minimization in commercial buildings. Sol. Energy 2015, 122, 1384–1397. [Google Scholar] [CrossRef] [Green Version]
  7. Mbungu, N.T.; Naidoo, R.M.; Bansal, R.C.; Siti, M.W.; Tungadio, D.H. An overview of renewable energy resources and grid integration for commercial building applications. J. Energy Storage 2020, 29, 101385. [Google Scholar] [CrossRef]
  8. Barone, G.; Buonomano, A.; Forzano, C.; Giuzio, G.F.; Palombo, A. Passive and active performance assessment of building integrated hybrid solar photovoltaic/thermal collector prototypes: Energy, comfort, and economic analyses. Energy 2020, 209, 118435. [Google Scholar] [CrossRef]
  9. Varghese, S.; Sioshansi, R. The price is right? How pricing and incentive mechanisms in California incentivize building distributed hybrid solar and energy-storage systems. Energy Policy 2020, 138, 111242. [Google Scholar] [CrossRef]
  10. Ghersi, D.E.; Amoura, M.; Loubar, K.; Desideri, U.; Tazerout, M. Multi-objective optimization of CCHP system with hybrid chiller under new electric load following operation strategy. Energy 2020, 219, 119574. [Google Scholar] [CrossRef]
  11. Nami, H.; Anvari-Moghaddam, A.; Arabkoohsar, A. Application of CCHPs in a centralized domestic heating, cooling and power network—Thermodynamic and economic implications. Sustain. Cities Soc. 2020, 60, 102151. [Google Scholar] [CrossRef]
  12. Ren, F.; Wei, Z.; Zhai, X. Multi-objective optimization and evaluation of hybrid CCHP systems for different building types. Energy 2021, 215, 119096. [Google Scholar] [CrossRef]
  13. Acha, S.; Mariaud, A.; Shah, N.; Markides, C. Optimal design and operation of distributed low-carbon energy technologies in commercial buildings. Energy 2018, 142, 578–591. [Google Scholar] [CrossRef]
  14. Lopez-Behar, D.; Tran, M.; Mayaud, J.R.; Froese, T.; Herrera, O.E.; Merida, W. Putting electric vehicles on the map: A policy agenda for residential charging infrastructure in Canada. Energy Res. Soc. Sci. 2019, 50, 29–37. [Google Scholar] [CrossRef]
  15. Alhazmi, Y.A.; Mostafa, H.A.; Salama, M.M. Optimal allocation for electric vehicle charging stations using Trip Success Ratio. Int. J. Electr. Power Energy Syst. 2017, 91, 101–116. [Google Scholar] [CrossRef]
  16. Mehrjerdi, H.; Hemmati, R. Stochastic model for electric vehicle charging station integrated with wind energy. Sustain. Energy Technol. Assess. 2020, 37, 100577. [Google Scholar] [CrossRef]
  17. Robledo, C.B.; Oldenbroek, V.; Abbruzzese, F.; van Wijk, A.J. Integrating a hydrogen fuel cell electric vehicle with vehicle-to-grid technology, photovoltaic power and a residential building. Appl. Energy 2018, 215, 615–629. [Google Scholar] [CrossRef]
  18. Liu, L.; Xie, F.; Huang, Z.; Wang, M. Multi-Objective Coordinated Optimal Allocation of DG and EVCSs Based on the V2G Mode. Processes 2021, 9, 18. [Google Scholar] [CrossRef]
  19. Zhu, W.; Guo, J.; Zhao, G. Multi-Objective Dispatching Optimization of an Island Microgrid Integrated with Desalination Units and Electric Vehicles. Processes 2021, 9, 798. [Google Scholar] [CrossRef]
  20. Zhang, F.; Yao, S.; Zeng, X.; Yang, P.; Zhao, Z.; Lai, C.S.; Lai, L.L. Operation Strategy for Electric Vehicle Battery Swap Station Cluster Participating in Frequency Regulation Service. Processes 2021, 9, 1513. [Google Scholar] [CrossRef]
  21. Quddus, A.; Shahvari, O.; Marufuzzaman, M.; Usher, J.M.; Jaradat, R. A collaborative energy sharing optimization model among electric vehicle charging stations, commercial buildings, and power grid. Appl. Energy 2018, 229, 841–857. [Google Scholar] [CrossRef]
  22. Flores, R.; Shaffer, B.P.; Brouwer, J. Electricity costs for a Level 3 electric vehicle fueling station integrated with a building. Appl. Energy 2017, 191, 367–384. [Google Scholar] [CrossRef] [Green Version]
  23. Huang, P.; Lovati, M.; Zhang, X.; Bales, C. A coordinated control to improve performance for a building cluster with energy storage, electric vehicles, and energy sharing considered. Appl. Energy 2020, 268, 114983. [Google Scholar] [CrossRef]
  24. Lin, H.; Liu, Y.; Sun, Q.; Xiong, R.; Li, H.; Wennersten, R. The impact of electric vehicle penetration and charging patterns on the management of energy hub—A multi-agent system simulation. Appl. Energy 2018, 230, 189–206. [Google Scholar] [CrossRef]
  25. Guerra, E.; Daziano, R.A. Electric vehicles and residential parking in an urban environment: Results from a stated preference experiment. Transp. Res. Part D Transp. Environ. 2020, 79, 102222. [Google Scholar] [CrossRef]
  26. Luo, L.; Gu, W.; Zhou, S.; Huang, H.; Gao, S.; Han, J.; Wu, Z.; Dou, X. Optimal planning of electric vehicle charging stations comprising multi-types of charging facilities. Appl. Energy 2018, 226, 1087–1099. [Google Scholar] [CrossRef]
  27. Jin, F.; An, K.; Yao, E. Mode choice analysis in urban transport with shared battery electric vehicles: A stated-preference case study in Beijing, China. Transp. Res. Part A Policy Pract. 2020, 133, 95–108. [Google Scholar] [CrossRef]
  28. Min, H.; Zhang, Z.; Sun, W.; Min, Z.; Yu, Y.; Wang, B. A thermal management system control strategy for electric vehicles under low-temperature driving conditions considering battery lifetime. Appl. Therm. Eng. 2020, 181, 115944. [Google Scholar] [CrossRef]
  29. Wang, T.; Wu, X.; Xu, S.; Hofmann, H.; Du, J.; Li, J.; Ouyang, M.; Song, Z. Performance of plug-in hybrid electric vehicle under low temperature condition and economy analysis of battery pre-heating. J. Power Sources 2018, 401, 245–254. [Google Scholar] [CrossRef]
  30. Zhang, G.; Ge, S.; Yang, X.-G.; Leng, Y.; Marple, D.; Wang, C.-Y. Rapid restoration of electric vehicle battery performance while driving at cold temperatures. J. Power Sources 2017, 371, 35–40. [Google Scholar] [CrossRef]
  31. Yi, Z.; Smart, J.; Shirk, M. Energy impact evaluation for eco-routing and charging of autonomous electric vehicle fleet: Ambient temperature consideration. Transp. Res. Part C Emerg. Technol. 2018, 89, 344–363. [Google Scholar] [CrossRef]
  32. Lofberg, J. YALMIP: A toolbox for modeling and optimization in MATLAB. In Proceedings of the 2004 IEEE International Conference on Robotics and Automation (IEEE Cat. No. 04CH37508), Taipei, Taiwan, 2–4 September 2004; pp. 284–289. [Google Scholar]
  33. Li, P.; Wang, Z.; Yang, W.; Liu, H.; Yin, Y.; Wang, J.; Guo, T. Hierarchically partitioned coordinated operation of distributed integrated energy system based on a master-slave game. Energy 2021, 214, 119006. [Google Scholar] [CrossRef]
  34. Ebrahimi, M.; Keshavarz, A. Sizing the prime mover of a residential micro-combined cooling heating and power (CCHP) system by multi-criteria sizing method for different climates. Energy 2013, 54, 291–301. [Google Scholar] [CrossRef]
  35. Hosseini, M.S.; Carli, R.; Dotoli, M. A Residential Demand-Side Management Strategy under Nonlinear Pricing Based on Robust Model Predictive Control. In Proceedings of the 2019 IEEE International Conference on Systems, Man and Cybernetics (SMC), Bari, Italy, 6–9 October 2019; pp. 3243–3248. [Google Scholar]
  36. Melhem, F.Y.; Grunder, O.; Hammoudan, Z.; Moubayed, N. Energy Management in Electrical Smart Grid Environment Using Robust Optimization Algorithm. IEEE Trans. Ind. Appl. 2018, 54, 2714–2726. [Google Scholar] [CrossRef]
  37. Gasser, J.; Cai, H.; Karagiannopoulos, S.; Heer, P.; Hug, G. Predictive energy management of residential buildings while self-reporting flexibility envelope. Appl. Energy 2021, 288, 116653. [Google Scholar] [CrossRef]
  38. Ro, L. Energy optimization operation model for large shopping malls considering uncertainty. Power Demand Side Manag. (Chin.) 2020, 22, 72–76. [Google Scholar]
  39. Scarabaggio, P.; Grammatico, S.; Carli, R.; Dotoli, M. Distributed Demand Side Management with Stochastic Wind Power Forecasting. IEEE Trans. Control Syst. Technol. 2021, 2, 1–16. [Google Scholar] [CrossRef]
  40. Nassourou, M.; Blesa, J.; Puig, V. Robust Economic Model Predictive Control Based on a Zonotope and Local Feedback Controller for Energy Dispatch in Smart-Grids Considering Demand Uncertainty. Energies 2020, 13, 696. [Google Scholar] [CrossRef] [Green Version]
Figure 1. The structure of this paper.
Processes 09 01737 g001
Figure 2. The methodology of this paper.
Processes 09 01737 g002
Figure 3. The temperature in typical seasons.
Processes 09 01737 g003
Figure 4. The average electric vehicle (EV) numbers in each hour in different seasons.
Processes 09 01737 g004
Figure 5. The probability of car numbers in each hour.
Processes 09 01737 g005
Figure 6. The power volume of electric vehicles under different temperature.
Processes 09 01737 g006
Figure 7. Flow chart demand simulation by using Monte Carlo algorithm.
Processes 09 01737 g007
Figure 8. Diagram of integrated energy system structure.
Processes 09 01737 g008
Figure 9. EV charging demand load.
Processes 09 01737 g009
Figure 10. Energy demand of the commercial building in different seasons. (a) Energy demand of the commercial building in spring and fall; (b) energy demand of the commercial building in summer; (c) energy demand of the commercial building in winter.
Processes 09 01737 g010
Figure 11. Photovoltaic and wind turbine (PV&WT) output curve.
Processes 09 01737 g011
Figure 12. Output of each equipment in Spring and Fall. (a) Micro turbine (MT) output and external power; (b) other equipment output.
Processes 09 01737 g012
Figure 13. Output of each equipment in winter. (a) MT output and external power; (b) other equipment output.
Processes 09 01737 g013
Figure 14. Output of each equipment in summer. (a) MT output and external power; (b) other equipment output.
Processes 09 01737 g014
Table 1. The settings and parameters of transformers.
Transformer Capacity /kVALoad PropertyCapacity
800Lighting, electricity640
1000Lighting, electricity760
1000Cooling760
1000Heating760
Table 2. Carbon emission(g) in the day of different seasons.
SeasonIESGrid
Spring and Fall28,657,762.848,703,145.2
Winter37,307,449.764,483,267.6
Summer18,038,757.239,397,443.8
Table 3. Comparison of the economic benefits.
In Spring and AutumnIn WinterIn Summer
External electricity (CHY)59,690.713279,030.876156,369.8986
Operation cost (CHY)29,302.075638,004.904829,924.5247
Charging revenue (CHY)5593.69384972.85986423.1766
Publisher’s Note: MDPI stays neutral with regard to jurisdictional claims in published maps and institutional affiliations.

