Article

Optimizing Uniaxial Oil Extraction of Bulk Rapeseeds: Spectrophotometric and Chemical Analyses of the Extracted Oil under Pretreatment Temperatures and Heating Intervals

1
Department of Mechanical Engineering, Faculty of Engineering, Czech University of Life Sciences Prague, 16521 Prague, Czech Republic
2
Department of Materials and Manufacturing Technology, Faculty of Engineering, Czech University of Life Sciences Prague, 16521 Prague, Czech Republic
*
Author to whom correspondence should be addressed.
Submission received: 31 May 2021 / Revised: 24 September 2021 / Accepted: 27 September 2021 / Published: 30 September 2021
(This article belongs to the Section Chemical Processes and Systems)

Abstract

:
Optimizing the operating factors in edible oil extraction requires a statistical technique such as a response surface methodology for evaluating their effects on the responses. The examined input factors in this study were the diameter of pressing vessel, V D (60, 80, and 100 mm), temperature, T P R (40, 60, and 80 °C), and heating time, H T M (30, 60 and 90 min). The combination of these factors generated 17 experimental runs where the mass of oil, oil yield, oil extraction efficiency, and deformation energy were calculated. Based on the response surface regression analysis, the combination of the optimized factors was V D : 100 (+1) mm; T P R : 80 °C (+1) and H T M : 60 (0) min); V D : 60 (–1) mm; T P R : 80 °C (+1) and H T M : 75 (+0.5) min and V D : 100 (+1) mm; T P R : 80 °C (+1) and H T M : 90 (+1). The absorbance and transmittance values significantly (p < 0.05) correlated with the wavelength and temperature, but they did not correlate significantly (p > 0.05) with heating time. The peroxide value did not correlate significantly with temperature, however, it correlated significantly with heating time. Neither the acid value nor the free fatty acid value correlated with both temperature and heating time. The findings of the present study are part of our continuing research on oilseeds’ processing optimization parameters.

1. Introduction

Oilseed rape (Brassica napus L.) is the second-highest potential source of vegetable oil with a high nutritional value and a favorable composition of fatty acids for both food and animal feed [1,2]. Oilseed rape, also known as winter oilseed crop, is Europe’s prime oilseed crop, widely grown in Germany, Poland, the Czech Republic, and France [3,4,5,6,7]. In general, oilseeds provide many nutritious and functional properties for human health, such as starch, crude protein content, oil content, fatty acids, amino acids, vitamins, phytosterols, and polyphenols [8,9,10]. Oilseed crops, such as rape, sunflower, safflower, canola, mustard, and camelina, among others, are noteworthy feedstocks for biodiesel production, being an alternative renewable energy source for reducing greenhouse gas emissions caused by fossil fuels [11]. Worldwide, the major oilseed crops grown are soya, rape, cotton, pea, sunflower, oil palm, and copra [12,13].
Routinely, oil from oilseeds is obtained by extraction/expression with an organic solvent alone or by mechanical expression (mainly screw presses) before solvent extraction [14]. Enzyme-assisted extraction processing [14], gas-assisted mechanical expression [15,16,17], supercritical fluid extraction [15,18], ultrasound-assisted extraction, and microwave-assisted extraction [12] are modern methods that are used in large-scale oil production.
Mechanical oil extraction with either a hydraulic or screw press in comparison with other oil extraction methods has several advantages, including simplicity in operation, low production cost, fewer processing steps, and environmentally friendly processes [12,14,19]. Cold- and hot-pressing are the two main techniques used in the mechanical expression of oilseeds. The oil recovery efficiency of these methods is relatively low, and mostly diffusional/solvent extraction processes are used to recover the residual oil from the press/seedcake [8,20,21,22]. Therefore, at industrial and semi-industrial oil production scales, the mechanical pressing with screw presses and the solvent extraction process are combined to maximize the oil expression efficiency [12]. However, regarding the health- and environment-related issues associated with solvents involved in oil extraction, there is a renewed interest in finding alternative and sustainable methods for oil extraction [4,8,23].
In developing countries, mechanical pressing involving screw presses provides a more sustainable and less harmful method for recovering oil from oilseeds [24]. Improving the efficiency of the mechanical pressing requires the understanding of the mechanical and rheological properties of the oilseeds under a uniaxial compression process (laboratory-scale research). The universal compression-testing machine and a pressing chamber/vessel with a plunger are used to describe the compression and the relaxation processes (mechanical and rheological properties) of a particular bulk oilseed crop [25,26]. The compression process describes the dependency between the compression force and deformation of the bulk oilseeds, whereas the relaxation process represents the relationship between the relaxation force and time at constant strain to recover the residual oil in the seedcake. These processes are vital for understanding the uniaxial oil extraction parameters, which are deformation, strain, hardness, oil-point pressure/force, oil-point energy, mass of oil, oil yield, oil expression efficiency, deformation energy, volume energy, and normalized relaxation force of the bulk oilseeds. These output parameters are also dependent on the material properties (seed moisture content, maturity stages, and genotypes) and the input processing factors (speed, force, heating temperature, heating time, and diameter of pressing vessel). In the uniaxial compression process, the force–deformation curve characteristics obtained from the compression process are used to determine the maximal compression force and deformation energy for recovering the oil from the bulk oilseeds and to understand the operational safety of the universal compression testing machine in terms of the undulation effect [27]. The above-mentioned processing factors, thus, influence the mechanical oil pressing process in large-scale production, which can be ascertained under the uniaxial compression process using an appropriate experimental design, such as the response surface methodology (RSM) coupled with the Box–Behnken design (BBD) [28,29,30,31,32]. The RSM is a collection of mathematical and statistical techniques useful for examining the effects of several independent factors [33,34]. The RSM/BBD needs to be explored for several bulk oilseeds (rapeseeds, sunflower seeds, sesame seeds, flax seeds, and linseeds, among others) under uniaxial compression processes to fully understand the effect of the processing factors on the mechanical and rheological behaviors to help design and develop an optimal universal mechanical oil pressing system (screw presses) for application in less developed and developing countries. Most importantly, optimum parameters depend on the properties of the oilseeds and must be studied and optimized independently [35].
Therefore, the present study focused on the application of RSM/BBD to optimize the processing factors (diameter of pressing vessel, pretreatment temperatures, and heating time) of bulk rapeseed oil extraction under a uniaxial compression process. The responses, namely oil yield, oil extraction efficiency, and deformation energy, were calculated. The physical and mechanical properties of the bulk rapeseeds (moisture content, force, deformation, and hardness), as well as the chemical properties (peroxide value, acid value, and free fatty acid) and spectral properties (absorbance and transmittance versus wavelength) of the extracted rapeseed oil under different pretreatment temperatures and heating times, were evaluated.

2. Materials and Methods
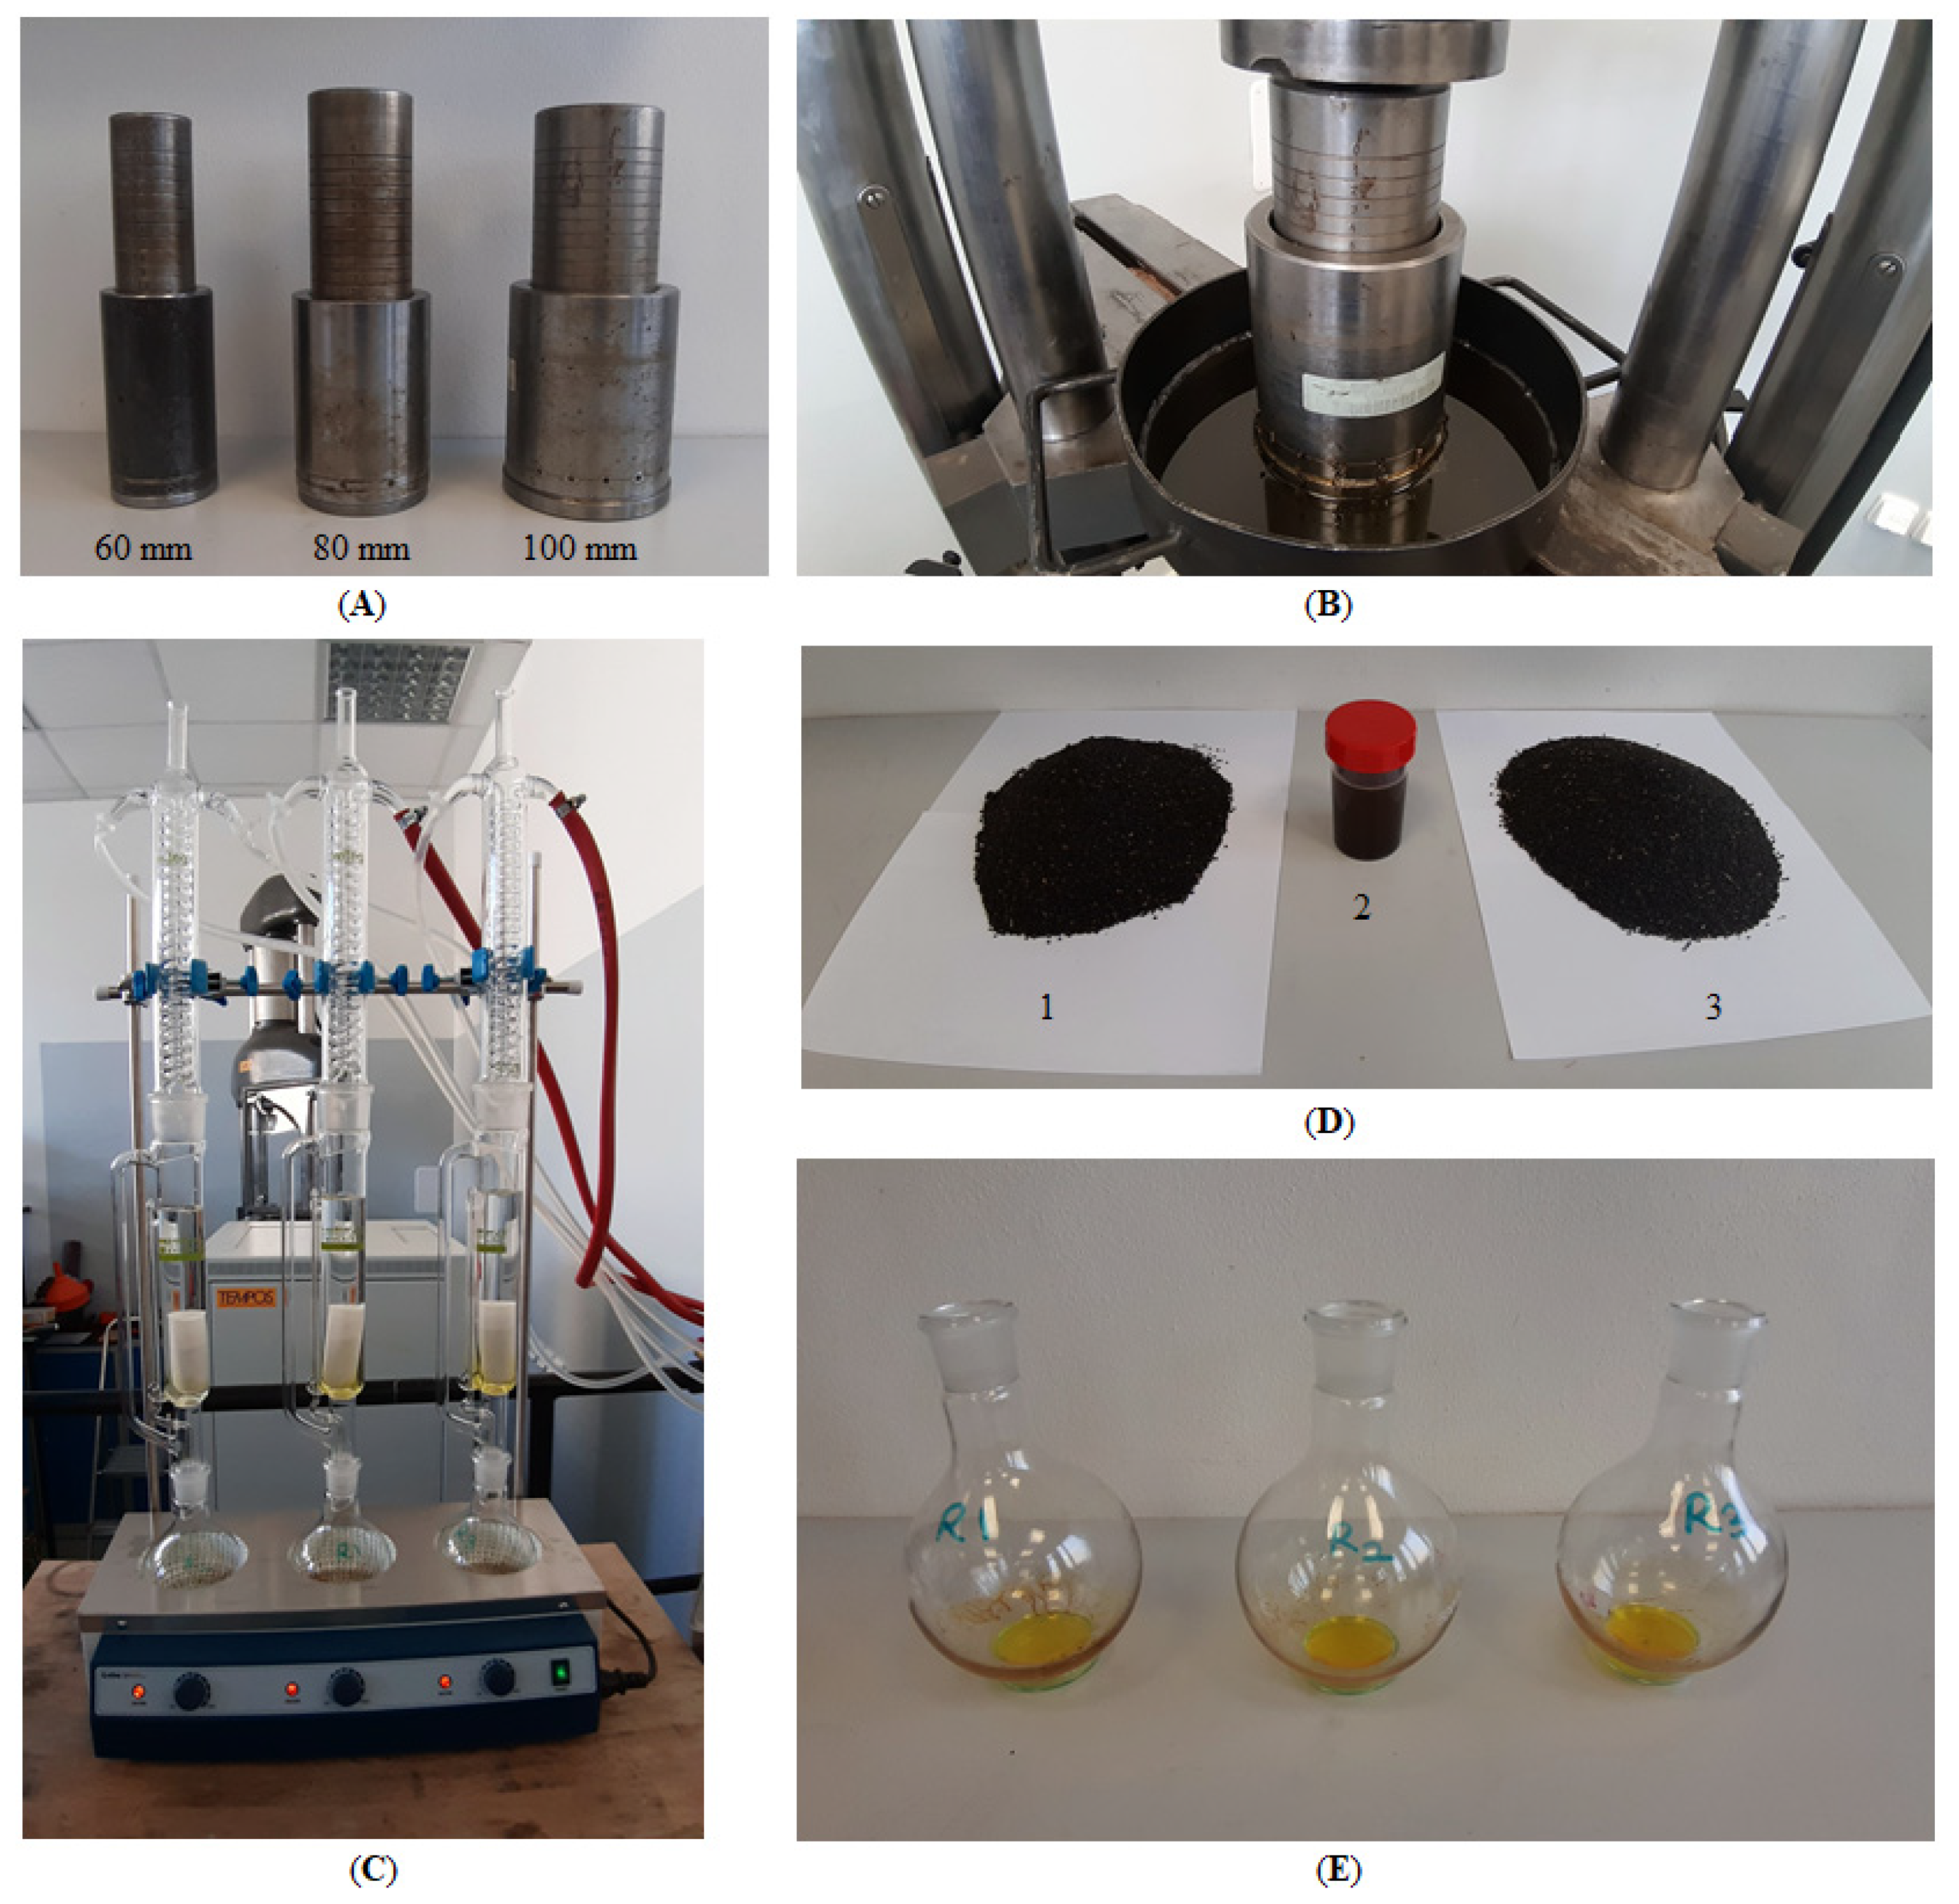
2.1. Materials

A sack of cleaned rapeseeds of weight 30 kg was obtained from Farmet, a.s., Česká Skalice, Czech Republic. Before the experiment, the rapeseeds sample was kept under laboratory conditions of a temperature of 22 °C and humidity of 30%.

2.2. Reagents

The reagents used for the determination of the (peroxide value (PV), acid value (AV), and free fatty acid (FFA)) of the extracted oil under pretreatment temperatures were chloroform, acetic acid, potassium iodide (KI) solution, sodium thiosulfate (Na2S2O3·5H2O) solution, starch solution, 0.1N regulated potassium hydroxide solution with ethyl alcohol, 1% ethyl alcohol phenolphthalein solution (prepared in 95% ethyl alcohol), and 97% ethyl alcohol-di ethyl ether mixture solution. The chemicals were procured from P-LAB a.s. and Verkon s.r.o. (Prague, Czech Republic). The procedures for the determination of the PV, AV, and FFA are described in (Section 2.8).

2.3. Determination of Moisture and Oil Content

The moisture content and percentage oil content of the rapeseeds sample were determined based on the conventional oven drying and Soxhlet extraction methods [36,37,38,39]. The hot air oven produced by MEMMERT GmbH + Co. KG, Buechenbach, Germany, was used to dry the rapeseeds sample at a temperature setting of 105 °C and a drying time of 24 h. With the Soxhlet extraction procedure, 10 g of the rapeseeds sample was ground in a mini grinder. The ground sample was loaded into a thimble and cotton wool was placed atop. The thimble was inserted into the Soxhlet extractor of 250 mL of solvent volume, which then was connected to a 500 mL round bottom flask containing 250 mL of petroleum ether. The complete setup was placed under a heating source at a temperature of 60 °C, where the solvent was heated to reflux for 24 h. The extracted oil was left in the oven without drying or heating for 3 days to remove the residual solvent. Measurements were done in triplicates. The electronic balance Kern 440–35 (Kern and Sohn GmbH, Balingen, Germany), with an accuracy of 0.001 g was used for weighing the extracted oil samples. Based on the relation given by [40], the moisture content and percentage oil content were calculated to be 6.37 ± 0.24 (% w.b.) and 41.35 ± 0.70 (%), respectively.

2.4. Box–Behnken Experimental Design of Compression Factors

When several processing factors and their interactions are likely to influence the output parameters, the response surface methodology with Box–Behnken Design (BBD) is used to find the optimum processing factors [41,42,43]. The BBD based on the input factors generated 17 experimental runs with five repetitions at the center point. The independent factors were pressing vessel diameter, heating temperature, and heating time, with each factor set at three levels. The mathematical equation defining the Box–Behnken design is given in equation (Equation (1)) as follows:
Y = β 0 + i = 1 k β i X i + i = 1 k β i i X i 2 + i 1 < j k j k β i j X i X j
where Y is the response variable; i and j are linear and quadratic coefficients; β 0 , β i , β i i , and β i j are the regression coefficients in the intercept, linear, quadratic, and interaction terms, respectively; X i and X j are the independent variables; and k is the number of factors. The factors were coded from −1 to +1 (low, center, and high) using equation (Equation (2)) [44,45] as follows:
x i = X i X 0 Δ X
where x i is the coded value of the ith variable, X i is the uncoded value of the ith test variable, and X 0 is the uncoded value of the ith test variable at the center point.

2.5. Pretreatment of Rapeseeds Sample

Before the compression tests, the measured sample of rapeseeds was pretreated or conditioned at temperatures of 40, 60, and 80 °C and heating times of 30, 60, and 90 min using the conventional oven method (MEMMERT GmbH + Co. KG, Buechenbach, Germany).

2.6. Compression Tests of Bulk Rapeseeds Sample

The sample of rapeseeds was measured at a constant compression height of 100 mm in each of the compression chambers/vessels of diameters 60, 80, and 100 mm using their plungers. The weights of the sample were 190.33 g, 338.80 g, and 524.54 g. Based on the cross-sectional area of the pressing vessels, the volume of the sample in each vessel was calculated to be 28.27 × 10⁻⁵, 50.27 × 10⁻⁵ and 78.54 × 10⁻⁵ m3, respectively. Preliminary experiments were performed to determine the maximum compression force (without the serration effect or the ejection of the seedcake through the pressing holes) for each of the pressing vessels’ diameters of 60, 80, and 100 mm. Maximum forces of 180, 300, and 450 kN at a compression speed of 4 mm/min were determined in an increasing order of the pressing vessels’ diameters. Based on the observed allowable processing conditions stated above, each of the 17 factor combinations generated from the Box–Behnken Design were then tested using the universal compression testing equipment (Figure 1). The data obtained were used to calculate the responses/parameters: mass of oil, oil yield, oil extraction efficiency, and deformation energy. The mass of oil was calculated gravimetrically (as the difference of mass of seed cake and initial mass of the sample M S (g)). The oil yield was calculated based on the relations reported by [46,47] as given in equation (Equation (3)).
O Y = [ ( M O M S ) × 100 ]
where O Y is the oil yield (%) and M O is mass of oil (g). The oil extraction efficiency was calculated according to the relations mentioned by [46,47], as given in equation (Equation (4)).
O E E = [ ( O Y O S ) × 100 ]
where O S is the percentage of oil content (%) determined from the Soxhlet extraction method. The deformation energy was calculated according to the relations stated by [48,49,50], as given in equation (Equation (5)).
E N = n = 0 n = i 1 [ ( F n + 1 + F n 2 ) · ( x n + 1 x n ) ]
where E N is the deformation energy (kJ), F n + 1 + F n and x n + 1 x n are the compression force (kN) and deformation (mm), n is the number of data points, and i is the number of sections in which the axis deformation was divided. The hardness, H D (kN/mm) was calculated as the ratio of maximum compression force M F (kN) [48,49,50] to that of deformation D F (mm) as given in equation (Equation (6)).
H D = M F D F
The volume of the rapeseeds was calculated using the relations described by [48,49,50], as given in equation (Equation (7)).
V M = π · D 2 4 · H
where V M is the volume of rapeseeds (m3), D is the diameter of pressing vessel (×10−6 m2), and H is the pressing height of the rapeseeds sample (×10−3 m). Using the universal compression testing machine, the input factors for both the compression and relaxation processes were force, speed, and time. The relaxation process can be set automatically with the compression process. The results are explained in Section 3.6 and Section 4, respectively.

2.7. Spectrophotometric Analysis of Extracted Oil

Spectrophotometric analysis was carried out using the UV-VIS spectrophotometer (VIS V-10 Plus, Giorgio Bormac S.r.l., Carpi, Italy) to determine the absorption and transmission rates of the extracted rapeseed oil within a specified wavelength (325 and 600 nm). This information has been reported to be functional for assessing the quality of the oil for the prevention of UV radiation on human skin [51].

2.8. Chemical Analysis of Extracted Oil under Pretreatment Temperatures

The rapeseed oil extracted at pretreatment temperatures between 40 and 80 °C was analyzed in terms of peroxide value (PV), acid value (AV), and free fatty acid (FFA). The rapeseed oil at a laboratory temperature of 22 °C served as the control. The procedures reported by [8,52,53] were followed. For PV, 5 g of the oil sample was weighed into a volumetric flask, then 30 mL of chloroform and a glacial acetic acid mixture of ratio (2:3) were added for the dissolution. The mixture was shaken vigorously for exactly 1 min, followed by the addition of 30 mL of distilled water. The mixture was titrated with 0.1 M sodium thiosulphate solution until the yellow color disappeared using 1 ml of 1% starch as an indicator. Peroxide value was expressed as (meq O2/kg). For the determination of AV and FFA, 5 g each of the oil sample was weighed into a volumetric flask and then 100 ml of neutralized ethanol (warmed up to 60–65 °C) was added together with a 2 ml of 1% phenolphthalein and immediately titrated with ethanolic KOH (0.1 Normality) to obtain an appearance that was light pink in color. AV and FFA were expressed as (mg KOH/g oil). The measurements were made twice, and the results averaged.

2.9. Statistical Analysis of Calculated Responses

The experimental data were statistically evaluated using STATISTICA 13 [54] by applying the following statistical techniques: basic statistics (correlation analysis) and general linear models (repeated measured ANOVA, post hoc tests, simple regression, multiple regression and response surface regression) at 5% significance level.

3. Results

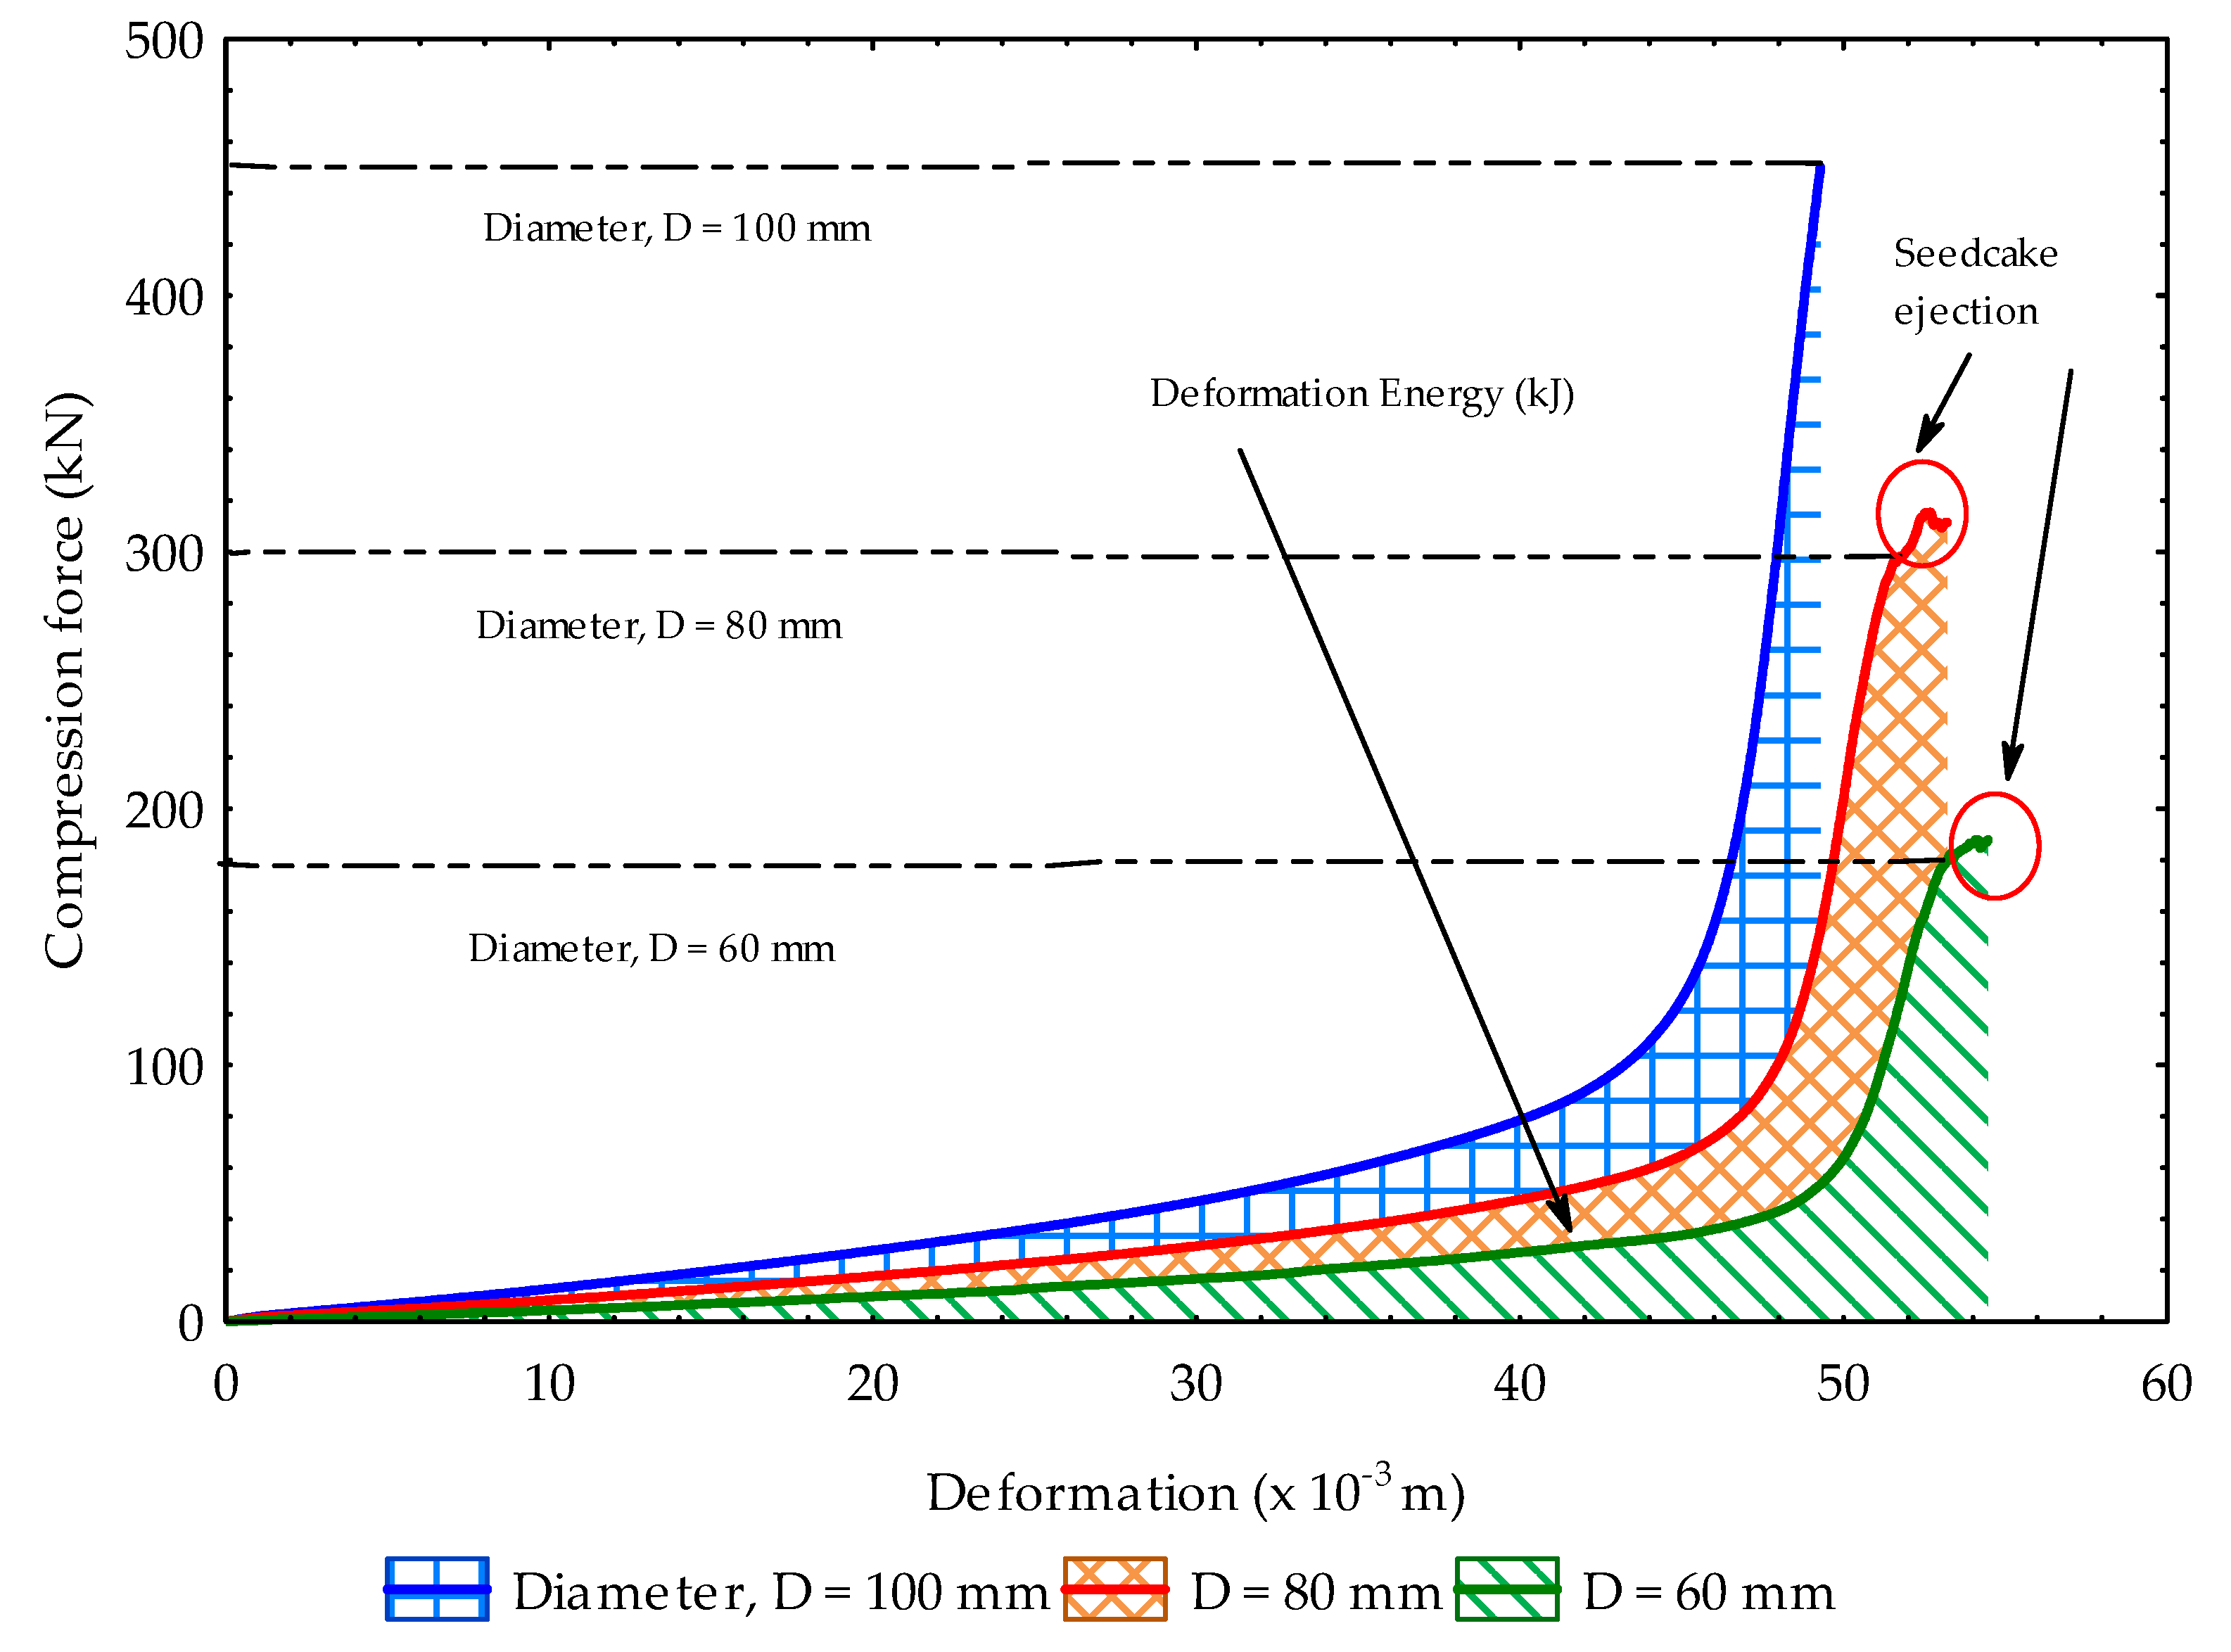
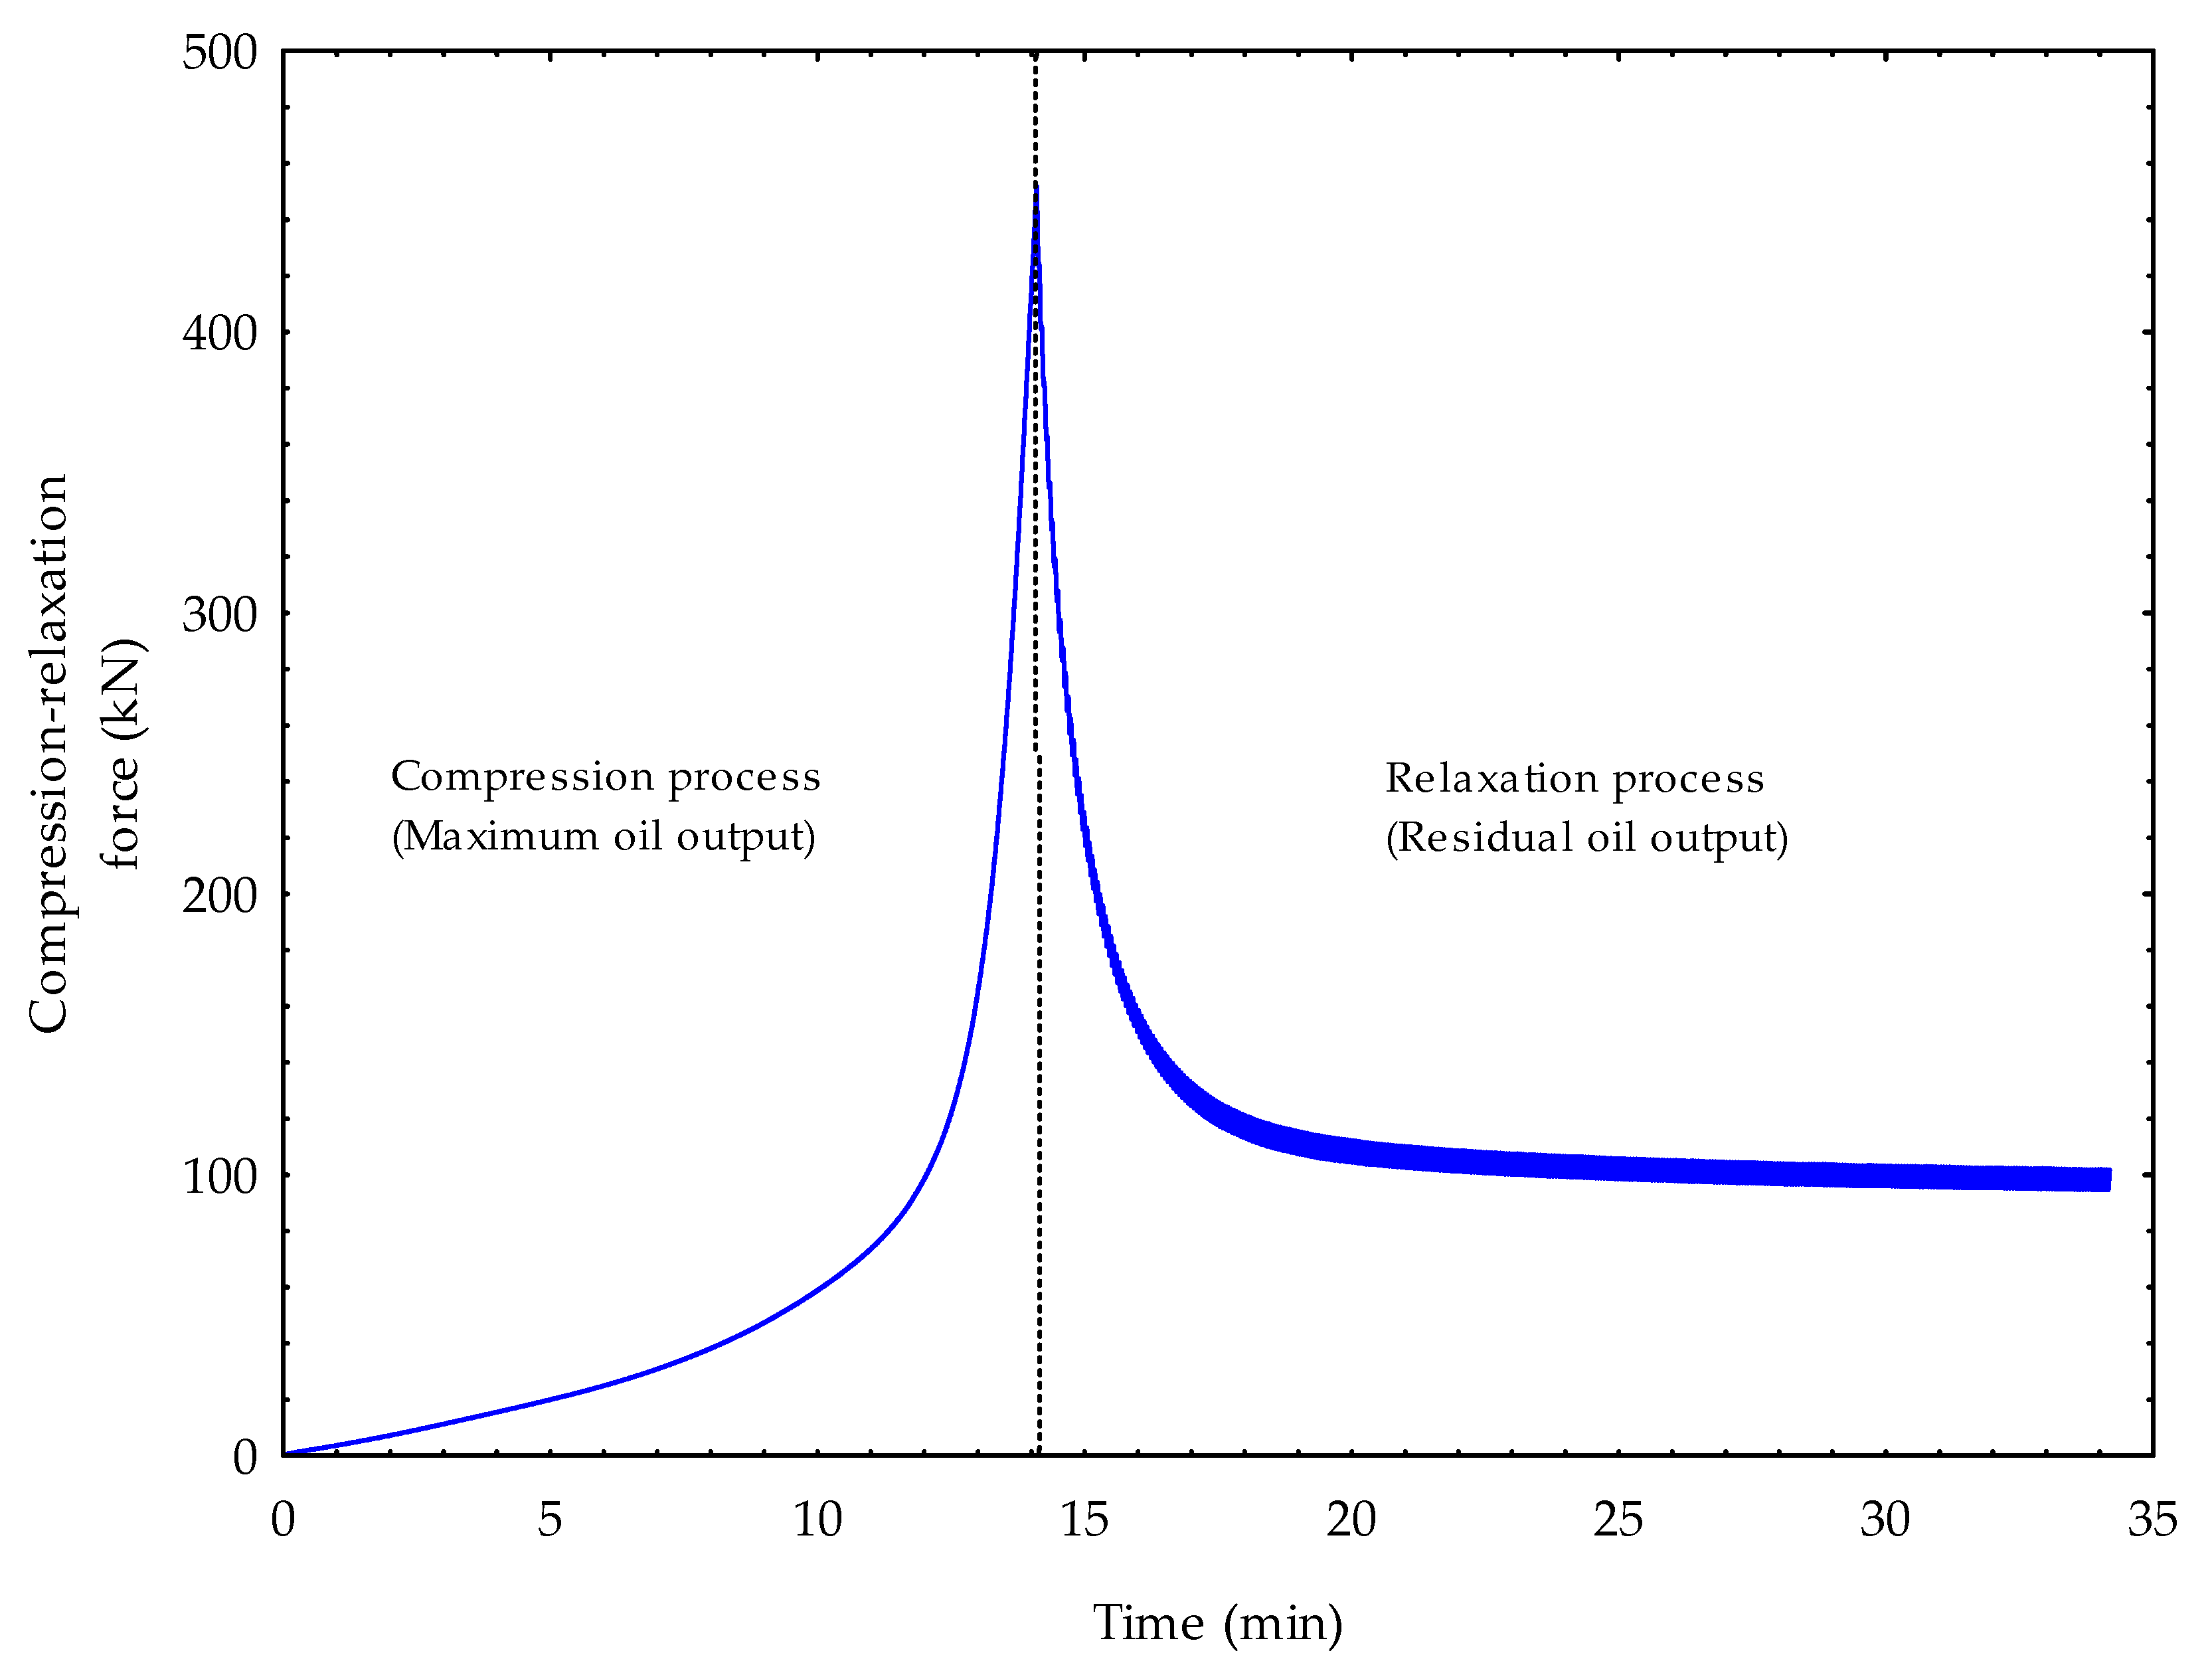
3.1. Determination of Maximum Compression Force

In this present study, two compression tests were conducted. The first test was the control experiment to determine the maximum compression forces for the different diameters of the pressing vessel at an initial sample pressing height of 100 mm and speed of 4 mm/min. The second test was the compression factors combination (diameter of pressing vessel, pretreatment temperature, and heating time) based on the Box–Behnken experimental design. From the control experiment, the mass of oil (g), oil yield (%), oil extraction efficiency (%), deformation energy (kJ), and hardness (kN/mm) were calculated, as presented in (Table 1). The mass of oil, deformation energy, and hardness increased with the increase in vessel diameter, whereas the deformation, oil yield, and oil extraction efficiency decreased with the increase in vessel diameter. The deformation energy is the area under the force–deformation curve (Figure 2) [27,49,50]. The ANOVA results (Table 2) showed that the compression factors (vessel diameters and forces) had a significant effect (p < 0.05) on the calculated responses, except for deformation, which was not significant (p > 0.05). The coefficient of determination (R2) values confirming the results were between 0.288 and 0.997. The results of the Box–Behnken design are explained in the succeeding sections. Here, it is important to highlight that three main responses: oil yield (%), oil extraction efficiency (%), and deformation energy (kJ) were examined in relation to the combination of the compression factors.

3.2. Oil Yield, Oil Extraction Efficiency, and Deformation Energy

Three compression factors with three levels each, namely vessel diameter (60, 80, and 100 mm), heating temperature (40, 60, and 80 °C), and heating time (30, 60, and 90 min) were evaluated for the compression tests of bulk rapeseeds sample. Based on the Box–Behnken design of experiments (BBD) coupled with the response surface methodology (RSM), 17 experimental runs were obtained with the 12 factors combination and 5 repetitions at the center points (Table 3). For the different vessel diameters at each maximum compression force at a constant speed of 4 mm/min, the calculated responses were oil yield, oil extraction efficiency, and deformation energy. Oil yield and oil extraction efficiency values ranged from 16.172 to 24.783% and 39.109 to 59.934%, respectively. The deformation energy values ranged from 1.17 to 3.19 kJ. From the BBD experimental data (Table 3), the compression factors combination of vessel diameter (60 (−1), temperature (80 (+1), and heating time (60 (0)) produced the highest oil yield of 24.783%, oil extraction efficiency of 59.934%, and deformation energy of 1.255 kJ. The optimum factors for rapeseeds oil extraction in terms of oil yield, oil extraction efficiency, and deformation energy were determined based on the response surface regression analysis (Section 3.4).

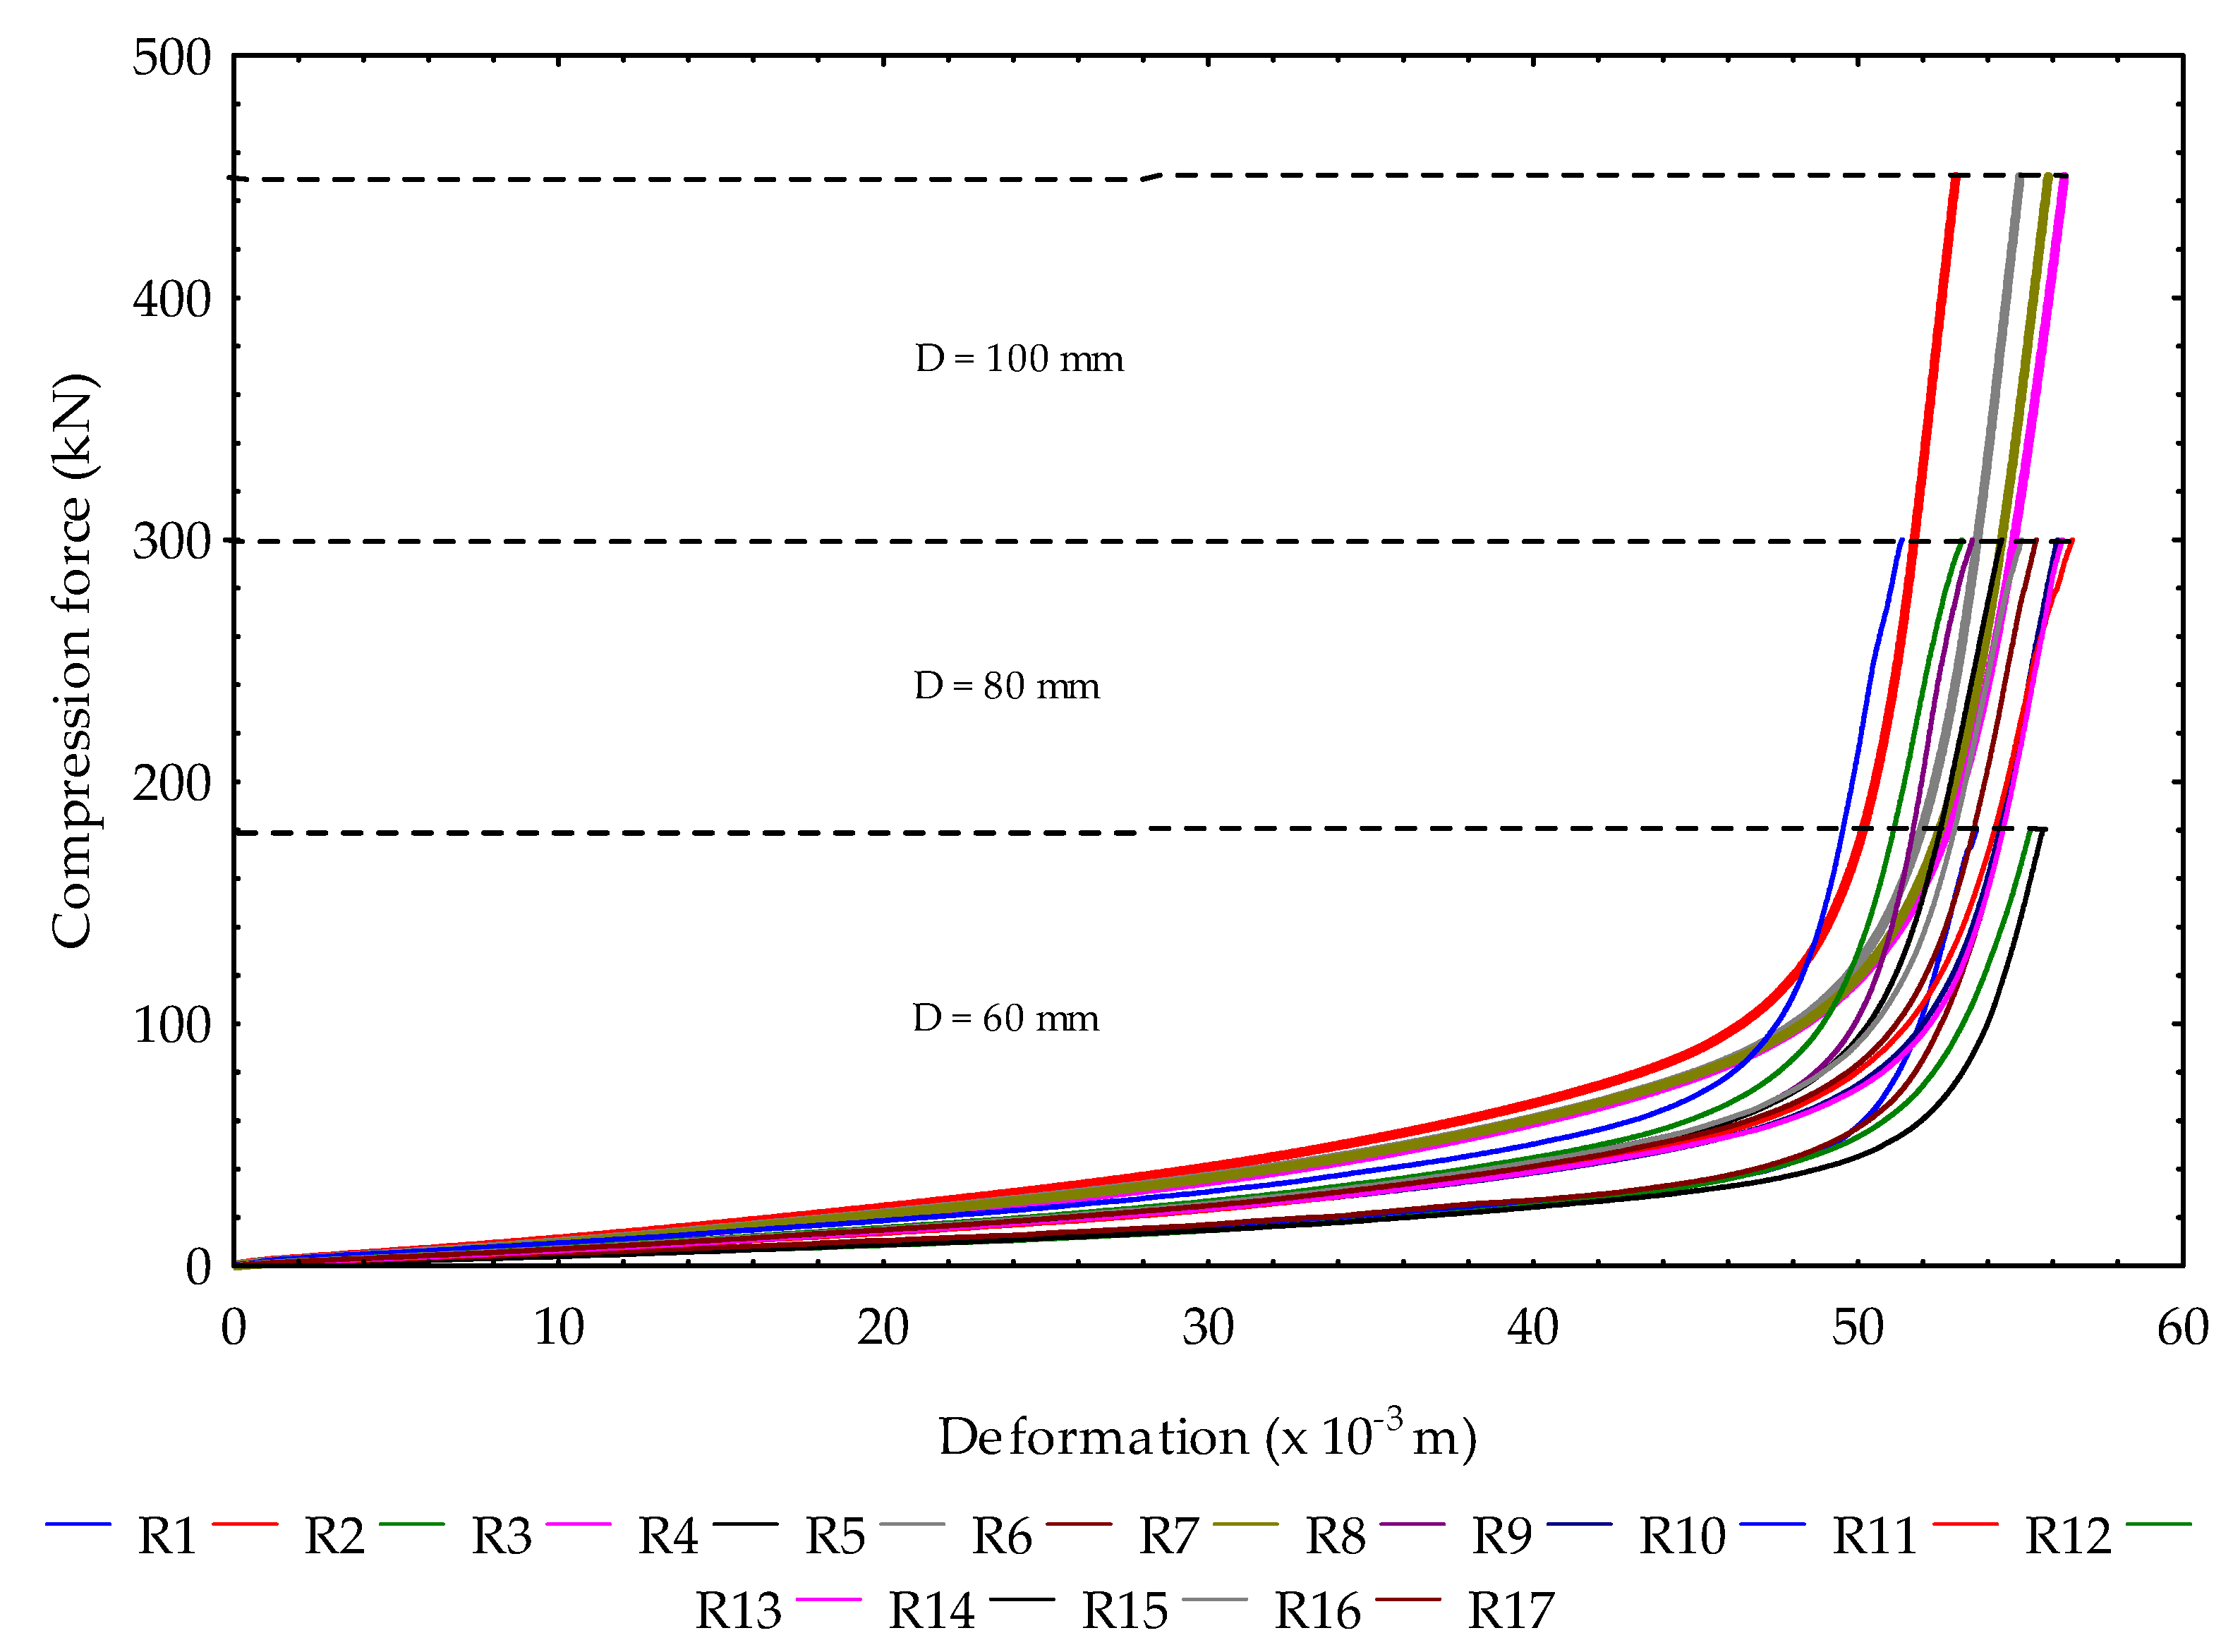
3.3. Force–Deformation Curves of Experimental Runs (BBD)

The 17 experimental runs (R1 to R17) (Table 3) of the factor levels combination in terms of the force–deformation curves are graphically illustrated in Figure 3. The maximum force for each vessel diameter of 60, 80, and 100 mm were determined from the initial pressing height of the bulk rapeseeds sample measured at 100 mm, which was compressed at a speed of 4 mm/min. A higher force with a bigger vessel diameter produced the maximum oil output. The curves showed a smooth pattern without the serration effect based on the control experiments (Section 3.1).

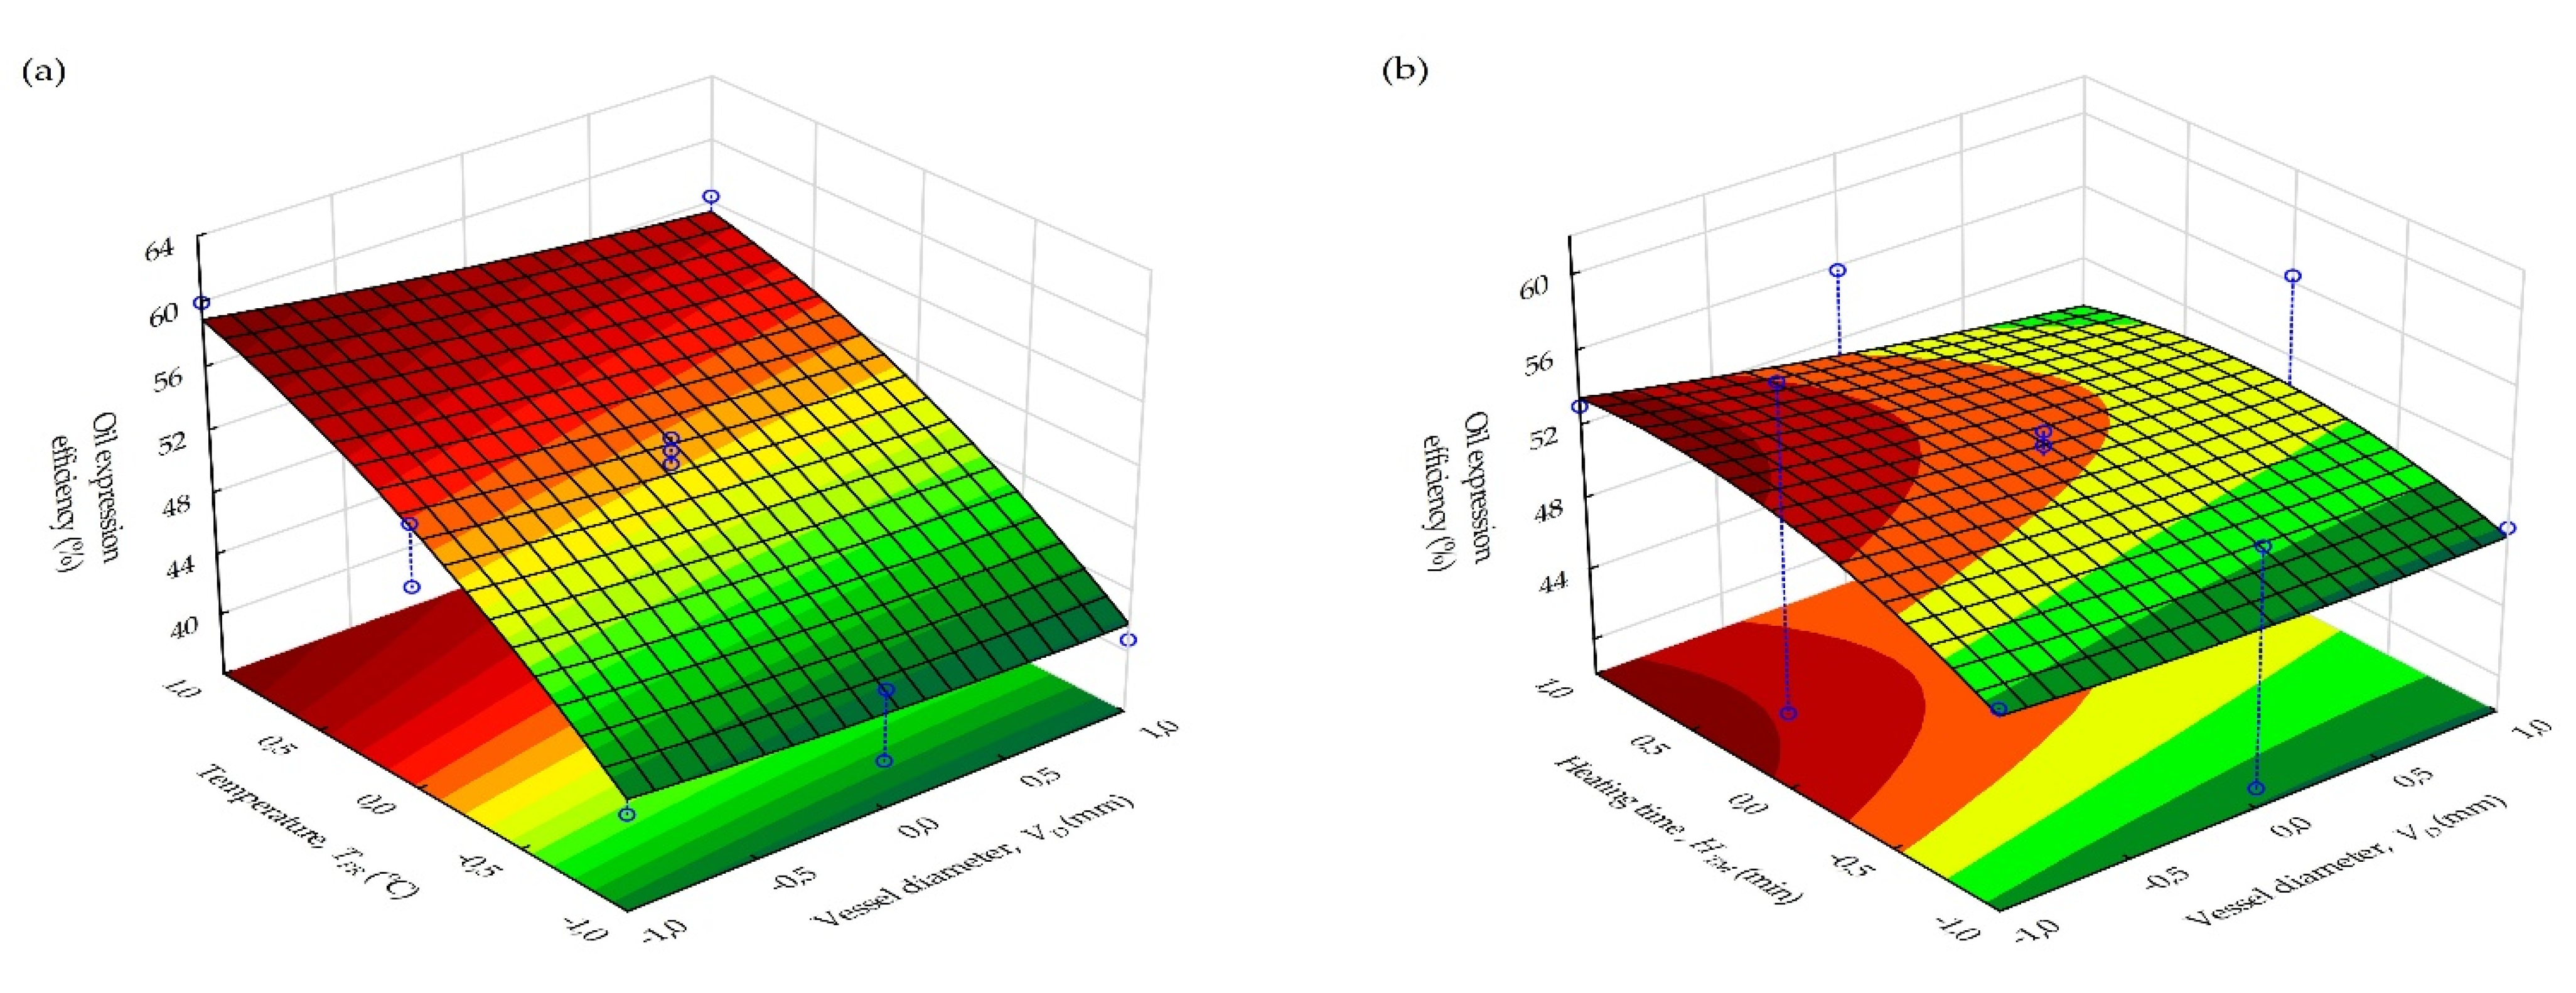
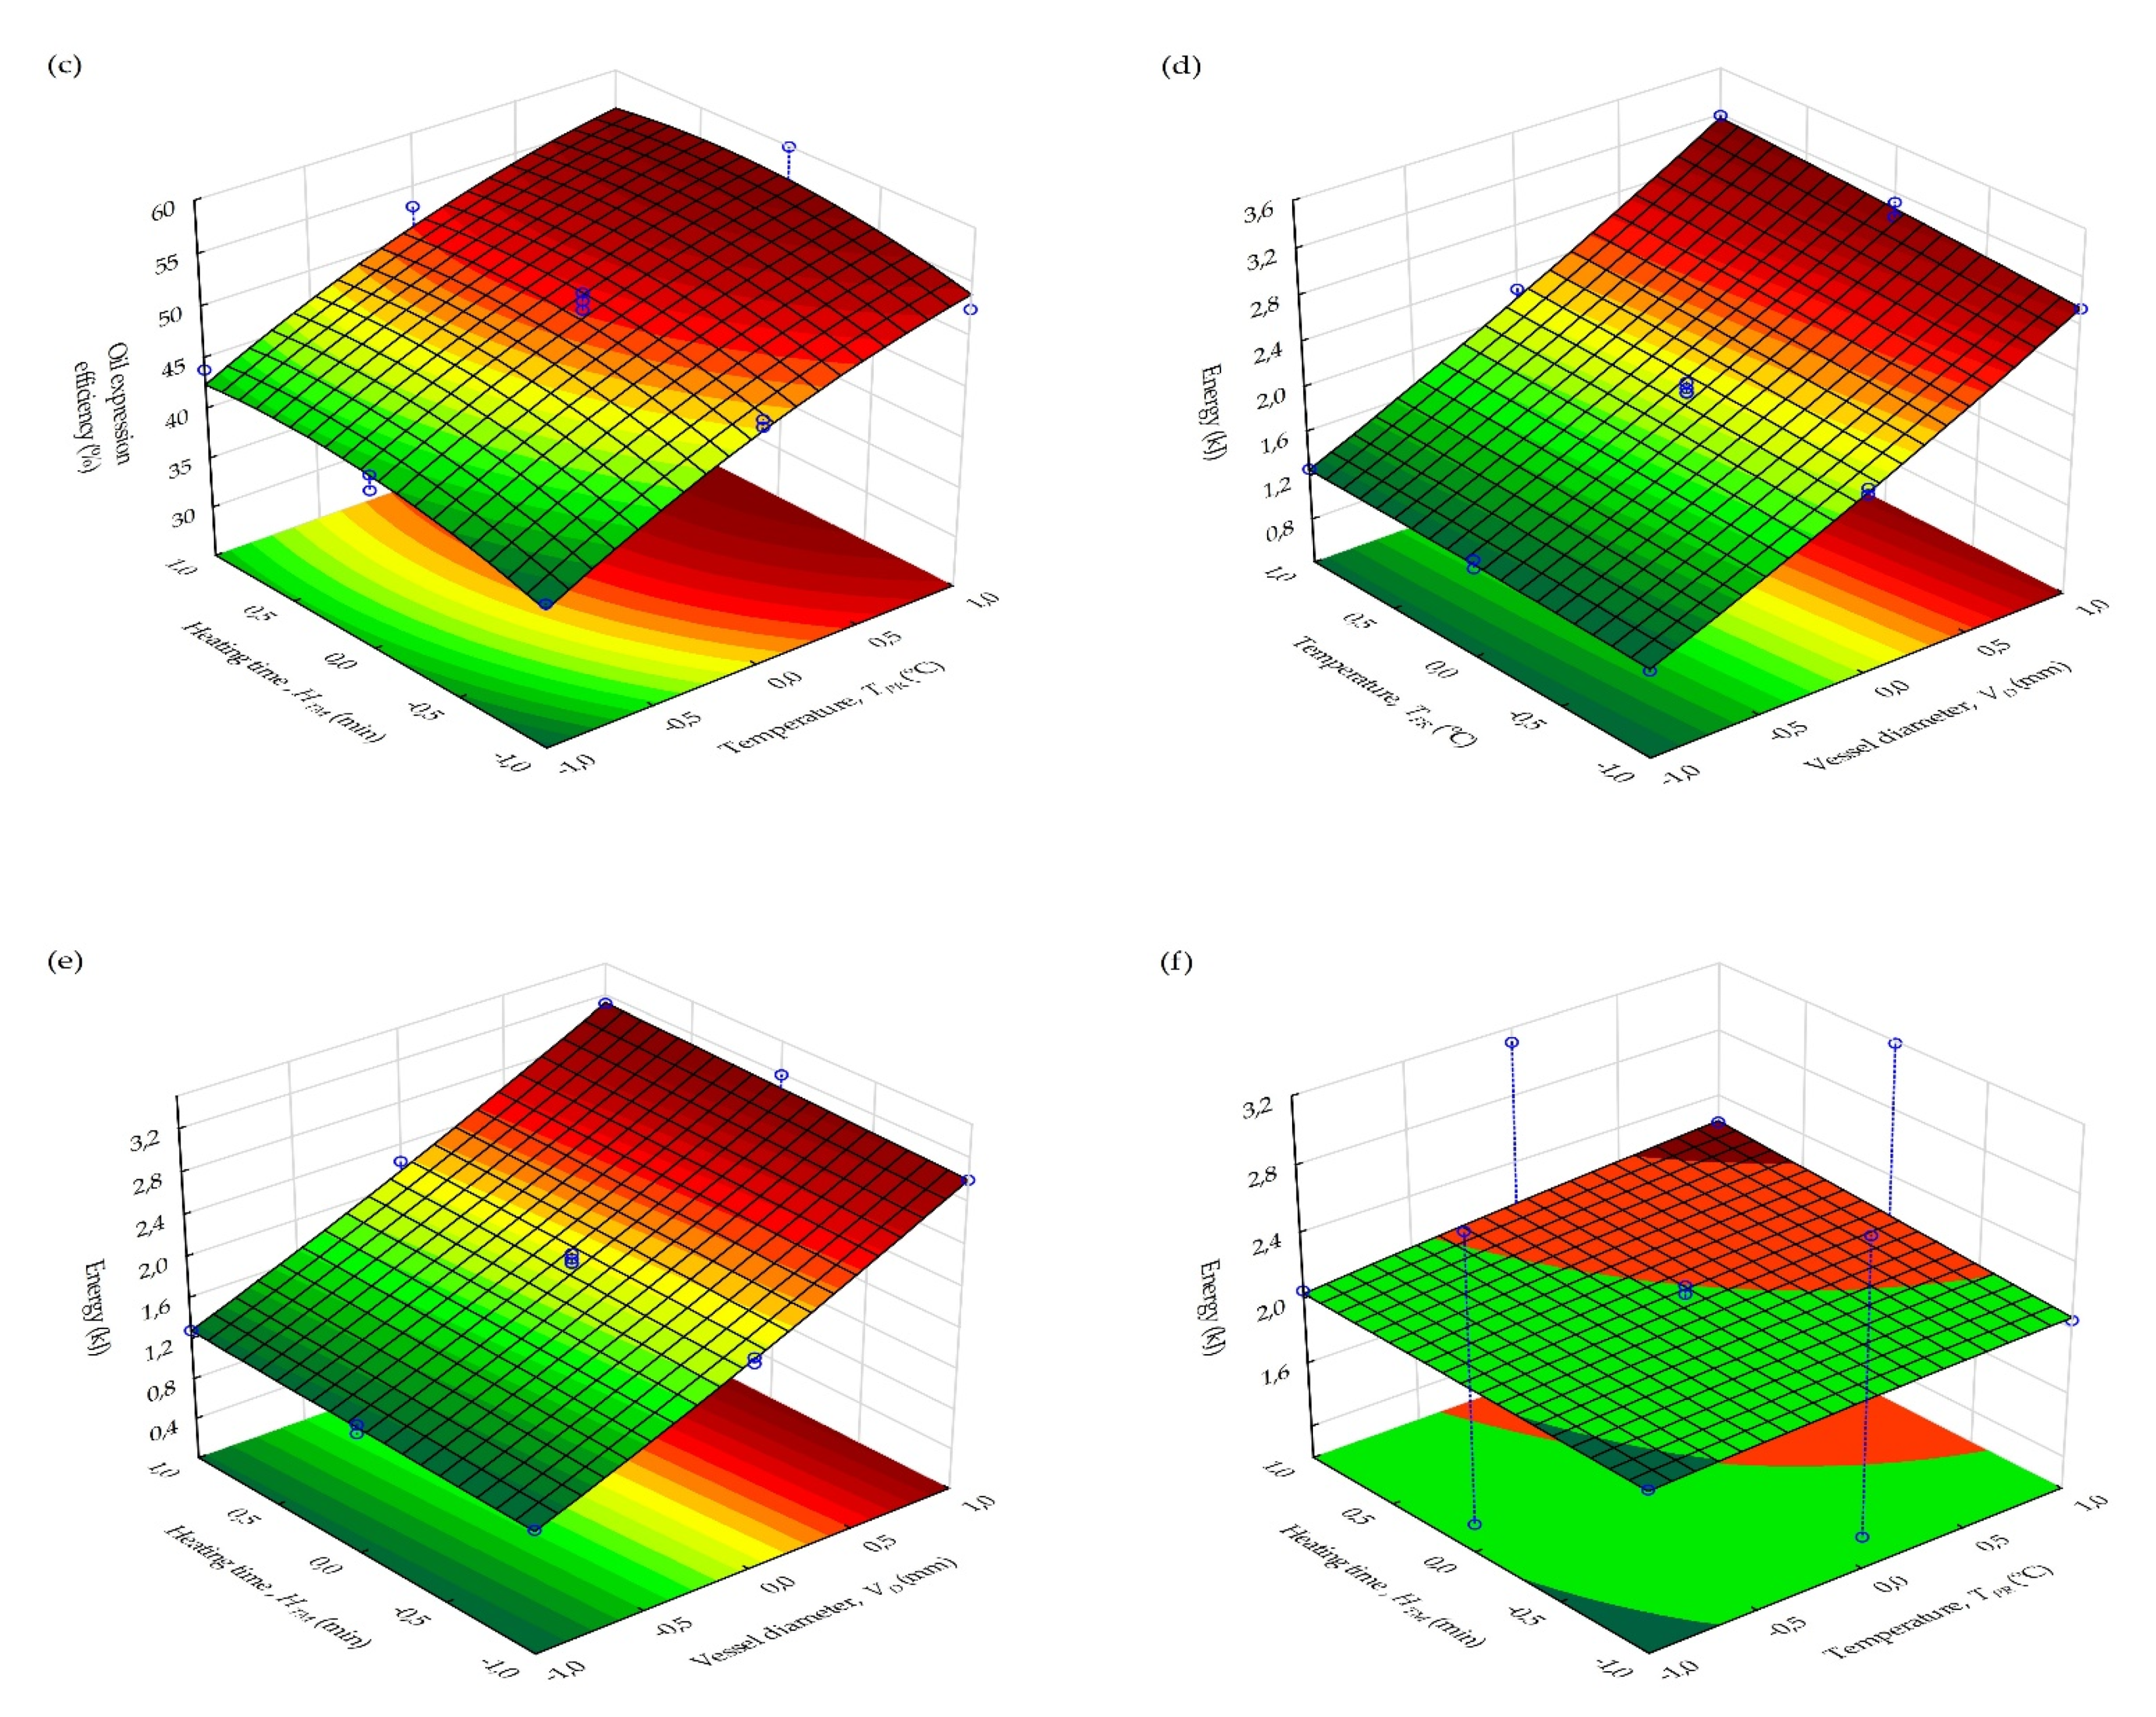
3.4. Response Surface Regression Analysis of Factor Combinations

The effect of the factor combinations on the calculated parameters or responses was statistically analyzed based on the response surface regression statistical technique. The results are presented in Table 4. For the mass of oil (g), the coefficients of the linear and quadratic terms, as well as the interaction terms of the vessel diameter and temperature, were significant (p < 0.05). However, the interaction terms of vessel diameter and heating time and that of temperature and heating time were not significant (p > 0.05). For oil yield (%) and oil expression efficiency (%), the coefficients of the quadratic term of the vessel diameter and interaction terms of the factors (vessel diameter, temperature, and heating time) were not significant (p > 0.05) in comparison with the coefficients of the other terms of the factors, which were significant (p < 0.05). For deformation energy, the coefficients of the linear and quadratic terms of the vessel diameter, the linear term of temperature, and the linear term of heating temperature were significant (p < 0.05), whereas the coefficients of the quadratic terms of the temperature and heating time, as well as the interaction terms of the factors, were not significant (p > 0.05). The intercept coefficients of all the models were significant (p < 0.05). The significance of the results explains the accuracy of the models for predicting the calculated responses.

3.5. Determined Regression Models for Predicting the Responses

The oil yield (%), oil extraction efficiency (%), and deformation energy (kJ) were the main responses from the compression tests of bulk rapeseeds based on the compression factor combinations, which were generated from the BBD. The linear regression models defining these responses as a function of the compression factors/predictors are expressed in equations (Equation (8)) to (Equation (10)) respectively. The intercepts and the coefficients of the predicators and their interactions were statistically significant (p < 0.05) for predicting the calculated responses (Table 4).
O Y = 21.208 0.512 · V D + 3.026 · T P R 0.730 · T P R 2 + 0.649 · H T M 0.739 · H T M 2  
O E F = 51.287 1.238 · V D + 7.318 · T P R 1.765 · T P R 2 + 1.569 · H T M 1.788 · H T M 2  
E N = 2.091 + 0.915 · V D + 0.055 · V D 2 + 0.074 · T P R + 0.056 · H T M  

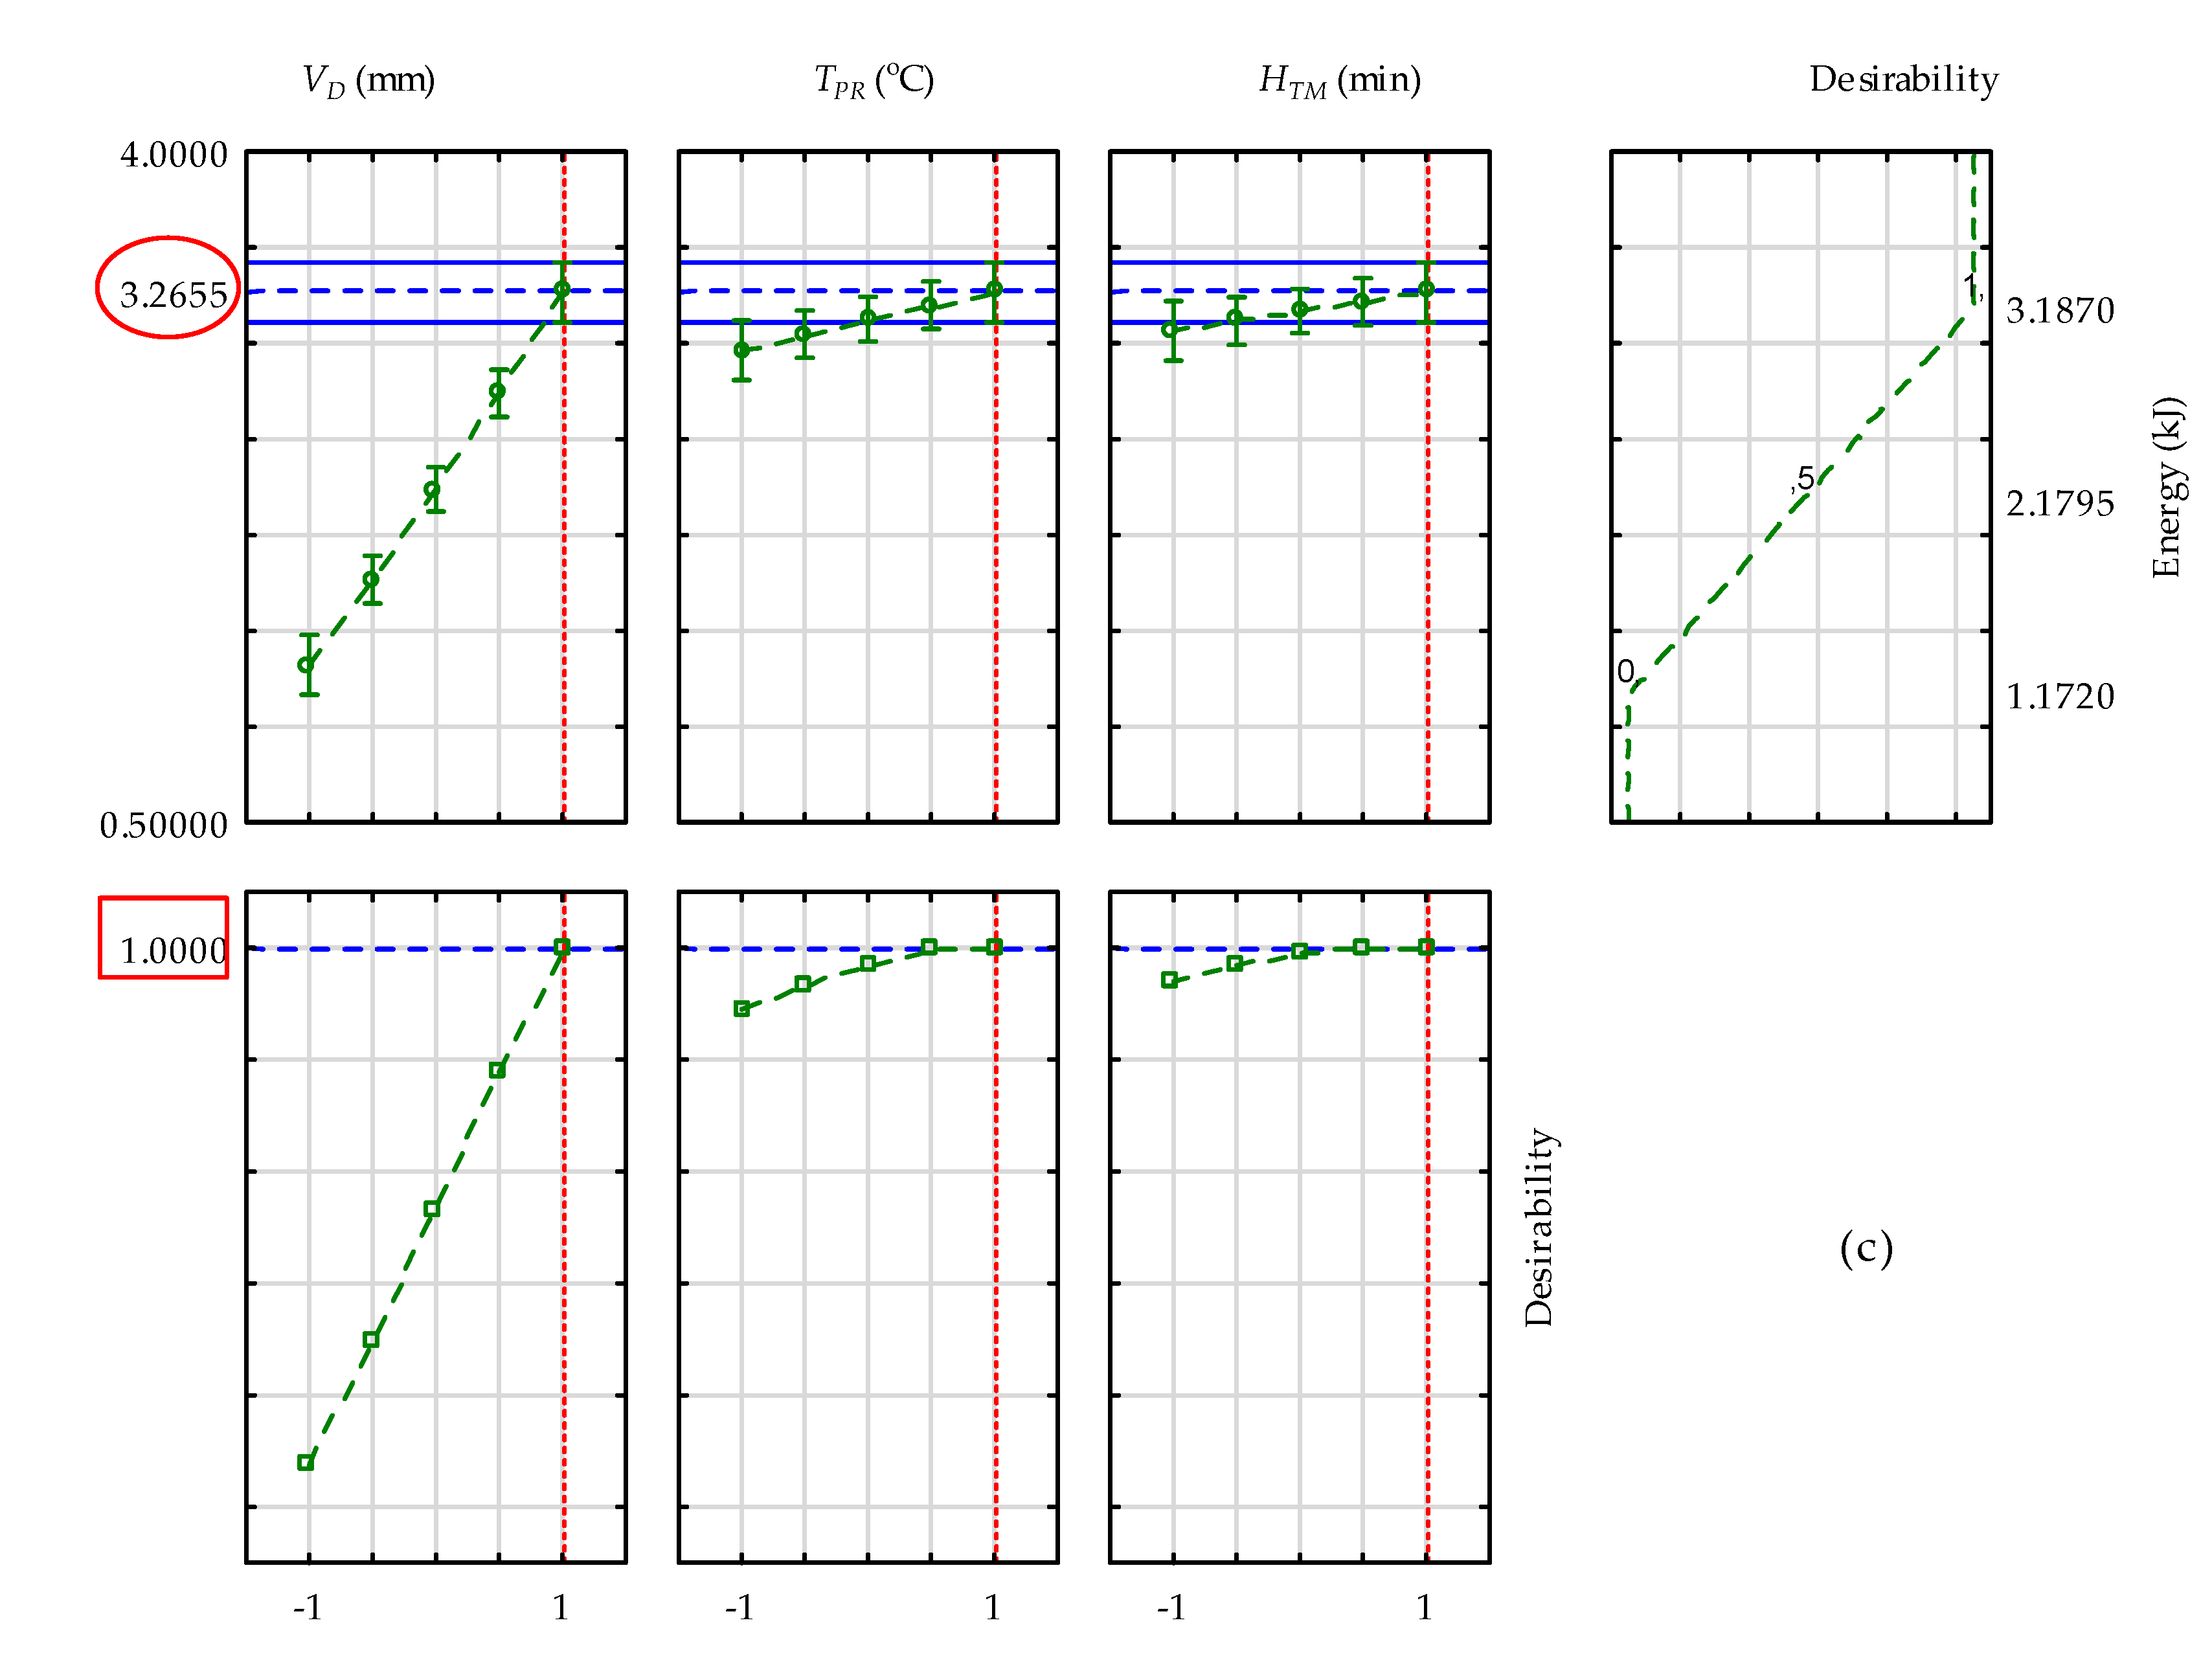
3.6. Determined Optimum, Predicted, and Validated Values of the Responses

The optimum, predicted, and validated values of the responses (oil yield (%), oil expression efficiency (%), and deformation energy (kJ)) are given in Table 5. Based on the response surface regression analysis [54], the optimum values of the responses in relation to the compression factor combinations: ( V D : 60 (–1) mm; T P R : 80 °C (+1) and H T M : 75 (+0.5) min) and ( V D : 100 (+1) mm; T P R : 80 °C (+1) and H T M : 90 (+1) min were obtained from the surface profile plots (Figure 4a–c). The predicted values were obtained from the linear regression models using equations (Equations (8)–(10)) which were validated based on additional experiments. The desirability values of the optimal responses and their factors ranged between 0.979 and 1 and the coefficient of variation and percentage error between the predicted and validated values ranged from 0.09 to 2.30%, which confirms the reliability of linear regression models (Equations (8)–(10)) for predicting the responses. The surface and area contour plots of the interaction effect of the compression factors (temperature, pretreatment, and heating time) on the responses (oil extraction efficiency and deformation energy) are illustrated in Figure 5. In Figure 5a, at a constant heating time, the increase in the diameter of pressing vessel from 60 to 100 mm (coded as −1 to +1) showed no increases in oil extraction efficiency but the increase in temperature from 40 to 80 °C (coded as −1 to +1) recorded 59%, while their combined effect decreased to 56%. In Figure 5b, at a constant temperature, the increase in the diameter of the pressing vessel neither increased nor decreased the extraction efficiency, but the increase in heating time from 30 to 90 min (coded as −1 to +1) slightly increased it to 53%, while their interaction effect decreased it to 50%. In Figure 5c, at a constant pressing vessel diameter, the increase in temperature increased the oil extraction efficiency to approximately 55% and the increase in heating time did not considerably increase the oil extraction efficiency. However, their interaction effect increased it to 57%. On the other hand, in Figure 5d, at a constant heating time, the increase in the diameter of the pressing vessel increased the deformation energy by about 2.9 kJ, while the increase in temperature did not increase the deformation energy. However, their combined effect produced 3.2 kJ of deformation energy. Furthermore, in Figure 5e, at a constant temperature, the increase in the diameter of the pressing vessel increased the deformation energy to 3 kJ, while the increase in heating time showed no increase in deformation energy but their interaction effect gave approximately 3.2 kJ. Finally, in Figure 5f, at constant pressing vessel diameter, the increase in temperature and heating time, as well as their interaction, had no significant effect on the deformation energy.

3.7. Compression and Relaxation Processes of Rapeseeds Oil Extraction

The uniaxial compression process is the dependency between compression force and deformation, which can be followed by the relaxation process, which describes the dependency between relaxation force and time at a constant strain of the bulk seeds. The relaxation process is performed to recover the residual oil in the seedcake immediately after the compression process. The compression factor combinations that produced higher oil yield (%) and oil extraction efficiency (%) were subjected to a relaxation process at a constant time of 20 min. The results in comparison with the compression process are given in Table 6. The compression factor combinations ( V D : 60 (−1) mm, T P R : 80 °C (+1), and H T M : 60 (0) min) stopped at relaxation time of 4 min, recovering a small increase in oil yield of 0.53% and oil extraction efficiency of 1.28%. The factor combinations ( V D : 60 (−1) mm, T P R : 80 °C (+1), and H T M : 75 (+0.5) min) used relaxation time of 5 min, which slightly increased the oil yield by 0.42% and oil extraction efficiency of 1.01%. The factor combinations ( V D : 100 (+1) mm, T P R : 80 °C (+1), and H T M : 60 (0) min) finished at a relaxation time of 10 min with a 1.51% increase in oil yield and 3.66% of oil extraction efficiency. The factor combinations ( V D : 100 (+1) mm, T P R : 80 °C (+1), and H T M : 90 (+1) min) utilized fully the relaxation time of 20 min, recording an increase in oil yield and oil extraction efficiency of 2.04% and 4.94%, respectively. Finally, the factor combinations ( V D : 80 (0) mm, T P R : 80 °C (+1), and H T M : 90 (+1) min) ceased at relaxation time of 10 min, which produced an appreciable increase in oil yield of 2.38% and oil extraction efficiency of 5.75%. The combined processes of compression and relaxation during rapeseed oil extraction are illustrated in Figure 6. The thick line of the relaxation process is due to the changes in pressure of the piston (hydraulic transmission system). There was no change in pressure at the compression process, hence the thin line. The results are further explained in Section 4.

3.8. Chemical Properties of Rapeseed Oil at Pretreatment Temperatures

The chemical properties (peroxide value, acid value, and free fatty acid) of the rapeseed oil extracted at different pretreatment temperatures and heating intervals are given in Table 7. The averaged peroxide values at heating times (30, 60, and 90 min) for pretreatment temperatures (40, 60, and 80 °C) were 5.10 ± 0.77, 6.19 ± 1.61, and 5.71 ± 1.32 meq O2/kg. Similarly, the acid values were 1.43 ± 0.39, 1.42 ± 0.29, and 1.49 ± 0.30 mg KOH/g oil. The free fatty acid values were 0.72 ± 0.20, 0.71 ± 0.15, and 0.75 ± 0.15 mg KOH/g oil. The averaged peroxide values increased from 40 °C to 60 °C and then decreased at 80 °C with heating times between 30 and 90 min. Acid values and free fatty acid values decreased from 40 °C to 60 °C and then increased at 80 °C with heating times. In terms of varying heating times at constant temperature, peroxide values at 60 °C and 80 °C increased with an increase in heating times, whereas at 40 °C it decreased from 30 min to 60 min and then increased at 90 min. On the other hand, acid values and free fatty acid values increased from 30 min to 60 min and then decreased at 90 min at 40 °C and 60 °C, respectively. However, at 80 °C they decreased from 30 min to 60 min and then increased at 90 min. The data were further subjected to normality tests and ANOVA tests of between-subject effects to assess the significant effect of the compression factors on the calculated chemical properties. Based on the Shapiro–Wilk test (Table 8), the data showed a normal distribution function. The normal distribution function was assessed by the fact that the p-values were greater than the significance level of 5% with the corresponding high values of the coefficient of determination (R2) ranging from 0.720 to 0.974 [55]. The ANOVA tests of between-subject effects on the chemical properties of the rapeseed oil (Table 9) revealed that peroxide value with temperatures and heating times was significant (p < 0.05) compared to the acid value and free fatty acid value, which showed non-significance (p > 0.05) with temperature, but were significant (p < 0.05) with heating times. The compression factor interaction effect on peroxide value indicated non-significance, whereas that of acid value and free acid value proved significant. Further statistical explanation (correlation, multiple regression, and post hoc tests) is provided in the Supplemental Materials (Section 3.10) and Discussion (Section 4).

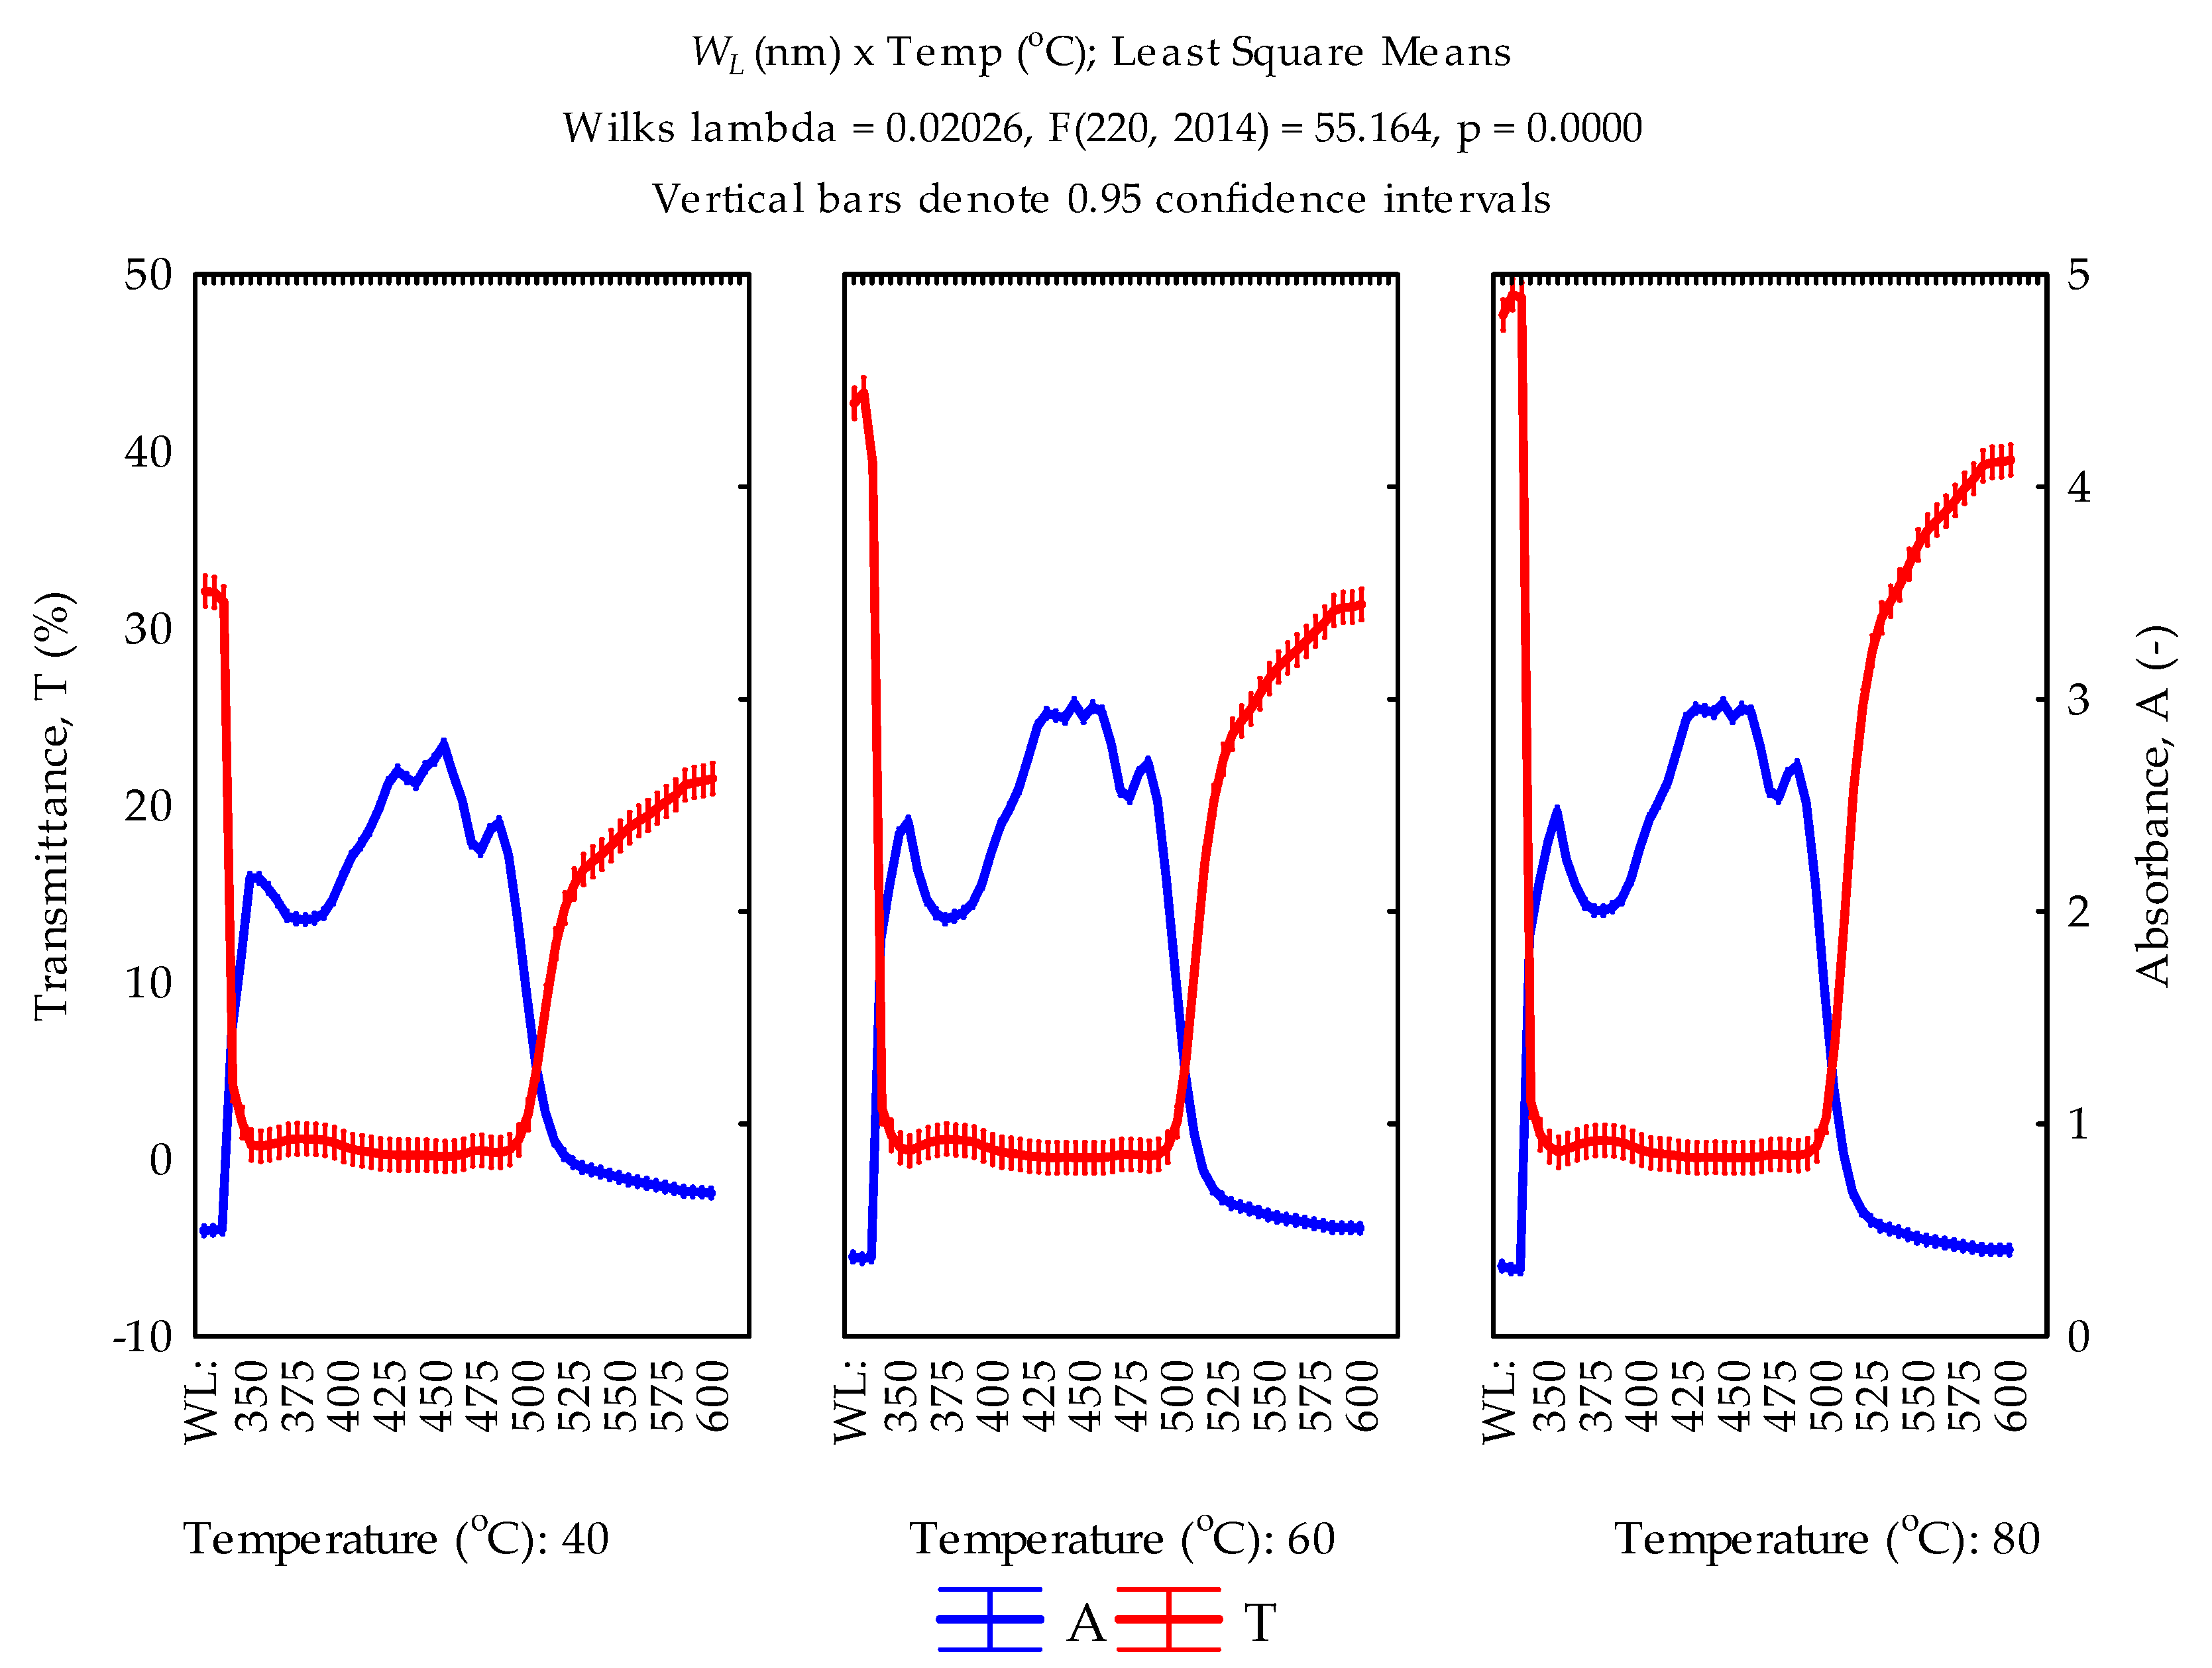
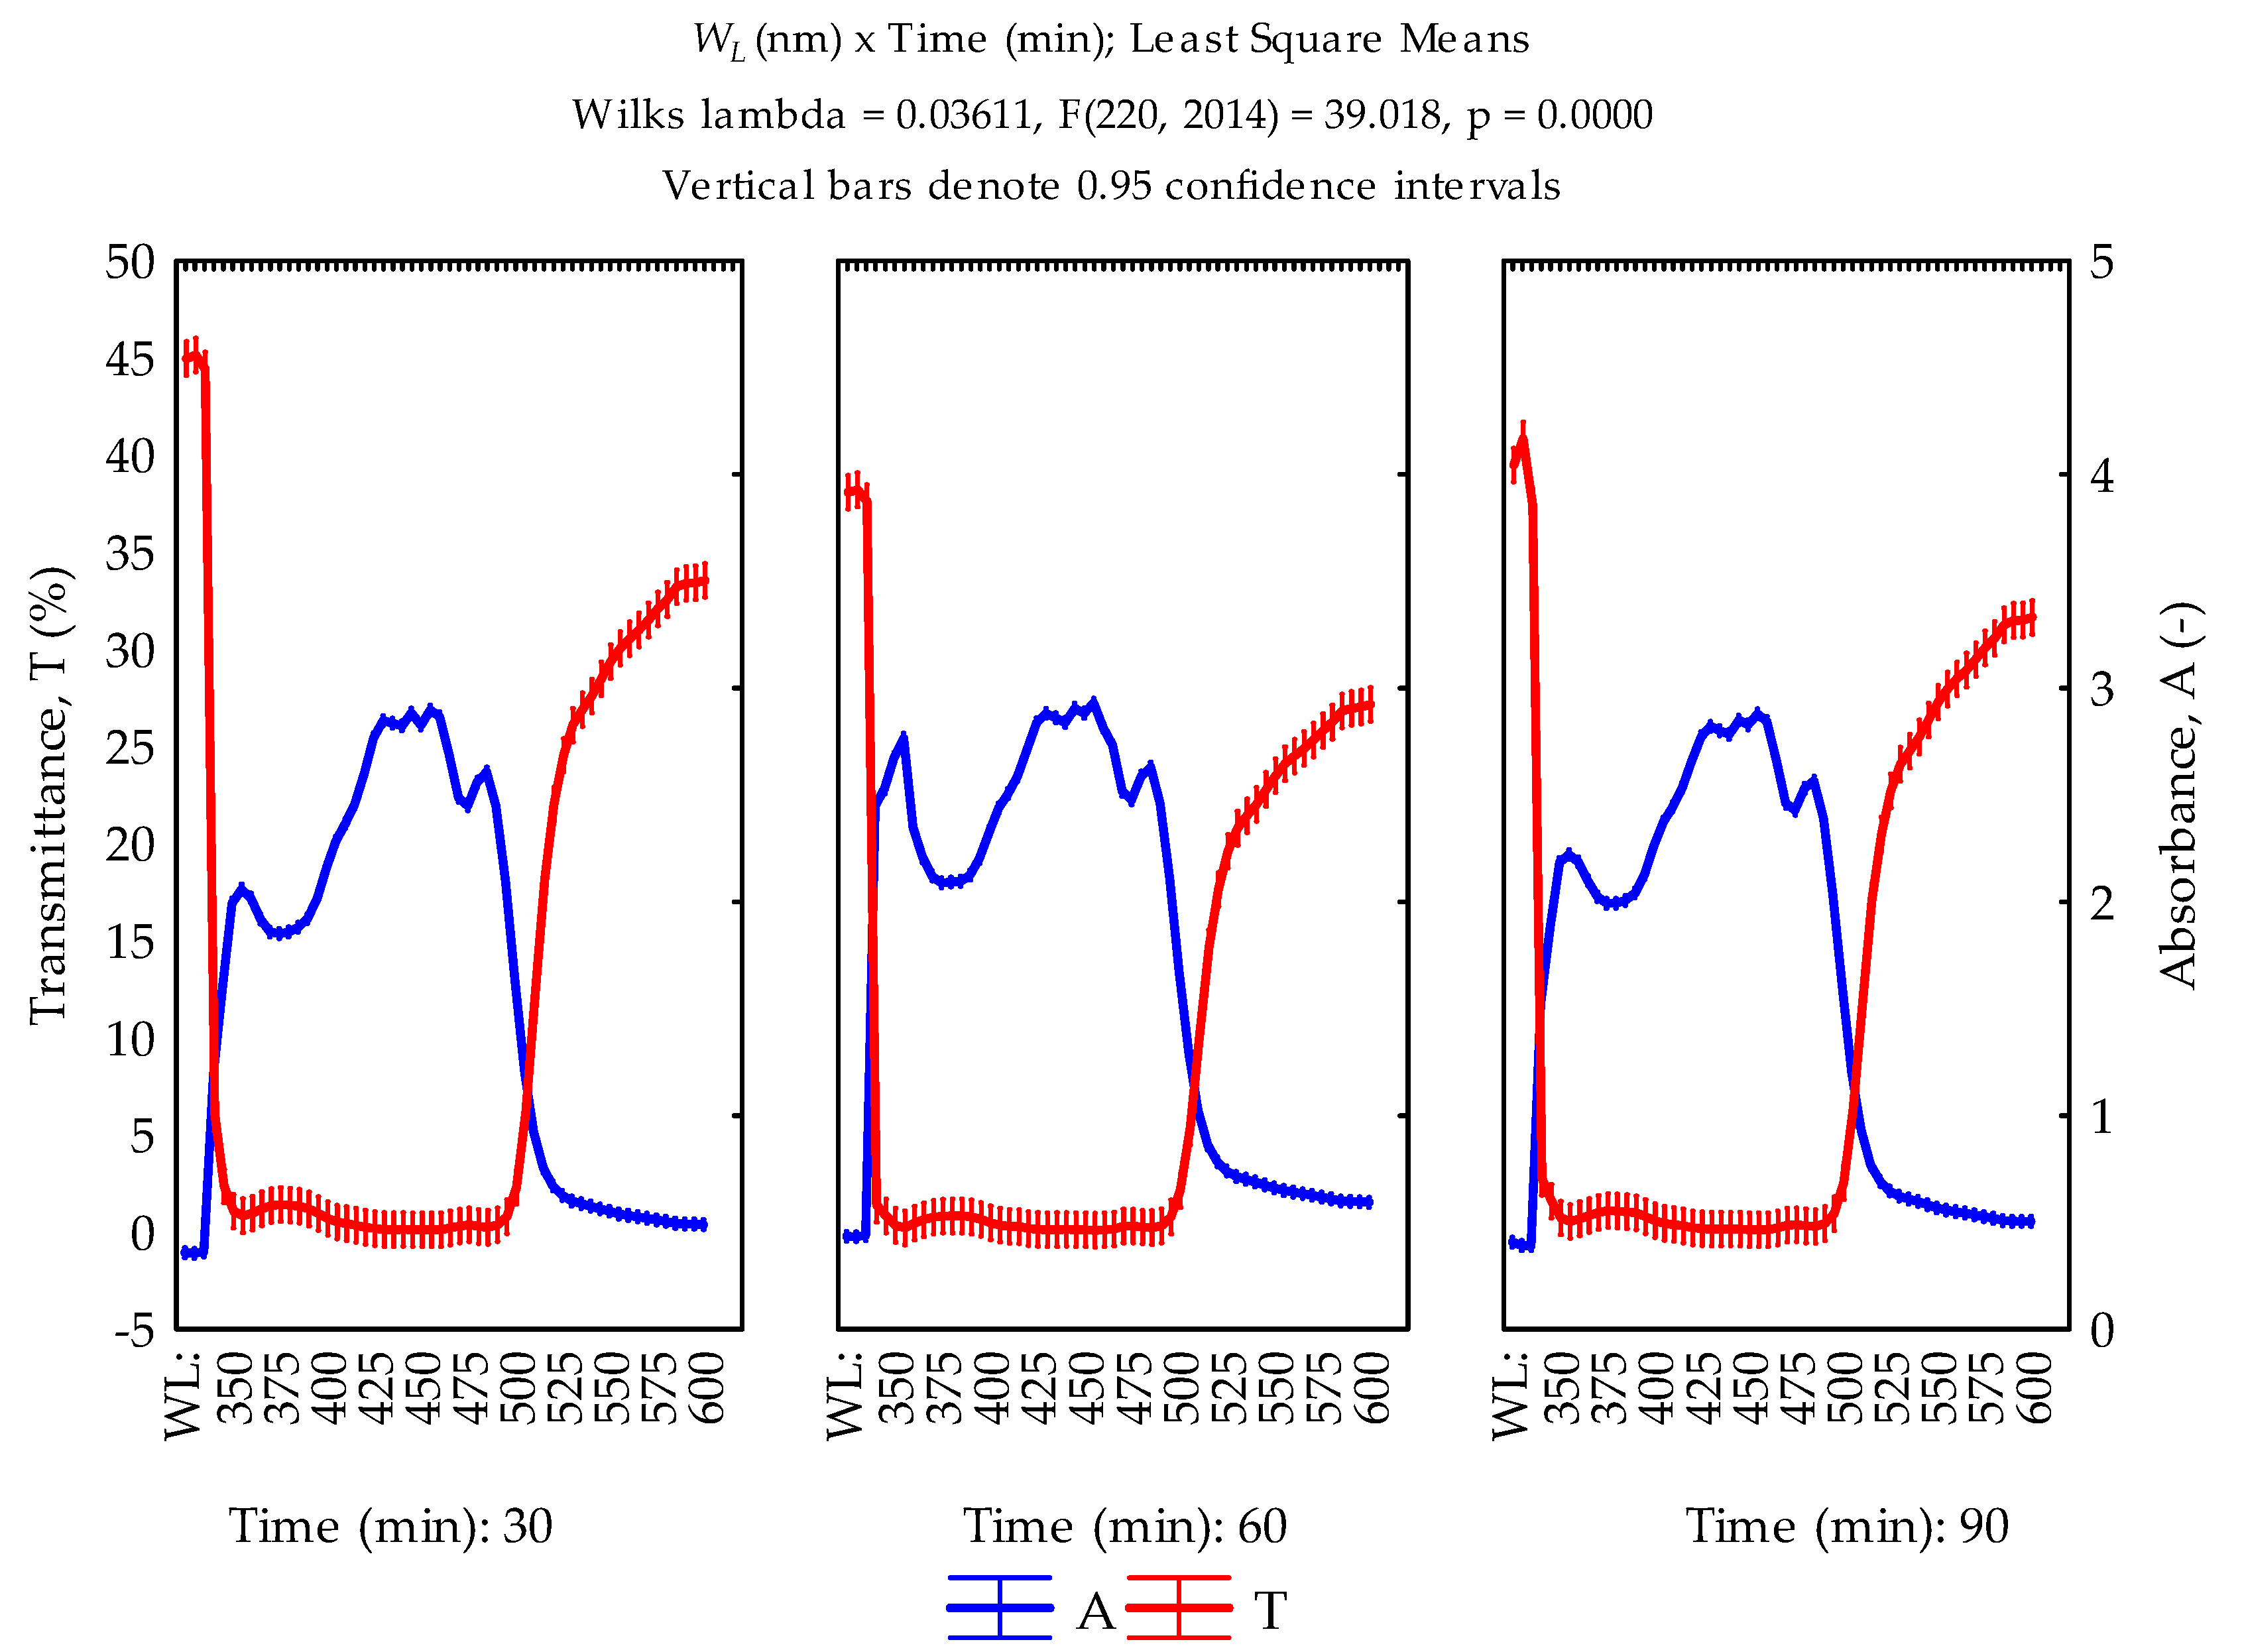
3.9. Effect of Compression Factors on Absorbance and Transmittance of Rapeseed Oil

Spectrophotometric analysis of the extracted rapeseed oil at different pretreatment temperatures and heating times was evaluated at different wavelengths to understand the effect of the pretreatment conditions on the spectral properties. The data were subjected to various statistical analyses. The ANOVA analysis (Table 10) showed that the individual compression factors and their interactions had a significant effect (p < 0.05) on the spectral profiles (absorbance and transmittance versus wavelength). The corrected model of the spectral profiles produced high values of the coefficient of determination (R2) of 0.999 and 0.995 respectively confirming the significant effect of the compression factors on the absorbance and transmittance values. The spectral profiles at different temperatures and heating times are graphically shown in Figure 7 and Figure 8, respectively. Additional statistical evaluation (correlation, multivariate tests of significance, multiple regression, and normality tests) of the experimental data are provided in the Supplemental Materials (Section 3.10), explaining in detail the significance of the results.

3.10. Supplementary Materials

The data on chemical properties (peroxide value, acid value, and free fatty acid) were further subjected to correlation analysis (Table S1). The correlation analysis showed that peroxide value did not significantly correlate with temperature (p > 0.05). However, it did significantly correlate (p < 0.05) with heating time. The acid value and free fatty acid value also did not significantly correlate (p > 0.05) with both temperature and heating time. The regression models for predicting the above-mentioned parameters and their coefficients of determination (R2) are given in Tables S2 and S3. The coefficients of determination (R2) for the regression models were found to be 0.629 and 0.039 (Table S3), respectively. The peroxide value of the rapeseed oil was significantly (p > 0.05) influenced by the heating temperatures and times. The significance of the result was further subjected to post hoc tests (Tukey HSD and Duncan) based on multiple comparisons of the mean differences of the compression factors. For both the Tukey HSD and Duncan tests, the mean difference of the temperatures of the sample of 40 °C and 80 °C showed non-significant results (p > 0.05), similar to the mean difference of the temperatures of the sample of 80 °C and 60 °C. However, the sample temperatures at 40 °C and 60 °C showed significance (p < 0.05) from their mean difference. On the other hand, the mean difference of the sample heating intervals of 30 min and 60 min with the Tukey’s HSD test indicated non-significance, whereas 30 min and 90 min, as well as 60 min and 90 min, tested significantly. In comparison with the Duncan test, the mean differences between 30 and 60 min, 30 and 90 min, and 60 and 90 min were significant (Table S4). The experimental data of the spectral profiles (absorbance and transmittance versus wavelength) were tested for normality. Based on the Kolmogorov–Smirnov normality test, the absorbance values at wavelengths from 325 nm to 335 nm, at 405 nm, from 415 nm to 425 nm, at 450 nm, and from 465 nm to 600 nm were significant (p > 0.05). The transmittance values were also observed to be significant at wavelengths from 325 nm to 335 nm, from 345 nm to 360 nm, at 405 nm, and from 500 nm to 600 nm. The Shapiro–Wilk normality test, on the other hand, showed that the absorbance values at wavelengths from 325 nm to 335 nm and from 465 nm to 600 nm were significant (p < 0.05). The transmittance values were also significant (p < 0.05) at wavelengths from 325 nm to 335 nm, at 355 nm, 360 nm, and from 500 nm to 600 nm. The Shapiro–Wilk test of normality showed high values of the coefficient of determination (R2) (Tables S5 and S6) compared to the Kolmogorov–Smirnov normality test. The normal distribution of the data was assessed based on the p-values being greater than the significance level of 5% [55]. From the correlation analysis, the absorbance and transmittance values significantly correlated (p < 0.05) with wavelength and temperature but they did not correlate significantly (p > 0.05) with heating time (Table S7). The multivariate tests of significance agreed with the correlation results (Table S8). Finally, the multiple regression analysis of the effects of the factors on the absorbance and transmittance of the rapeseed oil is given in Table S9. The intercept and the coefficients of the wavelength and temperature were significant (p < 0.05) for predicting the absorbance and transmittance of the rapeseed oil at a specific heating time. The spectral profiles of the rapeseed oil under varying temperatures and heating times are illustrated in Figure S1.

4. Discussion

In developing countries, mechanical screw presses are suitable for oil extraction compared to advanced methods such as ultrasound-assisted extraction [12,14,15,24]. Understanding fully the uniaxial compression process under a laboratory scale is key for optimizing the mechanical screw pressing system for large scale oil production for both domestic and industrial applications.
In this present study, the applied maximum compression forces of 180, 300, and 450 kN were equivalent to the pressure values of 63.66, 59.68, and 57.3 MPa, which were calculated based on the cross-sectional area of the compression vessels/chambers of diameters 60, 80, and 100 mm respectively. The examined compression factors, among others such as screw geometry/configuration and its components, namely nozzle sizes, screws with choke worm shaft ring sizes, and press cylinders with mesh sizes, thus affect the oil output, residual oil in seedcake, input energy, and oil quality under both the uniaxial compression and mechanical oil extraction processes [56,57,58,59].
These above-mentioned compression factors and responses need to be optimized using appropriate mathematical and statistical tools. In this context, the response surface methodology (RSM) based on the Box–Behnken design (BBD) was employed to optimize the compression factors—vessel diameters, pretreatment temperatures, and heating intervals—for the responses—oil yield, oil extraction efficiency, and deformation energy—for extracting rapeseed oil under uniaxial compression. The BBD generated 17 experimental runs with 12 factor combinations and 5 repetitions at the center points. Based on the BBD experimental data (Table 3), the compression factor combinations (Run 3) with pressing vessel diameter ( V D : 60 (−1)) mm, temperature ( T P R : 80 °C (+1)), and heating time ( H T M : 60 (0) min) produced the highest oil yield of 24.783% and oil extraction efficiency of 59.934%. The reason could be that the smaller pressing vessel of diameter 60 mm provided a much smaller space, which helped to increase the force (pressure) towards the seeds, resulting in high oil yield compared to the bigger pressing vessels of diameters 80 and 100 mm, which provided larger space and, hence, less pressure towards the seeds producing low oil yield [47]. In addition, an increase in pretreatment temperature and heating time will increase oil yield [60]. However, higher levels of heating will reduce the moisture content of the seeds, thereby impeding the cell wall of the seeds to break/crack, thus generating a low percentage of oil yield and/or oil extraction efficiency [47,60]. The experimental data were further analyzed using the response surface regression function in Statistica 13 software [54] to optimize the compression factors with the responses that were described by linear regression models ((Equations (8)–(10)). The linear regression models indicated a good fit for prediction, with high coefficient of determination values between 0.975 and 0.998. Again, the models were adequate since the F-values were greater than the p-values and the lack-of-fit p-values were non-significant (p > 0.05). [33,41,61] mentioned that a good regression model (one containing squared terms, products of two factors, linear terms, and intercepts) must be significant, the lack-of-fit p-value of the model must also be insignificant, and the coefficient of determination (R2) value of the model should be closer to 1. The results of the present study agreed with the above statements or boundary conditions.
Furthermore, applying the RSM approach requires that not only the optimum compression factors of the responses be determined, but also, they need to be validated through additional experiments. The optimum compression factor combinations for predicting the responses (oil yield (%), oil extraction efficiency (%) and deformation energy (kJ)) were observed as ( V D : 60 (−1) mm; T P R : 80 °C (+1) and H T M : 75 (+0.5) min) and ( V D : 100 (+1) mm; T P R : 80 °C (+1) and H T M : 90 (+1) min) with corresponding desirability values between 0.979 and 1. Ref. [34] explained that the desirability function can be used to determine optimum performance of the responses concerning the independent factors. The values of the coefficient of variation and percentage error of the predicated responses and their validation were between 0.09 and 2.3%, confirming the validity of the regression models ((Equations (8)–(10)).
In the industrial oil extraction process, the press cake with the residual oil content between 20% and 25% is mostly subjected to solvent extraction using n-hexane to recover the residual oil [8,20,22,35]. Under the uniaxial compression process, the residual oil can be recovered by the relaxation process, which is the dependency between the relaxation force and time at a constant strain of the bulk oilseeds. The relaxation process can be set together with the compression process. Residual oil of approximately 6% was recovered with a relaxation time of 10 min. This means that a total of 25 min was used for both the compression (15 min) and relaxation processes to extract the maximum oil yield and/or to achieve higher oil extraction efficiency. This information is useful for designing new oil extraction systems, such as mechanical screw presses, to avoid the combined use of the mechanical screw presses and the solvent extraction method to achieve high oil extraction efficiency or to minimize the residual oil in the seedcake. It is important to note that the examined compression factors (diameter of pressing vessel, temperature, and heating time) influenced the relaxation process in terms of the percentage oil yield and/or oil extraction efficiency. Lower levels of the compression factor combinations recorded lower amounts of the residual oil in the seedcake, whereas higher levels produced higher amounts of the residual oil. Besides, since the relaxation process is done at constant strain, there is no deformation energy utilization compared to the compression process where the deformation energy is characterized by the area under the force–deformation curve [27,50]. For the experimental design factor combinations ( V D : 60 (−1)) mm; temperature ( T P R : 80 °C (+1)) and heating time ( H T M : 60 (0) min) the deformation energy of 1.255 kJ produced the highest oil yield and/or oil extraction efficiency, as stated above. In comparison with the optimal factor combinations ( V D : 60 (−1) mm; T P R : 80 °C (+1) and H T M : 75 (+0.5) min), the deformation energy was 1.24 ± 0.01 kJ. The difference was almost negligible. The recorded deformation energy values indicate the threshold energy required for obtaining the maximum oil output concerning the compression factor combinations already stated above. However, the compression factor combinations ( V D : 100 (+1) mm; T P R : 80 °C (+1) and H T M : 90 (+1) min) produced higher deformation energy between 3.19 and 3.27 kJ, with a lower oil yield of 22.972 ± 0.519% and oil extraction efficiency of 55.553 ± 1.255%, indicating that the compression factor combinations ( V D : 60 (−1) mm; T P R : 80 °C (+1) and H T M : 60(0)/75 (+0.5) min) is the most optimal for estimating the oil yield (%), oil extraction efficiency (%), and deformation energy (kJ) of rapeseed oil extraction under uniaxial compression process.
Regarding the chemical properties of the extracted oil, the pretreatment temperatures did not significantly affect (p > 0.05) the peroxide value, acid value, and free fatty acid of the extracted rapeseed oil. The heating time at a specific pretreatment temperature had a significant effect on the peroxide value compared to the acid value and free fatty acid, which had no significant effect on the heating time. Ref. [62], cited in [24], indicated that excesses in the heating time and pretreatment temperature will result in seedcake with lower nutritional value and lower oil quality. Hence, the quality of the extracted oil can be preserved at a lower conditioning temperature of 60 °C and heating times between 50 and 60 min [24,63]. Generally, the peroxide value (PV), acid value (AV), and free fatty acid (FFA) are among the important physicochemical indicators for the quality assessment of edible oils. PV, AV, and FFA are evidence of autoxidation (free radical reaction) and hydrolytic rancidity [64,65,66]. Mathematically, FFA is half of AV [67]. The oxidation and chemical changes in oils during heating are characterized by an increase in free fatty acid content and a decrease in the total unsaturation of oils [67,68]. A high PV value may reflect either increased formation of hydroperoxides or reduced decomposition, whereas a high AV or FFA content results in increased losses during refining, poor flavor quality and stability of the finished edible oil, and rancidity of the oil [69,70,71,72]. PV, AV, and FFA values have been reported to range from 1.9 to 31.2 meq O2/kg oil, 0.6 to 4 mg KOH/g oil, and 1.122 to 10.261 mg KOH/g oil, respectively, which are influenced by different processing conditions and varieties of oilseeds [67,73]. In the present study, the low values of the PV, AV, and FFA achieved at the observed processing conditions meet the acceptable quality standards of edible oils [64,65,66,67,68,69,70,71,72,73].
Finally, the spectral profiles (absorbance and transmittance versus wavelength) of the extracted oil at different temperatures and heating times were described. The pretreatment temperatures and heating times increased the absorbance and transmittance values from 0.4 to 3.0 (-) and 22% to 45% with the wavelength between 325 and 600 nm. The absorbance increase occurred at wavelengths between 375 and 450 nm, whereas the transmittance increase was observed at wavelengths between 500 and 600 nm. However, at wavelengths between 525 and 600 nm, the absorbance values decreased. Similarly, the transmittance values decreased at wavelengths between 350 and 500 nm. It is important to mention that by examining the transmittance and absorbance versus wavelength of the extracted rapeseed oils, it could be also possible to analyze their oxidation stability as influenced by temperature and time pretreatment conditions [74,75]. In addition, the high absorption and low transmission rates of the extracted rapeseed oil suggest that the extracted oils at the various pretreatment conditions can be used for the prevention of ultraviolet radiation problems on human skin, as reported by [51]. However, this information needs to be studied extensively using advanced spectroscopic techniques [74,75,76,77,78].

5. Conclusions

The universal compression testing machine of a load capacity of 500 kN was used to evaluate the effect of compression factors, namely the diameter of the pressing vessel ( V D : 60, 80, and 100 mm), pretreatment temperature ( T P R : 40, 60, and 80 °C), and heating time ( H T M : 30, 60, and 90 min) on the responses of oil yield (%), oil extraction efficiency (%), and deformation energy (kJ). The compression factors and the responses were optimized by applying the response surface methodology (RSM) coupled with the Box–Behnken design (BBD), which is a statistical tool for analyzing the effect of independent factors on the dependent parameters. The Box–Behnken design generated 17 experimental runs, involving 12 compression factor combinations and 5 repetitions at the center points. From the BBD experimental data, the compression factor combinations and their coded values of vessel diameter (60 (−1), temperature (60 (0), and heating time (60 (0)) produced the maximum oil yield of 24.783% and oil extraction efficiency of 59.934%, with the corresponding deformation energy of 1.255 kJ. Based on the response surface regression analysis, linear regression models ((Equations (8)–(10))) were described for predicting the responses at optimum compression factor combinations ( V D : 60 (−1) mm; T P R : 80 °C (+1) and H T M : 75 (+0.5) min). The statistical lack-of-fit p-values of the regression models were non-significant (p > 0.05) and the coefficient of variation and percentage error values between the predicted and validated responses ranged between 0.08% and 2.30%, which indicate that the determined regression models were adequate for predicting the responses. The relaxation time of 10 min with the compression factor combinations ( V D : 80 (0) mm, T P R : 80 °C (+1), and H T M : 90 (+1) min) recovered the maximum amount of the residual oil of approximately 6% from the seedcake. On contrary, the compression factor combinations ( V D : 60 (−1) mm, T P R : 80 °C (+1), and H T M : 60 (0)/75(+0.5) min) may not require the relaxation process since the residual oil recovered was negligible.
The chemical properties (peroxide value, acid value, and free fatty acid value) and spectral properties (absorbance and transmittance versus wavelength) of the extracted rapeseed oil were not significantly affected by the studied compression factors, indicating that the rapeseed oil could be extracted at pretreatment temperatures between 40 and 80 °C and heating times between 30 and 90 min without any quality assessment problems related to domestic, industrial, and pharmaceutical applications.
The present study is part of our continuing research on the uniaxial compression process of different oilseeds to fully understand the compression factors concerning the oil extraction efficiency and deformation energy requirement to reduce the residual oil in the seedcake using the mechanical screw presses, which will be the focus of future studies.

Supplementary Materials

The following are available online at https://0-www-mdpi-com.brum.beds.ac.uk/article/10.3390/pr9101755/s1, Table S1: Correlation analysis of the chemical properties with the factors effect; Table S2: Multiple regression results of the chemical properties with the factors effect; Table S3: Test of the sum of squares whole model of the factors effect on the peroxide value, acid value, and free fatty acid value of rapeseed oil; Table S4: Post hoc tests of peroxide value of rapeseed oil with the factors effect; Table S5: Tests of normality of absorbance, A (-), of rapeseed oil with the factors effect; Table S6: Tests of normality of transmittance, T (%), of rapeseed oil with the factors effect; Table S7: Correlation analysis of the absorbance and transmittance of rapeseed oil with the factors effect; Table S8: Multivariate tests of significance of the factors effects on absorbance (-) and transmittance, T (%); Table S9: Multiple regression analysis of the factors effect on absorbance, A (-), and transmittance, T (%); Figure S1: Absorbance and transmittance versus wavelength of rapeseed oil at laboratory temperature, heating temperatures, and heating times.

Author Contributions

Conceptualization, C.D., A.K., D.H. and Č.M.; funding acquisition, D.H.; methodology, C.D., A.K., Č.M. and P.H.; validation, C.D.; A.K. and O.D.; formal analysis, C.D., A.K. and O.D.; data curation, C.D., A.K. and P.H.; writing—original draft, C.D. and A.K.; writing—review and editing, C.D., A.K., D.H., Č.M. and O.D. All authors have read and agreed to the published version of the manuscript.

Funding

The research was financed by the project ‘‘Supporting the development of international mobility of research staff at CULS Prague”, grant Number: CZ.02.2.69/0.0/0.0/18_053/0016979.

Institutional Review Board Statement

Not applicable.

Informed Consent Statement

Not applicable.

Data Availability Statement

The data presented in this study are available on request from the corresponding author.

Conflicts of Interest

The authors declare no conflict of interest.

References

  1. Tang, L.; Yasir, H.; Zehra, A.; Shohag, M.J.I.; He, Z.; Yang, X. Endophytic inoculation couple with soil amendment and folia inhibitor ensure phytoremediation and agro-production in cadmium contaminated soil under oilseed-rice rotation system. Sci. Total Environ. 2020, 748, 142481. [Google Scholar] [CrossRef]
  2. Foley, J.A.; Ramankutty, N.; Brauman, K.A.; Cassidy, E.S.; Gerber, J.S.; Johnston, M.; Mueller, N.D.; Connell, C.; Ray, D.K.; West, P.C.; et al. Solutions for a cultivated planet. Nature 2011, 478, 337–342. [Google Scholar] [CrossRef] [Green Version]
  3. Pullens, J.W.M.; Sharif, B.; Trnka, M.; Balek, J.; Semenov, M.A.; Olesen, J.E. Risk factors for European winter oilseed rape production under climate change. Agric. For. Meteorol. 2019, 272–273, 30–39. [Google Scholar] [CrossRef]
  4. van Duren, I.; Voinov, A.; Arodudu, O.; Firrisa, M.T. Where to produce rapeseed biodiesel and why? Mapping European rapeseed energy efficiency. Renew. Energy 2015, 74, 49–59. [Google Scholar] [CrossRef] [Green Version]
  5. Monfreda, C.; Ramankutty, N.; Foley, J.A. Farming the planet: 2. Geographic distribution of crop areas, yields, physiological types, and net primary production in the year 2000. Glob. Biogeochem. Cycles 2008, 22, 1–19. [Google Scholar] [CrossRef]
  6. FAOSTAT. Food and Agriculture Organization of the United Nations; Statistics Division: Rome, Italy, 2012. [Google Scholar]
  7. Tuck, G.; Glendining, M.J.; Smith, P.; House, J.I.; Wattenbach, M. The potential distribution of bioenergy crops in Europe under present and future climate. Biomass Bioenergy 2006, 30, 183–197. [Google Scholar] [CrossRef]
  8. Li, X.; Zhang, L.; Zhang, Y.; Wang, D.; Xuefang, W.; Yu, L.; Zhang, W.; Li, P. Review of NIR spectroscopy methods for nondestructive quality analysis of oilseeds and edible oils. Trends Food Sci. Technol. 2020, 101, 172–181. [Google Scholar] [CrossRef]
  9. Yang, R.N.; Zhang, L.X.; Li, P.W.; Yu, L.; Mao, J.; Wang, X.; Zhang, Q. A review of chemical composition and nutritional properties of minor vegetable oils in China. Trends Food Sci. Technol. 2018, 74, 26–32. [Google Scholar] [CrossRef]
  10. Vithu, P.; Moses, J.A. Machine vision system for food grain quality evaluation: A review. Trends Food Sci. Technol. 2016, 56, 13–20. [Google Scholar] [CrossRef]
  11. Embaye, W.T.; Bergtold, J.S.; Archer, D.; Flora, C.; Andrango, G.C.; Odening, M.; Buysse, J. Examining farmers’ willingness to grow and allocate land for oilseed crops for biofuel production. Energy Econ. 2018, 71, 311–320. [Google Scholar] [CrossRef]
  12. Koubaa, M.; Mhemdi, H.; Barba, J.F.; Roohinejad, S.; Greiner, R.; Vorobiev, E. Oilseeds treatment by ultrasounds and microwaves to improve oil yield and quality: An overview. Food Res. Int. 2016, 85, 59–66. [Google Scholar] [CrossRef]
  13. Daun, J.K.; Eskin, M.N.A.; Hickling, D. Canola Chemistry, Production, Processing and Utilization; AOCS Press: Urbana, IL, USA, 2011; p. 432. [Google Scholar]
  14. Liu, J.-J.; Gasmalla, M.A.A.; Li, P.; Yang, R. Enzyme-assisted extraction processing from oilseeds: Principle, processing and application. Innov. Food Sci. Emerg. Technol. 2016, 35, 184–193. [Google Scholar] [CrossRef]
  15. Rombaut, N.; Savoire, R.; Thomasset, B.; Belliard, T.; Castello, J.; Hecke, E.V.; Lanoiselle, J.-L. Grape seed oil extraction: Interest of supercritical fluid extraction and gas-assisted mechanical extraction for enhancing polyphenol co-extraction in oil. C. R. Chim. 2014, 17, 284–292. [Google Scholar] [CrossRef]
  16. Voges, S.; Eggers, R.; Pietsch, A. Gas assisted oilseed pressing. Sep. Purif. Technol. 2008, 63, 1–14. [Google Scholar] [CrossRef]
  17. Willems, P. Gas-Assisted Mechanical Expression of Oilseeds. Ph.D. Thesis, University of Twente, Twente, The Netherlands, 2007; p. 104. [Google Scholar]
  18. Cao, X.; Ito, Y. Supercritical fluid extraction of grape seed oil and subsequent separation of free fatty acids by high-speed counter-current chromatography. J. Chromatogr. A 2003, 1021, 117–124. [Google Scholar] [CrossRef]
  19. Bargale, P.C. Mechanical Oil Expression from Selected Oilseeds under Uniaxial Compression; University of Saskatchewan: Sasktoon, SK, Canada, 1997. [Google Scholar]
  20. Popescu, M.; Avram, M.D.; Oancea, F.; Lupu, C.; Cornea, C.P. Bioassisted azeotropic Soxhlet extraction of mustard oilseeds. J. Biotechnol. 2017, 256, S101. [Google Scholar] [CrossRef]
  21. Gunstone, F. Rapeseed and Canola Oil Production Processing, Properties and Uses; John Wiley and Sons: New York, NY, USA, 2009. [Google Scholar]
  22. García-Ayuso, L.E.; Velasco, J.; Dobarganes, M.C.; Castro, L.M.D. Determination of the oil content of seeds by focused microwave-assisted Soxhlet extraction. Chromatographia 2000, 52, 103–108. [Google Scholar] [CrossRef]
  23. Mhemdi, H.; Koubaa, M.; Majid, A.E.; Vorobiev, E. Solute and gas assisted mechanical expression for green oil recovery from rapeseed hulls. Ind. Crop. Prod. 2016, 92, 300–307. [Google Scholar] [CrossRef]
  24. Rodrigues, J.; Miranda, I.; Gominho, J.; Vasconcelos, M.; Barradas, G.; Pereira, H.; Bianchi-de-Aguiar, F.; Ferreira-Dias, S. Modeling and optimization of laboratory-scale conditioning of Jatropha curcas L. Seeds for oil expression. Ind. Crop. Prod. 2016, 83, 614–619. [Google Scholar] [CrossRef]
  25. Kabutey, A.; Mizera, C.; Dajbych, O.; Hrabe, P.; Herak, D.; Demirel, C. Modelling and optimization of processing factors of pumpkin seeds oil extraction under uniaxial loading. Processes 2021, 9, 540. [Google Scholar] [CrossRef]
  26. Herak, D.; Kabutey, A.; Choteborsky, R.; Petru, M.; Sigalingging, R. Mathematical models describing the relaxation behaviour of Jatropha curcas L. bulk seeds under axial compression. Biosyst. Eng. 2015, 131, 77–83. [Google Scholar] [CrossRef]
  27. Gupta, R.K.; Das, S.K. Fracture resistance of sunflower seed and kernel to compressive loading. J. Food Eng. 2000, 46, 1–8. [Google Scholar] [CrossRef]
  28. Darwish, H.W.; Bakheit, A.H.; Al-Anazi, Z.S.; Al-Shakliah, N.S.; Al-Hossanini, A.M.; Naguib, I.A.; Darwish, I.A. Response surface methodology for optimization of micellar-enhanced spectrofluorimetric method for assay of foretinib in bulk powder and human urine. Spectrochim. Acta Part A Mol. Biomol. Spectrosc. 2021, 257, 119811. [Google Scholar] [CrossRef]
  29. Nanvakenari, S.; Movagharnejad, K.; Latifi, A. Evaluating the fluidized-bed drying of rice using response surface methodology and artificial neural network. LWT Food Sci. Technol. 2021, 147, 111589. [Google Scholar] [CrossRef]
  30. Rebollo-Hernanz, M.; Canas, S.; Taladrid, D.; Segovia, A.; Begona, B.; Aguilera, Y.; Martin-Cabrejas, M.A. Extraction of phenolic compounds from cocoa shell: Modeling using response surface methodology and artificial neural networks. Sep. Purif. Technol. 2021, 270, 118779. [Google Scholar] [CrossRef]
  31. Subbian, V.; Kumar, S.S.; Chaithanya, K.; Arul, S.J.; Kaliyaperumal, G.; Adam, K.M. Optimization of solar tunnel dryer for mango slice using response surface methodology. Mater. Today 2021, 46, 7844–7847. [Google Scholar]
  32. Ye, W.; Wang, X.; Liu, Y.; Chen, J. Analysis and prediction of the performance of free-piston Stirling engine using response surface methodology and artificial neural network. Appl. Therm. Eng. 2021, 188, 116557. [Google Scholar] [CrossRef]
  33. Jana, D.K.; Roy, K.; Dey, S. Comparative assessment on lead removal using micellar-enhanced ultrafiltration (MEUF) based on a type-2 fuzzy logic and response surface methodology. Sep. Purif. Technol. 2018, 207, 28–41. [Google Scholar] [CrossRef]
  34. Mourabet, M.; EI Rhilassi, A.; EI Boujaady, H.; Bennani-Ziatni, M.; Taitai, A. Use of response surface methodology for optimization of fluoride adsorption in an aqueous solution by Brushite. Arab. J. Chem. 2017, 10, S3292–S3302. [Google Scholar] [CrossRef] [Green Version]
  35. Bogaert, L.; Mathieu, H.; Mhemdi, H.; Vorobiev, E. Characterization of oilseeds mechanical expression in an instrumented pilot screw press. Ind. Crop. Prod. 2018, 121, 106–113. [Google Scholar]
  36. ISI. Indian Standard Methods for Analysis of Oilseeds; IS:3579; Indian Standard Institute (ISI): New Delhi, India, 1966.
  37. Huang, S.; Hu, Y.; Li, F.; Jin, W.; Godara, V.; Wu, B. Optimization of mechanical oil extraction process from Camellia oleifera seeds regarding oil yield and energy consumption. J. Food Process Eng. 2019, 42, e13157. [Google Scholar] [CrossRef]
  38. Niu, L.; Li, J.; Chen, M.S.; Xu, Z.F. Determination of oil contents in Sacha inchi (Plukenetia volubilis) seeds at different developmental stages by two methods: Soxhlet extraction and time-domain nuclear magnetic resonance. Ind. Crop. Prod. 2014, 56, 187–190. [Google Scholar] [CrossRef]
  39. Danlami, J.M.; Arsad, A.; Zaini, M.A.A. Characterization and process optimization of castor oil (Ricinus communis L.) extracted by the soxhlet method using polar and non-polar solvents. J. Taiwan Inst. Chem. Eng. 2015, 47, 99–104. [Google Scholar] [CrossRef]
  40. Blahovec, J. Agromatereials Study Guide; Czech University of Life Sciences Prague: Prague, Czech Republic, 2008. [Google Scholar]
  41. Goo, Y.T.; Yang, H.M.; Kim, C.H.; Kim, M.S.; Kim, H.K.; Chang, I.H.; Choi, Y.W. Optimization of a floating poloxamer 407-based hydrogel using the Box-Behnken design: In vitro characterization and in vivo buoyancy evaluation for intravesical instillation. Eur. J. Pharm. Sci. 2021, 163, 105885. [Google Scholar] [CrossRef]
  42. Khatib, I.; Chow, M.Y.T.; Ruan, J.; Cipolla, D.; Chan, H.-K. Modeling of a spray drying method to produce ciprofloxacin nanocrystals inside the liposomes utilizing a response surface methodology: Box-Behnken experimental design. Int. J. Pharm. 2021, 597, 120277. [Google Scholar] [CrossRef]
  43. Song, H.; Chung, H.; Nam, K. Response surface modeling with Box-Behnken design for strontium removal from soil by calcium-based solution. Environ. Pollut. 2021, 274, 116577. [Google Scholar] [CrossRef]
  44. Ocholi, O.; Menkiti, M.; Auta, M.; Ezemagu, I. Optimization of the operating parameters for the extractive synthesis of biolubricant from sesame seed oil via response surface methodology. Egypt. J. Pet. 2018, 27, 265–275. [Google Scholar] [CrossRef]
  45. Witek-Krowiak, A.; Chojnacka, K.; Podstawczyk, D.; Dawiec, A.; Pokomeda, K. Application of response surface methodology and artificial neural network methods in modeling and optimization of biosorption process. Bioresour. Technol. 2014, 60, 150–160. [Google Scholar] [CrossRef]
  46. Hernandez-Santos, B.; Rodriguez-Miranda, J.; Herman-Lara, E.; Torruco-Uco, J.G.; Carmona-Garcia, R.; Juarez-Barrientos, J.M.; Chavez-Zamudio, R.; Martinez-Sanchez, C.E. Effect of oil extraction assisted by ultrasound on the physicochemical properties and fatty acid profile of pumpkin seed oil (Cucurbita pepo). Ultrason. Sonochem. 2016, 31, 429–436. [Google Scholar] [CrossRef]
  47. Deli, S.; Farah Masturah, M.; Tajul Aris, Y.; Wan Nadiah, W.A. The effects of physical parameters of the screw press oil expeller on oil yield from Nigella sativa L. seeds. Int. Food Res. J. 2011, 18, 1367–1373. [Google Scholar]
  48. Divisova, M.; Herak, D.; Kabutey, A.; Sigalingging, R.; Svatonova, T. Deformation curve characteristics of rapeseeds and sunflower seeds under compression loading. Sci. Agric. Bohem. 2014, 45, 180–186. [Google Scholar]
  49. Chakespari, A.G.; Rajabipour, A.; Mobli, H. Strength behaviour study of apples (cv. Shafi Abadi & Golab Kohanz) under compression loading. Mod. Appl. Sci 2010, 4, 173–182. [Google Scholar]
  50. Lysiak, G. Fracture toughness of pea: Weibull analysis. J. Food Eng. 2007, 83, 436–443. [Google Scholar] [CrossRef]
  51. Kumar, K.A.; Viswanathan, K. Study of UV transmission through a few edible oils and chicken oil. J. Spectrosc. 2013, 2013, 540417. [Google Scholar]
  52. Zhang, N.; Li, Y.; Wen, S.; Sun, Y.; Chen, J.; Gao, Y.; Sagymbek, A.; Yu, X. Analytical methods for determining the peroxide value of edible oils: A mini-review. Food Chem. 2021, 358, 129834. [Google Scholar] [CrossRef] [PubMed]
  53. Gurkan, A.K.G.; Kabutey, A.; Selvi, K.C.; Hrabe, P.; Herak, D.; Frankova, A. Investigation of heating and freezing pretreatments of mechanical, chemical and spectral properties of bulk sunflower seeds and oil. Processes 2020, 8, 411. [Google Scholar]
  54. Statsoft Inc. STATISTICA for Windows; Statsoft Inc.: Tulsa, OK, USA, 2013. [Google Scholar]
  55. Kaewwinud, N.; Khokhajaikiat, P.; Boonma, A. Effect of biomass characteristics on durability of Cassava residues pellets. Res. Agric. Eng. 2018, 64, 15–19. [Google Scholar]
  56. Karaj, S.; Muller, J. Optimizing mechanical oil extraction of Jatropha curcas L. seeds with respect to press capacity, oil recovery and energy efficiency. Ind. Crop. Prod. 2011, 34, 1010–1016. [Google Scholar]
  57. Willems, P.; Kuipers, N.J.M.; De Haan, A.B. A consolidation based extruder model to explore GAME process configurations. J. Food Eng. 2009, 90, 238–245. [Google Scholar] [CrossRef]
  58. Willems, P.; Kuipers, N.J.M.; De Haan, A.B. Hydraulic pressing of oilseeds; experimental determination and modelling of yield and pressing rates. J. Food Eng. 2008, 89, 8–16. [Google Scholar] [CrossRef]
  59. Savoire, R.; Lanoiselle, J.-L.; Vorobiev, E. Mechanical continuous oil expression from oilseeds: A Review. Food Bioprocess Technol. 2013, 6, 1–16. [Google Scholar] [CrossRef]
  60. Baryeh, E.A. Effects of palm oil processing parameters on yield. J. Food. Eng. 2001, 48, 1–6. [Google Scholar] [CrossRef]
  61. Chanioti, S.; Constantina, T. Optimization of ultrasound-assisted extraction of oil from olive pomace using response surface technology: Oil recovery, unsaponifiable matter, total phenol content and antioxidant activity. LWT Food Sci. Technol. 2017, 79, 178–189. [Google Scholar] [CrossRef]
  62. Walkelyn, P.J.; Wan, P.J. Solvent extraction to obtain edible oil products. In Handbook of Functional Lipids; Akoh, C.C., Ed.; CRC Press: Boca Raton, FL, USA, 2006; pp. 89–131. [Google Scholar]
  63. Pradhan, R.C.; Mishra, S.; Naik, S.N.; Bhatnagar, N.; Vijay, V.K. Oil expression from Jatropha seeds using a screw press expeller. Biosyst. Eng. 2011, 109, 158–166. [Google Scholar] [CrossRef]
  64. Bai, S.H.; Darby, I.; Nevenimo, T.; Hannet, G.; Hannet, D.; Poienou, M.; Grant, E.; Brooks, P.; Walton, D.; Randall, B.; et al. Effects of roasting on kernel peroxide value, free fatty acid, fatty acid composition and crude protein content. PLoS ONE 2017, 12, e0184279. [Google Scholar]
  65. Walton, D.A.; Randall, B.W.; Poienou, M.; Nevenimo, T.; Moxon, J.; Wallace, H.M. Shelf life of tropical Canarium nut stored under ambient conditions. Horticulturae 2017, 3, 24. [Google Scholar] [CrossRef] [Green Version]
  66. Ozdemir, M.; Ackurt, F.; Yildiz, M.; Biringen, G.; Gurcan, T.; Loker, M. Effect of roasting on some nutrients of hazelnuts (Corylus Avellena L.). Food Chem. 2001, 73, 185–190. [Google Scholar] [CrossRef]
  67. Nduka, J.K.C.; Omozuwa, P.O.; Imanah, O.E. Effect of heating time on the physicochemical properties of selected vegetable oils. Arab. J. Chem. 2021, 14, 103063. [Google Scholar] [CrossRef]
  68. Perkin, E.G. Effect of lipid oxidation on oil and food quality in deep frying. In Lipid Oxidation in Food; Chapter 18; Angels, A.J.S., Ed.; ACS Publications: Washington, DC, USA, 1992; pp. 310–321. [Google Scholar]
  69. Pietro, M.E.D.; Mannu, A.; Mele, A. NMR determination of free fatty acids in vegetable oils. Processes 2020, 8, 410. [Google Scholar] [CrossRef] [Green Version]
  70. Lanser, A.C.; List, G.R.; Holloway, R.K.; Mounts, T.L. FTIR estimation of free fatty acid content in crude oils extracted from damaged soybeans. J. Am. Oil Chem. Soc. 1991, 68, 448–449. [Google Scholar] [CrossRef]
  71. Li, G.; You, J.; Suo, Y.; Song, C.; Sun, Z.; Xia, L.; Zhao, X.; Shi, J. A developed pre-column derivatization method for the determination of free fatty acids in edible oils by reversed-phase HPLC with fluorescence detection and its application to Lycium barbarum seed oil. Food Chem. 2011, 125, 1365–1372. [Google Scholar] [CrossRef]
  72. Mahesar, S.A.; Sherazi, S.T.H.; Khaskheli, A.R.; Kandhro, A.A.; Uddin, S. Analytical approaches for the assessment of free fatty acids in oils and fats. Anal. Methods 2014, 6, 4956–4963. [Google Scholar] [CrossRef]
  73. Frega, N.; Mozzon, M.; Lercker, G. Effects of free fatty acids on oxidative stability of vegetable oil. JAOCS 1999, 76, 325–329. [Google Scholar] [CrossRef]
  74. Pattnaik, M.; Mishra, H.N. Oxidative stability of ternary blends of vegetable oils: A chemometric approach. LWT Food Sci. Technol. 2021, 142, 111018. [Google Scholar] [CrossRef]
  75. Li, J.; Liu, J.; Sun, X.; Liu, Y. The mathematical prediction model for the oxidative stability of vegetable oils by the main fatty acids composition and thermogravimetric analysis. LWT Food Sci. Technol. 2018, 96, 51–57. [Google Scholar] [CrossRef]
  76. Chen, W.; Yu, H.-Q. Advances in the characterization and monitoring of natural organic matter using spectroscopic approaches. Water Res. 2021, 190, 116759. [Google Scholar] [CrossRef] [PubMed]
  77. Mota, M.F.S.; Waktola, H.D.; Nolvachai, Y.; Marriott, P.J. Gas chromatography-mass spectrometry for characterization, assessment of quality and authentication of seed and vegetable oils. TrAC Trends Anal. Chem. 2021, 138, 116238. [Google Scholar] [CrossRef]
  78. Farber, C.; Mahnke, M.; Sanchez, L.; Kurouski, D. Advanced spectroscopic techniques for plant disease diagnostics. A review. TrAC Trends Anal. Chem. 2019, 118, 43–49. [Google Scholar] [CrossRef]
Figure 1. (A): Pressing vessels with plungers of diameters 60, 80, and 100 mm; (B): compression test showing the extracted rapeseed oil; (C): Soxhlet extraction setup for extracting the rapeseed oil; (D): compressed rapeseeds sample (1), extracted rapeseed oil (2), and eapeseeds sample before the compression test (3); and (E): extracted rapeseed oil in triplicate from the Soxhlet extraction method.
Processes 09 01755 g001
Figure 2. Force–deformation curves of rapeseeds for different vessel diameters, showing the deformation energy and seedcake ejection.
Processes 09 01755 g002
Figure 3. Compression force and deformation curves of experimental runs (R1 to R17) of rapeseed oil extraction.
Processes 09 01755 g003
Figure 4. Profiles for predicted values and desirability of (a) oil yield (%), (b) oil expression efficiency (%), and (c) deformation energy (kJ) at optimal V D : vessel diameter (mm) ,   T P R : temperature (°C), and H T M : heating time (min). Coded values (−1, 0 and 1) represent 60, 80, and 100 mm for V D ; 40, 60, and 80 for T P R and 30, 60, and 90 min for T M E ; the circle represents optimum values; the rectangle represents desirability values.
Processes 09 01755 g004aProcesses 09 01755 g004b
Figure 5. Surface plots and area contours between the compression factor interactions (vessel diameter, temperature, and heating time) and responses (oil expression efficiency (%) (ac) and deformation energy (kJ) (df)) of rapeseed oil extraction. Coded values (−1, 0, and 1) represent 60, 80 and 100 mm for vessel diameter (mm); 40, 60, and 80 for temperature (°C); and 30, 60, and 90 min for heating time (min).
Processes 09 01755 g005aProcesses 09 01755 g005b
Figure 6. Compression and relaxation processes of rapeseed oil extraction.
Processes 09 01755 g006
Figure 7. Transmittance and absorbance versus wavelength (WL) of rapeseed oil at different pretreatment temperatures.
Processes 09 01755 g007
Figure 8. Transmittance and absorbance versus wavelength (WL) of rapeseed oil at different heating times.
Processes 09 01755 g008
Table 1. Control experiments for the determination of maximum compression force of bulk rapeseeds oil extraction.
* Vessel Diameter V D (mm) ** Maximum Force
M F   ( kN )
Mass of Oil
M O (g)
Oil Yield
O Y (%)
Oil Extraction Efficiency
O E F (%)
Deformation
Energy
E N (kJ)
Deformation
D F (mm)
Hardness
H D (kN/mm)
60 a18030.68 ± 0.5716.12 ± 0.3038.98 ± 0.721.20 ± 0.0452.89 ± 0.763.40 ± 0.05
80 b30049.89 ± 2.0514.73 ± 0.6135.61 ± 1.462.04 ± 0.0651.40 ± 1.115.84 ± 0.13
100 c45072.23 ± 1.8813.77 ± 0.3633.30 ± 0.872.80 ± 0.0151.12 ± 2.228.81 ± 0.38
* At an initial bulk seed pressing height, H = 100 mm (a weight = 190.33 g; b weight = 338.80 g; c weight = 524.54 g) and speed 4 mm/min; ** limit force for maximum oil extraction without the serration effect.
Table 2. Evaluation of the ANOVA test of the calculated responses of the control experiments of bulk rapeseeds.
Calculated ResponsesR2F-Valuep-Value
Mass of Oil, M O (g)0.994482.142<0.05
Oil Yield, O Y (%)0.87721.494<0.05
Oil Extraction Efficiency, O E F (%)0.87721.494<0.05
Deformation Energy, E N (kJ)0.9971122.847<0.05
Deformation, D F (mm)0.2881.211>0.05
Hardness, H D (kN/mm)0.996411.401<0.05
R2: Coefficient of determination; p-values < 0.05 indicate significance; p-values > 0.05 denote indicates non-significance.
Table 3. Box–Behnken design of compression factors combination, coded values, and calculated responses (oil yield, oil expression efficiency, and deformation energy).
Run
(R)
V D
(mm)
T P R
(° C)
H T M
(min)
O Y
(%)
O E F
(%)
E N
(kJ)
160 (–1)40 (–1)60 (0)17.46442.2351.172
2100 (+1)40 (–1)60 (0)16.84940.7462.926
360 (–1)80 (+1)60 (0)24.78359.9341.255
4100 (+1)80 (+1)60 (0)23.29756.3393.187
560 (–1)60 (0)30 (–1)20.27049.0201.196
6100 (+1)60 (0)30 (–1)19.96848.2892.989
760 (–1)60 (0)90 (+1)23.54956.9481.274
8100 (+1)60 (0)90 (+1)20.21448.8843.115
980 (0)40 (–1)30 (–1)16.17239.1091.988
1080 (0)80 (+1)30 (–1)21.65052.3572.045
1180 (0)40 (–1)90 (+1)18.08443.7342.044
1280 (0)80 (+1)90 (+1)23.04955.7402.231
1380 (0)60 (0)60 (0)20.83850.3942.074
1480 (0)60 (0)60 (0)20.97150.7152.068
1580 (0)60 (0)60 (0)21.42051.8002.038
1680 (0)60 (0)60 (0)21.74152.5782.163
1780 (0)60 (0)60 (0)21.06850.9502.112
V D : Vessel diameter (mm); T P R : temperature (°C); H T M : heating time (min); O Y : oil yield (%); O E F : oil extraction efficiency (%); E N : deformation energy (kJ).
Table 4. Estimates of the responses and their statistical evaluation parameters.
Effect O Y (%),
Model a Coefficients
Standard ErrorSum of SquaresdfMean SquareF-Valuep-Value
Intercept21.2080.25084.26499.36330.0590.000
V D −0.5120.1972.09512.09515.4730.017
V D 20.1200.2720.06110.0610.4510.539
T P R 3.0260.19773.260173.260540.9710.000
T P R 2−0.7300.2722.24312.24316.5610.015
H T M 0.6490.1973.36913.36924.8780.008
H T M 2−0.7390.2722.30112.30116.9880.015
V D * T P R −0.2180.2790.19010.1901.4010.302
V D * H T M −0.3470.2790.48210.4823.5570.132
T P R * H T M −0.1280.2790.06610.0660.4870.524
Residual 2.18070.311
Lack of fit 1.63930.5464.0330.106
Total 86.44516
Effect O E F (%),
Model b Coefficients
Standard ErrorSum of SquaresdfMean SquareF-Valuep-Value
Intercept51.2870.604492.802954.75630.0590.000
V D −1.2380.47712.254112.25415.4730.017
V D 20.2910.6580.35710.3570.4510.539
T P R 7.3180.477428.4471428.447540.9710.000
T P R 2−1.7650.65813.116113.11616.5610.015
H T M 1.5690.47719.704119.70424.8780.008
H T M 2−1.7880.65813.454113.45416.9880.015
V D   * T P R −0.5270.6751.11011.1101.4010.302
V D * H T M −0.8390.6752.81712.8173.5570.132
T P R * H T M −0.3100.6750.38610.3860.4870.524
Residual 12.75171.822
Lack of fit 9.58333.1944.0330.106
Total 505.55316
Effect O E F (%),
Model b Coefficients
Standard ErrorSum of SquaresdfMean SquareF-Valuep-Value
Intercept2.0910.0186.79290.755479.3320.000
V D 0.9150.0146.69816.6982895.7200.000
V D 20.0550.0190.01310.0135.5570.078
T P R 0.0740.0140.04310.04318.6850.012
T P R 2−0.0110.0190.00110.0010.2300.656
H T M 0.0560.0140.02510.02510.7500.031
H T M 2−0.0030.0190.00010.0000.0140.912
V D * T P R 0.0450.0200.00810.0083.4250.138
V D * H T M 0.0120.0200.00110.0010.2490.644
T P R * H T M 0.0330.0200.00410.0041.8270.248
Residual 0.01170.002
Lack of fit 0.00230.0010.2550.855
Total 6.80316
V D : Vessel diameter (mm);   T P R : temperature (°C); H T M : heating time (min); O Y : oil yield (%); O E F : oil extraction efficiency (%); E N : deformation energy (kJ); p-values < 0.05 indicate significance; p-values > 0.05 denote indicate non-significance. a, b and c represent the coefficient of determination (R2) of the models with the values of 0.975, 0.975, and 0.998.
Table 5. Optimum, predicted and validated values and their coefficient of variation and percentage error.
Responses* Optimum
Values
Predicted
Values
Validated
Values
Coefficient of Variation (%)Percentage
Error (%)
O Y (%)24.6024.1624.18 ± 0.230.930.08
O E F (%)59.4958.4258.47 ± 0.550.940.09
E N (kJ)3.273.193.22 ± 0.072.300.81
O Y : Oil yield (%); O E F : oil extraction efficiency (%); E N : deformation energy (kJ); * Obtained from Figure 4a–c, which is circled.
Table 6. Data of the relaxation process of bulk rapeseed oil extraction with optimal compression factor combinations.
Compression Factor Combinations M F (kN) O Y (%) O E F (%)
* V D = 60 ( 1 ) ;   T P R = 80 ( + 1 ) ;   H T M = 60 (+1)18024.79 ± 0.83 **59.95 ± 2.01 **
24.26 ± 0.74 ***58.67 ± 1.79 ***
Difference0.531.28
* V D = 60 ( 1 ) ;   T P R = 80 ( + 1 ) ;   H T M = 75 (+0.5)18024.60 ± 0.61 **59.48 ± 1.46 **
24.18 ± 0.23 ***58.47 ± 0.55 ***
Difference0.421.01
* V D = 100 ( + 1 ) ;   T P R = 80 ( + 1 ) ;   H T M = 60 (0)45024.79 ± 0.22 **59.94 ± 0.54 **
23.27 ± 0.03 ***56.28 ± 0.08 ***
Difference1.513.66
* V D = 100 ( + 1 ) ;   T P R = 80 ( + 1 ) ;   H T M = 90 (+1)45025.02 ± 0.30 **60.49 ± 0.72 **
22.97 ± 0.52 ***55.55 ± 1.26 ***
Difference2.044.94
* V D = 80 ( 0 ) ;   T P R = 80 ( + 1 ) ;   H T M = 90 (+1)30025.28 ± 0.86 **61.13 ± 2.07 **
22.90 ± 0.21 ***55.38 ± 0.51 ***
Difference2.385.75
* At an initial bulk seed pressing height, H = 100 mm (weight, ( V D = 60 ) = 190.33 g); (weight, ( V D = 80 ) = 338.80 g); (weight, ( V D = 100 ) = 524.54 g) and speed 4 mm/min; ** relaxation process; *** compression process;   V D : vessel diameter; M F : maximum force;   O Y : oil yield; O E F : oil extraction efficiency.
Table 7. Mean and standard deviation of peroxide value, acid value, and free fatty acid of rapeseed oil under pretreatment temperatures and heating times.
RunVessel Diameter
V D (mm)
Temperature
T P R (°C)
Heating Time
H T M (min)
NPeroxide Value
(meq O2/kg Oil)
Acid Value
(mg KOH/g Oil)
Free Fatty Acid
(mg KOH/g Oil)
980403025.00 ± 0.001.46 ± 0.000.73 ± 0.00
1606024.37 ± 0.751.85 ± 0.080.93 ± 0.04
11809025.92 ± 0.020.98 ± 0.020.49 ± 0.01
Total65.10 ± 0.771.43 ± 0.390.72 ± 0.20
6100603024.39 ± 0.871.47 ± 0.210.74 ± 0.10
13806026.37 ± 0.691.68 ± 0.160.85 ± 0.08
81009027.80 ± 0.041.09 ± 0.010.55 ± 0.01
Total66.19 ± 1.611.42 ± 0.290.71 ± 0.15
1080803024.45 ± 0.641.40 ± 0.080.71 ± 0.04
3606025.50 ± 0.711.21 ± 0.040.61 ± 0.02
12809027.18 ± 0.401.85 ± 0.020.93 ± 0.01
Total65.71 ± 1.321.49 ± 0.300.75 ± 0.15
N: Number of sample repetitions.
Table 8. Shapiro–Wilk test of normality of peroxide value, acid value, and free fatty acid of rapeseed oil under sample temperatures and heating times.
Dependent VariablesTemperature
T P R (°C)
Shapiro–Wilk’s Test
p-Value
R2Heating Time
H T M (min)
Shapiro–Wilk’s Test
p-Value
R2
Peroxide value
(meq O2/kg)
400.2940.885300.0100.720
600.5670.928600.9180.974
800.7830.955900.1460.846
Acid value
(mg KOH/g oil)
400.3480.895300.2890.884
600.4750.916600.2180.868
800.2130.867900.0160.740
Free fatty acid
(mg KOH/g oil)
400.3520.896300.2840.883
600.4760.916600.2200.868
800.2110.866900.0160.740
p-values > 0.05 denote the normal distribution of the data; p-values < 0.05 denote the data are not normally distributed; R2 is the coefficient of determination of the p-value or the normality test outcome.
Table 9. ANOVA tests of between-subject effects on the dependent variables (PV, AV, and FFA) of rapeseed oil.
SourceDependent VariablesType III Sum of SquaresdfMean SquareF-Valuep-Value
Corrected ModelPV25.319 a83.1659.9730.001
AV1.563 b80.19521.2260.000
FFA0.395 c80.04921.4200.000
InterceptPV577.6031577.6031820.1700.000
AV37.544137.5444078.4070.000
FFA9.48419.4844114.7350.000
T P R (°C)PV3.57421.7875.6310.026
AV0.01620.0080.8750.450
FFA0.00420.0020.8780.448
H T M (min)PV17.17428.58727.0590.000
AV0.22220.11112.0410.003
FFA0.05620.02812.1550.003
T P R (°C) × H T M (min)PV4.57141.1433.6010.051
AV1.32540.33135.9950.000
FFA0.33540.08436.3230.000
ErrorPV2.85690.317
AV0.08390.009
FFA0.02190.002
TotalPV605.77818
AV39.19018
FFA9.90018
Corrected TotalPV28.17517
AV1.64617
FFA0.41617
T P R : Temperature (°C); H T M : heating time (min); PV: peroxide value (meq O2/kg oil); AV: acid value (mg KOH/g oil); FFA (free fatty acid (mg KOH/g oil); df: degree of freedom; p-values < 0.05 indicate significance; p-values > 0.05 denote non-significant values; a R2 = 0.899, b R2 = 0.950, and c R2 = 0.950.
Table 10. ANOVA tests of between-subject effects on the spectral profiles (absorbance and transmittance) of rapeseed oil.
SourceSpectral PropertiesType III Sum of SquaresdfMean SquareF-Valuep-Value
Corrected ModelA (-)1334.572 a5032.6531992.9640.000
T (%)327,581.293 b503651.255365.4910.000
InterceptA (-)4159.61414159.6143,124,484.0730.000
T (%)197,659.4671197,659.467110,928.4140.000
W L (nm)A (-)1277.0465523.21917,440.9160.000
T (%)292,616.722555320.3042985.8060.000
T P R (°C)A (-)0.63720.318239.0980.000
T (%)9050.94824525.4742539.7400.000
H T M (min)A (-)7.00423.5022630.5670.000
T (%)1573.4222786.711441.5100.000
W L (nm) × H T M (°C)A (-)16.6131100.151113.4430.000
T (%)15,884.456110144.40481.0410.000
W L (nm) × H T M (min)A (-)13.6451100.12493.1750.000
T (%)2136.40011019.42210.9000.000
T P R (°C) × H T M (min)A (-)4.79741.199900.7230.000
T (%)2386.3954596.599334.8170.000
W L (nm) × T P R (°C) × H T M (min)A (-)14.8312200.06750.6370.000
T (%)3932.94922017.87710.0330.000
ErrorA (-)1.34210080.001
T (%)1796.12010081.782
TotalA (-)5495.5281512
T (%)527,036.8801512
Corrected TotalA (-)1335.9141511
T (%)329,377.4131511
a R2 = 0.999; b R2 = 0.995; W L : wavelength (nm);   T P R : temperature (°C); H T M : heating time (min); A: absorbance (-); T: transmittance (%); p-values < 0.05 indicate significant.
Publisher’s Note: MDPI stays neutral with regard to jurisdictional claims in published maps and institutional affiliations.

