
Bioreactor Rhamnolipid Production Using Palm Oil Agricultural Refinery By-Products


1
Department of Biological and Agricultural Engineering, Faculty of Engineering, Universiti Putra Malaysia, Serdang 43400, Selangor, Malaysia
2
Institute of Plantation Studies (IKP), Universiti Putra Malaysia, Serdang 43400, Selangor, Malaysia
3
Smart Farming Technology Research Centre (SFTRC), Department of Biological and Agricultural Engineering, Faculty of Engineering, Universiti Putra Malaysia, Serdang 43400, Selangor, Malaysia
4
Department of Chemical Engineering and Analytical Science, The University of Manchester, Manchester M1 3AL, UK
5
School of Biomedical Sciences, Faculty of Life and Health Sciences, Ulster University, Coleraine BT52 1SA, UK
*
Author to whom correspondence should be addressed.
Processes 2021, 9(11), 2037; https://0-doi-org.brum.beds.ac.uk/10.3390/pr9112037
Submission received: 10 September 2021
/
Revised: 8 October 2021
/
Accepted: 12 October 2021
/
Published: 14 November 2021
(This article belongs to the Topic Bioreactors: Control, Optimization and Applications)
Abstract
:Simple Summary
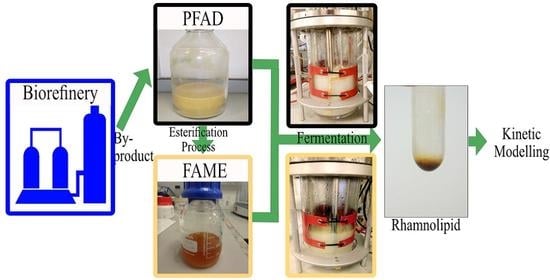
This study shows one of the palm oil refinery by-products which is palm fatty acid distillate (PFAD) has potential to be valorized into new bioproduct known as rhamnolipid biosurfactant via fermentation process. Rhamnolipid proven can be used in various applications such as the food and agricultural industries, biomedical industry, petroleum industry, bioremediation of toxic chemicals, and microbial enhanced oil recovery. This is the first step in converting the low-value by-product into high value biosurfactant product by integrating the palm oil refinery mills into biorefinery for biosurfactant production.
Abstract
Palm fatty acid distillate (PFAD) and fatty acid methyl ester (FAME) are used by P. aeruginosa PAO1 to produce rhamnolipid biosurfactant. The process of fermentation producing of biosurfactant was structured in a 2 L bioreactor using 2% of PFAD and FAME as carbon sources in minimal medium and with a nitrogen concentration of 1 g L−1. Mass spectrometry results show the crude biosurfactant produced was predominantly monorhamnolipid (Rha-C10-C10) and dirhamnolipid (Rha-Rha-C10-C10) at 503 and 649 m/z value for both substrates. Maximum production of crude rhamnolipid for PFAD was 1.06 g L−1 whereas for FAME it was 2.1 g L−1, with a reduction in surface tension of Tris-HCl pH 8.0 solution to 28 mN m−1 and a critical micelle concentration (CMC) of 26 mg L−1 measured for both products. Furthermore, the 24 h emulsification indexes in kerosene, hexadecane, sunflower oil, and rapeseed oil using 1 g L−1 of crude rhamnolipid were in the range 20–50%. Consequently, PFAD and FAME, by-products from the agricultural refining of palm oil, may result in a product that has a higher added-value, rhamnolipid biosurfactant, in the process of integrated biorefinery.
1. Introduction
Sustainable use of waste biomass by-products in a variety of marketable products and resources via biorefining processes is key to our transition to a low carbon economy. This requires the latest technology for the sustainable biomass transformation into a product that has a high value, for instance, biofuels, chemicals, energy, and materials [1]. The technology of biorefinery was developed in the palm oil milling and refining industry with the production of bioelectricity, biogas, biofuels, and by-product chemicals, for example, empty fruit bunch (EFB), palm kernel oil (PKO), palm kernel cake (PKC), palm kernel shell (PKS), press palm fibre (PPF), and palm fatty acid distillate (PFAD) becoming common [2].
In Malaysia, the industry of palm oil has become a significant element of the National Key Economic Area (NKEA) plan and is anticipated to expand substantially over the next decade. It actively contributes to new market chances for growth of existing downstream palm oil activities, upstream development, and production of biodiesel, which is expected to be valued at RM57.6 billion by the end of 2020 [3]. Malaysia has become the second-largest producer of palm oil globally, accounting for 29% of world production and 37% of global exports [4]. The production of crude palm oil (CPO) has amounted to 8.7 million tonnes in January–June 2017 [5], which is a 15% rise compared to 2016. There are three refining steps for the production of edible CPO: degumming eliminates that gum, bleaching diminishes the colour, and deodorising removes volatile compounds from the CPO. After the refining processes are complete, a low-value by-product called palm fatty acid distillate (PFAD) is produced. PFAD contains fats that are undesirable in the food industry and need to be removed during the palm oil refining process, to ensure the palm oil meets food industry quality standards. The primary components of PFAD are trydecylic acid, stearic acid, palmitic acid, pentadecanoic acid, oleic acid and squalene [6]. Physically, PFAD has a light brown colour in a solid-state at room temperature and transforms into a dark brown liquid when it is heated above its melting point at about 40 °C [7]. In this current research, the primary application of PFAD was its conversion into fatty acid methyl ester (FAME) (biodiesel), whilst traditionally PFAD is utilised as soap, animal feed and, more generally, for the oleochemicals production, having the advantage of being a low-cost renewable substrate [8,9].
Microbial-produced biosurfactants has grown over the last decade. Biosurfactants are produced by microorganisms with a diverse group of surface-active compounds, consisting of hydrophilic and hydrophobic parts, giving biosurfactants their amphiphilic character [10]. Biosurfactants have biologically produced molecules and are less toxic to the environment, biodegradable, and potentially sustainable. Compared to conventional synthetic surfactants, biosurfactants can be generated from renewable substrates [11]. It is also well known that biosurfactants significantly reduce surface tension, and have low critical micelle concentration, high thermostability, high resistance in extreme pH, and strength of the ionic bond [12]. The advantages of biosurfactants mean they have been extensively tested for use in numerous applications such as the food and agricultural industries, biomedical industry, petroleum industry, bioremediation of toxic chemicals, and microbial enhanced oil recovery [13,14,15,16,17,18]. Although there are various potential applications, there are still significant challenges associated with large-scale biosurfactant production, such as high production cost, low market penetration, low production yield, and complex and difficult downstream separation [19].
Kinetic modelling of bioprocesses can give vital insight into the behaviour of the system, characterised by the specific growth rate, metabolism, and biochemical production as a function of measurable physiochemical parameters [20]. Kinetic modelling enables biochemical engineers to design, control, and optimise the microbial process and thus makes it possible to evaluate the behaviour of a bioprocess significantly faster than laboratory experiments [21].
In this present study, batch fermentations for production of rhamnolipid biosurfactant was conducted in a 2 L bioreactor. Cell growth, rhamnolipid production, identification, and characterisation of crude rhamnolipid extract were studied and compared based on using cheap and renewable PFAD or FAME as the sole carbon source containing high free fatty acids [6,22]. This also gives an alternative valorisation route for PFAD and FAME into other added-value products that have future market potential. Furthermore, kinetic modelling was carried out in order to model the P. aeruginosa PAO1 profile of cell growth, substrate consumption, and the production of rhamnolipid. This modelling provides useful information towards understanding the bioprocess involved and aids a further step concerning sustainable rhamnolipid biosurfactant production, through integration with palm oil refining processes, moving towards zero waste and the potential for the creation of greener, environmentally friendly methods for biochemicals production.
2. Modelling of Reaction Kinetics
The reaction kinetics of the rhamnolipid producing system was characterised in terms of the rate of specific growth (µ, h−1), biosurfactant yield per PFAD/FAME substrate consumed (YP/S, g g−1), biosurfactant yield per biomass (YP/X, g g−1), and the volumetric productivity (PV, g L−1 h−1). The biomass production rate is given by [23]:
where is the biomass of dry cell weight at time , and is the rate of specific growth. The calculation for the increase in the concentration of biomass per unit time was expressed as:
The equation above is the integration with condition at :
The rate of specific growth was determined by plotting versus time. Doubling time shows the time taken for the microorganism to expand double the initial rate. The following equation indicates the calculation for production of rhamnolipid (P):
The substrate consumption can be calculated from the following equation:
where is a biomass of cell, is substrate consumption for PFAD and FAME, and is the rhamnolipid production at time during the fermentation process . The variable is the biomass yield with respect to substrate utilization, , is the production of yield rhamnolipid with respect to biomass , and is the yield of rhamnolipid produced on biomass . The initial time of the modelling is represented by subscript 0. Yield coefficients related to cell growth and PFAD/FAME utilisation were calculated by combining Equations (4) and (5).
The experimental data were described using two types of models, the Monod model and the logistic model. The specific rate of growth of the microorganism for the Monod model is expressed as:
where is the maximum rate of growth and is constant of substrate saturation . Equations (4), (5), and (8) were combined to produce Equations (9)–(11). Substitute Equation (2) into Equation (8) for growth rate as follows:
Substitute Equation (4) into Equation (9) for rhamnolipid production:
Substitute Equation (5) into Equation (9) for rhamnolipid production:
The logistic model for the biomass production, rhamnolipid, and utilisation of substrate was given by [24]:
where and were the maximum biomass and rhamnolipid production , and is the rhamnolipid formation rate calculated from the ratio of the initial volumetric rate of the product formation and .
The volumetric productivity of the rhamnolipid and the cell was calculated. Equations (12) and (14) were solved as below:
Equations (9)–(11) were solved using function ode45 solver available in MATLAB 2017a and Equations (17)–(19) were solved using Microsoft Excel. The parameter of for the Monod model and for the logistic model were determined from the obtained experimental results.
3. Materials and Methods
3.1. Experiment
In this experiment, the culture medium was used during the initial growth phase, and minimal medium with the addition of trace elements was used as the production medium. The culture medium used was a protease peptone glucose ammonium salt (PPGAS) medium that contained 1% glucose,10 g L−1 peptone, 1.5 g L−1 KCl, 0.5 g L−1 MgSO4·7H2O, 19 g L−1 Tris-HCl, and1 g L−1 NH4Cl [25]. The minimal medium (MM) utilised for production comprised 1.0 g L−1 KCl, 0.5 g L−1 MgSO4·7H2O, 0.3 g L−1 K2HPO4, and 1.0 g L−1 NaNO3. The discovery components were 2 g L−1 C6H5Na3O7·2H2O, 0.28 g L−1 FeCl3·6H2O, 1.4 g L−1 ZnSO4·7H2O, 1.2 g L−1 CoCl2·6H2O, 1.2 g L−1 CuSO4·5H2O, and 0.8 g L−1 MnSO4·H2O. In a −4 °C refrigerator, P. aeruginosa PAO1 was sustained on plates of nutrient agar. Inocula were prepared by transferring one loop of new culture into a 1 L Erlenmeyer flask containing 200 mL of PPGAS media. After 24 h, 150 mL of culture was centrifuged for 20 min and the cells were transferred into the bioreactor. A volume of 1.5 L of minimal medium and 1 mL L−1 of trace elements in stirred tank bioreactor (nominal capacity 2 L) with 15 mL of PFAD or FAME was used for all cultivation experiments (FerMac 320 Bioreactor, Electrolab Biotech, Gloucestershire, UK) for 72 h. The speed of the stirrer was set to 150 rpm, at 37 °C, adjusting the gas flow rate (0.1–3.3 vvm) to maintain the dissolved oxygen at 5%, the pH was set at 6.50 and controlled by the addition of 1 M NaOH and 1 M H2SO4 [26]. Online parameters were recorded using Fermentation Management software (Electrolab Biotech, Gloucestershire, UK). All experiments were done in duplicate.
3.2. Measurement of Growth
The cell growth was computed by calculating optical density (OD) and changed into dry cell weight (DCW) applying a linear correlation , with for the substrate of fatty acid. PFAD and FAME were separated from the specimen by mixing n-hexane (0.5 mL) with fermentation broth (1 mL) and then by using a Minispin centrifuge (Eppendorf) at 13,000× g for 5 min. Next, cell biomass was diluted into 1 mL of 0.7% sodium chloride solution (physiological saline), and the OD was measured using UVmini-1240 spectrophotometer (Shimadzu, UK).
3.3. Extraction of Rhamnolipid
Rhamnolipids are being taken from the sample of 10 mL fermentation broth and centrifuged at 10,000× g at 27 °C for 10 min. The supernatant was then taken and acidified at pH 3 with 1 M of hydrochloric acid. The acidified supernatant with the same amount of ethyl acetate was vigorously shaken, and this step was done in a triplicate. Next, 0.5 g of magnesium sulphate per 100 mL was used to extract any water found in the RL-containing ethyl acetate layer. Finally, the samples were filtered, and a rotary evaporator was used to evaporate the solvent to get an extract of crude rhamnolipid biosurfactant. The RL was measured gravimetrically.
3.4. Identification of Biosurfactant
Biosurfactant identification was performed using mass spectrometry-electrospray ionization (MS-ESI) (Agilent, Cheshire, UK). The use of an Agilent 6510 Q-TOF LC/MS fitted with Agilent 1200 liquid chromatography (LC) (Agilent, Cheshire, UK). A volume of 5 uL of raw rhamnolipids was extracted, diluted in methanol and 50% CAN, and injected with 0.1% formic acid as an eluent with the negative mode of an electrospray (ESI) (Agilent, Cheshire, UK).
3.5. Characterization of Biosurfactant
A Krüss K11 Tensiometer (Krüss Scientific, Bristol, UK) fitted with a De Nöuy ring was utilised in determining the surface tension at equilibrium and critical micelle concentration. A 0.1 M Tris-HCl pH 8.0 solution was diluted in a 1000 mg L−1 solution of crude rhamnolipid extract, and the equilibrium surface tension was measured. The emulsification index was determined after 24 h as the percent of the emulsified layer height compared to the entire liquid height. The initial concentration of 1000 mg L−1 of 4 mL of dissolved crude rhamnolipids solution in 0.1 M Tris-HCl pH 8.0 was poured into 4 mL of sunflower oil, rapeseed oil, hexadecane, and kerosene. The solution was then mixed by a vortex mixer for 1 min, and the maximum emulsification was obtained. All the measurements were conducted twice.
4. Results
4.1. Bioreactor Production of Biosurfactant by P. aeruginosa PAO1 Using PFAD and FAME as Carbon Sources
The fermentation process of rhamnolipid production was conducted using PFAD and FAME as the primary carbon substrates in 2 L bioreactor experiments to determine and compare the production of rhamnolipids and the kinetics of fermentation, and to develop a model using both Monod and logistic modelling. The colourless minimal medium showed a significant colour change, becoming green at the end of the experiment. The green colour of the culture medium was caused by the co-production of pyocyanin pigment, which has a positive relation to the development of this strain [27,28]. At the end of the bioreactor fermentations, it was observed that foam accumulated in the bioreactor headspace because of the presence of surface-active rhamnolipid biosurfactant in the bioreactor, along with aeration and agitation [29]. Excessive foam production carried the culture media, nutrients, and substrate into an overflow bottle, which was observed by the decreasing total volume of fermentation broth at the end of the fermentation period. Other researchers have also reported the production of foam during the fermentation process for the production of rhamnolipids, for instance [30,31] and [32]. It was observed that the PFAD was transported with the foam, as well as sticking on the wall of the bioreactor. This, therefore, will affect the amount of carbon source available in the fermentation broth.
PFAD and FAME were used individually in turn as sole carbon substrates to produce biosurfactant by P. aeruginosa PAO1 in a bioreactor. Figure 1a demonstrates the use of PFAD to produce rhamnolipids. It showed a significant increase in growth at 0 to 60 h to a maximum dry cell weight (DCWmax) of 2.9 g L−1 in minimal medium with PFAD as the sole carbon source. As growth increased throughout the fermentation process, the strain consumed a significant amount of nitrogen and oxygen, with the nitrogen level dropping from 1000 to 70 mg L−1 in 32 h, whereas the dissolved oxygen level dropped rapidly in only 8 h of fermentation. Rhamnolipid production slowly increased from 0 to 32 h and reached maximum production (RLmax) of 1.1 g L−1 after 60 h. The total formation of biomass related to the initial substrate fed (*YX/S), product yield related to biomass (YP/X), and the volumetric productivity (PRL) was 0.15 g g−1, 0.36 g g−1, and 0.02 g L−1 h−1.
Figure 1b shows the cell growth and the production of rhamnolipid using FAME as the sole carbon source. By using FAME as the carbon source, P. aeruginosa PAO1 was able to grow in a minimal medium [22]. The dry cell weight increased rapidly from 0 to 32 h, reaching DCWmax of 2.8 g L−1, and then stabilised and decreased slightly until the end of fermentation. At the same time, the total nitrogen decreased from 1000 to 80 mg L−1 throughout the 24 h. Furthermore, the same pattern was displayed for the dissolved oxygen, which again dropped rapidly, as observed in the previous experiment. At the end of fermentation, the RLmax steadily increased to a maximum of 2.1 g L−1. The * YX/S, YP/X, and PRL were 0.11 g g−1, 1.01 g g−1, and 0.03 g L−1 h−1. Nitrogen is one of important factors for rhamnolipid production via the fermentation process. Theoretically, rhamnolipids, a group of secondary metabolites produced by P. aeruginosa, were mainly synthesized when P. aeruginosa reached a steady state as a consequence of exhaustion of the nitrogen source [33]. Research by [34] showed that a high concentration of nitrogen can be beneficial for high performance production of rhamnolipids. This trends parallels with Figure 1a,b for this study, in which nitrogen sources were depleted and at the same time rhamnolipid production increased.
Table 1 shows FAME to be the better substrate compared to PFAD in terms of dry cell weight, rhamnolipid production, YP/X, and PRL. This result was different from a previous study that demonstrated rhamnolipid produced by PFAD was higher than FAME with better rhamnolipid production of around 3 g L−1 [22]. In the previous study, rhamnolipids were produced in shake flask experiments, compared to the bioreactor system used here, which is significantly different in terms of the type of fermentation system, aeration, and agitation type and speed. These differences affected the microbial behaviour, mass transfer, and oxygen transfer that may explain the differences in rhamnolipid production observed in this experiment [22].
The production of rhamnolipid is, however, comparable with other findings. Table 1 shows that the highest rhamnolipid production was reported by [30] of 25.5 g L−1 of rhamnolipid using P. aeruginosa MR01 and soybean oil soapstock as a substrate. This is followed by 5.12 g L−1 of rhamnolipid produced from olive oil mill wastewater by P. aeruginosa #112 reported by [35]. In this study, 2.11 and 1.07 g L−1 rhamnolipid concentrations were obtained from FAME and PFAD using P. aeruginosa PAO1. Two other research teams ([36,37]) reported 1.30 and 0.71 g L−1 of rhamnolipid production, respectively, when using the waste of Catla catla fish and coconut oil sludge as carbon sources. The variation in the results is due to the different fermentation conditions, strain type and substrate used, thus giving additional rhamnolipid production and yield.

Table 1.
Result of biomass produced at maximum (DCWmax), rhamnolipid produced at maximum (RLmax), biomass formed linked to an initial substrate (* YX/S, g g−1), yield of product linked to an initial substrate (* YP/S, g g−1), and volumetric productivity (PRL, g L−1 h−1) for this study compare with other studies.
| Bioreactor Volume (L) | Microorganism | Substrate | Concentration (g L−1) | Timemax (h) | DCWmax (g L−1) | RLmax (g L−1) | *YX/S (g g −1) | *YP/S (g g −1) | PRL (g L−1 h−1) | References |
|---|---|---|---|---|---|---|---|---|---|---|
| 2 | Pseudomonas aeruginosa PAO1 | PFAD | 20 | 60 | 2.99 | 1.07 | 0.15 | 0.05 | 0.02 | This study |
| FAME | 20 | 72 | 2.09 | 2.11 | 0.11 | 0.11 | 0.03 | |||
| 2 | Pseudomonas aeruginosa C2 | Waste of Catla catla fish | 20 | 72 | 0.20 | 1.30 | 0.01 | 0.065 | 0.02 | [36] |
| 3.1 | Pseudomonas aeruginosa AMB AS7 | Coconut oil sludge | 20 | 60 | 2.45 | 0.71 | 0.12 | 0.04 | 0.01 | [37] |
| 5 | Pseudomonas aeruginosa MR01 | Soybean oil Soapstock | 80 | 240 | 5.00 | 25.50 | 0.06 | 0.32 | 0.11 | [30] |
| 5 | Pseudomonas aeruginosa #112 | Olive oil mill wastewater | 250 | 168 | 5.00 | 5.12 | 0.02 | 0.02 | 0.03 | [35] |
*YP/S and *YX/S are utilising initial substrate fed, measured only for this analysis.
4.2. Biosurfactant Identification
The biosurfactant identification produced using mass spectroscopy revealed that the most abundant rhamnolipid produced were monorhamnolipid at 503 m z−1 and dirhamnolipid at 649 m z−1 (MS, negative mode) in fermentations using PFAD and FAME as carbon sources, as shown in Figure S1. In general, the results showed the presence of a relatively higher abundance of dirhamnolipid (L-rhamnopyranosyl-L-rhamnopyranosyl-3-hydroxydecanoyl-3-hydroxydecanoate) than monorhamnolipid (L-rhamnopyranosyl-3-hydroxydecanoyl-3-hydroxydecanoate).
The ratio of dirhamnolipid to monorhamnolipid varied, as shown in Table 2. Crude rhamnolipid produced from FAME had a higher ratio of 3.22:1 compared to crude rhamnolipid produced from PFAD, with a ratio of 3.18:1. Study [38] reported that the dirhamnolipid to monorhamnolipid ratio was 2:1. This difference in ratio, rhamnolipid composition, and predominance of a specific type of congener depends on different factors such as culture conditions, the age of the culture, type of carbon substrate, and the strain of P. aeruginosa employed in the fermentation [39].
4.3. Biosurfactant Characterization
From Figure 2 and Figure S2, and Table S1, it can be seen that the crude rhamnolipid reduced surface tension of the Tris-HCl solution from 70 to 28 mN m−1, and the critical micelle concentration (CMC) was around 62 mg L−1 for rhamnolipids produced with PFAD and FAME as the sole carbon sources. Surface tension values in the range from 24 to 29 mN m−1 and CMC values in a wide range from 13 to 56 mg L−1 have been previously reported for different rhamnolipid mixtures, produced from various carbon sources, using multiple strains and fermentation systems.
In Table 3, [35] found the lowest CMC value of 13 mN m−1, followed by 20 mN m−1 found by [32], whereas [40] reported a CMC of 56 mN m−1, and the highest CMC was found by this study. The emulsifying properties of 1000 mg L−1 crude rhamnolipid generated by P. aeruginosa PAO1 strain were examined with hexadecane, kerosene, sunflower oil, and rapeseed oil. Figure 3 shows the crude rhamnolipid produced from FAME emulsified vegetable oils and hydrocarbon more efficiently than that obtained from PFAD. Crude rhamnolipid produced from FAME could emulsify 48, 44, 46, and 38% of hexadecane, kerosene, rapeseed oil, and sunflower oil, respectively. The emulsification of the same vegetable oils and hydrocarbons by crude rhamnolipid produced by PFAD were 47, 40, 22, and 43%, respectively. The determination of medium composition, bacterial strain, and culture conditions that determine the composition and distribution of homolog molecules present in the final product will determine the surface tension properties of rhamnolipids [41]. Because the value of surface tension reduction and CMC were similar but the emulsion properties were different for rhamnolipids produced from PFAD or FAME, we suggest that the structure and composition of crude rhamnolipid produced from PFAD and FAME affects the surface tension, CMC, and the value of emulsification index.
4.4. Modelling of Bioreactor Fermentation
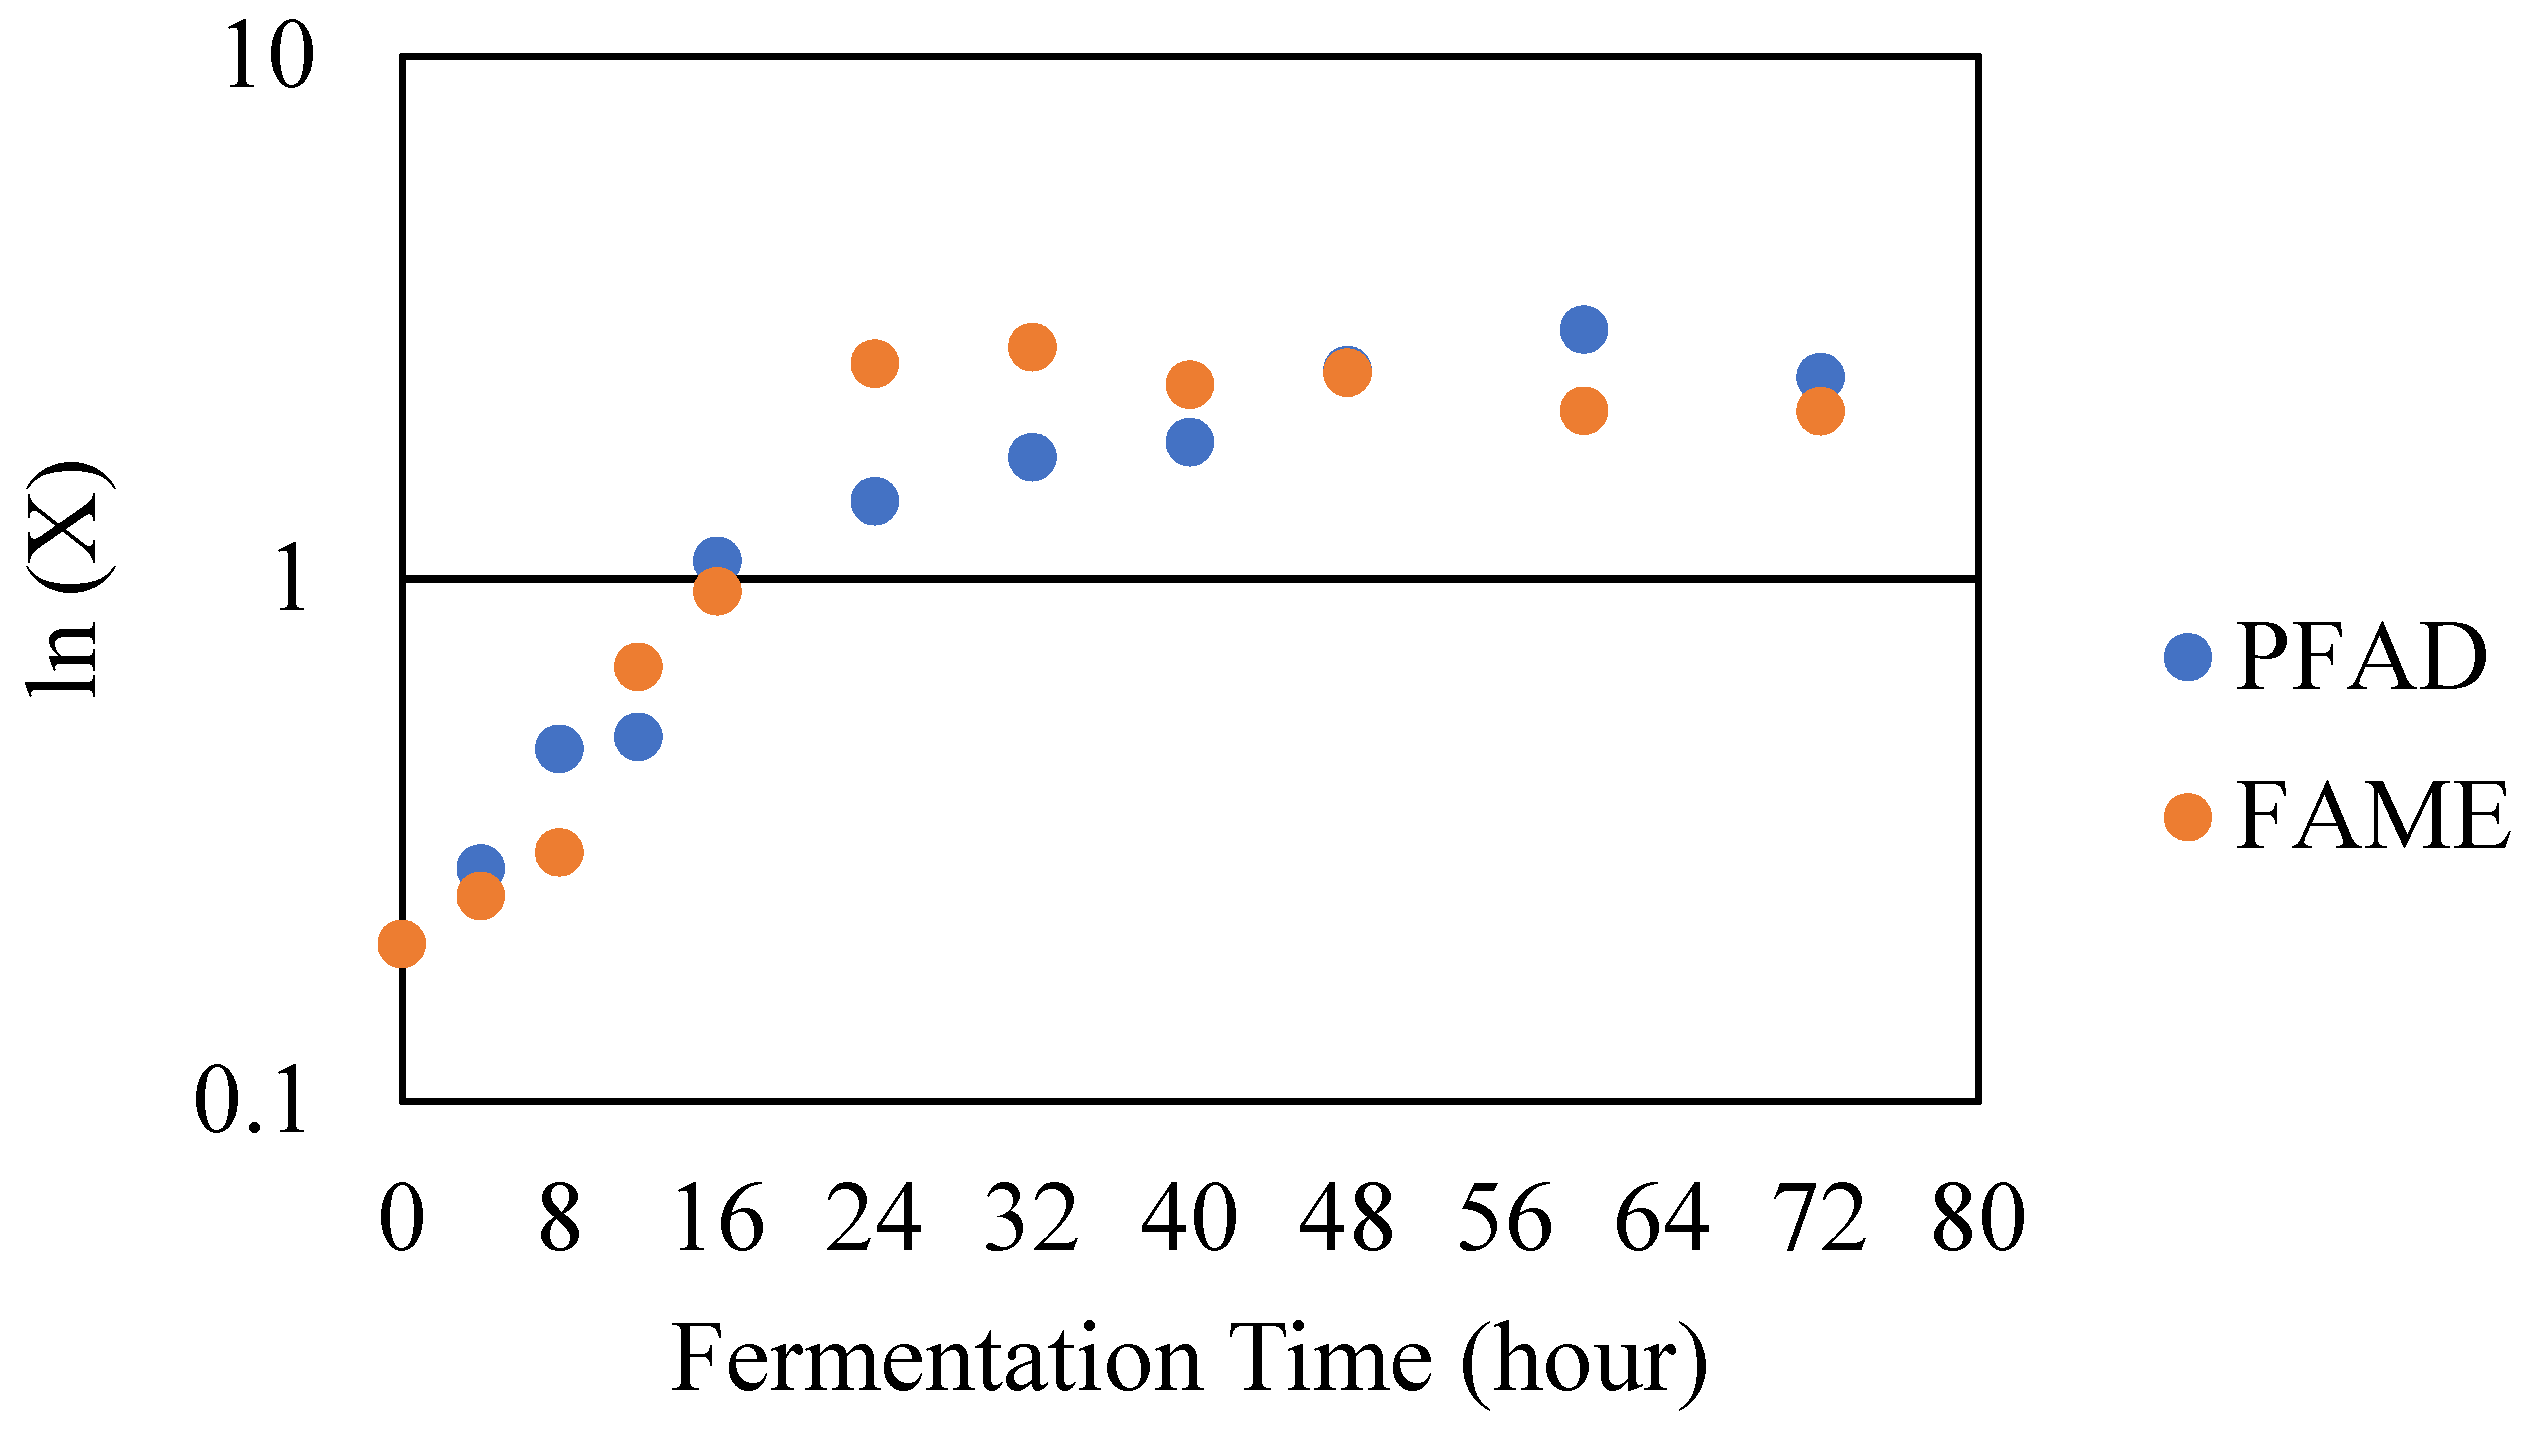
The fermentation kinetics and modelling of the cell growth, substrate utilisation, and rhamnolipid production were described mathematically to give an improved understanding of the fermentation process. In Figure 4, the growth kinetics of the growth of P. aeruginosa PAO1 with PFAD and FAME as sources of carbon are shown, which can be used to determine the rate of specific growth , doubling time , the linear relationship during exponential phase and the initial rate of rhamnolipid production during exponential phase, which were significantly crucial to for mathematical modelling. In Figure 4, it is shown that the exponential phase for PFAD as the sole carbon source take about 60 h, whereas for FAME a shorter time of about 24 h was observed.
Table 4 shows that the rate of growth of P. aeruginosa PAO1 with PFAD and FAME as substrates in the bioreactor was observed to be 0.05 and 0.11 . The doubling time of P. aeruginosa PAO1 using PFAD as a substrate was 13.86 which was higher compared to the FAME rate of 6.30 . Using FAME as a substrate, the specific growth rate was higher. Thus, it has a shorter doubling time compared to PFAD. The rhamnolipid productivity for PFAD and FAME were about the same, 0.02 . This suggests that FAME was a better substrate because it took less time to grow and produce rhamnolipid compared to PFAD. Study [42] reported that the values of specific growth rate when using n-Hexadecane and n-Eicosane as a substrate for P. aeruginosa CPCL were 0.056 and 0.034 , whereas [43] obtained a higher specific growth rate when using soybean oil as the sole source of carbon for P. aeruginosa MR01 of 0.2 . Study [42] also determined that the doubling time when using n-Eicosane was the highest, 20.38 , compared to n-Hexadecane at 12.37 , a value that is comparable with this study. The rhamnolipid productivity found by [42] was also much higher, with 0.48 and 0.28 when they used n-Eicosane and n-Hexadecane as sources of carbon. This suggests that the type of carbon source, type of strain, and fermentation condition play a significant role in the growth of the microorganism and biosurfactant production via a fermentation process.
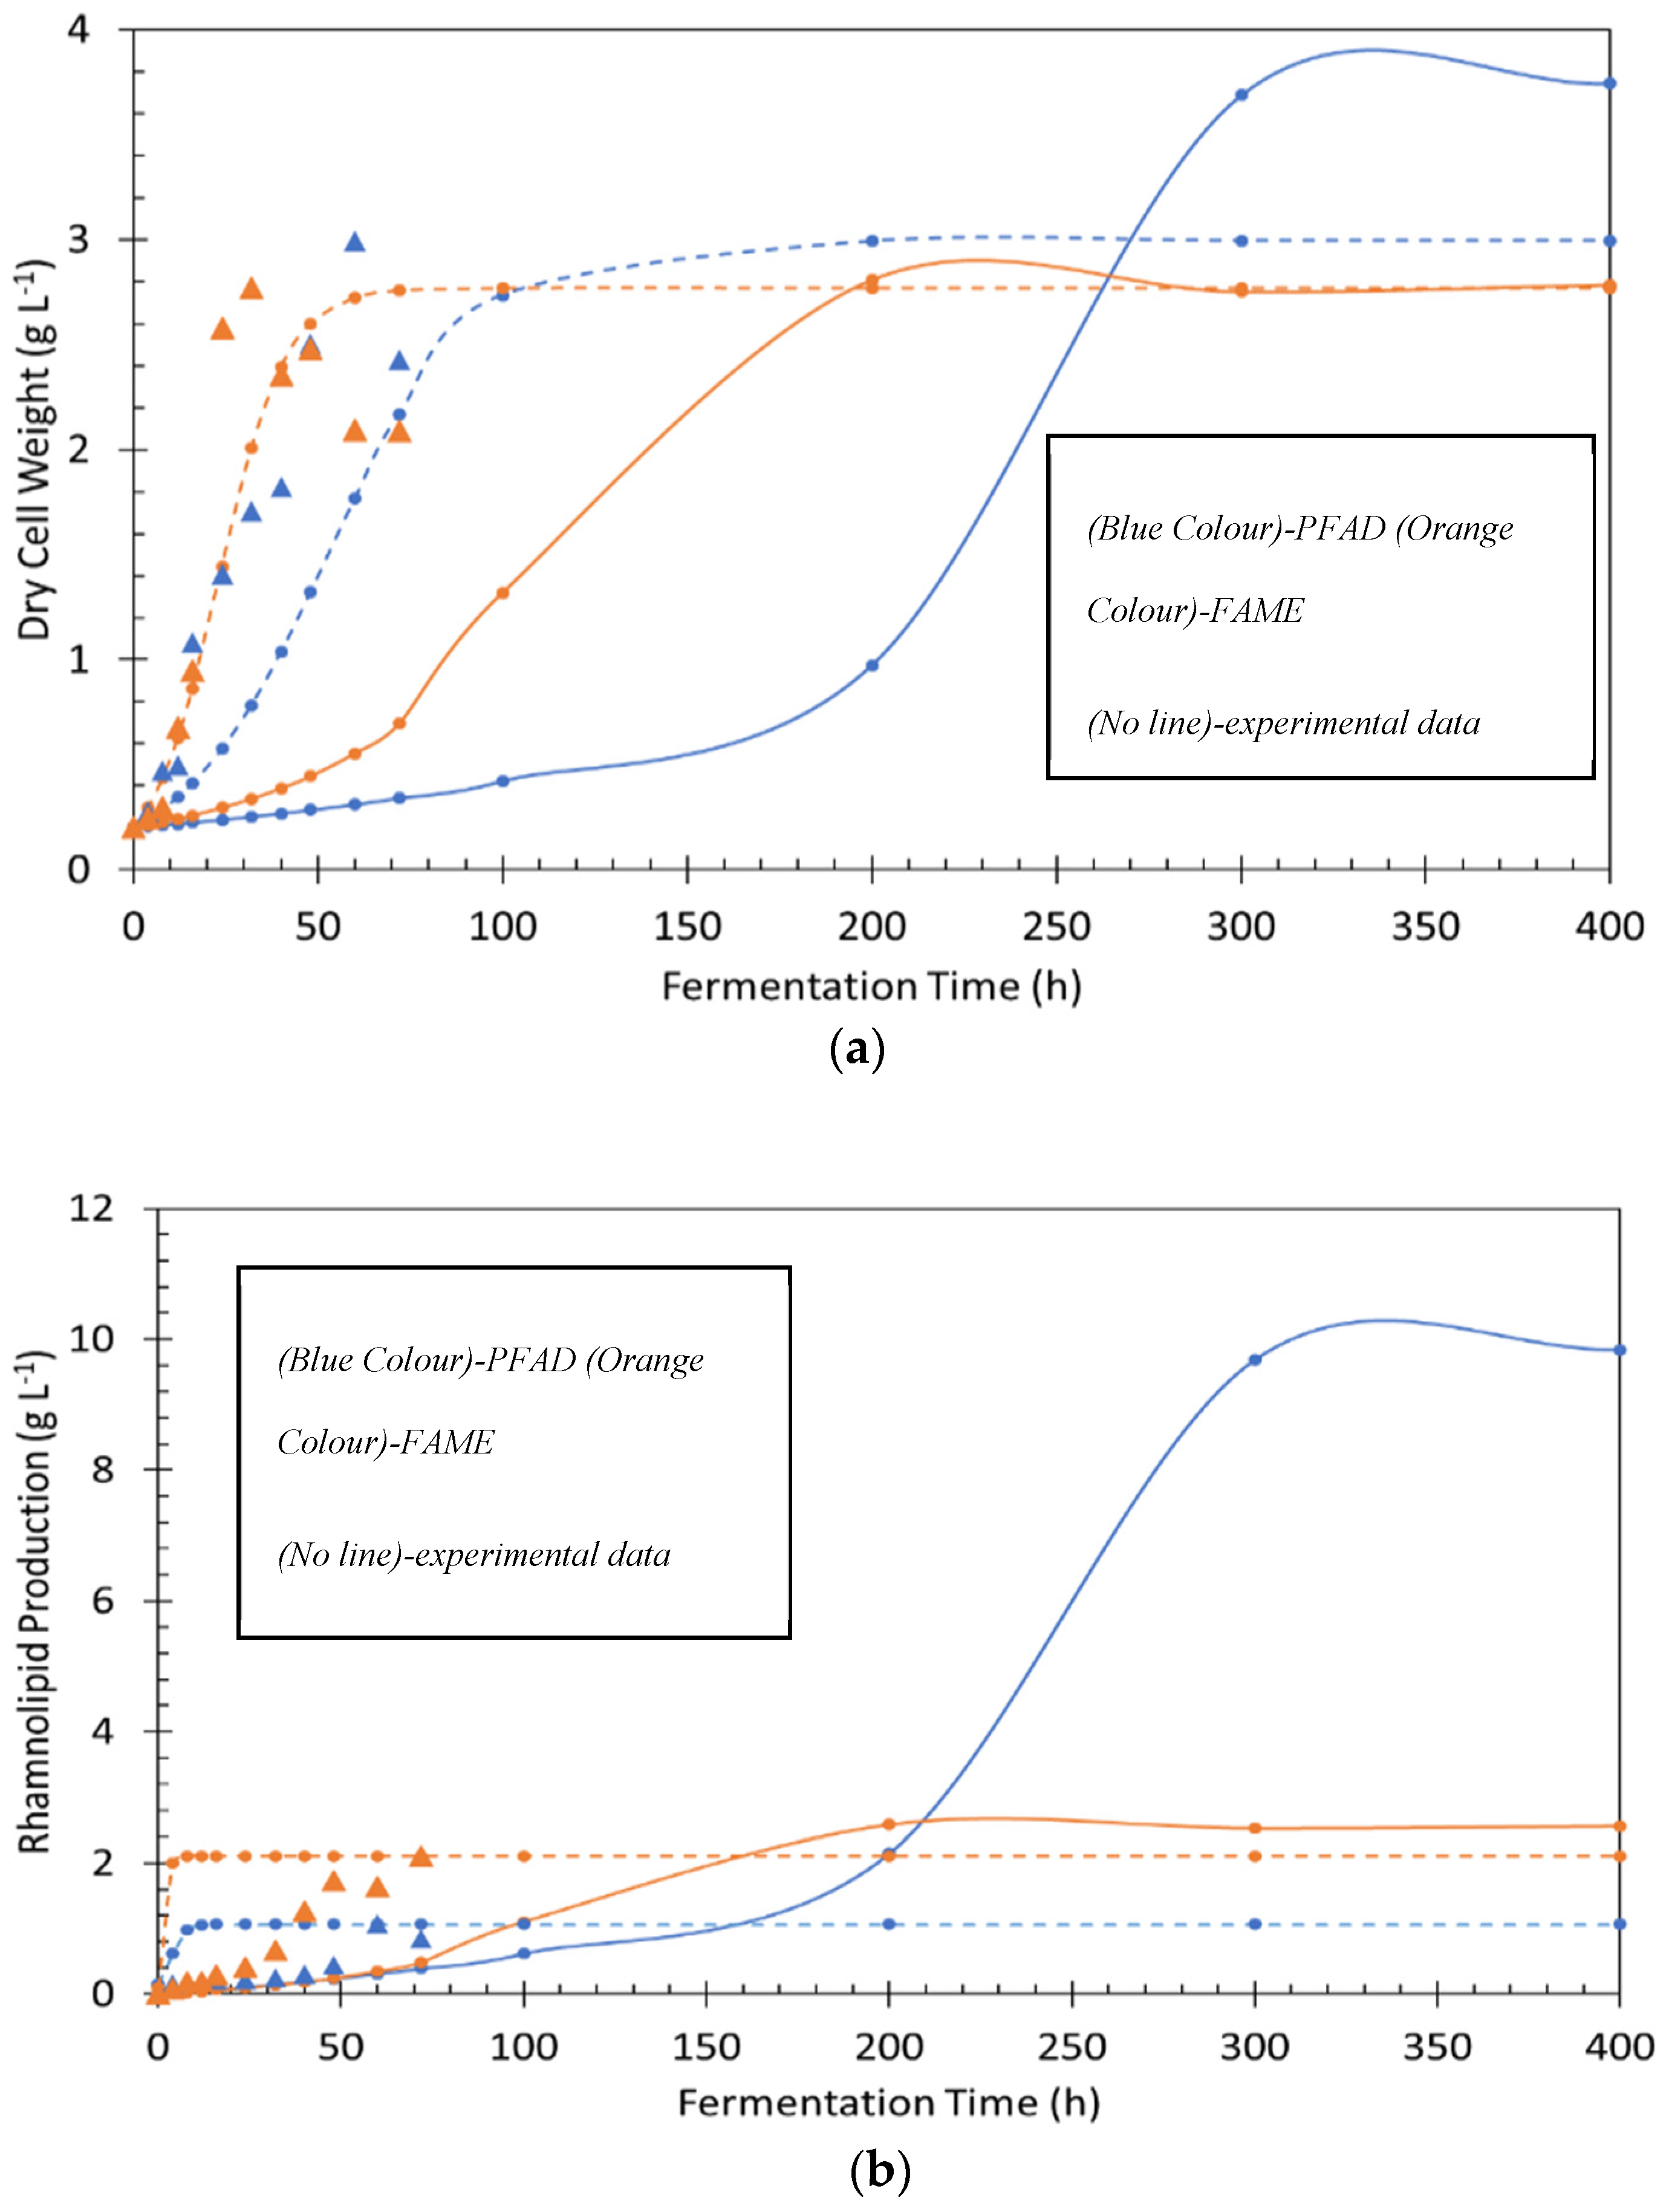
The experimental data were compared with Monod and logistic modelling, as shown in Figure 5. In this study, the actual data in the experiment were used to carry out mathematical modelling without changing any parameters to get the best fit. In Figure 5a the modelling comparison for dry cell weight shows the logistic model is a better fit compared to the Monod model. Figure 5b shows that neither the Monod nor the logistic model had a close fit with experimental data. The Monod model estimated that the maximum dry cell weight and rhamnolipid production were 4 and 10 if the fermentation time was extended until 300 h. The logistic model predicted that the dry cell weight and rhamnolipid production were almost the same as those observed in the actual experiment. The observed PFAD and FAME consumption were not determined because the physical characteristics of PFAD (a solid) and FAME (a liquid) oil made it difficult to measure accurately. Monod and logistic models were able to estimate the PFAD and FAME consumption over time, as shown in Figure 5c, by using saturation constant, from [42] when they using n-Hexadecane as a carbon source. Based on the obtained from other studies, the Monod model was used to estimate the substrate consumption for PFAD and FAME [40]. The Monod model shows that FAME was consumed entirely in 200 h, which is 100 h faster than PFAD for metabolism by the cell. It might be the physical characteristics of PFAD and FAME that affect the rate of consumption by the microorganisms. The estimation of substrate consumption from the Monod model was used in the logistic model. Substrate consumption from the logistic model estimated that PFAD and FAME were consumed entirely within 40 and 100 h, respectively.
5. Conclusions
PFAD and FAME are potential low-value and renewable substrates that can be scaled up for rhamnolipid production in bioreactors via a fermentation process. When PFAD and FAME were used for rhamnolipid production, final rhamnolipid concentrations of 1.07 and 2.11 g L−1 were achieved. The crude rhamnolipid produced had a suitable emulsion stabilising property and could reduce surface tension to 28 mN m−1 with a critical micelle concentration of 53 mg L−1 for both carbon sources. Fermentation in a bioreactor needs to be improved by extending the fermentation period, for which the Monod model predicts that the rhamnolipid production can increase to 10 g L−1. The development of kinetic models for rhamnolipid production is a useful tool for bioreactor design and upgrades in the future. This indicates the possibility of turning the low-value by-product into an expensive biosurfactant product by integrating the palm oil refinery mills into biorefinery for biosurfactant production.
Supplementary Materials
The following are available online at https://0-www-mdpi-com.brum.beds.ac.uk/article/10.3390/pr9112037/s1, Figure S1: Biosurfactant Identification using GC-MS. (a) PFAD and (b) FAME, Figure S2: Rhamnolipid critical micelle concentration from (a) PFAD and (b) FAME, Table S1: Critical micelle concentration determination using the intersection of two lines.
Author Contributions
J.W. supervised the study and had substantial inputs into the analysis and all drafts. M.N.R. conducted the study and created a first draft of the paper. I.B. co-supervised the study and had substantial inputs into the drafts of the paper. All authors have read and agreed to the published version of the manuscript.
Funding
This research was funded by Geran Putra-IPM, Universiti Putra Malaysia with grant number 9680100.
Institutional Review Board Statement
Not applicable.
Informed Consent Statement
Not applicable.
Data Availability Statement
Not applicable.
Acknowledgments
This study has been funded by Geran Putra-IPM, Universiti Putra Malaysia. The authors wish to thank The Cucurbit Company Sdn. Bhd. and Sime Darby Refinery-Jomalina for supplying the PFAD used in this study.
Conflicts of Interest
The authors declare no conflict of interest.
References
- Morais, A.; Bogel-Lukasik, R. Green chemistry and the biorefinery concept. Sustain. Chem. Process. 2013, 1, 18. [Google Scholar] [CrossRef] [Green Version]
- Ayodele, B.; Cheng, C.K. Biorefinery for the Production of Biodiesel, Hydrogen and Synthesis Gas Integrated with CHP from Oil Palm in Malaysia. Chem. Prod. Process. Model. 2016, 11, 305–314. [Google Scholar] [CrossRef]
- PEMANDU. Palm Oil & Rubber. Performance Management & Delivery Unit (PEMANDU). 2015. Available online: http://etp.pemandu.gov.my/Palm_Oil-@-Palm_Oil_-%E2%97%98-_Rubber.aspx (accessed on 1 September 2017).
- Toh, T. 100 glorious years of palm oil in Malaysia. The Star. 2017. Available online: http://www.star2.com/palmoil/2017/05/18/100-glorious-years-of-palm-oil-in-malaysia/ (accessed on 1 September 2017).
- MPOB. Production of Crude Palm Oil 2017. Malaysian Palm Oil Board (MPOB). 2017. Available online: http://bepi.mpob.gov.my/index.php/en/statistics/production/177-production-2017/792-production-of-crude-oil-palm-2017.html (accessed on 1 September 2017).
- Radzuan, M.N.; Banat, I.M.; Winterburn, J. Production and characterization of rhamnolipid using palm oil agricultural refinery waste. Bioresour. Technol. 2017, 225, 99–105. [Google Scholar] [CrossRef]
- Chabukswar, D.D.; Heer, P.K.K.S.; Gaikar, V.G. Esterification of Palm Fatty Acid Distillate Using Heterogeneous Sulfonated Microcrystalline Cellulose Catalyst and Its Comparison with H2SO4 Catalyzed Reaction. Ind. Eng. Chem. Res. 2013, 52, 7316–7326. [Google Scholar] [CrossRef]
- Hosseini, S.; Janaun, J.; Choong, T.S. Feasibility of honeycomb monolith supported sugar catalyst to produce biodiesel from palm fatty acid distillate (PFAD). Process. Saf. Environ. Prot. 2015, 98, 285–295. [Google Scholar] [CrossRef]
- Lokman, I.M.; Rashid, U.; Yunus, R.; Taufiq-Yap, Y.H. Carbohydrate-derived Solid Acid Catalysts for Biodiesel Production from Low-Cost Feedstocks: A Review. Catal. Rev. 2014, 56, 187–219. [Google Scholar] [CrossRef]
- Marchant, R.; Banat, I. Microbial biosurfactants: Challenges and opportunities for future exploitation. Trends Biotechnol. 2012, 30, 558–565. [Google Scholar] [CrossRef] [PubMed]
- Marchant, R.; Banat, I. Biosurfactants: A sustainable replacement for chemical surfactants? Biotechnol. Lett. 2012, 34, 1597–1605. [Google Scholar] [CrossRef] [PubMed]
- Paulino, B.N.; Pessôa, M.G.; Mano, M.C.R.; Molina, G.; Numa, I.A.N.; Pastore, G.M. Current status in biotechnological production and applications of glycolipid biosurfactants. Appl. Microbiol. Biotechnol. 2016, 100, 10265–10293. [Google Scholar] [CrossRef] [PubMed]
- Santos, D.K.F.; Rufino, R.D.; Luna, J.M.; Santos, V.A.; Sarubbo, L.A. Biosurfactants: Multifunctional Biomolecules of the 21st Century. Int. J. Mol. Sci. 2016, 17, 401. [Google Scholar] [CrossRef] [PubMed] [Green Version]
- De Almeida, D.G.; Silva, R.D.C.F.S.D.; Luna, J.M.; Rufino, R.D.; Santos, V.A.; Banat, I.; Sarubbo, L.A. Biosurfactants: Promising Molecules for Petroleum Biotechnology Advances. Front. Microbiol. 2016, 7, 1718. [Google Scholar] [CrossRef] [Green Version]
- Mnif, I.; Ghribi, D. Glycolipid biosurfactants: Main properties and potential applications in agriculture and food industry. J. Sci. Food Agric. 2016, 96, 4310–4320. [Google Scholar] [CrossRef] [PubMed]
- Fariq, A.; Saeed, A. Production and Biomedical Applications of Probiotic Biosurfactants. Curr. Microbiol. 2016, 72, 489–495. [Google Scholar] [CrossRef] [PubMed]
- Perfumo, A.; Banat, I.M.; Marchant, R. Going Green and Cold: Biosurfactants from Low-Temperature Environments to Biotechnology Applications. Trends Biotechnol. 2018, 36, 277–289. [Google Scholar] [CrossRef] [PubMed] [Green Version]
- Geetha, S.J.; Banat, I.M.; Joshi, S.J. Biosurfactants: Production and potential applications in microbial enhanced oil recovery (MEOR). Biocatal. Agric. Biotechnol. 2018, 14, 23–32. [Google Scholar] [CrossRef]
- Geys, R.; Soetaert, W.; Van Bogaert, I. Biotechnological opportunities in biosurfactant production. Curr. Opin. Biotechnol. 2014, 30, 66–72. [Google Scholar] [CrossRef]
- Nabais, R.M.; Malcata, F.X. Modelling of lactic fermentation of carrot slices in salted brines. Food Sci. Technol. Int. 1997, 3, 263–283. [Google Scholar] [CrossRef]
- Shang, L.; Di Fan, D.; Kim, M.I.; Choi, J.-D.; Chang, H.N. Modeling of poly(3-hydroxybutyrate) production by high cell density fed-batch culture of Ralstonia eutropha. Biotechnol. Bioprocess. Eng. 2007, 12, 417–423. [Google Scholar] [CrossRef]
- Radzuan, M.N.; Banat, I.M.; Winterburn, J. Biorefining palm oil agricultural refinery waste for added value rhamnolipid production via fermentation. Ind. Crops Prod. 2018, 116, 64–72. [Google Scholar] [CrossRef]
- Clark, D.S.; Blanch, H.W. Biochemical Engineering, 2nd ed.; Taylor & Francis: Boca Raton, FL, USA, 1997. [Google Scholar]
- Mercier, P.; Yerushalmi, L.; Rouleau, D.; Dochain, D. Kinetics of lactic acid fermentation on glucose and corn by Lactobacillus amylophilus. J. Chem. Technol. Biotechnol. 1992, 55, 111–121. [Google Scholar] [CrossRef]
- Soberón-Chávez, G.; Lépine, F.; Déziel, E. Production of rhamnolipids by Pseudomonas aeruginosa. Appl. Microbiol. Biotechnol. 2005, 68, 718–725. [Google Scholar] [CrossRef] [PubMed]
- Henkel, M.; Schmidberger, A.; Kühnert, C.; Beuker, J.; Bernard, T.; Schwartz, T.; Syldatk, C.; Hausmann, R. Kinetic modeling of the time course of N-butyryl-homoserine lactone concentration during batch cultivations of Pseudomonas aeruginosa PAO1. Appl. Microbiol. Biotechnol. 2013, 97, 7607–7616. [Google Scholar] [CrossRef]
- El-Fouly, M.; Sharaf, A.; Shahin, A.; El-Bialy, H.A.; Omara, A. Biosynthesis of pyocyanin pigment byPseudomonas aeruginosa. J. Radiat. Res. Appl. Sci. 2014, 8, 36–48. [Google Scholar] [CrossRef] [Green Version]
- Pacheco, G.J.; Reis, R.S.; Fernandes, A.C.L.B.; da Rocha, S.L.G.; Pereira, M.D.; Perales, J.; Freire, D.M.G. Rhamnolipid production: Effect of oxidative stress on virulence factors and proteome of Pseudomonas aeruginosa PA1. Appl. Microbiol. Biotechnol. 2012, 95, 1519–1529. [Google Scholar] [CrossRef] [PubMed]
- Junker, B. Foam and Its Mitigation in Fermentation Systems. Biotechnol. Prog. 2007, 23, 767–784. [Google Scholar] [CrossRef]
- Lotfabad, T.B.; Ebadipour, N.; RoostaAzad, R. Evaluation of a recycling bioreactor for biosurfactant production byPseudomonas aeruginosaMR01 using soybean oil waste. J. Chem. Technol. Biotechnol. 2015, 91, 1368–1377. [Google Scholar] [CrossRef]
- Funston, S.J.; Tsaousi, K.; Rudden, M.; Smyth, T.; Stevenson, P.S.; Marchant, R.; Banat, I. Characterising rhamnolipid production in Burkholderia thailandensis E264, a non-pathogenic producer. Appl. Microbiol. Biotechnol. 2016, 100, 7945–7956. [Google Scholar] [CrossRef] [PubMed] [Green Version]
- De Rienzo, M.D.; Kamalanathan, I.; Martin, P. Comparative study of the production of rhamnolipid biosurfactants by B. thailandensis E264 and P. aeruginosa ATCC 9027 using foam fractionation. Process. Biochem. 2016, 51, 820–827. [Google Scholar] [CrossRef]
- Zhu, L.; Yang, X.; Xue, C.; Chen, Y.; Qu, L.; Lu, W. Enhanced rhamnolipids production by Pseudomonas aeruginosa based on a pH stage-controlled fed-batch fermentation process. Bioresour. Technol. 2012, 117, 208–213. [Google Scholar] [CrossRef]
- Wu, T.; Jiang, J.; He, N.; Jin, M.; Ma, K.; Long, X. High-Performance Production of Biosurfactant Rhamnolipid with Nitrogen Feeding. J. Surfactants Deterg. 2019, 22, 395–402. [Google Scholar] [CrossRef]
- Gudiña, E.J.; Rodrigues, A.; Freitas, V.; Azevedo, Z.; Teixeira, J.; Rodrigues, L.R. Valorization of agro-industrial wastes towards the production of rhamnolipids. Bioresour. Technol. 2016, 212, 144–150. [Google Scholar] [CrossRef] [PubMed] [Green Version]
- Sana, S.; Datta, S.; Biswas, D.; Bhattacharya, M. Production kinetics of Rhamnolipid using fish fat: A step towards environmental hazard control of sewage. Environ. Technol. Innov. 2017, 8, 299–308. [Google Scholar] [CrossRef]
- Samykannu, M.; Achary, A. Utilization of Agro-Industry Residue for Rhamnolipid Production by P. aeruginosa AMB AS7 and Its Application in Chromium Removal. Appl. Biochem. Biotechnol. 2017, 183, 70–90. [Google Scholar] [CrossRef] [PubMed]
- Müller, M.M.; Hörmann, B.; Syldatk, C.; Hausmann, R. Pseudomonas aeruginosa PAO1 as a model for rhamnolipid production in bioreactor systems. Appl. Microbiol. Biotechnol. 2010, 87, 167–174. [Google Scholar] [CrossRef] [PubMed]
- Aparna, A.; Srinikethan, G.; Smitha, H. Production and characterization of biosurfactant produced by a novel Pseudomonas sp. 2B. Colloids Surf. B Biointerfaces 2012, 95, 23–29. [Google Scholar] [CrossRef]
- Hošková, M.; Ježdík, R.; Schreiberová, O.; Chudoba, J.; Šír, M.; Čejková, A.; Masák, J.; Jirků, V.; Řezanka, T. Structural and physiochemical characterization of rhamnolipids produced by Acinetobacter calcoaceticus, Enterobacter asburiae and Pseudomonas aeruginosa in single strain and mixed cultures. J. Biotechnol. 2015, 193, 45–51. [Google Scholar] [CrossRef] [PubMed]
- Nitschke, M.; Costa, S.G.V.A.O.; Contiero, J. Structure and Applications of a Rhamnolipid Surfactant Produced in Soybean Oil Waste. Appl. Biochem. Biotechnol. 2009, 160, 2066–2074. [Google Scholar] [CrossRef]
- Sakthipriya, N.; Doble, M.; Sangwai, J. Biosurfactant from Pseudomonas species with waxes as carbon source—Their production, modeling and properties. J. Ind. Eng. Chem. 2015, 31, 100–111. [Google Scholar] [CrossRef]
- Partovi, M.; Lotfabad, T.B.; Roostaazad, R.; Bahmaei, M.; Tayyebi, S. Management of soybean oil refinery wastes through recycling them for producing biosurfactant using Pseudomonas aeruginosa MR01. World J. Microbiol. Biotechnol. 2013, 29, 1039–1047. [Google Scholar] [CrossRef] [PubMed]
Figure 1.
The profiles of P. aeruginosa PAO1 cell growth time path and the production of rhamnolipid in the bioreactor at 150 rpm, 37 °C by using (a) PFAD and (b) FAME as sources of carbon.
Figure 1.
The profiles of P. aeruginosa PAO1 cell growth time path and the production of rhamnolipid in the bioreactor at 150 rpm, 37 °C by using (a) PFAD and (b) FAME as sources of carbon.

Figure 2.
Surface tension reduction of rhamnolipid from PFAD and FAME.

Figure 3.
Emulsion Index of rhamnolipids with hexadecane, kerosene, rapeseed oil, and sunflower oil.
Figure 3.
Emulsion Index of rhamnolipids with hexadecane, kerosene, rapeseed oil, and sunflower oil.

Figure 4.
Kinetic growth of P. aeruginosa PAO1 by PFAD and FAME as a source of carbon.

Figure 5.
Comparison of experimental data, Monod modelling and logistic modelling for PFAD and FAME as carbon sources: (a) dry cell weight, (b) rhamnolipid production, and (c) substrate consumption.
Figure 5.
Comparison of experimental data, Monod modelling and logistic modelling for PFAD and FAME as carbon sources: (a) dry cell weight, (b) rhamnolipid production, and (c) substrate consumption.


Table 2.
The mass spectrometry analysis for the composition of chemical and mono- to di-rhamnolipid ratio of the rhamnolipid mixture produced by P. aeruginosa PAO1.
Table 2.
The mass spectrometry analysis for the composition of chemical and mono- to di-rhamnolipid ratio of the rhamnolipid mixture produced by P. aeruginosa PAO1.
| Mono- to Di- Rhamnolipid Ratio (Rha-C10-C10: Rha-Rha-C10-C10) | Congeners of Rhamnolipid (Pseudomolecular Ion, m/z) | |
|---|---|---|
| Carbon Source | Ratio | |
| PFAD | 3.18 | Rha-C10-C10 (503) Rha-Rha-C10-C10 (649) |
| FAME | 3.22 | |
Table 3.
The effect of rhamnolipid comparison produced from various sources of carbon and microorganisms.
Table 3.
The effect of rhamnolipid comparison produced from various sources of carbon and microorganisms.
| Microorganism | Substrate | Surface Tension Reduction (mN m−1) | CMC (mg L−1) | Rhamnolipid Concentration (g L−1) | Emulsion Index (24 h, %) | References | |||
|---|---|---|---|---|---|---|---|---|---|
| Hexadecane | Kerosene | Sunflower Oil | Rapeseed Oil | ||||||
| P. aeruginosa PAO1 | PFAD | 28 | 62 | 1 | 47 | 40 | 22 | 33 | This study |
| FAME | 28 | 62 | 48 | 44 | 38 | 46 | |||
| P. aeruginosa MR01 | Soybean oil soap stock | 29 | 24 | 10 | - | 63 | - | - | [30] |
| P. aeruginosa #112 | Olive oil mill wastewater | 29 | 13 | 5 | 58 | - | - | - | [35] |
| P. aeruginosa ATCC 9027 | Glucose | 24 | 20 | 0.9 | - | 48 | - | - | [32] |
| P. aeruginosa | Sodium citrate | - | 56 | 1 | - | - | 5 | - | [40] |
Table 4.
Comparison of microbial growth rate and production of rhamnolipid in the exponential phase.
Table 4.
Comparison of microbial growth rate and production of rhamnolipid in the exponential phase.
| Microorganism | Carbon Sources | Exponential Time (H) | Specific Growth Rate, µ (h−1) | Doubling Time, td (h−1) | R2 | Initial Rate of Rhamnolipid Produced, Pexp (g L−1 h−1) | References |
|---|---|---|---|---|---|---|---|
| P. aeruginosa PAO1 | PFAD | 60 | 0.05 | 13.86 | 0.87 | 0.02 | This study |
| FAME | 24 | 0.11 | 6.30 | 0.97 | 0.02 | ||
| P. aeruginosa CPCL | n-Hexadecane | 40 | 0.056 | 12.37 | 0.97 | 0.48 | [42] |
| n-Eicosane | 40 | 0.034 | 20.38 | 0.96 | 0.24 | ||
| P. aeruginosa MR01 | Soybean oil | 50 | 0.20 | - | - | - | [43] |
Publisher’s Note: MDPI stays neutral with regard to jurisdictional claims in published maps and institutional affiliations. |
© 2021 by the authors. Licensee MDPI, Basel, Switzerland. This article is an open access article distributed under the terms and conditions of the Creative Commons Attribution (CC BY) license (https://creativecommons.org/licenses/by/4.0/).
Share and Cite
MDPI and ACS Style
Radzuan, M.N.; Winterburn, J.; Banat, I. Bioreactor Rhamnolipid Production Using Palm Oil Agricultural Refinery By-Products. Processes 2021, 9, 2037. https://0-doi-org.brum.beds.ac.uk/10.3390/pr9112037
AMA Style
Radzuan MN, Winterburn J, Banat I. Bioreactor Rhamnolipid Production Using Palm Oil Agricultural Refinery By-Products. Processes. 2021; 9(11):2037. https://0-doi-org.brum.beds.ac.uk/10.3390/pr9112037
Chicago/Turabian StyleRadzuan, Mohd Nazren, James Winterburn, and Ibrahim Banat. 2021. "Bioreactor Rhamnolipid Production Using Palm Oil Agricultural Refinery By-Products" Processes 9, no. 11: 2037. https://0-doi-org.brum.beds.ac.uk/10.3390/pr9112037
Note that from the first issue of 2016, this journal uses article numbers instead of page numbers. See further details here.