Article

Design of a Bench-Scale Tubular Reactor Similar to Plug Flow Reactor for Gas-Phase Kinetic Data Generation-Illustration with the Pyrolysis of Octanoic Acid

Laboratoire Réactions et Génie des Procédés UMR CNRS 7274, Université de Lorraine-Ecole Nationale Supérieure des Industries Chimiques de Nancy, 1, rue Grandville, 54000 Nancy, France
*
Authors to whom correspondence should be addressed.
Submission received: 3 November 2021 / Revised: 24 November 2021 / Accepted: 27 November 2021 / Published: 17 December 2021
(This article belongs to the Section Process Control and Monitoring)

Abstract

:
The material described in this article deals with waste conversion into energy vectors by pyrolysis, steam cracking, or oxidation of liquid biomass, carried out at small to medium scale. The design of a bench-scale experimental setup devoted to gas phase kinetic data generation in a tubular reactor under laminar regime close to plug flow is detailed based on a very simple approach. Validation of the designed bench-scale setup was successfully carried out within the context of octanoic acid pyrolysis by generating kinetic data with satisfactory measurement repeatability and material balances. The key to this positive result is that axial dispersion coefficient is much smaller in gas-phase than in liquid-phase, thus allowing the designed small sized tubular reactor to be close to the plug flow reactor. Such a feature of the axial dispersion coefficient is not well known by the wider public. Besides, octanoic acid was selected as surrogate for carboxylic acids because of their key role in various industrial applications (combustion of ethyl biodiesel; production of biofuel and biosourced chemicals).

Highlights

  • Small sized tubular reactor appropriately designed to produce gas phase kinetic data.
  • Reason: axial dispersion coefficient much smaller in gas phase than in liquid phase.
  • Helpful tool for research dedicated to thermal conversion of liquid biomass.

1. Introduction

Validation of models developed to accurately depict reacting systems is usually achieved when good matching between experimental information and simulated information is obtained [1]. However, this step cannot be conducted successfully if the experimental devices used to generate experimental information do not at least meet the theoretical hypothesis underlying the developed models.
Therefore, the purpose of this article is to describe, step by step, the design of a new bench-scale experimental setup devoted to generate kinetic information at constant near-atmospheric pressure. For the reasons mentioned previously, the design of the experimental setup should satisfy the assumptions of the models implemented in the most commonly used software for reacting system simulation, i.e., CHEMKIN II [2] or Aspen plus®, combined with EXGAS for the automatic generation of the detailed kinetic mechanisms relating to the reacting systems considered [3,4,5,6,7]. Regarding EXGAS, the reacting systems should involve reactions occurring in a homogeneous gas-phase medium at low to moderate pressures. Hence, no wall effects that would induce heterogeneous gas-solid catalytic or non-catalytic reactions between the inner surface of the reactor and the gas phase components should occur since these effects would be ignored by the model [8]. Regarding CHEMKIN II [2] or Aspen plus®, the implemented models are dedicated to representing the ideal flow patterns occurring either in the continuous stirred tank reactor (CSTR) or in the plug flow reactor (PFR). With the objective of a successful transfer to industrial reactors commonly found in pyrolysis, steam cracking, or steam reforming processes, the option of a continuous flow tubular reactor was selected. This option goes, of course, with the requirement that flow is close to plug, despite the laminar regime imposed by a bench-scale setup (small dimensions and low matter flowrates). Since this issue is the core of the article, the emphasis will be placed on the key points allowing this requirement to be met; including the design of the fast-quenching system ensuring that the reaction only occurs inside the reactor. Moreover, pyrolysis of octanoic acid was selected as illustration. Indeed, from the modeling point of view, pyrolysis can be considered as the most basic thermal cracking reaction, and octanoic acid as the simplest departure surrogate of carboxylic acids, which play a key role in various industrial applications. These include the steam reforming cracking of waste cooking oil [9], the ethyl biodiesel combustion [10], or the biofuel and bioproduct production from biomass pyrolysis [11,12,13] or hydrothermal liquefaction [14]. Validity of the kinetic data generated with the designed tubular reactor, including the fast-quenching system, will be checked through measurement repeatability and material balances.

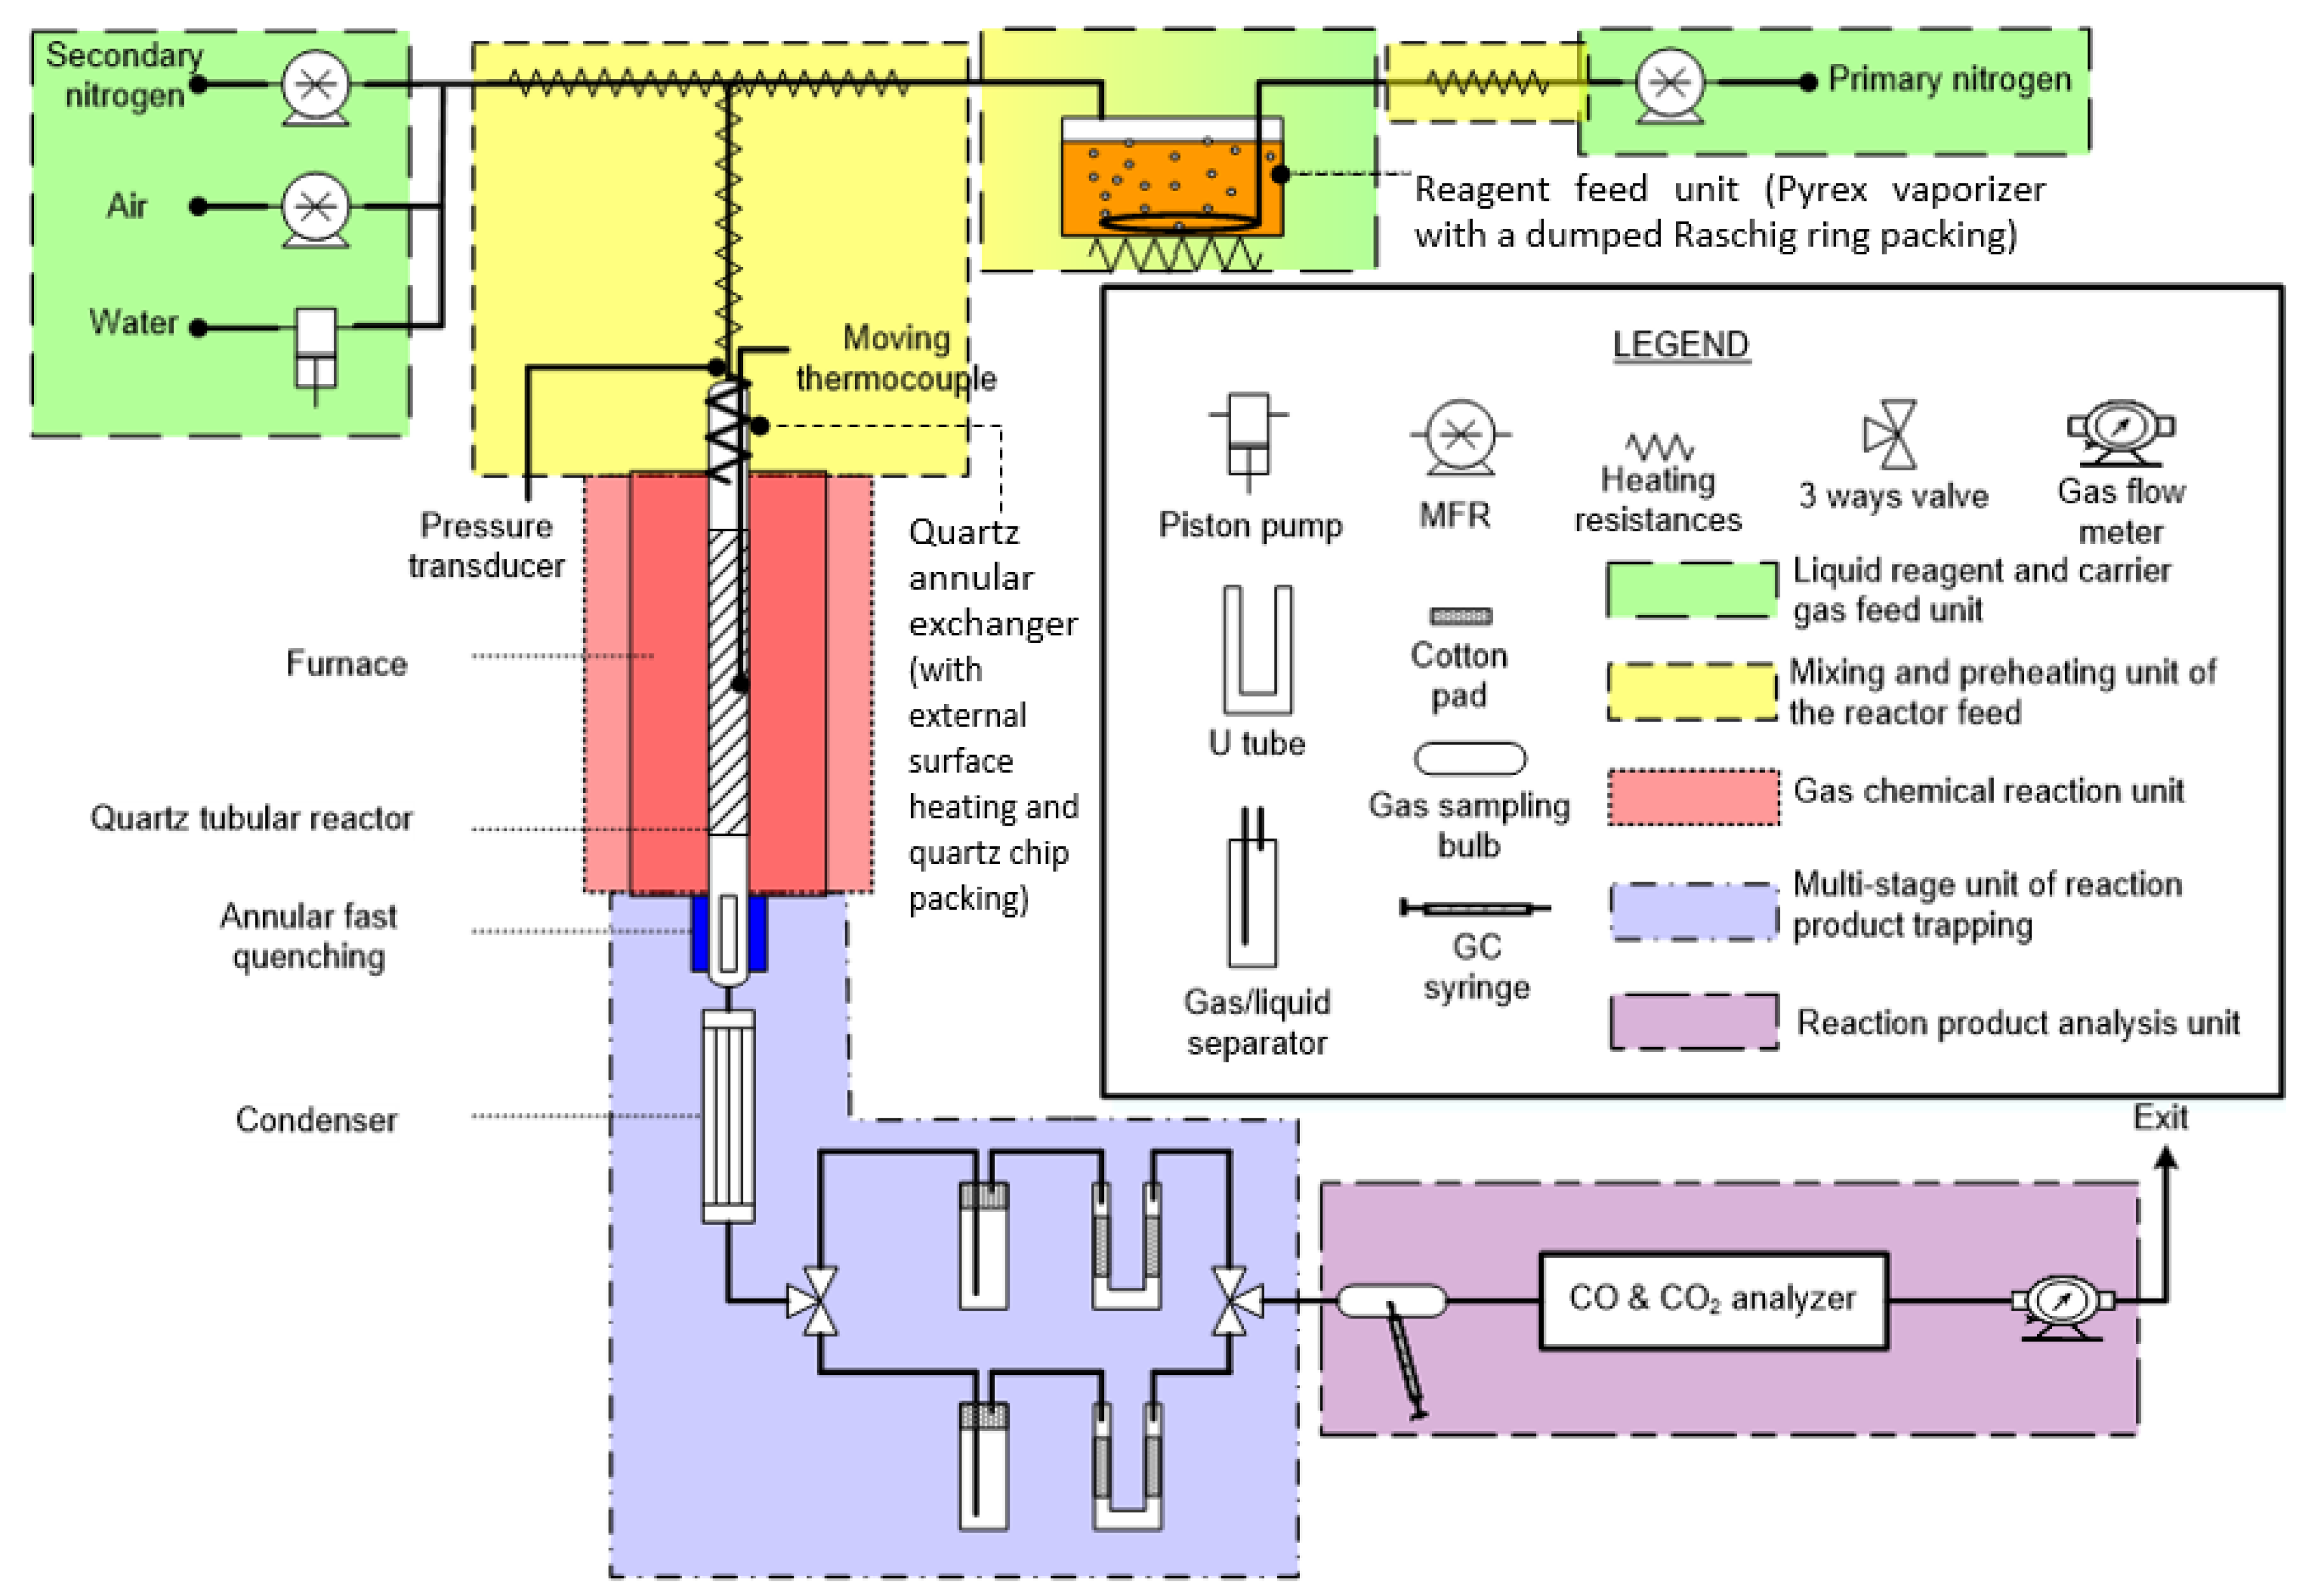
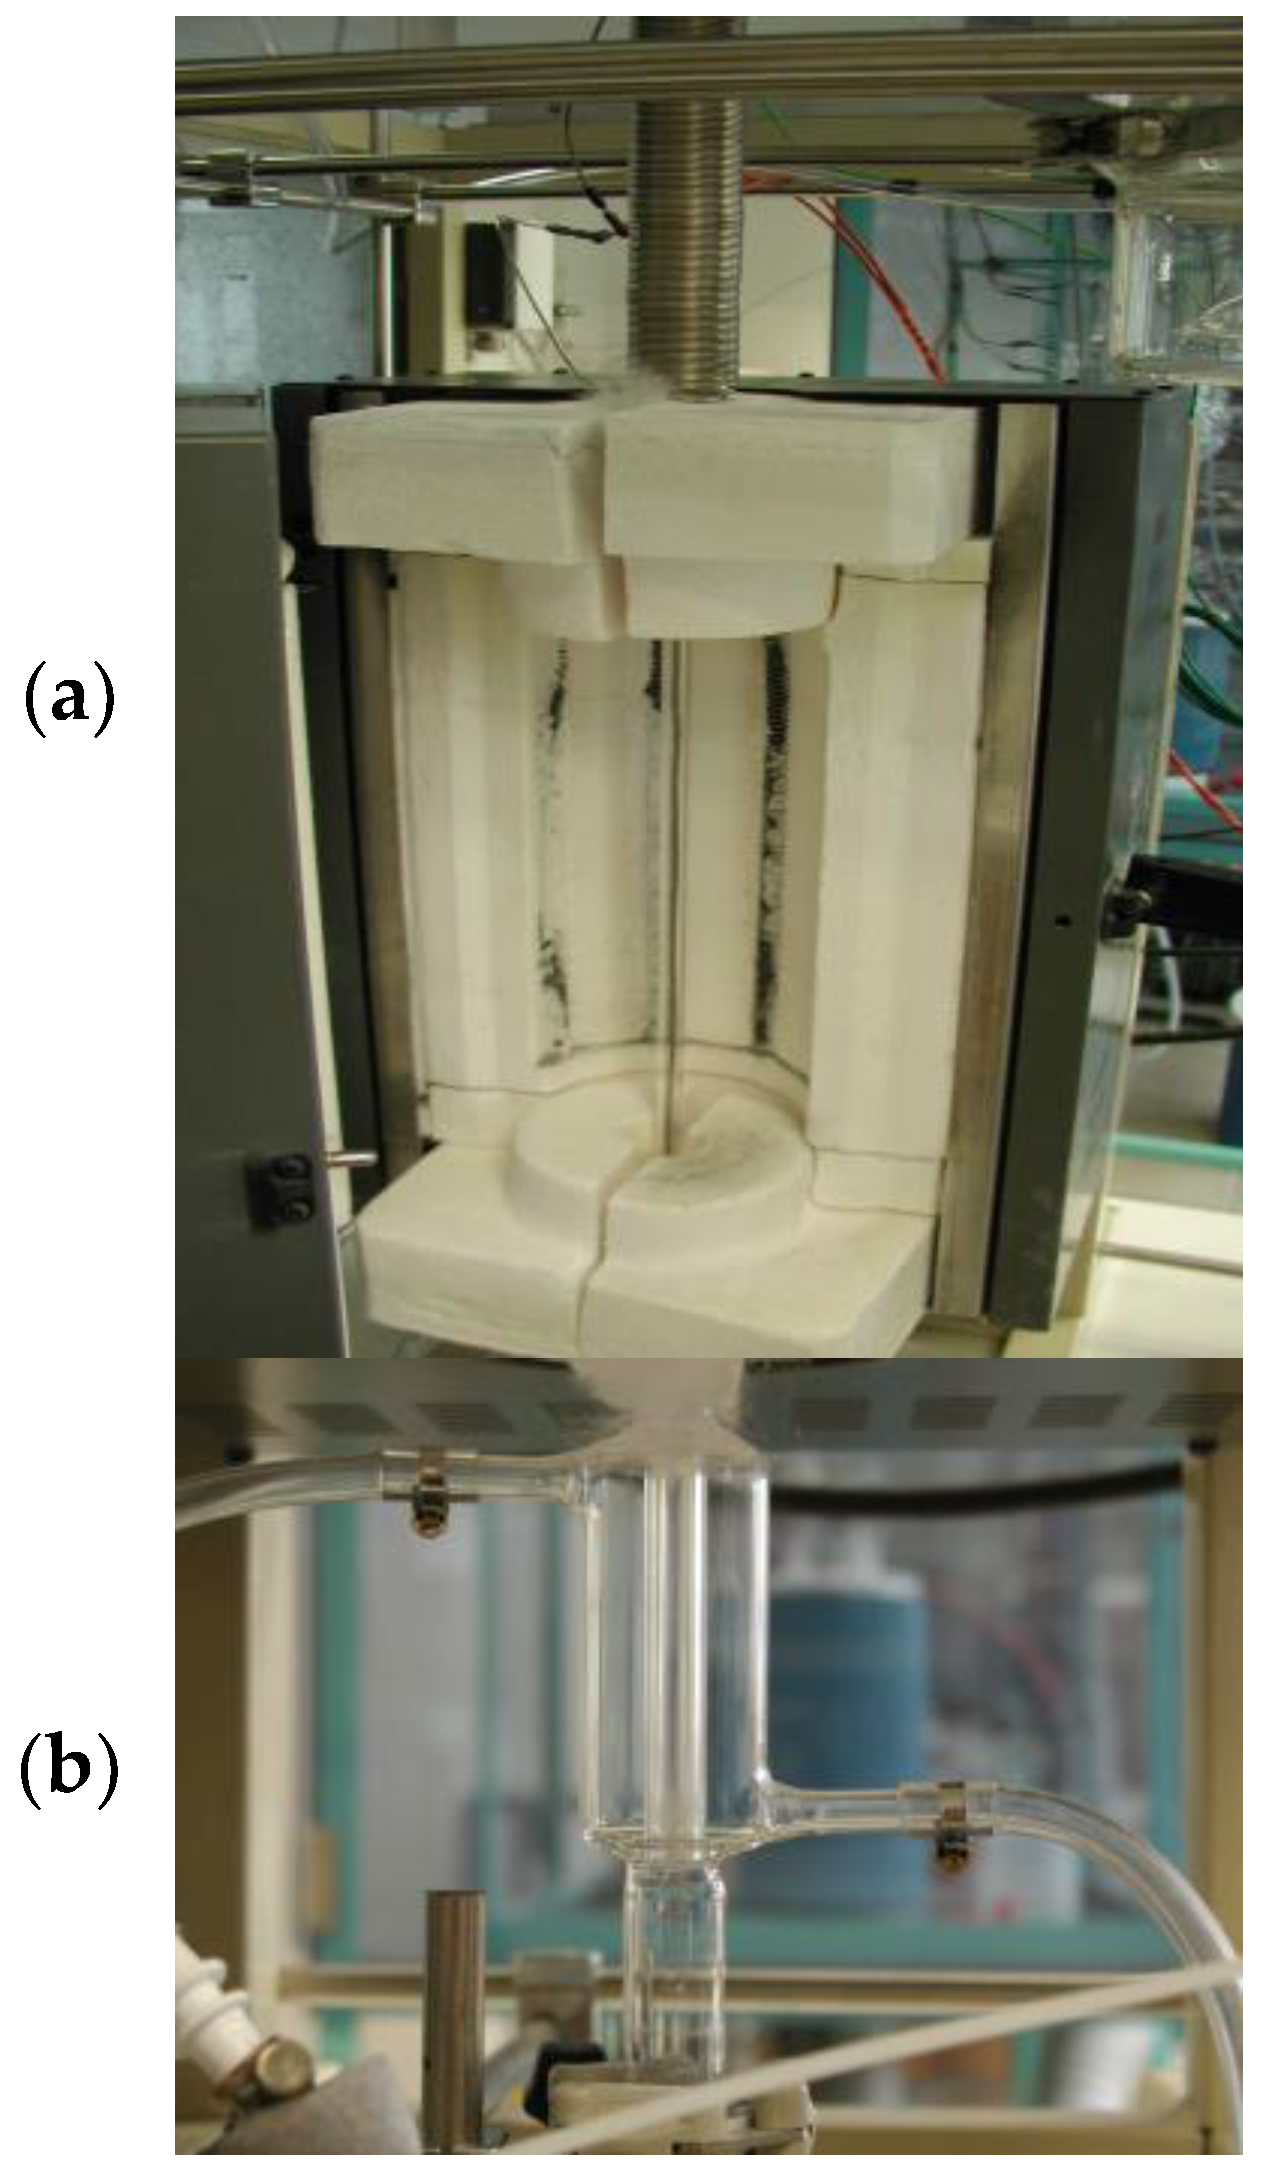
2. Experimental Setup Description

A schematic overview of the designed continuous bench-scale experimental setup is given in Figure 1. Five major units operating at constant near-atmospheric pressure can be clearly observed: (i) Liquid reagent (octanoic acid) and carrier gas (nitrogen) feed unit; (ii) mixing and preheating unit of the reactor feed (mixture of reagent and carrier gas); (iii) gas phase chemical reaction unit; (iv) multi-stage unit of reaction product trapping: fast quenching, condensation and gas-liquid separation; and (v) reaction product analysis unit. Air supply that was introduced into the feed unit is used at the end of each experiment to quantify the coke formed during the thermal cracking run. In addition, located at the feed unit level, a water supply was provided for possible extension of the experimental setup to steam cracking or steam reforming applications.

2.1. Liquid Reagent and Carrier Gas Feed Unit

Two carrier gas feeds were incorporated. The first one, named “primary N2”, allows for vaporizing partially the liquid reagent to get a homogenous gas phase feed with a constant flowrate. This condition is required to ensure good reproducibility of experiments and to reach steady state during a run (with time independent temperature and concentration profiles throughout reactor). The second carrier gas feed, named “secondary N2”, allows for conducting experiments by controlling independently the reagent dilution and the feed residence time. Both carrier gas feeds (primary N2 and secondary N2) are supplied via mass flow controllers (maximum volume flowrate at NTP (0 °C, 1 atm): 4 NL/min) and are preheated in stainless-steel transfer lines surrounded by heating resistance rolls. The preheated primary N2 is flowed at the bottom of the reagent feed unit which is filled with the liquid reagent. The reagent feed unit is a counter-current gas-liquid vaporizer made of Pyrex and randomly filled with Raschig rings to enhance mass and heat transfer. A thermally controlled heater system allows for heating it to a constant temperature value (170 °C for octanoic acid reagent). The pressure inside the vaporizer is assumed to be equal to the pressure at the inlet of the reactor, the latter being experimentally determined (see Section 2.3). The exact molar flowrate of the reagent leaving the vaporizer was determined as described in Section Appendix B.1 (Appendix B) by operating without thermal reaction and collecting, at equally space time intervals, the reagent at the outlet of the reactor.

2.2. Mixing and Preheating Unit of the Reactor Feed

The homogeneous gas phase stream leaving the vaporizer (mixture of primary N2 and reagent) is mixed with the secondary N2 in a quartz exchanger of annular geometry (to ensure efficient heat transfer) and filled with quartz chips (to enhance gas-gas mixing and to avoid condensation of reagent). The quartz exchanger (which is integral with the reactor) is surrounded by a roll of heating resistances in order to preheat the reactor feed (mixture of secondary N2 and of primary N2 charged with the reagent) to a temperature lower than the reagent thermal cracking temperature (300 °C for octanoic acid).

2.3. Gas Phase Chemical Reaction Unit

The unit comprises a quartz tubular reactor which is housed in a thermostatically controlled electric resistance furnace (F 79300-type Thermolyne). For a given furnace temperature set, the reactor temperature profile is measured with a 1000 mm K-type thermocouple that can be moved along the central axis of the reactor (and of the mixing and preheating reactor feed unit which is integral with the reactor). A pressure transducer, located at the inlet of the reactor, gives a measure of the reactor pressure.

2.4. Multi-Stage Unit of Reaction Product Trapping: Fast Quenching, Condensation, and Gas-Liquid Separation

At the outlet of the reactor, the gaseous mixture flow is passed through a quartz annular exchanger the external surface of which is cooled down to a constant temperature (20 °C) by mean of a cryostat (F30C-type Compact Julabo with Thermal H5S as coolant). This fast quenching allows for stopping straightaway the reaction as soon as the reacting mixture leaves the reactor. However, due to cooling, the effluents leaving the fast quenching often occur as aerosols (suspension of very fine liquid droplets in a gas flow). Hence, complete separation of the condensable (liquid) from the non-condensable (gaseous) products is a very difficult task which, nevertheless, needs to be conducted to facilitate the next product analysis step. Thus, in order to achieve the best possible separation of the gas and liquid products, the stream leaving the fast-quenching passes through a water-cooled condenser (temperature maintained at 20 °C by using the same cryostat as previously). The obtained gas-liquid mixture is sent either to the transient state or to the steady state transfer line, which are both identical and linked together at their extremity by two 3-way valves. Each transfer line comprises a glass gas-liquid separator for collecting the liquid product. For trapping the fine liquid droplets that might remain in the gas product, the separator at the outlet is packed with cotton wool. A glass U-tube partially packed with cotton wool was added after the gas-liquid separator as a precaution (but weighing of the cotton wool, before and after each experiment, showed that no product was retained). The gases exiting the gas-liquid separator and U-tube (non-condensable cracking products mixed in the inert carrier gas) pass through the gas sampler for analysis, and then to the on-line gas flow meter.

2.5. Reaction Product Analysis Unit, Procedure, and Material Balances

The pyrolysis products collected as three phases, i.e., gas, liquid, and solid (coke), are analyzed by different techniques, as described in Appendix A [13]. Molar fractions are typically determined with an accuracy of ±5% for major species, and ±10% for minor species. These species are further detailed in Appendix A within the context of the present case study focused on octanoic acid pyrolysis. The methodology would, however, remain the same for another reactant, liquid at ambient conditions.
The operating procedure of the designed bench-scale setup, as well as the material balances validating any experiment carried out, are described in Appendix B.

3. Design of the Tubular Reactor and Fast Quenching System

Sizing of the major units designed in the new experimental setup are listed in Table 1. This section focuses on the design of the two units playing a key role in the kinetic data collection: the reactor and the fast-quenching system (for which photos are shown in Figure 2).

3.1. Reactor Design

In order to ensure flowing conditions close to plug, the tubular reactor should satisfy two criteria (Equations (1) and (2)):
Re = u   d   ρ μ 10 4        ( to   guarantee   turbulent   flow ) ,
L d 10 2 ,
where Re is the Reynolds number, whereas u, ρ , and μ stand, respectively, for the mean real velocity, density, and viscosity of the fluid inside the tubular reactor, for which length and internal diameter are represented by variables L and d. Hence, within the circumstances encountered in this work (laminar regime imposed by the operating conditions), it should be unlikely that a tubular reactor can be designed with all the requirements to meet rigorous plug flow. As a result, the real objective here was to determine the dimensions of the tubular reactor that would allow approaching, as closely as possible, plug flow and obtaining then deviations that would be small enough to induce no detectable errors in the kinetic data collection. It is worth mentioning that this objective has good chance to be achieved successfully, although the regime of operating conditions is strongly laminar, because reactions investigated in this work occur in gas phase medium.
Small deviations from plug flow can be considered by using either the dispersion model based on Péclet number (denoted Pe) or the tanks-in-series model based on the equivalent number of CSTRs in series (denoted N). The two models are roughly equivalent, and it is, thus, suggested to use the one which is the most convenient for the user, depending of his purposes [15]. Indeed, for P e 50 or N 25 , the residence time distributions (RTDs) calculated by the two models for fluid flowing in the reactor lead to symmetric Gaussian curves that are almost superimposable. In addition, equating the RTD variances calculated from each model leads to the well-known equivalence relation:
P e = 2   ( N 1 ) .
This relation is all the more in agreement with experimental observations that Pe and N reach high values (i.e., P e > 100 and N > 50 ). Nevertheless, satisfactory agreement with experiments is obtained with P e 50 (i.e., N 25 , Equation (3)); thus, this value of the Pe criterion was selected to consider a gas-phase laminar tubular reactor very close to plug flow.
In practice, the tanks-in-series model is easier to implement than the dispersion model. In addition, experiments show that the tanks-in-series model can be applied with confidence for non-ideal flows ranging from perfectly mixed flow to plug flow, whereas the dispersion model should be devoted to flow close to plug. In addition, the tanks-in-series model can be used with any kinetics [15]. Nevertheless, the dispersion model has the advantage that its key parameter Pe can be easily estimated by correlations involving thermophysical properties of the reacting fluid and resulting from extensive work published in the literature. On the other hand, no estimation method was proposed for the key parameter N. Consequently, the dispersion model was selected for the reactor design of the experimental setup. By contrast, the tanks-in-series model could be used for the modeling and simulation with CHEMKIN II [2] of the kinetic data collected from the designed reactor (the number of equivalent CSTRs in series N would previously be determined for each experiment from the Pe number and Equation (3), and each of the N CSTRs would operate at different temperatures to meet the temperature profile of the tubular reactor induced by the furnace used; see Section 4).

3.1.1. Equations Related to the Reactor Sizing

The purpose here is to establish the equations estimating the tubular reactor dimensions (internal diameter d and length L) from the thermophysical properties of the gas reacting fluid. By combining the Péclet number definition (Equation (4)) with the correlation proposed in the literature [15] for the axial dispersion coefficient D a x under laminar flow in an empty tube (Equations (5a)–(5c)), it was possible to express Pe in terms of d, L, and the properties of the gas reacting fluid that characterize the process: mean real velocity u and molecular diffusion coefficient D d i f (Equation (6)).
P e = u   L D a x ,
D a x = D d i f + u 2   d 2 192   D d i f ,
applicable   when   Re < 2300 ,
and   when   L   > >   3 d   with   u d D d i f < 10 2 L 3 d ,   i . e . ,   L d > 3 10 2 u d D d i f ,
P e = u   L D d i f + u 2   d 2 192   D d i f .
Then, in order to get an expression as a function of length L, d 2 was deduced from the residence time τ of the stream entering the reactor with a molar composition y A in reagent A and a total volume flowrate Q T i n ( T R ,   P R ,   y A ) evaluated at the operating reactor temperature and pressure T R and P R (Equation (7)).
d 2 = 4   Q T i n   τ π   L .
Combining the mean real velocity of the fluid flowing the reactor ( u = L / τ ) with Equations (6) and (7) led to a new expression of Pe involving parameters that can be determined either by estimation methods or by direct measurement on the experimental setup:
P e = L 2 D d i f   τ + Q T i n   L 48   π   D d i f .
This expression (Equation (8)) is equivalent to a second order equation in L depending only on Pe, D d i f ,   Q T i n ( T R ,   P R ,   y A ) , and τ :
L 2 P e   Q T i n 48   π   D d i f   L D d i f   τ   P e = 0 .
Solving Equation (9) led to the unique acceptable solution with physical meaning:
L = Q T i n   P e 48   π   D d i f + ( Q T i n   P e 48   π   D d i f ) 2 + 4   D d i f   τ   P e 2 .
Finally, given the reactor length L from Equation (10), the reactor internal diameter d could then be determined by Equation (7).

3.1.2. Calculation Procedure and Numerical Solving Related to the Reactor Sizing

The sizing of the tubular reactor requires a few calculation steps, as given in the following.
(1)
Choice of an initial value for Pe. The choice P e = 50 was selected since that condition induces a real reactor flow sufficiently close to plug flow (as mentioned previously).
(2)
Selection of operating conditions typically used in pyrolysis process (key variables: τ , T R , P R , and Q T i n ( T R , P R , y A ) ) and first evaluation of the reactor length L. These conditions, together with the estimation of the property required for parameter-L calculation (Equation (10)), i.e., the molecular diffusion coefficient D d i f for the binary system [octanoic acid (reagent)–nitrogen (carrier gas)], are listed in Table 2. Details of the estimation method used for parameter- D d i f are given in Appendix C [16,17,18,19]. Solving Equation (9) led to the physical meaning solution L = 0.49   m that was rounded to L = 0.55   m because of the dimensions of the available furnaces.
(3)
Given the L rounded value obtained in step 2, calculation of the reactor internal diameter d (Equation (7)). Here, again, the value obtained for parameter-d ( d = 8.3 10 3 m ) was rounded to the nearest inferior value corresponding to a standard diameter ( d = 8 10 3 m ).
(4)
Checking that the Pe criterion ( P e 50 ) is still satisfied in spite of the rounded values adopted for L and d parameters. Calculation of the mean real velocity for the gas reacting fluid and of the axial dispersion coefficient (u and D a x , respectively, Table 2) led to P e = 56 , allowing to conclude that the flow inside the actual reactor would be close to plug flow under these process operating conditions.
(5)
Checking the applicability range of the D a x correlation used (i.e., Equations (5b) and (5c)). Values calculated for Re and the terms involved in Equation (5c) (Table 2) helped to verify that this last step of L and d calculation procedure was achieved successfully.

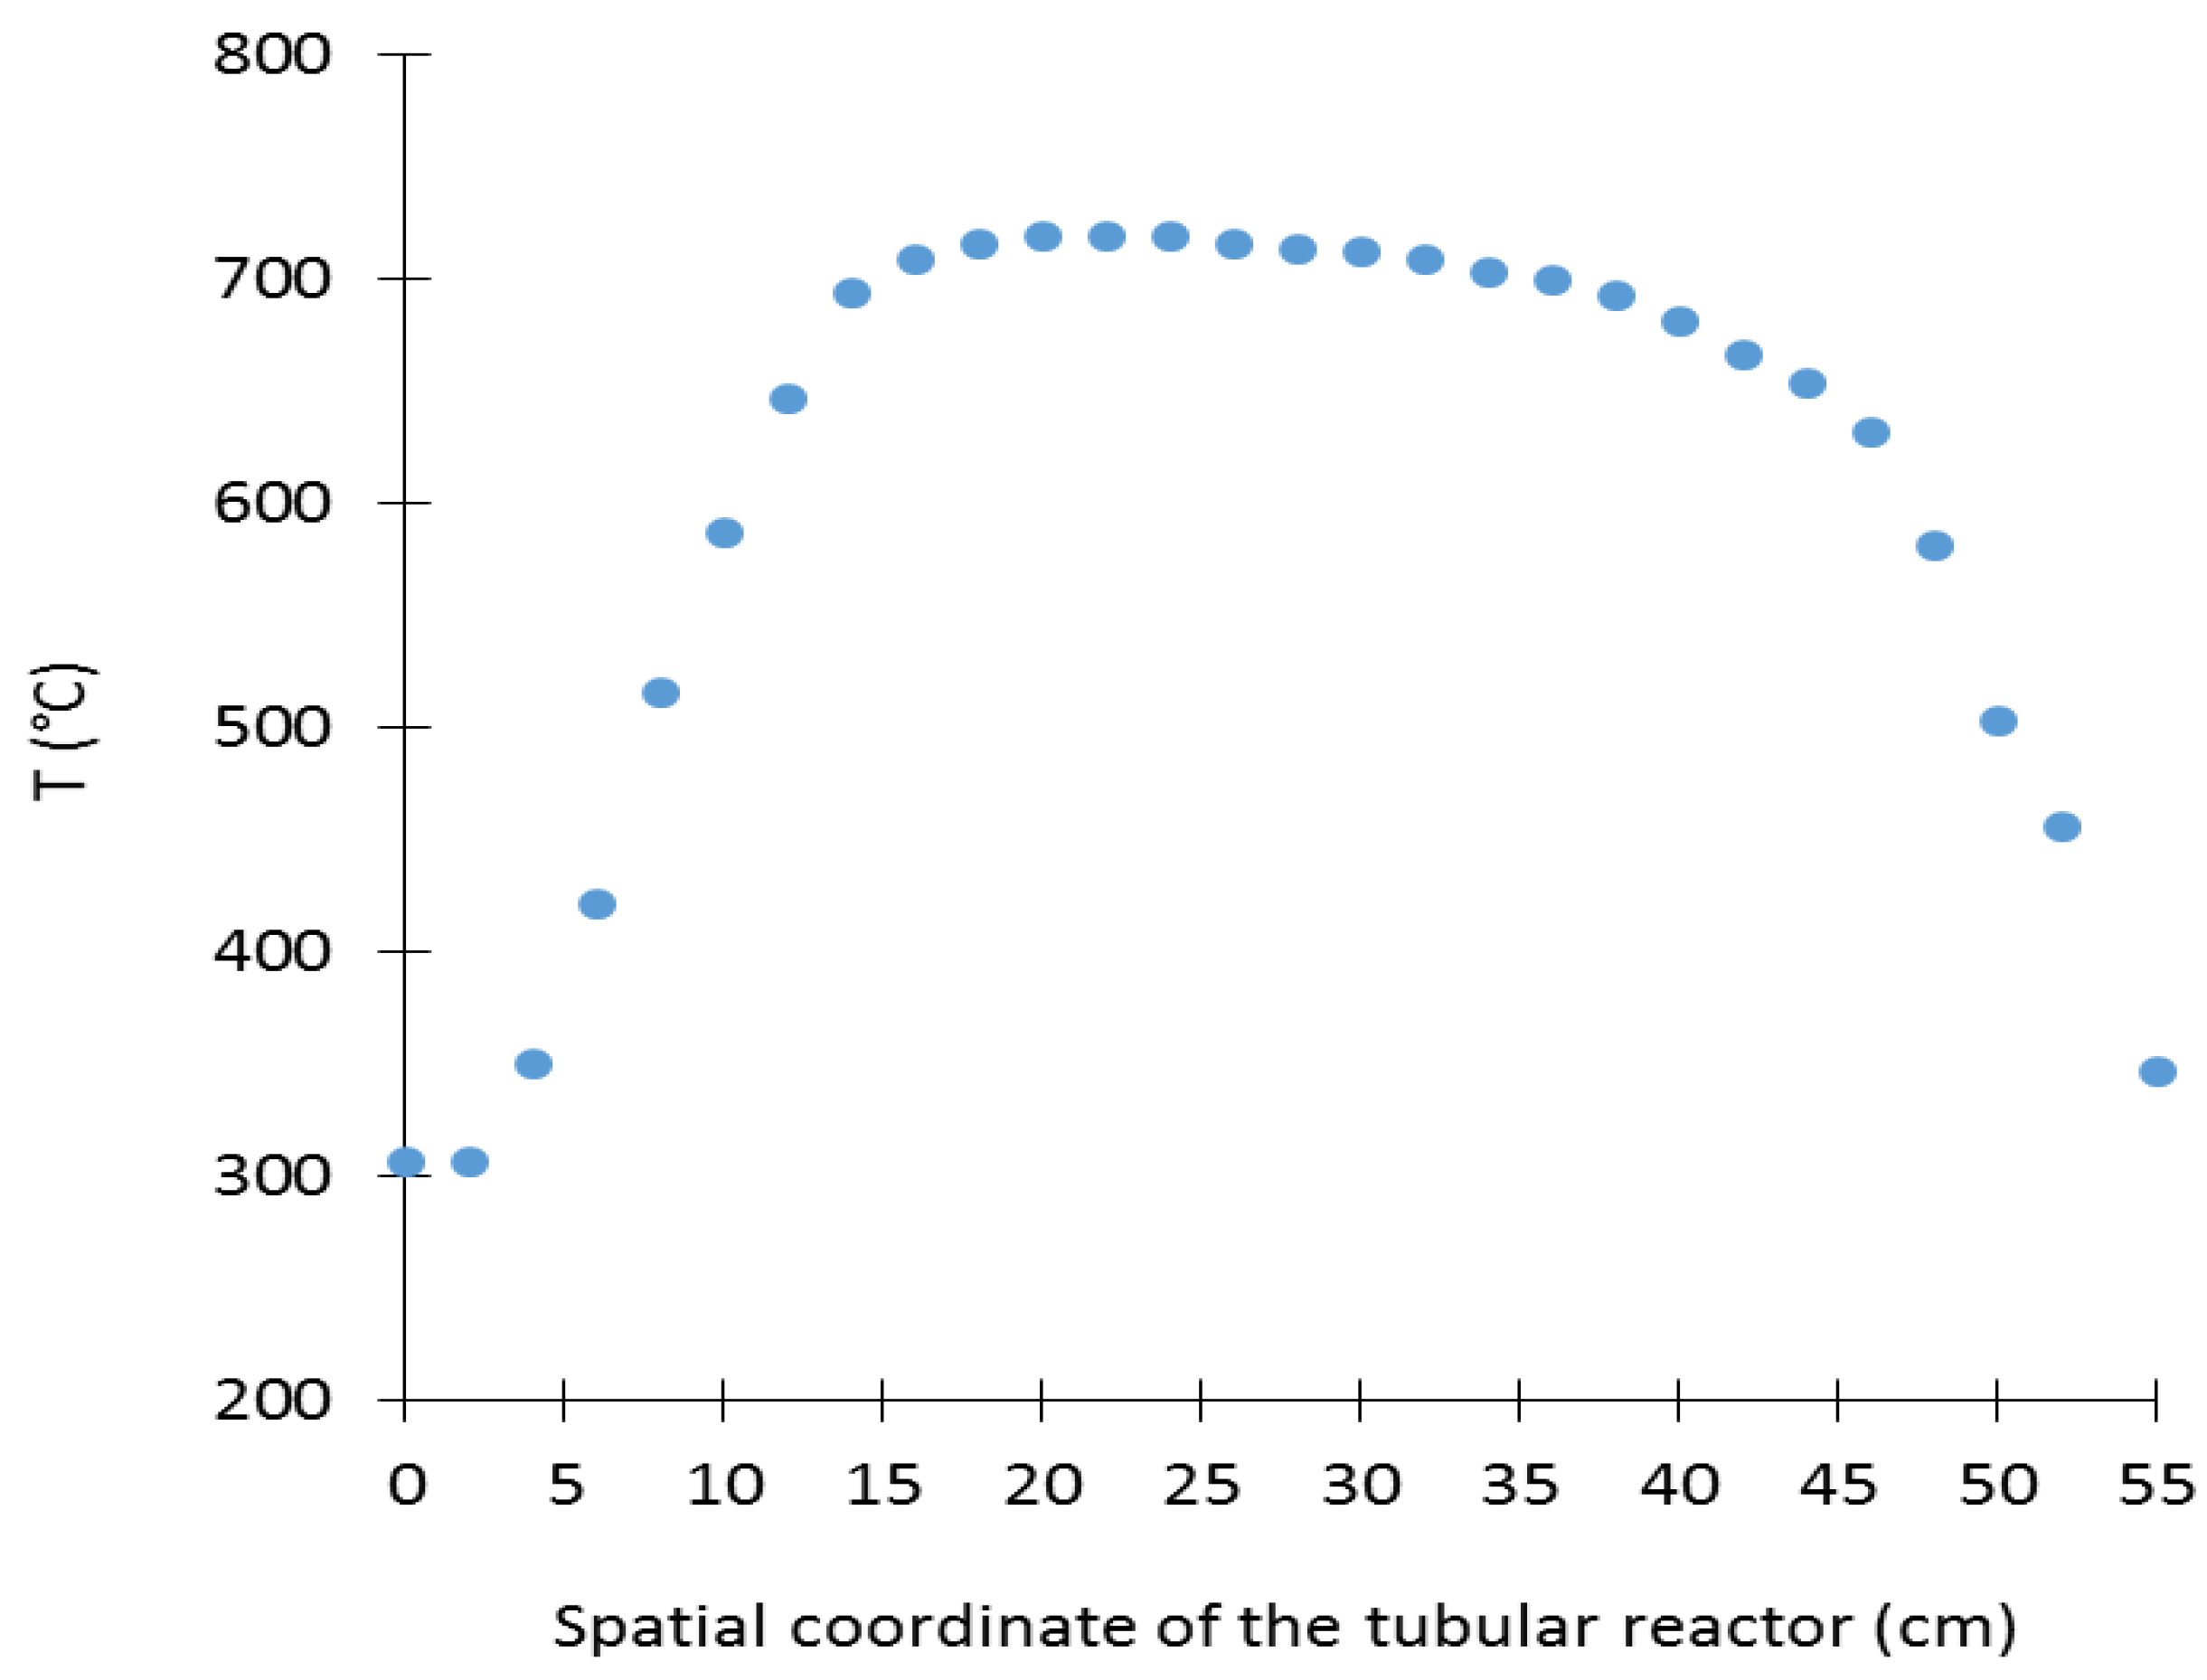
3.1.3. Checking the Validity of the Obtained Reactor Sizing for the Whole Experiments Planed in the Work

For the whole pyrolysis experiments planed, the tubular reactor will have to operate typically under P R   = 1.067   b a r and TR ranging from 600 to 900 °C, with a gaseous feed stream of molar composition 0.05 in reactant ( y A ) and of total volume flowrate Q T i n ( T R , P R , y A ) ranging from 1.5 to 6 L·min−1, the resulting τ ranging from 0.27 to 1 s. These operating conditions lead to values of the Pe criterion included in the interval [ 46 164 ] ) (with Re in the range [ 92 205 ] ) . One run corresponding to P R = 1.067   b a r , τ = 0.36   s , with T R = 600   ° C and Q T i n ( T R , P R , y A ) = 4.5   L min 1 which are extrema (respectively, minimum and maximum) operating conditions of the bench-scale setup, led to a slightly low Pe value ( P e = 46 ) but still very close to the limit condition ( P e 50 ) . Hence, it is allowed to consider that the designed tubular reactor will be close to a plug flow reactor for the whole experiments planed in the present work.

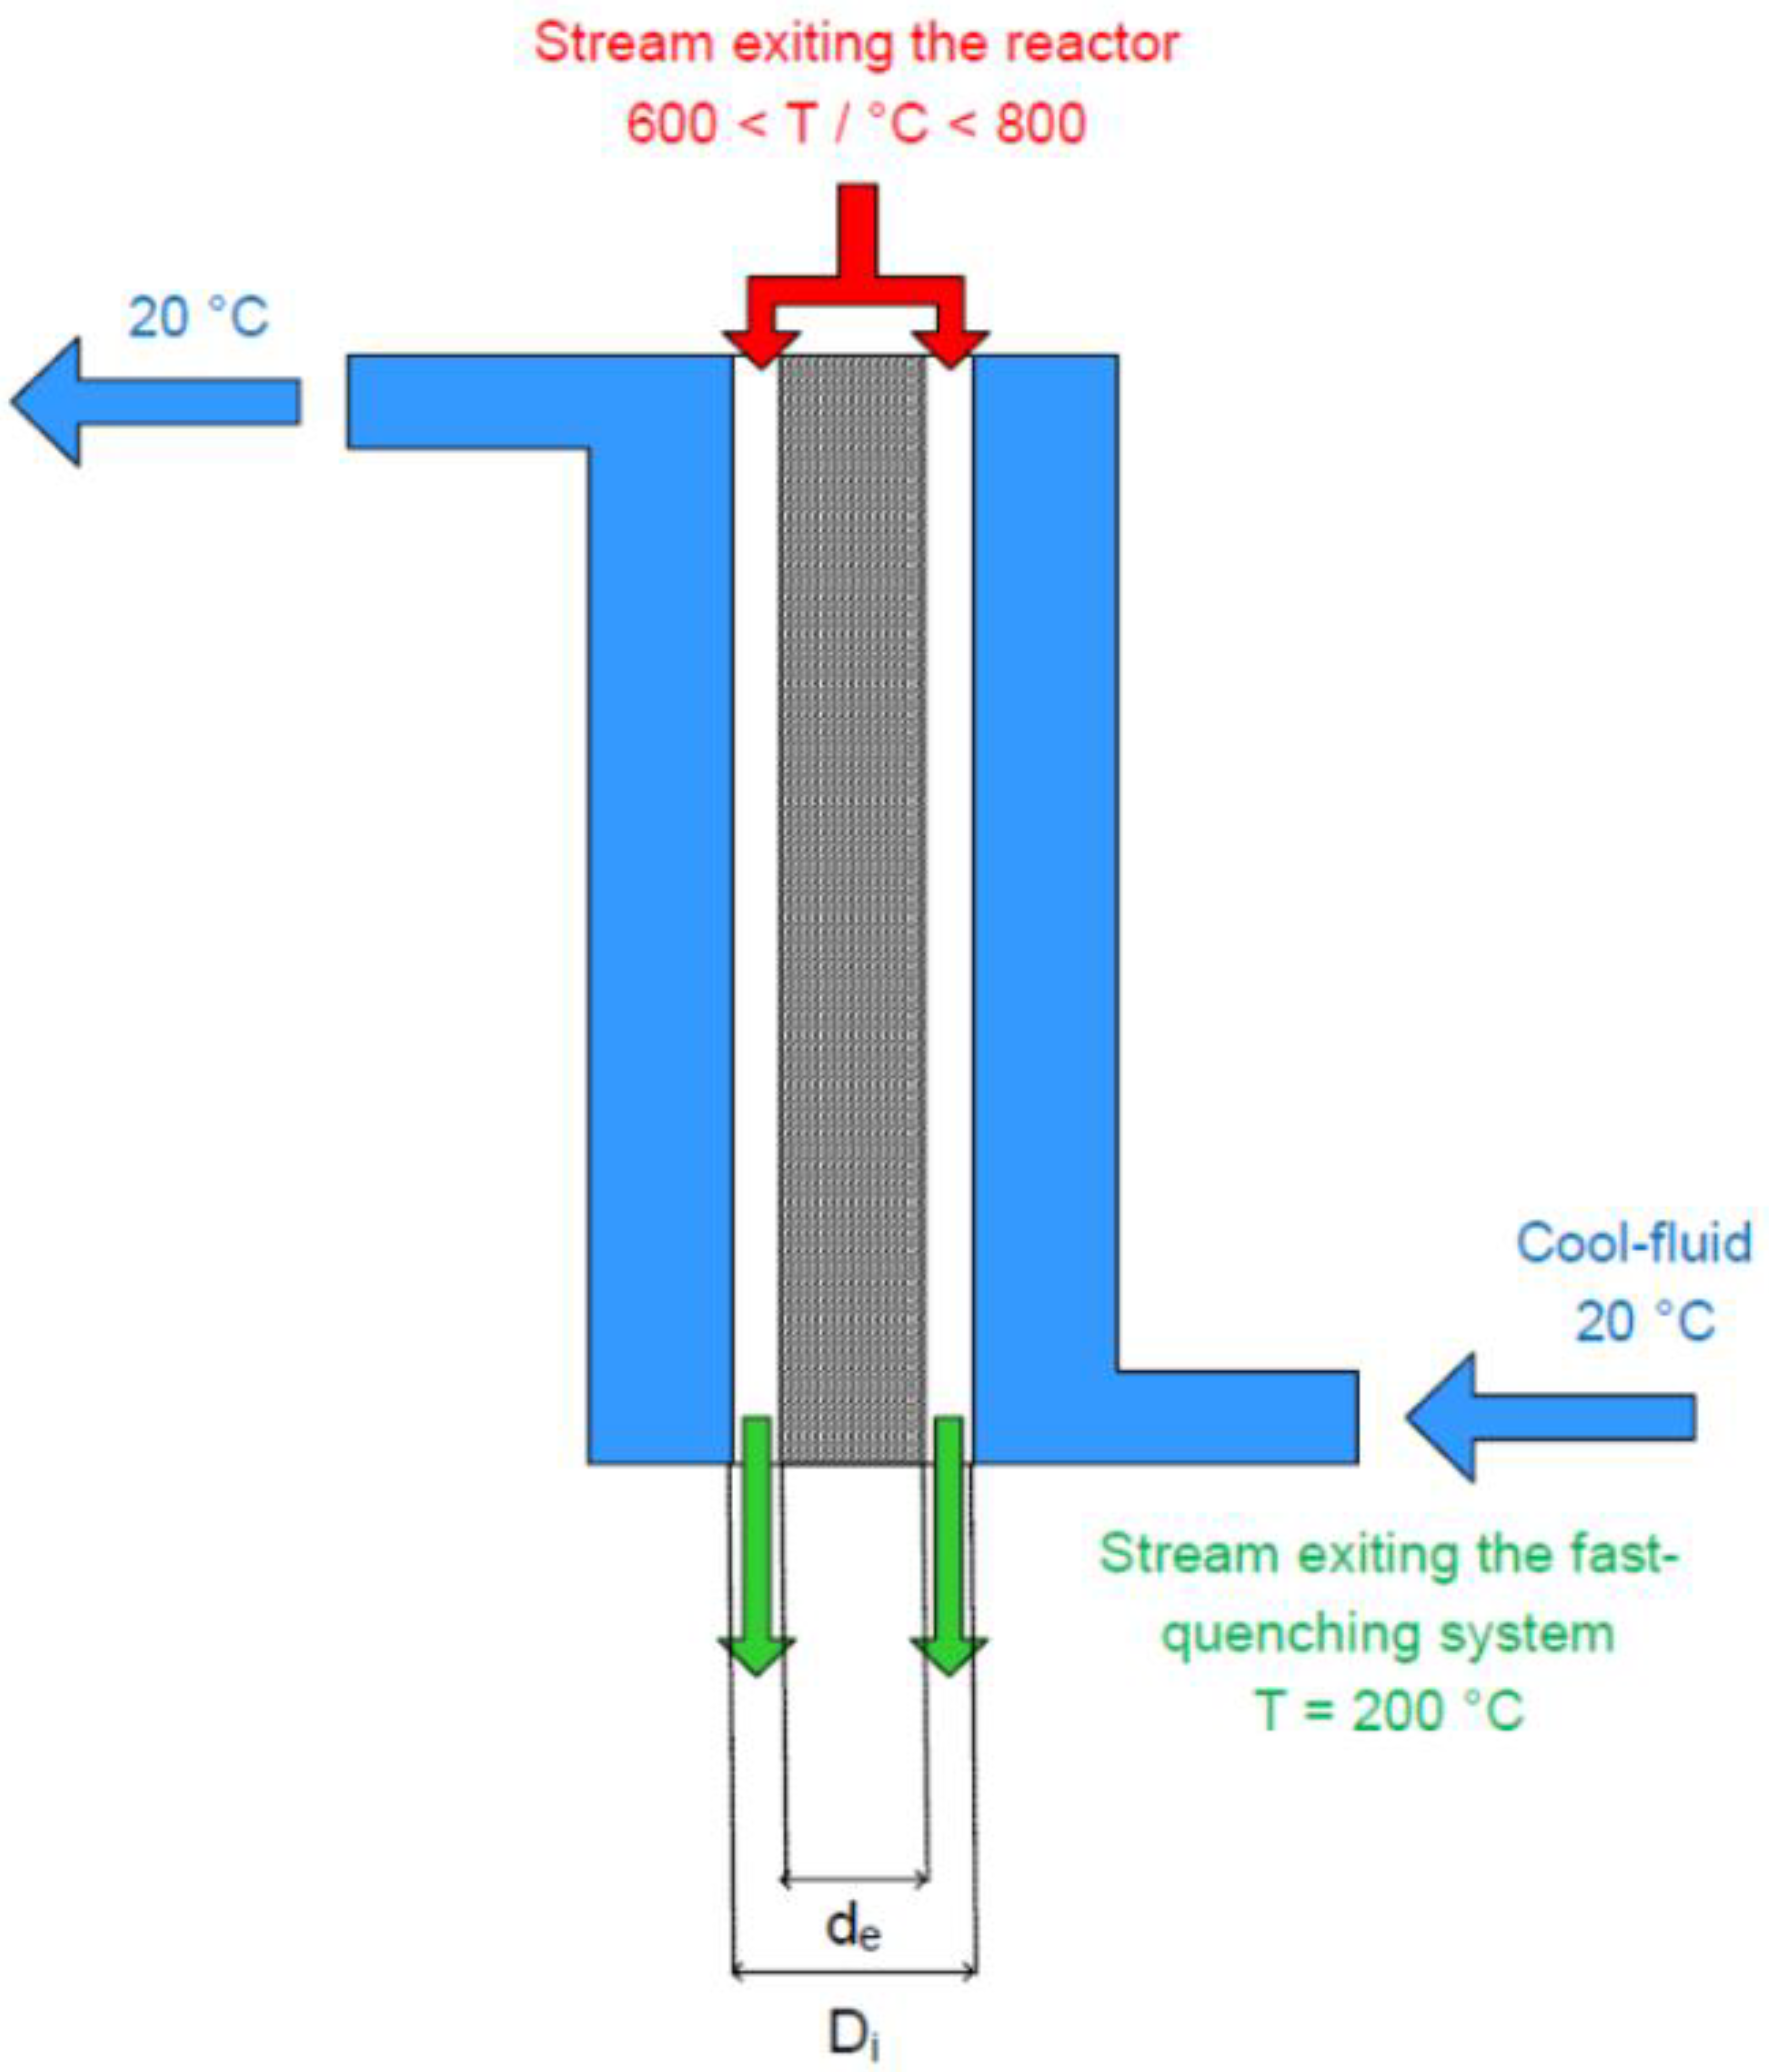
3.2. Fast Quenching System Design

The objective of the fast-quenching system is to cool the reactive gas mixture leaving the reactor almost instantaneously from 600 to 200 °C. This assumes that the time required for this operation be much smaller than the residence time of the feed stream inside the reactor. Thus, one could reasonably assume that the thermal reaction process only occurs inside the reactor and, therefore, is definitely stopped at the outlet. Within this context, the selected system was a quartz heat exchanger with an annular cross section where the heat would be transferred from the reacting fluid flowing inside the annular space to the outside wall. In practice, the heat exchanger (Figure 3) consisted of a central tube enclosed in a double-shell (two concentric pipes) in which the cool-fluid flows counter-currently to the warm-fluid and is maintained at low temperature (20 °C; Section 2.4). Within this geometric configuration, the annular space is then formed by the empty volume between the wall of the central tube (diameter d e ) and the inside wall of the double-shell inner pipe (internal diameter D i , length L).
With regard to the fast-quenching system sizing, when D i and d e diameters are given, the issue is to calculate the length L together with the duration t o p that is required to achieve the desired cooling stage. These calculations are described in the following section.

3.2.1. Equations Related to the Fast-Quenching System Sizing

The equality between the expression of the heat-transfer rate ϕ deriving from the enthalpy balance over the entire exchanger and that deriving from the heating surface area required for the exchanger sizing leads to:
ϕ = ρ   Q   C ¯   P ( T 1 T 2 ) = U   A   Δ T m .
The right-hand side of Equation (11) involves variables characteristic of the gas reacting mixture cooled from temperature T 1 to T 2 ( ρ , Q, and C ¯ P designate, respectively, the density, the volume flowrate, and the mass heat capacity at constant pressure of the fluid). All these variables were determined at the mean temperature T m = ( T 1 + T 2 ) / 2 (and at the inlet reactor pressure for ρ and Q). Regarding the left-hand side of Equation (11), variable U designates the overall heat-transfer coefficient based on the inside surface area A of the double-shell inner pipe which is in contact with the warm reacting fluid. The inside surface area A is then given by:
A = π   D i   L ,
and the overall heat-transfer coefficient U was reasonably approximated to the individual convective heat-transfer coefficient h G for the warm reacting fluid inside the double-shell inner pipe. Indeed, the individual thermal resistances related to the double-shell inner pipe and to the cool-fluid outside were small enough to be neglected in comparison with the individual thermal resistance of the warm-reacting fluid inside ( 1 / h G ). This offered the possibility to equate with sufficient accuracy u h G , allowing h G estimation from the Nusselt number definition:
u h G = λ   N u D h with D h = ( D i d e ) = 2 δ .
In Equation (13), D h and δ are, respectively, the hydraulic (or equivalent) diameter and the thickness of the annular space, while λ is the thermal conductivity of the reacting fluid (also calculated at T m ). Combination of Equations (11)–(13) leads to:
ρ   Q   C ¯ P   ( T 1 T 2 ) = λ 2 δ N u π   D i   L   Δ T m ,
which can be re-written as following in order to obtain an expression for the fast-quenching system length L:
L = 2 π Q   ρ   δ   C ¯ P   ( T 1 T 2 ) λ   Δ T m   D i   N u .
The logarithmic mean temperature difference Δ T m introduced from Equation (11) is calculated by:
Δ T m = T 1 T 2 ln ( T 1 T w c T 2 T w c ) ,
where T w c is the temperature of the double-shell inner pipe wall (cold-fluid side) considered constant and equal to the cooling-fluid temperature (20 °C) along the whole fast-quenching system length. This assumption agrees with the approximation made for the overall heat-transfer coefficient U. With respect to Nu estimation required in Equation (15), for laminar flow (Re < 2300) occurring in annular space, the following correlation is recommended [15]:
N u = ( 1 + 0.14 D i d e ) ( 3.66 + 0.19   G z 0.8 1 + 0.117   G z 0.467 ) + 1.2 ( D i d e ) 0.8 0.51 D i d e ,
where the Graetz number Gz is determined from Re (Equation (1) with D h used instead of d-variable) and the Prandtl number Pr ( Pr = C ¯ P   μ / λ ) according to:
G z = Re   Pr   D h L .
For t o p estimation, expression of the gas reacting fluid velocity u inside the annular space needs to be firstly determined. Being highly temperature-dependent, the gas reacting fluid velocity u varies considerably from point to point along the fast-quenching system length L. Therefore, t o p estimation required to start with a differential equation which is then integrated over the entire fast-quenching system length. From its physical meaning, t o p can be assimilated to the residence time of the reacting fluid inside the fast-quenching system that is required to achieve the desired cooling and then can be expressed as:
t o p = 0 L d x u ,
with
u = 4 π Q ( T N T P , P N T P , y ) ( D i 2 d e 2 ) T T N T P P N T P P = B T ,
where B is a constant (isobaric cooling without pressure drop). According to Equations (15) and (16), the abscissa x of the fast-quenching system where the gas reacting fluid has a temperature T can be expressed as:
x = 2 π Q ( T N T P , P N T P , y )   ρ   δ   C ¯ P λ   D i   N u ln ( T 1 T w c T T w c ) = A ln ( T 1 T w c T T w c ) ,
where A can be considered as a constant if assuming that Nu is invariant over the entire fast-quenching system length. Differentiation of Equation (21) gives:
d x = A T T w c d T ,
Which, combined with Equations (19) and (20), leads to the desired expression for t o p in terms of the operating conditions related to the cooling process and of the thermophysical properties related to the gas reacting fluid exiting the reactor (with a density at normal temperature and pressure conditions ρ N T P ):
t o p = C ¯ P   δ 2   ρ N T P   T N T P λ   T w c   N u P P N T P D + i d e D i ln ( T 1 T w c T 2 T w c T 2 T 1 ) .
Note that assuming Nu invariant in Equation (21), despite its dependency in terms of the fast-quenching system x-abscissa, leads to over-estimate t o p .
Finally, it is worth mentioning that developments described in this sub-section do not consider radiation heat-transfer. When this phenomenon is occurring, the given equations result in over-estimating the fast-quenching system length and the required cooling duration. Nevertheless, most of mono- and di-atomic gases, such as nitrogen, have almost no influence on radiation heat-transfer. As a result, developments described above are consistent within the context of the present work.

3.2.2. Calculation Procedure and Numerical Solving Related to the Fast-Quenching System Sizing

According to Equation (23), a very thin annular space is recommended to ensure a very fast cooling of the gas reacting fluid ( t o p proportional to δ 2 , Equation (23)). Therefore, an annular space with sizes D i = 8 mm and d e = 6 mm (corresponding to a thickness δ = ( D i d e ) / 2 = 1 mm) was selected. Furthermore, products formed during pyrolysis of the investigated compound (octanoic acid here) are not known prior reaction. These products are also highly diluted with nitrogen. Therefore, the gas reacting mixture entering the fast-quenching system was considered reasonably as pure nitrogen. Parameters required for estimation of the fast-quenching system length L and of the cooling duration t o p are listed in Table 3. Thermophysical properties for nitrogen were determined at T m = 673.15 K and P R = 1 atm. In addition, L and t o p calculation was made by considering the maximum volume flowrate allowed by the bench-scale experimental setup. Indeed, such an operating condition leads to over-estimate L and t o p parameters (Equations (15) and (23)).
The expression obtained for L (Equation (15)) involves Nu-number whose expression retained here involves in turn L-parameter via Gz-number (Equations (17) and (18)). Therefore, an iterative calculation procedure based on the combination of Equations (15)–(18) is required to obtain the desired L-parameter value. Results obtained over the successive iterations are listed in Table 4. Equation (23) leads then to the wanted t o p -parameter value: t o p = 3.9 10 3   s , i.e., t o p 4   m s . The obtained cooling time is very short compared to the minimum residence time τ min of the material flow in the reactor ( τ min 400   m s ). The sizing of the fast quenching performed at this stage is in full agreement with the objectives set and should have no effect on the kinetic data generated. Nevertheless, for technical reasons and to ensure a very efficient cooling even for other applications than the one developed in this work (i.e., for thermal reactions operating at temperatures higher than 1000 °C), a length of 10 cm was finally adopted for the fast-quenching system. The corresponding cooling duration of the warm reacting fluid exiting the reactor (with parameters of Table 3 invariant) is then t o p = 5   m s , which is still much less than the minimal residence time of the feed stream τ min ( 400   m s ).

4. Sample of Kinetic Data Generated with the Designed Bench-Scale Setup

The validity of the designed bench-scale PFR, including the fast-quenching system, was checked by performing two experiments of octanoic acid pyrolysis under the same operating conditions in order to assess repeatability and material balances. The repeatability was evaluated by considering the standard deviations (SD, Equation (24)) and the coefficients of variation (CV, Equation (25)) on the operating conditions and on the molar fractions of the reactant (octanoic acid) and of the major pyrolysis products. The material balances were considered in terms of C-H-O atoms (detailed calculations given in Appendix B).
S D = k = 1 N P ( v k v ¯ ) 2 N P 1 ,
C V ( % ) = S D v ¯ 100 ,
where v K is the variable (pyrolysis operating conditions or molar fractions of reactant or products) recorded during the kth experiment, the total number of which is N P , leading to an average value v ¯ .
Regarding the pyrolysis conditions of the experiments, these were selected in order to achieve typical values of three reaction parameters impacting significantly the chemical nature and amount of the products formed: reaction temperature, residence time, and extent of dilution of the reactant fluid.
Figure 4 displays the reactor temperature profile measured for the selected oven set point temperature. This temperature profile allows for estimating the average reactor temperature ( T R ) used to check the Pe criterion under the actual experiment conditions ( P e 50 ) . Moreover, for simulating octanoic acid pyrolysis with the tanks-in-series model, the reactor temperature profile is also required to define the reaction temperature of each of the N CSTRs (with N given by the Pe value calculated at T R ; Equation (3), Section 3.1).
Results, i.e., the standard deviations and coefficients of variation relating to the operating conditions, the reactant conversion, the material balances, and the chemical species molar fractions, are gathered in Table 5.
As it can be observed, the C-H-O element balances are very good. The largest deviations are obtained for the element O because some oxygenated species could not be quantified accurately (such as water, formaldehyde, and ethenone). Regarding the coefficient of variation, very high values are obtained for CO and CO2. This is very likely due to the analytical method used for quantifying these components (infrared analyzer; Appendix A [13]). Indeed, the observed levels of CO and CO2 are in the low detection limits of the equipment (thus involving larger errors of measurements). For the other species, values of the coefficient of variation are inferior to 10%, which is acceptable for GC analyses. Consequently, it can be said that the experiments for octanoic acid pyrolysis carried out in this work show a rather good repeatability. Such results could not be obtained if the reaction was not occurring under homogenous gas phase, with no wall-effects, through a plug flow reactor with appropriate Pe values, and with an efficient fast-quenching system to stop the pyrolysis reaction. Further experiments were generated with the bench-scale setup described in this work to establish a detailed kinetic model for octanoic acid pyrolysis (mechanism and reaction rates) [13] of which predictive performance is illustrated by Figure 5 and Figure 6. The detailed chemical kinetic mechanism proposed for octanoic acid pyrolysis [13] was mainly generated from EXGAS software [3,4,5,6,7]. Supplementary reactions, altogether with kinetic and thermodynamic properties of key reactions specific to carboxylic acids, were revisited on the basis of the literature or quantum calculations carried out during the work [13]. Considering the temperature profile along the tubular reactor, the Eulerian approach was selected for modeling the reactor as a succession of CSTRs in series and carrying out the pyrolysis simulations by using the PSR module of CHEMKIN II software [15]. The number of CSTRs was set to 55 in accordance with the number of measurements completed to define the temperature profile of the tubular reactor at a given oven set point (Figure 4). For all the supplemental pyrolysis experiments dedicated to the octanoic acid pyrolysis modeling [13], the tubular reactor was close to plug flow according to the Pe criterion (Pe ≥ 50). The whole of these results confirms the validity of the designed bench-scale setup, particularly regarding the tubular reactor and the fast-quenching system.

5. Conclusions

On the basis of a very simple approach, a bench-scale experimental setup devoted to gas phase kinetic data generation in laminar PFR at constant near-atmospheric pressure has been designed. Within the context of octanoic acid pyrolysis, a sample of kinetic data was generated with satisfactory measurement repeatability and material balances, validating the designed bench-scale setup. This result is obtained because the axial dispersion coefficient, in an empty tube, is much smaller in gas-phase than in liquid-phase, allowing a small sized tubular reactor to be close to the plug flow reactor. Such a feature of the axial dispersion coefficient is not well known by the wider public. The material described in this article should be particularly helpful for research projects dealing with pyrolysis, steam cracking, or oxidation of liquid biomass (such as waste cooking oil or bio-oil resulting from wood residue thermal-cracking).

Author Contributions

Conceptualization, E.P., J.-F.P., P.-A.G. and L.C.; methodology, E.P., J.-F.P., P.-A.G. and L.C.; software, J.G. and L.C.; validation, J.G., E.P., J.-F.P., P.-A.G. and L.C.; formal analysis, J.G.; investigation, J.G.; resources, F.B.; data curation, P.-A.G. and L.C.; writing—original draft preparation, L.C.; writing—review and editing, J.-F.P. and L.C.; visualization, J.-F.P. and L.C.; supervision, P.-A.G., F.B. and L.C.; project administration, F.B.; funding acquisition, F.B. and J.-F.P. All authors have read and agreed to the published version of the manuscript.

Funding

This research received no external funding.

Institutional Review Board Statement

Not applicable.

Informed Consent Statement

Not applicable.

Data Availability Statement

All the data related to this work are given in the manuscript.

Conflicts of Interest

The authors declare no conflict of interest.

Nomenclature

A E Chromatographic area of internal standard E
A i Chromatographic area of component i
F A i n Inlet octanoic acid molar flowrate
F e l e m e n y i n Inlet molar flowrate of the considered element
F N 2 i n Inlet nitrogen molar flowrate
F p r i m a r y   N 2 i n Inlet molar flowrate of the primary carrier gas feed (for partial vaporization of the liquid reagent)
F s e c o n d a r y   N 2 i n Inlet molar flowrate of the secondary carrier gas feed (for individual control of τ and reagent dilution)
F T i n Inlet total molar flowrate
F e l e m e n t o u t Outlet molar flowrate of the considered element
F i , c o n d o u t Molar flowrate of the outlet condensable component i
F j o u t Molar flowrate of product j encountered both in the gas phase and in the organic liquid phase
F j , o f f l i n e   G o u t Molar flowrate of the off-line detected incondensable product j in the outlet gas stream
F j , o n l i n e   G o u t Molar flowrate of the on-line detected incondensable product j in the outlet gas stream
K i / E Carbon response factor of component i compared with internal standard E for quantification by GC-FID analysis
m A i n Inlet mass of octanoic acid collected at equally spaced time intervals Δ t A = 10   min
m c o k e Mass of coke deposited during each experiment
m E Mass of internal standard E
m i , c o n d o u t Mass of the outlet condensable component i
m i n c o n d o u t Total mass of the detected incondensable products taken as a whole in the outlet gas stream
m j , o n l i n e   G o u t Mass of the on-line detected incondensable product j in the outlet gas stream
m j , o f f l i n e   G o u t Mass of the off-line detected incondensable product j in the outlet gas stream
m L o u t Mass of the outlet organic liquid phase product
M j Molecular weight of component j
M i , c o n d o u t Molecular weight of the outlet condensable component i
M j , o f f l i n e   G o u t Molecular weight of the off-line detected incondensable product j present in the outlet gas stream
M j , o n l i n e   G o u t Molecular weight of the on-line detected incondensable product j present in the outlet gas stream
P N T P Pressure related to normal temperature and pressure conditions ( P N T P ) = 1 a t m
P R Pressure at the inlet of the reactor (assumed constant until the outlet)
Q N 2 i n ( T N T P , P N T P ) Inlet volume flowrate related to nitrogen at T N T P and P N T P
Q T i n ( T R , P R , y A ) Total inlet volume flowrate at T R and P R for a molar fraction y A in reactant A (octanoic acid here)
R Ideal gas constant ( R = 8.314411   J m o L 1 K 1 )
T N T P Temperature related to normal temperature and pressure conditions ( T N T P = 273.15   K )
T R Average reactor temperature
V R Reactor volume
x i , c o n d o u t Molar fraction related to the outlet condensable component i
x ¯ i , c o n d o u t Mass fraction related to the outlet condensable component i
y j Molar fraction of component j in the gas phase
y ¯ j Mass fraction of component j in the gas phase
y j , o f f l i n e   G o u t Molar fraction of the off-line detected incondensable product j in the outlet gas stream
y ¯ j , o n l i n e   G o u t Mass fraction of the on-line detected incondensable product j present in the outlet gas stream
Greek symbols
Δ t A Time intervals during which reactant A (octanoic acid) is collected in order to determine its molar flowrate ( Δ t A = 10   min )
Δ t exp Duration of experiment
ν e l e m e n t k Stoichiometric coefficient of “element” in the chemical formula of component k
ν e l e m e n t A Stoichiometric coefficient of “element” in the chemical formula of octanoic acid
ϑ J , o n l i n e   G o u t Volume fraction of the on-line detected incondensable product j in the outlet gas stream
τ Residence time of the feed

Appendix A. Reaction Product Analysis Description

This section gives further details of the products from octanoic acid pyrolysis collected as three phases, i.e., gas, liquid, and solid (coke), together with the techniques selected for their analysis. Operating conditions related to gas chromatography were gathered in Table A1 [13].

Appendix A.1. Gaseous Products

These are hydrogen (H2), carbon monoxide (CO), carbon dioxide (CO2), and hydrocarbons having a carbon number inferior to 4 (C1-C4 cut). All of them were analyzed continuously during the experiment by on-line (for CO and CO2) or off-line (for H2 and C1-C4 cut) equipment. In addition, standard gas mixtures were used for calibration (and identification concerning the C1-C4 cut). CO and CO2 were analyzed by a non-dispersive infrared (NDIR) analyzer (Cosma Cristal 300), while H2 and the C1-C4 cut were analyzed by two gas chromatographs (GC) equipped with different detectors for suitable analysis: a thermal conductivity detector (TCD) for H2 and a flame ionization detector (FID) for the C1-C4 cut. This equipment allows quantification of CO, CO2, and H2 in terms of percent volume fractions in the whole gas product (equivalent to percent molar fractions with regards to the ideal gas law), while quantification of the C1-C4 cut components is obtained in terms of percent mass fractions in the gas product excluding CO, CO2, H2, and the inert carrier gas.

Appendix A.2. Liquid Products

Usually, the thermal cracking liquid product contains a wide variety of components with various functional groups. Therefore, a gas chromatography-mass spectrometry (GC-MS) technique was primarily used for component identification (which includes matching of retention times against known standard compounds under identical GC conditions together with analysis of GC mass spectra, thanks to spectral libraries). Nevertheless, for some experiments, a small fraction of components could not be identified using the available GC-MS database and were termed “unidentified” fraction. Quantification of the identified liquid components (i.e., the condensable cracking products and the non-converted octanoic acid) was achieved by using two GC-FID associated with the widely used internal standard method (internal standards selected: n-octane for the condensable products and n-dodecane for octanoic acid).

Appendix A.3. Coke

Thermal cracking involves coke formation. Coke deposited by successive layers on the reactor walls must be quantified to account for it in the mass balance. In addition,, decoking the internal surface of the reactor is necessary to have a good reproducibility of the experiments (constant cross-sectional area of the tubular reactor from one experiment to another), as well as to avoid plugging (and other problems in downstream unit operations). The amount of coke deposit was determined by complete combustion (Equation (A1)) and analyzing the resulting CO and CO2 emissions. Details of the procedure are given in Appendix B (Section Appendix B.1).
2   C   ( c o k e ) +   3 2   O 2 C O   +   C O 2
Table A1. Conditions of gas chromatography analyses [13].
ConditionsH2Non-Condensable Gas
(Excluding H2, CO, and CO2)
Condensate a
(Excluding Octanoic Acid)
Condensate a
(Exclusively Octanoic Acid)
GC-typeIntersmat IGC 11-typeSchimadzu GC 17ASchimadzu GC 17AStang ST 200
DetectorTCDFIDFIDFID
Detector temperature/°C-310310280
Injector temperature/°C-300300270
Carrier gas (N2) volume flowrate (NmL/min) or linear velocity (cm/s)30 NmL/min15 cm/s15 cm/s0.91 NmL/min
Split ratio-1/1001/1001/160
ColumnSilica-gel filled column/molecular sieve (5Å thickness)
5 m length, 6 mm inner diameter
Bonded non-polar (methyl silicone) capillary column (P.O.N.A.-type, Hewlet Packard)
50 m, 0.21 mm, 0.5 μm film thickness
Bonded non-polar (methyl silicone) capillary column (P.O.N.A.-type, Hewlet Packard)
50 m, 0.21 mm, 0.5 μm film thickness
Polyethyleneglycol capillary column (CP-Wax 52CB, Chrompack)
50 m, 0.32 mm, 0.2 μm film thickness
Oven temperature program60 °C60 °C (4 min), 60–180 °C (10 °C/min, 10 min), 180–300 °C (10 °C/min)60 °C (20 min), 60–300 °C (2 °C/min, 40 min60 °C (10 min), 60–240 °C (10 °C/min, 32 min)
Column pressure program-96 kPa (4 min), 96–153 kPa (2.4 kPa/min, 10 min), 153–182 kPa (2.4 kPa/min)124 kPa (20 min), 124–182 kPa (0.5 kPa/min, 44 min)-
a The GC-FID system was calibrated by determining a carbon response factor compared with the internal standard (IS) both for each identified product and for the unconverted reagent (octanoic acid). To cover a wider range of retention times, two IS were used. As previous tests showed that neither n-octane nor n-dodecane were formed during octanoic acid pyrolysis (under the investigated reaction conditions), n-octane was selected as IS for all observed products, whereas n-dodecane was used as IS to quantify the non-converted octanoic acid fraction.

Appendix B. Designed Bench-Scale Setup Procedure and Material Balances

This section is dedicated to the operating procedure of the designed bench-scale setup together with the material balances selected as criteria for validating any experiment generating pyrolysis kinetic data.

Appendix B.1. Operating Procedure

Before each run, the exact partial molar flowrate of reagent (octanoic acid) at the inlet of the reactor ( F a i n ) was determined by operating without thermal reaction. Hence, while the vaporizer was maintained at 170 °C (temperature determined during previous tests as leading to vaporization of a sufficient amount of octanoic acid), the reactor, together with the mixing and preheating unit, were heated firstly at 180 °C to avoid thermal cracking, as well as condensation of octanoic acid. Then, the liquid product collected in the gas-liquid separator could be assumed to be exclusively pure octanoic acid (assumption verified by GC measurement) and the mass of liquid product m A i n collected at equally spaced time intervals Δ t A (determined by double weighting of the gas-liquid separator including the padding cotton at Δ t A = 10   min ) allowed experimental determination of F a i n according to:
F a i n = m A i n M A 1 Δ t A ,
where M A is the molecular weight of octanoic acid. In addition, it is worth mentioning that m A i n was considered for F A i n determination once steady state was reached (i.e., when m A i n led to a time independent value for F A i n ). Moreover, the mole fraction of octanoic acid in the reactor inlet stream can be determined by:
y A i n = F A i n F A i n + F N 2 i n ,
with
F N 2 i n F N 2 o u t = Q N 2 i n ( N T P ) P N T P R T N T P ,
where Q N 2 i n ( N T P ) is the nitrogen volume flowrate supplied via mass flow controller at normal temperature and pressure (T = 273.15 K and P = atm). Due to the very low solubility of N2 in octanoic acid, the partial molar flowrate of N2 could be considered invariant all along the experimental setup, from the carrier gas feed unit ( F N 2 i n ) to the reaction product analysis unit ( F N 2 o u t ).
After this preliminary stage aimed at determining experimentally the exact partial molar flowrate of reagent entering the reactor, the vaporizer was maintained at constant temperature (170 °C) and the desired operating conditions were set: volume flowrate of secondary N2 (preheated to 170 °C) if required to increase the dilution or residence time of the feed, temperature of the mixing and preheating unit of the reactor feed (300 °C for all runs), and temperature of the furnace.
Then, took place the experimental setup transient state, the end of which was determined when all operating conditions (reactor pressure and temperatures of the different units), as well as H2, CO, and CO2 emissions (percent fractions measured every 2 min), were stationary (actually, the CO&CO2 NDIR analyzer, as well as the H2 GC, were the two key fittings for monitoring the steady-state operation). When the end of the transient state was reached, the reactant flow exiting the condenser was directed through the steady state transfer line, giving the starting point of the experiment. Each run was carried out for a period of 30 to 60 min, during which the liquid product was collected (in the gas-liquid separator for weighing and GC analysis at the end of the run), while the gas product was continuously analyzed (with the on-line NDIR analyzer and the off-line GCs) at equally spaced time intervals (5 min for CO, CO2, and H2, 15 min for the other non-condensable components of the gas product). Gas product sampling for off-line GC analysis was carried out using a gas bulb located after the gas-liquid separation unit.
At the end of the experiment, the gas effluent leaving the reactor was directed through the transitory transfer line (thanks to the 3-way valves), and the gas-liquid separator was removed from the setup for further analysis.
Then, decoking was carried out as follows. After each reaction run, the reactor was heated at very high temperature (furnace temperature: 900 °C), while a mixture of nitrogen and air (0.3 and 0.7 NL/min, respectively) was passed through it to burn off the coke formed during the run. In order to optimize decoking, it was decided to proceed by successive oxidation cycles followed by integration on the entire oxidation duration. Therefore, the air volume flowrate was increased by stages at the end of each oxidation cycle while maintaining constant the total volume flowrate of the N2 and air mixture. For each decoking cycle, percent volume fractions of CO and CO2 ( ϑ C O , k c o k e   % and ϑ C O 2 , k c o k e   % , respectively) were read on the NDIR analyzer at equally spaced time intervals ( Δ t k = 2 minutes), while the total volume of the gas product (CO, CO2, N2, and air) was read on the gas meter at ambient temperature and pressure ( V k c o k e ( T a , P a ) ) . When the decreasing ϑ C O , k c o k e   % and ϑ C O 2 , k c o k e   % parameters reached constant values, the air volume flowrate was again increased for a new oxidation cycle at constant total volume flowrate (for example, the same value 0.5 NL/min for air and N2). When the ϑ C O , k c o k e   % and ϑ C O 2 , k c o k e   % parameters remained constant, close to zero, despite increasing the air input, all the coke deposit was assumed to be removed from the inner surface of the reactor and the decoking ended. Integration, over all the decoking duration, of ϑ C O , k c o k e   % , ϑ C O 2 , k c o k e   % and V k c o k e ( T a , P a ) parameters recorded during each oxidation cycle yields the mass of coke deposit m c o k e according to Equation (A5), where the gas product was assumed to follow the ideal gas law.
m c o k e = P a R T a { K V k c o k e ( T a , P a ) ( y C O , k c o k e + y C O 2 , k c o k e ) M C } ,
where y j , k c o k e is the mole fraction of specie j (CO or CO2) measured at time k (equal to the volume fraction ϑ j , k c o k e according to the ideal gas law), and M C is the carbon molecular weight. Finally, the mass of the liquid product collected during each run was determined by weighing of the gas-liquid separator (including padding cotton) at the beginning and the end of the experiment, while composition was obtained by GC analysis.

Appendix B.2. Material Balances

Each experiment was validated by calculating balances in terms of C-H-O element mole number between the inlet and the outlet of the reactor. The C-H-O element mole balances were calculated given the pressure and temperature of the reactor, the volume flowrates of primary and secondary N2 (at normal temperature and pressure, i.e., 273.15 K and 1 atm), and the duration of each run, together with other variables measured along the total run period: • mass of octanoic acid entered into the reactor ( m A i n ), • mass of the liquid product collected in the gas-liquid separator ( m L o u t ), • mass of the coke deposit ( m c o k e ), • mass of the gas product (obtained by: m i n c o n d o u t = m A i n m L o u t m c o k e , thanks to the observation that no material leak was detected during the run); these measurements were of course completed with the percent mole fractions of the identified components in the gas phase and the mass of the identified organic components in the liquid product representing the further termed organic liquid phase (OLP) product, in addition of the molecular formulae of all species formed. The main general equations used to check the C-H-O element mole balances for each run are given in Table A2.
Table A2. General equations related to the C-H-O element mole balances made on the designed experimental setup a.
Equations Related to the Inlet of the Reactor
• For the Reagent Liquid Feed (Octanoic Acid)
F A i n = m A i n M A 1 Δ t A (A6)
• For the Carrier Gas Feed (Nitrogen)
F N 2 i n = P N T P Q N 2 i n ( T N T P , P N T P ) R T N T P (A7)
• Residence Time of the Feed
τ = V R / Q T i n ( T R , P R , y a ) (A8)
with   Q T i n ( T R , P R , y A ) = F T i n R T R P R ,   y A = F A i n / F T i n (A9)
F T i n = F A i n + F N 2 i n ,   and   F N 2 i n = F p r i m a r y   N 2 i n + F s e c o n d a r y   N 2 i n (A10)
Equations Related to the Outlet of the Reactor b
• Partial Molar Flowrate for Organic Liquid Phase (OLP) Components
-Weight and Molar Fractions
F i , c o n d o u t = m i , c o n d o u t M i , c o n d o u t Δ t exp      with      m i , c o n d o u t = m E K i / E A i A E (A11)
x ¯ i , c o n d o u t = m i , c o n d o u t m i , c o n d o u t and   x i , c o n d o u t = x ¯ i , c o n d o u t / M i , c o n d o u t ( x ¯ i , c o n d o u t / M i , c o n d o u t ) (A12)
• Intermediate Normalization of the Detected Incondensable Components (Gaseous Products)
y j / y j where j is either an on-line or an off-line quantified product.(A13)
For an on-line quantified product: y j = y j , o n l i n e   G o u t = ϑ j , o n l i n e   G o u t
For an off-line quantified product: y j = y j , o f f l i n e   G o u t = y ¯ j / M j y ¯ j / M j with   y ¯ j ( % ) = A j A j 100 (A14)
• Total Mass of All Incondensable Products
m i n c o n d o u t = m A i n m L o u t m c o k e (A15)
• Partial Molar Flowrate for the On-line Detected Incondensable Products (H2, CO, and CO2)
y ¯ j , o n l i n e   G o u t = y j , o n l i n e   G o u t M j , o n l i n e   G o u t ( M j , o n l i n e   G o u t y j , o n l i n e   G o u t ) + ( 1 y j , o n l i n e   G o u t ) M N 2 (A16)
where   y j , o n l i n e   G o u t = ϑ j , o n l i n e   G o u t
F j , o n l i n e   G o u t = m j , o n l i n e   G o u t M j , o n l i n e   G o u t Δ t exp with   m j , o n l i n e   G o u t = ( m i n c o n d o u t + F N 2 i n M N 2 Δ t exp ) y ¯ j , o n l i n e   G o u t (A17)
• Partial Molar Flowrate for the Off-line Detected Incondensable Products (Other Gases than H2, CO, and CO2)
m j , o f f l i n e   G o u t = m i n c o n d o u t y j , o f f l i n e   G o u t (A18)
F j , o f f l i n e   G o u t = m j , o f f l i n e   G o u t M j , o f f l i n e   G o u t Δ t exp (A19)
Partial Molar Flowrate for Components Encountered both in the Gas Phase and in the Organic Liquid Phase
F j o u t = F j , o f f l i n e   G o u t + m i , c o n d o u t / ( M i , c o n d o u t Δ t exp ) (A20)
Final Normalization of all Detected Component Molar Fractions as a Whole
y k ( % ) = ( F k o u t / F k o u t ) 100 (A21)
with   F k o u t = F j , o n l i n e   G o u t for on-line detected gaseous products,(A22)
    F k o u t = F j , o f f l i n e   G o u t for off-line detected gaseous products,(A23)
    F k o u t = F i , c o n d o u t for the organic liquid phase products,(A24)
    F k o u t = m c o k e M C Δ t exp for   the   coke   deposit   ( with   M C = 12.01145 ),(A25)
    and   F k o u t given by Equation (A20) for components encountered both in the organic liquid phase and in the gas phase.
Carbon-Hydrogen-Oxygen Element Mole Balance Equations (%)
( F e l e m e n t i N F e l e m e n t o u t ) F e l e m e n t i n 100 (A26)
with   F e l e m e n t i n = ν e l e m e n T A F A i n ,   F e l e m e n t o u t = ν e l e m e n t k F k o u t , and element = C, H, or O.
a The meaning of each variable is described in the nomenclature section. b The partial molar flowrate of N2 between the inlet and the outlet of the reactor is invariant. The total mass of coke deposited is given by Equation (A5) (Appendix B.1).

Appendix C. Estimation Method for the Molecular Diffusion Coefficient D d i f –Application to Low Pressure Binary Gas-Phase Diffusion

This section covers briefly the estimation method used in this work for representing diffusion in the reacting mixture that flows along the designed tubular reactor. It should be recalled that, because pyrolysis products could not be known before experiments, the binary system feeding the reactor, i.e., [octanoic acid (reagent)–nitrogen (carrier gas)], was considered for representing the diffusion in the reacting mixture. In addition, the designed tubular reactor is devoted to kinetic collection at constant near-atmospheric pressure.
Various semi-empirical methods were proposed in the literature for estimating the diffusion coefficients for binary gas systems at low pressures. A modified version of the method by Wilke and Lee [17] was adopted in this work. This version generally agrees with experimental values to 5% (although discrepancies of around 20% are possible for binary systems involving polar molecules with long carbon chain). The expression proposed for the diffusion coefficient D d i f of the binary mixture of A and B is:
D d i f = 7.28 10 8 m ( 4.340 m ) T 3 / 2 P ( V A 1 / 3 + V B 1 / 3 ) 2 F ( z ) ,
where m = 1 M A + 1 M B , F ( z ) = ( 0.072 z 4.12 + 0.0062 z 1.25 ) 0.125 , and
z = T 0.77 T C A + T C B .
Variables T and P are, respectively, temperature (in K) and pressure (in bar), whereas V A and V B are molar volume (in c m 3 m o l 1 ) of pure liquid components A and B at their normal boiling point. In these equations, pure components A and B are also characterized by their molecular weights M A and M B (in g m o l 1 ) and their critical temperatures T C A and T C B (in K).
For the estimation of octanoic acid pure liquid molar volume at its normal boiling point, the method by Le Bas [18,19] was adopted. Based on the group contribution concept, the method is very simple and yields a mean deviation of 4% for the whole of the compounds investigated by the authors.
Calculation of the molecular diffusion coefficient is briefly detailed in the following at T = 1000 K and P = 1.067 bar corresponding to a set of octanoic acid pyrolysis operating temperature and pressure. By denoting octanoic acid A (reagent) and nitrogen B (carrier gas), the required properties are: M A = 144.214   g m o l 1 , M B = 28.013   g m o l 1 , T C A = 694.26   K ,   T C B = 126.20   K , and V B = 31.2   c m 3 m o l 1 (DIPPR database from ProII [16]). For component A ( C 8 H 16 O 2 ) , the method by Le Bas led to:
V A = 8 ( 14.8 ) + 16 ( 3.7 ) + 2 ( 12.0 ) = 201.6   c m 3 m o l 1 .
Thus, using Equation (A28), we obtain: m = 0.20647 , z = 4.3875 , and F ( z ) = 0.42862 , leading, finally, with Equation (A27), to: D d i f = 5.644 10 5   m 2 s 1 .

References

  1. Ganley, J.C. A homogeneous chemical reactor analysis and design laboratory: The reaction kinetics of dye and bleach. Educ. Chem. Eng. 2015, 12, 20–26. [Google Scholar] [CrossRef]
  2. Kee, R.J.; Rupley, F.M.; Miller, J.A. Chemkin II. A Fortran Chemical Kinetics Package for the Analysis of a Gas-Phase Chemical Kinetics; Sandia Laboratories Report, SAND 89-8009B; Sandia National Lab.: Livermor, CA, USA, 1993. [Google Scholar]
  3. Warth, V.; Stef, N.; Glaude, P.A.; Battin-Leclerc, F.; Scacchi, G.; Côme, G.M. Computer-Aided Derivation of Gas-Phase Oxidation Mechanisms: Application to the Modeling of the Oxidation of n-Butane. Combust. Flame 1998, 114, 81. [Google Scholar] [CrossRef]
  4. Glaude, P.A.; Battin-Leclerc, F.; Judenherc, B.; Warth, V.; Fournet, R.; Côme, G.M.; Scacchi, G.; Dagaut, P.; Cathonnet, M. Experimental and Modelling Study of the Gas-Phase Oxidation of Methyl and Ethyl-tert-Butyl Ethers. Combust. Flame 2000, 121, 345–355. [Google Scholar] [CrossRef]
  5. Buda, F.; Bounaceur, R.; Warth, V.; Glaude, P.A.; Fournet, R.; Battin-Leclerc, F. Progress Toward a Unified Detailed Kinetic Model for the Autoignition of Alkanes from C4 to C10 Between 600 and 1200 K. Combust. Flame 2005, 142, 170–186. [Google Scholar] [CrossRef]
  6. Vanhove, G.; Minetti, R.; Touchard, S.; Fournet, R.; Glaude, P.A.; Battin-Leclerc, F. Experimental and Modelling Study of the Autoignition of 1-Hexene / Iso-octane Mixtures at Low Temperature. Combust. Flame 2006, 145, 272–281. [Google Scholar] [CrossRef] [Green Version]
  7. Moss, J.T.; Berkowitz, M.; Oehlschlaeger, M.A.; Biet, J.; Warth, V.; Glaude, P.A.; Battin-Leclerc, F. An Experimental and Kinetic Modelling Study of the Oxidation of the Four Isomers of Butanol. J. Phys. Chem. A 2008, 112, 10843–10855. [Google Scholar] [CrossRef] [PubMed] [Green Version]
  8. Gornay, J.; Coniglio, L.; Billaud, F.; Wild, G. Octanoic Acid Pyrolysis in a Stainless-Steel Tube: What is the Role of the Coke Formed on the Wall? J. Anal. Appl. Pyrolysis 2010, 87, 78–84. [Google Scholar] [CrossRef]
  9. Gornay, J.; Coniglio, L.; Billaud, F.; Wild, G. Steam Cracking and Steam Reforming of Waste Cooking Oil in a Tubular Stainless-Steel Reactor with Wall Effects. Energy Fuels 2009, 23, 5663–5676. [Google Scholar] [CrossRef]
  10. Coniglio, L.; Bennadji, H.; Glaude, P.A.; Herbinet, O.; Billaud, F. Combustion Chemical Kinetics of Biodiesel and Related Compounds (Methyl and Ethyl Esters): Experiments and Modeling Advances and Future Refinements. Prog. Energy Combust. Sci. 2013, 39, 340–382. [Google Scholar] [CrossRef] [Green Version]
  11. Mohan, D.; Pittman, C.U.; Steele, P.H. Pyrolysis of Wood/Biomass for Bio-oil: A Critical Review. Energy Fuels 2006, 20, 848–889. [Google Scholar] [CrossRef]
  12. Ferrando, N.; Gedik, I.; Lachet, V.; Pigeon, L.; Lugo, R. Prediction of Phase Equilibrium and Hydration Free Energy of Carboxylic Acids by Monte Carlo Simulations. J. Phys. Chem. B 2013, 117, 7123–7132. [Google Scholar] [CrossRef] [PubMed]
  13. Gornay, J.; Glaude, P.A.; Billaud, F.; Coniglio, L. Experiments and Modeling of Octanoic Acid Pyrolysis in a Plug Flow Reactor. J. Anal. Appl. Pyrolysis 2020, 146, 104767. [Google Scholar] [CrossRef] [Green Version]
  14. Gollakota, A.R.K.; Kishore, N.; Gu, S. A Review on Hydrothermal Liquefaction of Biomass. Renew. Sustain. Energy Rev. 2018, 81, 138–1392. [Google Scholar] [CrossRef]
  15. Levenspiel, O. Chemical Reaction Engineering, 3rd ed.; John Wiley & Sons: New York, NY, USA, 1999; ISBN 0-471-25424-X. [Google Scholar]
  16. ProII SimSci, 2018 Schneider Electric Software; Version 10.1.2; Schneider Electric: Paris, France, 2018.
  17. Wilke, C.R.; Lee, C.Y. Estimation of diffusion coefficients for gases and vapors. Ind. Eng. Chem. 1955, 47, 1253–1257. [Google Scholar] [CrossRef]
  18. Le Bas, G. The Molecular Volumes of Liquid Chemical Compounds; Longmans, Green: New York, NY, USA, 1915. [Google Scholar]
  19. Bruce, E.P.; Prausnitz, J.M.; O’Connell, J.P. The Properties of Gases and Liquids, 5th ed.; McGraw-Hill: New-York, NY, USA, 2001; ISBN 0-07-011682-2. [Google Scholar]
Figure 1. Schematic overview of the designed bench-scale experimental setup.
Processes 09 02270 g001
Figure 2. Photos of the designed bench-scale reaction units: (a) quartz tubular reactor and its furnace with upstream, the mixing/preheating unit (quartz annular exchanger surrounded by a roll of heating resistances); (b) quartz annular fast-quenching system (downstream the tubular reactor).
Processes 09 02270 g002
Figure 3. Schematic overview of the fast-quenching system (longitudinal section).
Processes 09 02270 g003
Figure 4. Temperature profile along the tubular reactor for a furnace set point temperature of 700 °C.
Processes 09 02270 g004
Figure 5. Reactant and key product mole fraction profiles versus oven set point temperature resulting from octanoic acid pyrolysis carried out in the bench-scale setup designed in this work. The mole fraction profiles obtained for the oven set temperature 973.15 K come from this work (Table 5), while the others come from reference [13].
Processes 09 02270 g005
Figure 6. Overall scheme of octanoic acid (OA) pyrolysis as proposed in a previous work [13] on the basis of the experiments generated from the bench-scale setup detailed in this work (operating conditions of pyrolysis: 1 atm, 5% molar OA in N2, 421 ms residence time, oven set point temperature of 800 °C, tubular reactor axial coordinate 22 cm where temperature is 814 °C). Italic numbers indicate percent of parent species being converted to daughter species. C5H8O2ZB, C6H10O2ZB and C8H14O2ZB are globalized species considering isomers from which the major forms are, respectively: CH2=CH-CH2-CH2-COOH, CH2=CH-(CH2)3-COOH, and CH2=CH-(CH2)3-COOH.
Processes 09 02270 g006
Table 1. Dimensions of the experimental setup major units a.
UnitsFeaturesVariableValue/m
Carrier gas and reagent feedPyrex vaporizer with a dumped Raschig ring packing
di0.14
hpacking0.1
Mixing and preheating of the reactor feedQuartz annular exchanger with external surface heating and quartz chip packing
L0.2
Di0.03
De0.01
hpacking0.03
ReactorQuartz tubeL0.55
di0.008
Fast quenchingQuartz annular exchanger with external surface cooling
L0.1
Di0.008
de0.006
a L: length; di: internal diameter; Di: internal diameter of the annular exchanger large tube; de: external diameter of the annular exchanger small tube (Di and de are sizes of the annular exchanger surfaces in contact with the gas flow; Figure 1).
Table 2. Pyrolysis operating conditions selected for the reactor sizing (internal diameter d and length L) and the estimation of the thermophysical properties for the gas reacting fluid a.
Selected Pyrolysis Operating Conditions
T R / K 1000
P R / b a r 1.067
y A 0.05
Q E ( T R , P R , y A ) / ( m 3 s 1 ) 8.33 10 5
τ / s 0.36
Estimation of the Thermophysical Properties Related to the Reacting Fluid
D d i f   ( 1000   K ,   1.067   b a r ) / ( m 2 s 1 )  b5.644
ρ /(kg·m−3) c0.488
μ / ( P a s ) c 3.604 10 5
Regime Variables
u / ( m s 1 ) 1.657
D a x / ( m 2 s 1 ) 1.627 10 2
Pe56
Re179
Reactor Sizing
L/m0.49 rounded to 0.55
d/m 8.3 10 3 rounded to 8 10 3
Checking   the   Applicability   of   the   D a x  Correlation Used
Re179 < 2300 (laminar flow)
L/d68.75
3 10 2 u d D d i f 7.05 (Equation (5c) satisfied)
a Because products formed during pyrolysis of octanoic acid cannot be known prior experiment, the gas reacting fluid was approximate to the gas mixture feeding the reactor, i.e., octanoic acid (reagent) and nitrogen (carrier gas) with a molar fraction y A = 0.05 in reagent. b Details of the estimation method used for evaluating the molecular diffusion coefficient for the binary system [octanoic acid (reagent)–nitrogen (carrier gas)] are given in Appendix C [16,17,18,19]. c Estimation from DIPPR database via ProII [16].
Table 3. Values of parameters used for calculation of the fast-quenching system length and of the required cooling duration a.
ParametersNumerical Value
Cooling Operating Conditions and Technical Parameters
T 1 / ° C 600
T 2 / ° C 200
T m / ° C 400
T w c / ° C 20
Δ T m / ° C 341.86
D i / m 0.008
d e / m 0.006
δ / m 0.001
D h / m 0.002
Regime Variables
Q N T P / ( m 3 s 1 ) 6.1637 10 5
u / ( m s 1 ) 2.8028
Re89.320
Pr0.70380
Thermophysical Properties of the Warm Gas Fluid a
ρ N T P / ( k g m 3 ) 1.2500
ρ / ( k g m 3 ) 0.5070
C ¯ P / ( J k g 1 K 1 ) 1091.3
λ / ( W m 1 K 1 ) 0.04937
μ / ( P a s ) 3.1819 10 5
a The reactive gas mixture was considered as pure nitrogen whose thermophysical properties were calculated at 673.15 K and 1 atm.
Table 4. Results obtained over the iterative calculation procedure yielding to the wanted length L value of the fast-quenching system.
Iteration Rank k L k 1 / m m GzNu L k / m m
15.025.1457.07979.1
29.113.8166.462710.0
310.012.5736.383910.0
Table 5. Standard deviations (SD) and coefficients of variation (CV) on experimental results generated in this work to validate the designed bench-scale setup—Case study of octanoic acid pyrolysis-Experiments R1 and R2.
Operating ConditionsR1R2MeanSDCV (%)
Furnace set point temperature (°C)7007007000.00.0
Average reactor temperature (°C)6016016010.00.0
Reactor pressure (Torr)8608628611.40.2
Residence time (ms)4224234230.70.2
Pe number4646460.00.0
Conversion of reactant (%) a7.89.28.50.98.5
Material balance in C atom a−0.4−0.5−0.50.10.2
Material balance in H atom a−0.3−0.3−0.30.00.0
Material balance in O atom a1.41.71.60.212.5
Chemical speciesMolar fractions (solvent-free) %
Methane (CH4)2.132.402.270.146.1
Ethylene (C2H4)7.218.237.720.516.6
Propene (C3H6)2.482.432.460.021.0
1-Butene (C4H8)0.820.870.850.033.0
1-Pentene (C5H10)0.540.530.540.011.0
1-Hexene (C6H12)0.770.780.780.010.8
1-Heptene (C7H14)0.270.250.260.014.9
Acetic acid (CH3COOH)0.740.800.770.033.9
2-Propenoic acid (C2H3COOH)1.922.322.120.209.7
4-Pentenoic acid (C4H7COOH)0.410.440.430.013.5
5-Hexenoic acid (C5H9COOH)0.540.590.570.023.7
6-Heptenoic acid (C6H11COOH)0.230.240.240.012.7
Octanoic acid (C7H15COOH)78.4275.1476.781.642.1
Hydrogen (H2)1.421.681.550.138.3
Carbon monoxide (CO)0.530.000.270.26100.0
Carbon dioxide (CO2)0.841.030.940.0910.0
a Molar basis.
Publisher’s Note: MDPI stays neutral with regard to jurisdictional claims in published maps and institutional affiliations.

