
Protonation Dynamics in the K-Channel of Cytochrome c Oxidase Estimated from Molecular Dynamics Simulations


1
Institute for Theoretical Physics, Freie Universtiät Berlin, Arnimallee 14, 14195 Berlin, Germany
2
Computer Chemistry Center, Friedrich-Alexander University (FAU) Erlangen-Nürnberg, Nägelsbachstrasse 25, 91052 Erlangen, Germany
*
Author to whom correspondence should be addressed.
Processes 2021, 9(2), 265; https://0-doi-org.brum.beds.ac.uk/10.3390/pr9020265
Submission received: 31 December 2020
/
Revised: 22 January 2021
/
Accepted: 24 January 2021
/
Published: 29 January 2021
(This article belongs to the Special Issue Molecular Dynamics Modeling and Simulation)
Abstract
:Proton transfer reactions are one of the most fundamental processes in biochemistry. We present a simplistic approach for estimating proton transfer probabilities in a membrane protein, cytochrome c oxidase. We combine short molecular dynamics simulations at discrete protonation states with a Monte Carlo approach to exchange between those states. Requesting for a proton transfer the existence of a hydrogen-bonded connection between the two source and target residues of the exchange, restricts the acceptance of transfers to only those in which a proton-relay is possible. Together with an analysis of the hydrogen-bonded connectivity in one of the proton-conducting channels of cytochrome c oxidase, this approach gives insight into the protonation dynamics of the hydrogen-bonded networks. The connectivity and directionality of the networks are coupled to the conformation of an important protein residue in the channel, K362, rendering proton transfer in the entire channel feasible in only one of the two major conformations. Proton transport in the channel can thus be regulated by K362 not only through its possible role as a proton carrier itself, but also by allowing or preventing proton transport via water residues.
1. Introduction
Proton transfer is one of the most ubiquitous elementary steps in many biochemical and biophysical processes. It is at the heart of acid–base-catalyzed reactions, before and after the actual bond-breaking or bond-forming step, or tautomerizations which transform a molecule in a related, yet different one with, e.g., different hydrogen bonding patterns. Proton transfer is also relevant in the context of electrolytic solutions, not the least because of the auto-protolysis of water molecules into hydroxide and hydronium ions.
Proton transport through membranes, via membrane proteins, is one such fundamental biochemical process. In most cases, such proton transport is highly regulated and often also coupled to a reaction that provides the energy for the “pumping” of protons against a chemical gradient. Famous examples of proton pumping membrane proteins belong to the respiratory chain: respirator complexes I and II and cytochrome c oxidase (complex IV).
Aside from protons being transported by a water molecule as a carrier, that is, a hydronium ion, an established mechanism of proton transfer in aqueous solution and through proteins, sometimes over larger distances, is the “proton relay” mechanism described by Grotthus [1]. In this mechanism, a hydrogen-bonded chain is formed between a donor molecule, e.g., a hydronium ion, and an acceptor molecule, e.g., another water molecule, that can span several other water molecules. The proton transfer itself is then the excess proton moving from the donor molecule to its hydrogen-bonded neighbor, that molecule passing the proton on to its hydrogen-bonded neighbor molecule, etc. until the acceptor molecule receives a proton from its hydrogen-bonded predecessor. Similarly, a proton-hole can be transported by first the acceptor molecule taking a proton from its hydrogen-bonded neighbor, then that neighbor accepting a proton, etc.
Studying such processes by molecular simulations is a challenge because of the quantum mechanical nature of such a process. Even when neglecting the possibility of proton tunneling, which can be justified at physiological temperature and in biological systems, the change in electron density (and thus the associated atomic charges) together with numerous bonds being broken and formed more or less simultaneously, renders the application of classical force field approaches inadequate. Yet, such approaches allow molecular dynamics (MD) simulations to be performed at time scales which would be sufficient to observe spontaneous proton transfer events, if only the fixed topology (predefined bonds and fixed atomic charges) allowed such a transition. Several remedies have therefore been developed, all having their merits and difficulties. Here, we present only a few approaches.
Fixed-charge models can be overcome by hyperpolarizable force fields such as AMOEBA [2], Drude models [3,4], or in combined quantum mechanical/molecular mechanical approaches. The latter suffer from the significantly higher computational cost, in particular if large parts of the system have to be described quantum mechanically. The way out here is to either use adaptive methods in which the partitioning of the QM and MM level is adjusted on the fly, see, e.g., in [5,6,7,8]. An alternative is to circumvent quantum mechanical calculations entirely and emulate the behavior, i.e., change of bonds and protonation states, as best as possible by classical calculations. This can be achieved by employing several predefined (protonation) states, and corresponding, typically QM-derived effective potentials, and switching between those as done in empirical valence bond approaches [9,10], reactive force fields [11,12] and multiscale reactive MD simulations based thereon [13]. Other methods such as Q-hop [14] involve a Monte Carlo step in which a proton transfer to an acceptor is proposed, based on varying criteria, and accepted by, e.g., a Metropolis criterium, i.e., evaluating the relative probabilities of the end states of the transfer in the desired thermodynamic ensemble. Before and after a proton transfer attempt, successful or not, the system is let to evolve freely for a period. The transfer itself can be a direct jump or combined with a -dynamics in which the transferred proton is slowly grown and annihilated such as implemented in the HYDYN approach [15].
Another combination of non-equilibrium MD and MC simulations is employed in constant-pH simulations [16,17,18,19] which allow the simultaneous change of protonation states at severaltitratable sites. In contrast to the other above mentioned methods, more than one proton is added or lost, as opposed to sampling the proton transfer probabilities, and they are mainly used to predict pKa values [20]. Discrete protonation states replica-exchange MD simulations [21,22] follow a similar idea, that is, combining MD simulations with Monte Carlo steps for crossing between replicas, simulated at different pH and thus protonation states (instead of MD simulations at different temperatures as in the original replica-exchange MD). This approach allows estimating the probability for a proton to be located at a titratable site and thus its pKa value. Another view, in which only one excess proton is allowed in any of the replicas, can thus provide probabilities for the excess proton to sit at one or the other site and as such give an estimate of proton transfer probabilities between those sites. Such estimates can, as free energy differences, also be obtained by -dynamics, but with different computational requirements, e.g., spending time in sampling artificial intermediate states at while being free from the need to sample several transfer attempts.
In this work, we employ a simplistic variant of discrete protonation-state replica-exchange simulations to explore the proton transfer probabilities on the K-channel of cytochrome c oxidase (CcO). The K-channel has been discussed as the route for proton uptake in the situation in which the first reducing electron has arrived at the binuclear center (BNC), represented by the O→E intermediate state [23,24,25,26]. The channel is named after residue K362 (Rh. sphaeroides numbering) and leads from a glutamate residue, E101, at the N-side of the membrane to residue Y288, located at the BNC [27,28]. Mutation of K362 [29] showed significantly reduced transition rates to the next redox states in the catalytic cycle of CcO, suggesting that K362 is directly involved in the proton transport. Previous work has shown that the conformational dynamics of K362 depends on its protonation state [30,31], which in turn has been discussed to depend on the redox state of CcO, and that proton transfer is coupled to the conformational transitions of residue K362, and redistribution of water molecules and thus the hydrogen-bonded network [32].
Here, we are interested not only in where the excess proton can be located, as specified by either protonated protein residues or positions of a hydronium ion, but also whether a proton transfer from and to such sites is possible. To this end, we perform several molecular dynamics simulations of CcO with one excess proton bound at various protonation sites. These are the titratable residues H96, E101, and K362 and the water molecules inside the K-channel. From those simulations in different protonation replicas, we evaluate at intervals the proton transfer probability as the exchange probability between replicas. Note that we do not carry out actual replica exchange simulations, and thus do not test whether a proton resides on the acceptor or could easily jump back. Rather, we evaluate which transfers are in principle possible. We therefore augmented the usual Metropolis criterion by a hydrogen-bond criterion. As in a Grotthus mechanism, the proton relay takes place along a hydrogen-bonded chain, proton transfer probabilities are highly dependent on the formation of such chains. Therefore, in our approach, a crossing attempt is only made to acceptor sites that are connected with the proton donor by a hydrogen-bonded connection. We find that this additional criterion severely reduces the number of accepted proton transfer attempts. The surviving proton transfers, however, provide valuable information about possible routesfor proton translocation in the K-channel of CcO.
2. Materials and Methods
2.1. Molecular Dynamics Simulations
Model Setup
The model setup for the protein embedded in a solvated lipid bilayer follows the same protocol as described in [30] and also employed by some of us in previous MD simulation of CcOin another, redox state [33]. The model consists of subunits I and II of CcO from R. sphaeroides(based on a crystal structure with PDB entry 2GSM [34,35]) embedded in a lipid bilayer of phosphatidylcholines and solvated in TIP3P water [36] in a tetragonal box of size (x = y = 96 Å, z = 124 Å). In the following, we refer to this model as the “full protein model”.
The protein was described by the CHARMM22 force field [37] and parameters from the CHARMM36 extension for lipids [38] were used to describe the lipid bilayer. Parameters for the cofactors, e.g., heme a or heme , are based on quantum chemically derived atomic partial charges and optimized cofactor geometry by Woelke et al. [30]. The redox state O2E was modeled as in [30], with the terminal residue of the K-channel, Y288 in the deprotonated state (see in [30]). Residue K362 was modeled in protonated form while residues at the entrance of the channel H96 or E101 were modeled unprotonated. Na counterions were added by random substitution of water oxygen atoms to neutralize the charge of the system. The simulations were performed using periodic boundary conditions. The Particle Mesh Ewald method [39] with a 96 × 96 × 128 charge grid was used to compute long-range electrostatic interactions. Short range electrostatics and van der Waals interactions were truncated at 12 Å using a switch function starting at 10 Å. All covalent bond lengths involving hydrogen atoms were fixed using SHAKE algorithm [40].
After minimizing the system for 5000 steps by steepest descent and heating for 30 ps to 300 K, three stages of equilibration (with decreasing harmonic restraints on the solute atoms) were performed in which the numbers of particles, pressure (1 bar) and temperature (300 K) were kept constant (NPT ensemble) during 75 ps. Pressure control was introduced using the Nosé-Hoover Langevin piston with a decay period of 500 fs. Then a 100 ns long NPT production run with 2 fs integration time step was performed.
These Molecular Dynamics (MD) simulations have been carried out using the program NAMD2.13 [41].
2.2. Protonation MD Simulations
Model Setup
From the simulation of the full protein model, two frames were chosen for subsequent simulations in a reduced model. The choice was based on the dihedral conformation of K362 with the one frame representing this residue in an “up” conformation, i.e., pointing towards Y288, and another one representing K362 in a “down” conformation, pointing away from Y288. Figure 1 shows the two snapshots. Note that, strictly speaking, K362 in the “down” conformation does not adopt a conformation in which it is fully flipped downwards, but rather points sideways towards residue S299. In order to distinguish it from the truly “up” conformation, we still refer to this snapshot as one with K362 in a “down” conformation in the remainder of this text.
From those two snapshots reduced models were built in which the lipid bilayer and most of the bulk water was removed, except for a water shell of 5 Å around the protein. In that reduced model, protein residues farther than 15 Å from the NZ atom of K362 and all water molecules that are farther than 5 Å from the residues H284, Y288, T359, K362, and S365 in the Achain or H96 and E101 in the Bchain of the protein were kept stationary. Furthermore, only 15 water molecules inside the K-channel were allowed to moved freely, but kept inside the channel by a harmonic potential with force constant 100 kcal·mol−1·Å−2. The inside of thechannel was defined by a cylinder of 6 Å radius and an axis spanning from the center of mass of CA atoms of residues H96 and E101, at the bottom of the K-channel, to the center of mass of the CA atoms of residues Y288, L238, and G398 at the top of the K-channel. The height of this cylinder is about 25 Å. In addition, a sphere of radius 15 Å around the center of the cylinder was defined so as to keep the water molecules from leaving the cylinder at the top or bottom, again by a harmonic potential with force constant 100 kcal·mol−1·Å−2 and onset at the boundaryof the sphere.
From those reduced models, we built 18 models from the “up” and “down” snapshots each, with the excess proton located on one of the 15 mobile water molecules (transforming them into HO ions) or on protein residues K362 (the original model), residue H96, or residue E101. These models were described by the same Charmm22 force field as employed for the MD simulations of the full model and parameters for the hydronium ion are taken from Ref. [45].
For each of the 18 different protonation models in the reduced system, we performed a short minimization of 100 steps with the adopted basis Newton–Raphson, then the systems were heated up to and equilibrated at 300K during 20 ps and 50 ps MD simulations, respectively. These were followed by first 1 ns and then another 10 ns MD simulations at 300K of which the first 1 ns was considered as further equilibration. Langevin dynamics was employed to control the temperature, and a time step of 1 fs was used for the integration. Coordinates were saved a 1 ps intervals. On this time scale, we anticipate sufficient sampling of most of the local water movement while excluding larger conformational changes. The conformational states of K362, which are important in the context of protonation dynamics in the K-channel of CcO, are explicitly modeled by selecting the “up” and “down” snapshot from longer MD simulations of the full model.
The MD simulations of the reduced model were performed with the CHARMM programme.
2.3. Analysis
2.3.1. Structural Parameters
We have analyzed the conformation of the side chains of residues K362, H96 and E101 in terms of their torsion angles. Furthermore, we have analyzed at which height in the cylinder the different water molecules can be observed. In this, and all other analyses, the height in the cylinder is given by a projection onto an axis defined by the CA atom of H96 and the CA atom of Y288, where the origin is at H96. The same projection was used to evaluate the “height” of the polar atoms of the protein residues, these are the hydroxyl oxygen atom, OH, of Y288; the hydroxyl oxygen atom, OG, of T359; the amino nitrogen atom, NZ, of K362; and the hydroxyl oxygen atom, OG, of S365. As both carboxyl atoms of E101 could be protonated, we evaluated the position of the carboxyl C-atom, CD, instead and similarly the CE1 atom between the two nitrogen atoms of the imidazole ring of H96.
Hydrogen bonds were defined by geometric criteria, i.e., the donor–acceptor distance must not exceed 3.5 Å and the donor–hydrogen-acceptor (D-H⋯A) angle must not deviate more than 35 degrees from linear. These are the same criteria as we have used in the analysis of previous MD simulations of CcO [33,46]. A directed hydrogen bond is defined as pointing from the donor to the acceptor residue.
2.3.2. Proton Transfer Probabilities
From the MD simulations of the reduced models, we estimated the proton transfer probabilities between water molecules as “proton replica exchange probabilities”. To this end, from each protonation state model with a protonated water molecule, 1000 snapshots, at 10 ps intervals, were taken. Then, for each protonated water model, the transition probability to any other, unprotonated water molecule was evaluated based on the comparison between each frame of the simulation in which the source water molecule is protonated with every frame of the simulations in which the putative target water molecules (that is each of the 14 other mobile water molecules) are protonated.
A proton transfer would be allowed based on the following criteria:
- a Metropolis criterion, that is, with a probabilitywhere is the energy of the frame in the source simulation and is the energy in the target simulation and is the inverse temperature with K and the Boltzmann constant.
- the existence of a hydrogen-bonded connection between the source and the target water molecule.
For the second criterion we further defined four categories of increasing strictness
- a hydrogen-bonded connection exists between the source and the target water molecule in the source replica, i.e., the frame of the simulation with the source water molecule protonated;
- a hydrogen-bonded connection exists between the source and the target water molecule in the source and in the target replica, i.e., in both the frame of the simulation with the source water molecule protonated; and the frame of the simulation with the target water molecule protonated
- a directed hydrogen-bonded connection from the source and the target water molecule exists in the source replica; and
- a directed hydrogen-bonded connection from the source and the target water molecule exists in the source replica and in the target replica.
The length of the hydrogen-bond connections was analyzed but not used as further criterion for estimating the proton transfer probabilities. The hydrogen-bond connections considered could be formed by the mobile water molecules or the side chains of the protein residues inside the K-channel, i.e., Y288, T359, K362, S365, H96, and E101. To find the hydrogen-bond connections, for each frame considered a (directed) graph was set up in which the residues represent the nodes and edges represent existing (directed) hydrogen bonds between a pair of residues in that frame. On that graph a shortest path search using Dijkstra’s algorithm [47] between the node representing the source water molecule and the nodes of the target water molecules was performed. If such a path exists, its lengths (number of nodes) represents the number of residues involved in the hydrogen-bonded connection, i.e., a direct path has a length of two. If no such path exists, there is no hydrogen-bonded connection between the two residues considered.
We have estimated proton transfer probabilities for only an energetic criterion and for acceptance by the energetic criterion, given that the hydrogen-bonded connection criterion is fulfilled, varying the four hydrogen-bonded criteria. For both the “up” and “down” models, each of these five different scenarios have been tested by ten metropolis runs.
3. Results and Discussion
Figure 1 shows two snapshots taken from the MD simulation of the full model. In one snapshot (Figure 1a), protein residue K362 points towards the upper part of the K-channel with torsion angles , , , and . This conformation will be called “up”. The other, “down”, conformation (Figure 1b) has torsion angles , , , and . Because the two outermost torsion angles and are far from linear, this conformation does not point fully down to the channel entrance, but rather in direction of residue S299 (see Figure 1b). In each of the two snapshots, there are fifteen water molecules inside the K-channel which are considered as possible carriers of the excess proton (instead of K362). In the “up” model the height of the K-channel as defined by the distance between the CA atoms of H96 and Y288 is 25.2 Å, whereas in the “down” model, this height amounts to 27.4 Å. With respect to the CA atom of K362, Y288 is located ∼1 Å higher and H96 is located ∼1 Å lower in the “down” models than in the “up” models.
3.1. Conformational Analysis
3.1.1. Protein Residues
Of the protein residues, only K362 shows some dependence of the average position of its polar side chain atom, NZ, on the protonation model, that is the location of the excess proton. In the “up” models it fluctuates up to ∼3 Å, and in the “down” models ∼2 Å around a height of 17 Å (see Figure 2 and Table S1). For the other residues, the positions of their polar side chain atoms remain rather stable, some of them with different positions in the “up” and “down” models, partially due to the shifted reference point, the CA atom of H96: the hydroxyl oxygen atom of Y288 is located at ∼24 Å in the “up” models and at ∼26 Å in the “down” models and the CD atom of H96 fluctuates around 2.9 Å and 0.8 Å in the “up” and “down” models, respectively (see Figure 2 and Table S1).
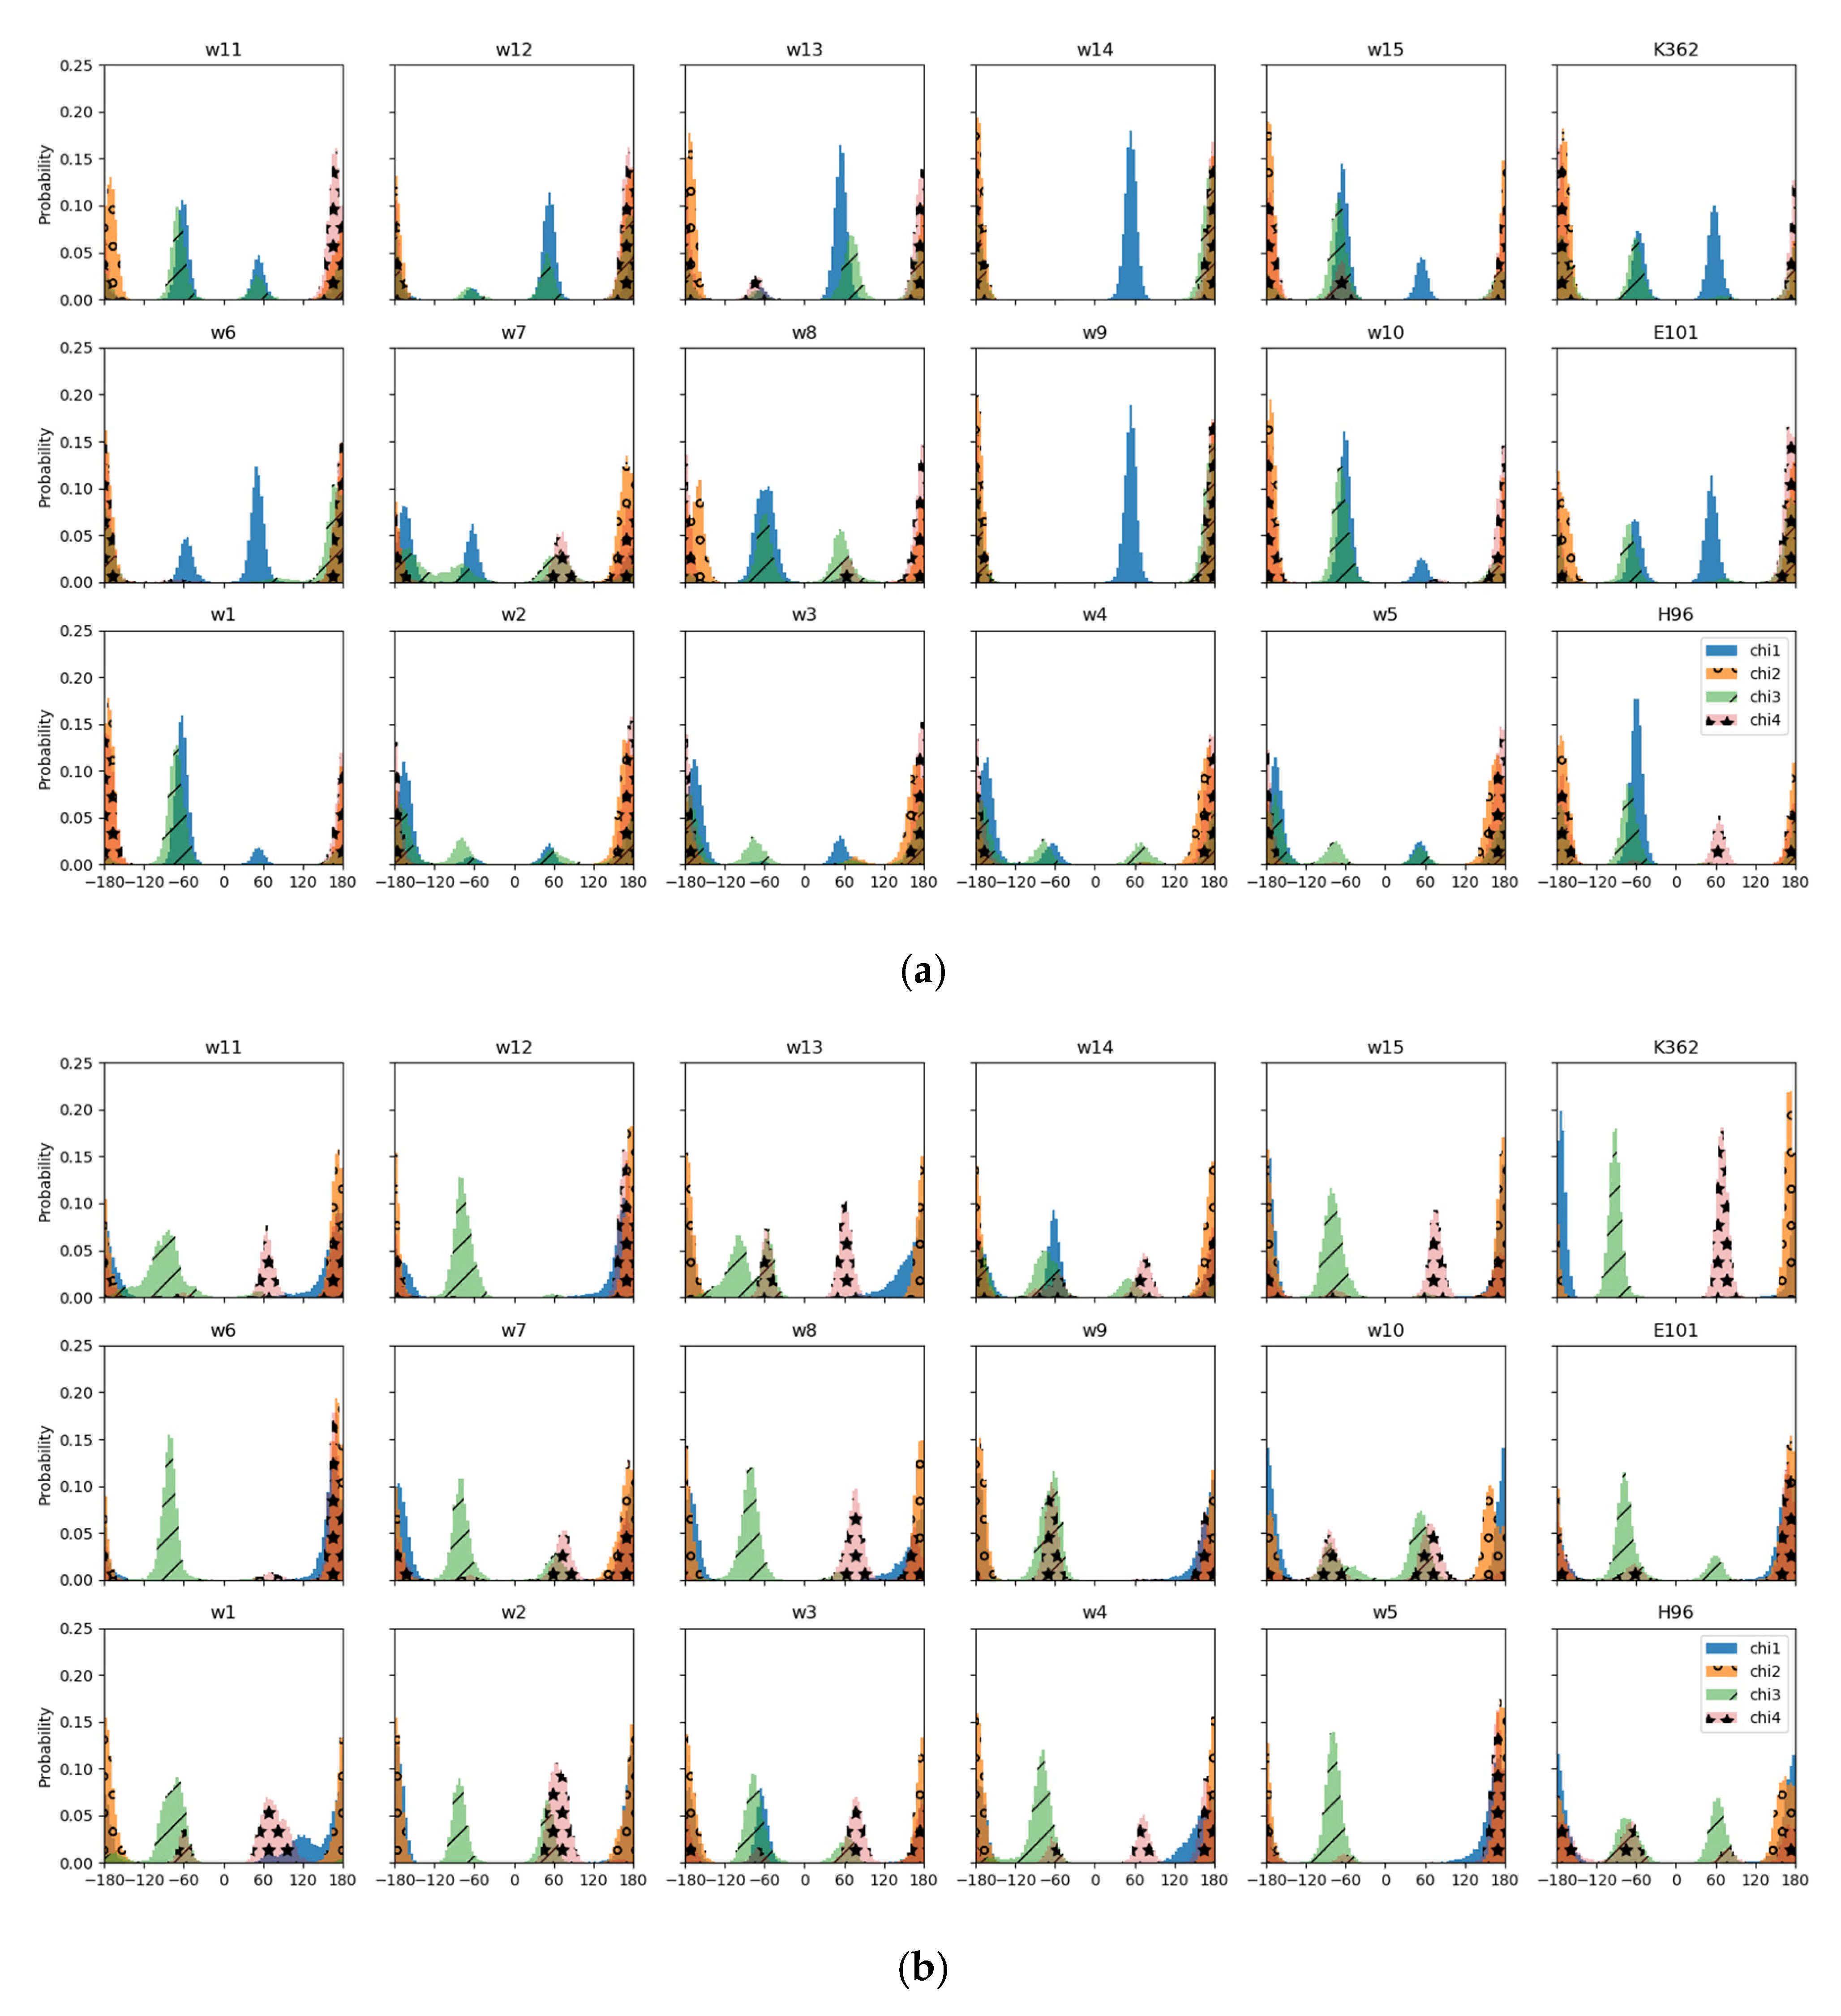
In the simulations of the reduced “up” model, in which also K362 is protonated, the torsion angles are in the same state as in the full model, except for which is a deviation from the almost-linear conformation of the “up” snapshot (see Figure 3a). Indeed, in the other “up” models, angle varies between almost linear and , without any clear dependence on the location of the excess proton. A conformation of can also be observed in all protonation models based on the “down” snapshot, albeit with varying intensity. Torsion angle is about linear in all models.
The difference in torsion angle of nonlinear, , in the “up” and linear in the “down” conformation of the full model is preserved in almost all the reduced models. Exceptions are the “up” models w2, w3, w4, and w5 which exhibit a linear angle.
Among the models based on the “down” snapshot, torsion angle varies remarkably. This angle is about linear in models w5, w6, w12, and in the model with protonated E101 and for the other “down” models (see Figure 3b). It is also about linear in the “up” models (except for model w7 and that with protonated H96).
In contrast to the “up” snapshot of the full model, exhibits about linear conformation in some of the reduced models, namely, models w2, w3, w4, and w5.
Residue E101 exhibits a slightly shifted angle only when it is protonated itself and then only in the model based on the “up” snapshot (see Figure S1), but is otherwise unaffected by the protonation model. The conformation of residue H96 is independent of the protonation model of either protein residues or water molecules but different in the “up” models and “down” by ∼ in and ∼ in (see Figure S2). This difference in H96 conformation together with the altered relative heights of H96 and E101, results in a shorter distance to E101, allowing a hydrogen bond between the two residues.
3.1.2. Water Residues
The fifteen water molecules, as illustrated by Figure 2, show a much higher mobility in the “up” models than in the “down” models. It is interesting to note that in the “up” models there is a region at about 13–14 Å, a height between S365 and K362, which is almost unoccupied if the proton is located at a water molecule above that zone or at K362.
In both types of models, some water molecules are more mobile than others, though. The average positions of the water molecules are given in Table 1.
3.2. Hydrogen Bonds
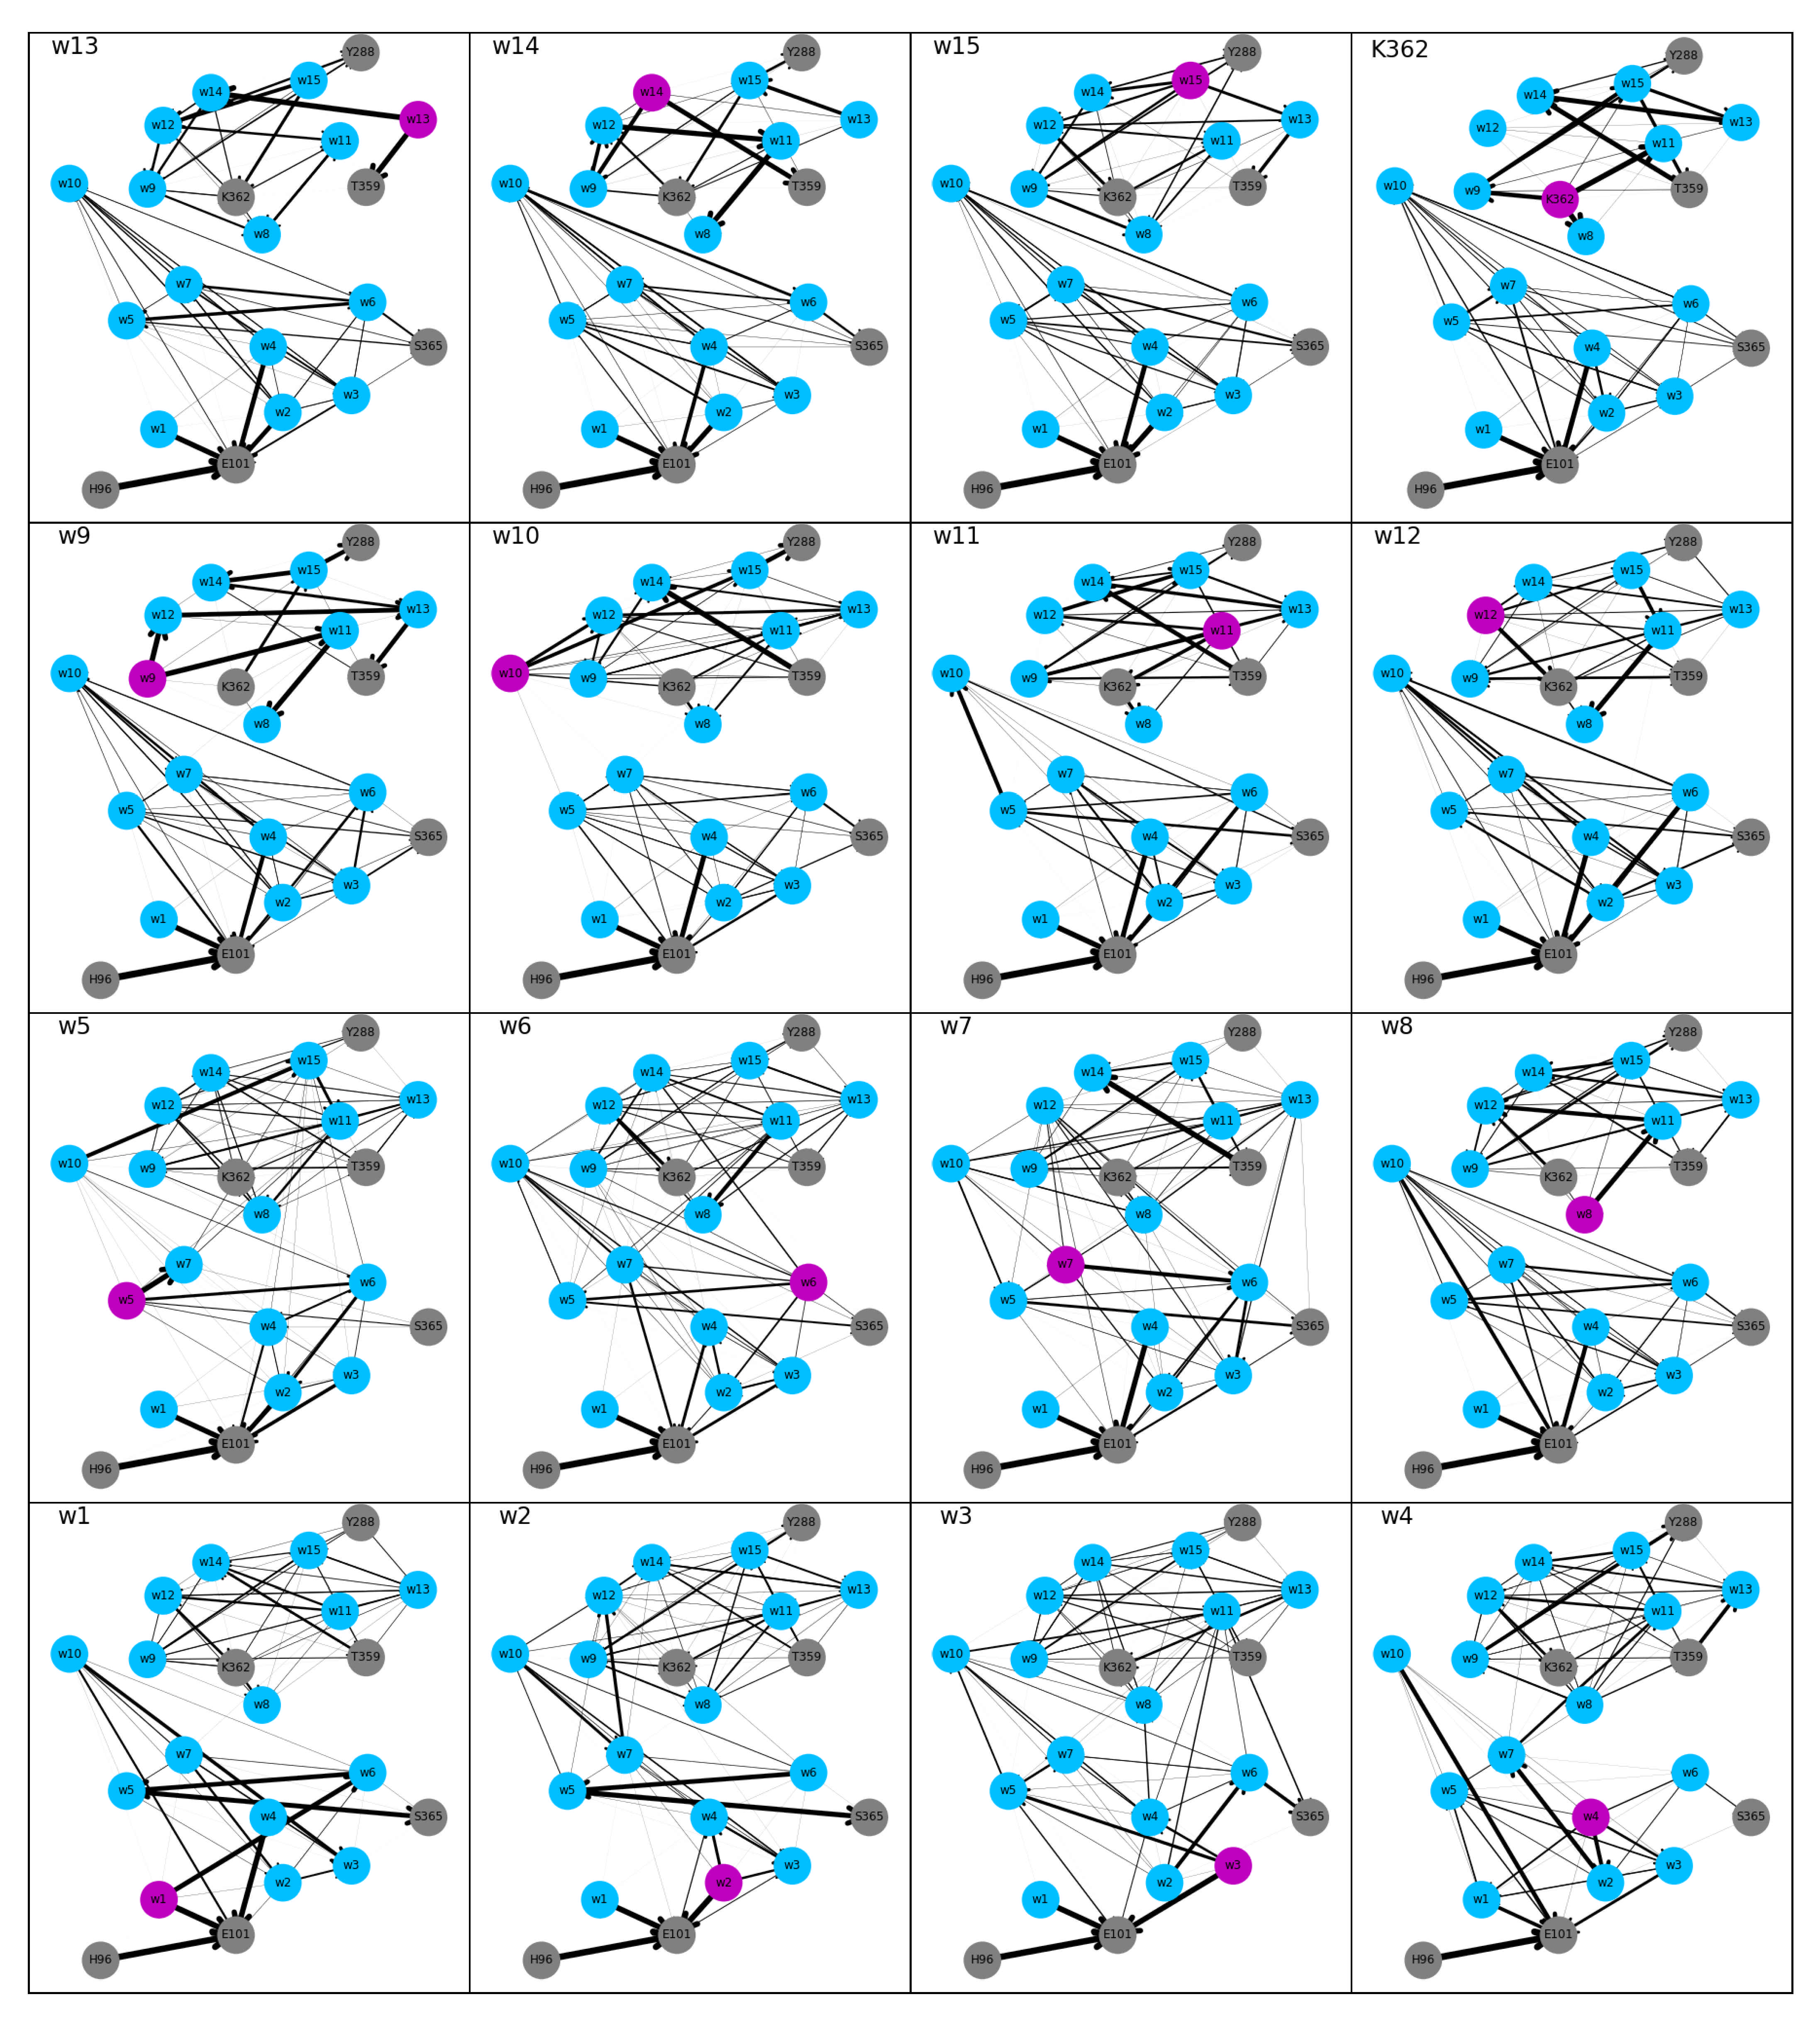
Most of the undirected hydrogen-bonded networks in the “up” models are partitioned in two, at about the height of residue K362 or just below, i.e., at the height of w8 (see Figure 4), due to no or very low probability (models w9 and w10) for hydrogen bonds between water molecules in the lower and the upper part of the channel. This gap in the networks can be related to the low probability for water molecules to be at such a height (cf. Figure 2). Networks in which all nodes share one connected component are those of models w2, w3, w4, and w6. In model w7, the upper and lower parts of the network are connected, but the network does not reach Y288. Connections within the upper part of the network are dense in all “up” models. The lower part, however, shows lower connectivity for models w1–w7, that is, models in which the proton is located mainly in the lower part. For directed hydrogen-bonded networks of the “up” models, the probability for connections is substantially reduced compared to the undirected models (thinner lines in Figure 5 than in Figure 4).
In the “down” models, Y288 is not connected to the rest of the hydrogen-bonded network or only with very low probability, in agreement with the low probability to observe a water molecule just below this residue (see Figure 2). All other residues are connected in both the undirected and the directed networks of the “down” model, albeit some with low probability (see Figure 6 and Figure 7, respectively). The connectivity, in terms of number of edges, of the undirected networks in the “down” models is generally lower than in the “up” models, in particular in the upper part of the networks (see Figure 4 and Figure 6, respectively).
In all “up” models, a strong hydrogen bond between H96 and E101 exists that is not formed in the “down” models. The direction of the “up” hydrogen-bonded network is, in the lower parts, generally towards E101, whereas in the “down” models hydrogen bonds point in all directions although E101 is always an acceptor, except when it is itself protonated and acts as donor and acceptor.
For the proton to reach the upper part of the network along directed hydrogen bonds, it has to be located on a water molecule that has an average height of >8 Å (w4) in the “down” models, in the “up” models a height of >16 Å (w8) is required for directed hydrogen-bond connections between the proton-carrying residue and the upper part of the network. Once the proton has reached this height, however, no directed hydrogen-bond connections to the lower part (with probability higher than 0.3) exist, preventing the back transfer. This is again in contrast to the “down” models, which also show hydrogen-bonded connections towards the lower part of the network (and thus the K-channel) when the proton is located at or above K362. Indeed, K362 itself is accepting hydrogen bonds mainly from the part of the channel where the proton is located, that is, from below or above. In the “up” models, K362 almost exclusively accepts hydrogen bonds from above, even when the proton is located in the lower part of the channel.
3.3. Proton Transfer Probabilities
The acceptance ratio of proton transfer without any of the hydrogen-bond criteria is about 0.5. An exchange is attempted in both directions, “downwards” or “upwards”, and the ratio of about half of the attempts accepted suggests that the direction, and thus the energetically preferred location of the excess proton, is dominant. Given the large energy differences between individual frames (up to almost 100 kcal/mol, see Figure S4),the acceptance probability for a transition into a highly unfavorable position can be expected to be rather low. On the other hand, for all heights at which protonated water molecules are located, such a large energy range is observed. Consequently, there will always be a transition attempt from one height to another that is energetically favorable and as such accepted for sure but the reverse transition is only accepted with very low probability, explaining the about one half acceptance ratio.
Upon addition of a hydrogen-bond criterion, the acceptance ratio drops to ∼0.2 when requesting hydrogen bonds only in the source replica and further to 0.09 when requesting hydrogen bonds in both the source and target replica. The further constrained of directed hydrogen bonds reduces the acceptance ratio to ∼ and to ∼ for hydrogen-bonded connections in only the source and in both replicas, respectively. This suggests that most of the relevant hydrogen-bonded connections along which proton transfer is energetically allowed (with a certain probability) are anyway directed. The source water molecule, as hydronium ion, must be a hydrogen bond donor. The analysis of the directed-hydrogen bond networks shows that, at least in the “down” models, and in the lower part of the “up” models, the excess proton has a directing effect on the network.
3.3.1. Height-Dependent Proton Transfer Probabilities
Figure 8 and Figure 9 summarize the position-dependent acceptance for proton exchange between the “up” and the “down” models, respectively, depending on the different criteria. For both types of models, there is a zone between 10 and 14 Å from or to which no proton transfer is accepted. This is the zone which is not occupied by any water molecule in those “up” models which have the proton located in the upper part of the channel. In the “down” models, water molecules can be observed in that zone, but hardly a protonated one. Accordingly, no proton transfer from this zone is attempted and as such also not observed.
For the “up” models, the proton transfers not accepted due to the additional hydrogen-bond criteria are all “downwards”, starting from a height between 16 and 20 Å in the channel, mainly between the height of the NZ atom of K362 and the OG atom of T359. These differences show that, while protonated water molecules can occupy that region (and can exchange protons if only energetics are considered), they are not part of a hydrogen-bonded network that leads to a target water molecule. This is consistent with the observation of “disrupted” networks, ending at the height of K362 in the “up” models (Figure 5). The additional requirement of a hydrogen-bonded connection also in the target replica further reduces the accepted attempts by those proton transfers which would reach up into again that region and are also not possible due to the lack of a directed hydrogen-bonded connection.
The area between K362 and T359 at ∼13–14 Å exhibits a striking difference between the “up” and “down” models. In the former, the highest probability for proton transfer is from and to the regions between K362 and T359, whereas in the “down” models, proton transfers can only land there, although protonated water molecules are observed at this height in the MD simulations of both “up” and “down” models. This suggests that in the “down” models a height between K362 and T359 is energetically much more favorable for the excess proton than any other possible target water molecule location in the channel. Relating this observation with the higher fluctuations of the conformations of K362 and T359, and thus also heights of their polar side chain atoms, the protonated water molecule may be more tightly accommodated between the two residues in the “down” models. In models w9, w10, and w11, the protonated water molecule is found at about the height of K362 and it is also hydrogen-bonded to this residue.
Another difference between the “up” and “down” models originates in the conformations of H96 and E101 at the bottom of the channel. In the “down” models, only very few proton transitions start at a height of ∼5 Å. With additional hydrogen-bonded connections as further prerequisite for a possible proton transfer, this ∼5 Å zone becomes void of accepted proton transfers. This area is occupied by a hydronium ion only in the simulation of model w3 and in this model, the hydronium ion is rather mobile. Consequently, proton transfers into this zone are accepted, rendering the energies of the respective snapshots sufficiently favorable. This observation suggests a position at a height of ∼5 Å can in principle be occupied in the “down” models, but rather transiently, as shown by the low probability for doing so in the MD simulations. A possible explanation is the vicinity of the negatively charged E101. In an MD simulation, this residue would significantly attract a protonated water molecule, leading to the formation of strong hydrogen bonds and rendering a position of the hydronium ion farther up the channel much less favorable.
In the “up” models, there are transitions observed from and to a height of ∼5 Å, mainly downwards, and thus also likely influenced by the negative charge of E101. Still, for transitions to start at ∼5 Å, in those models hydronium ions have to occupy this area also in the MD simulations. In the “up” models, the lowest average height of the protonated water molecules is at Å (w1, w2, and w3), suggesting that the presence of E101 is less attractive in those “up” models than in the “down” models. This in turn can be explained by E101 forming a strong hydrogen bond with H96 in the “up” models, which does not exist in the “down” models and provides some shielding of E101’s negative charge.
3.3.2. Directionality and Lengths of Proton Transfer Paths
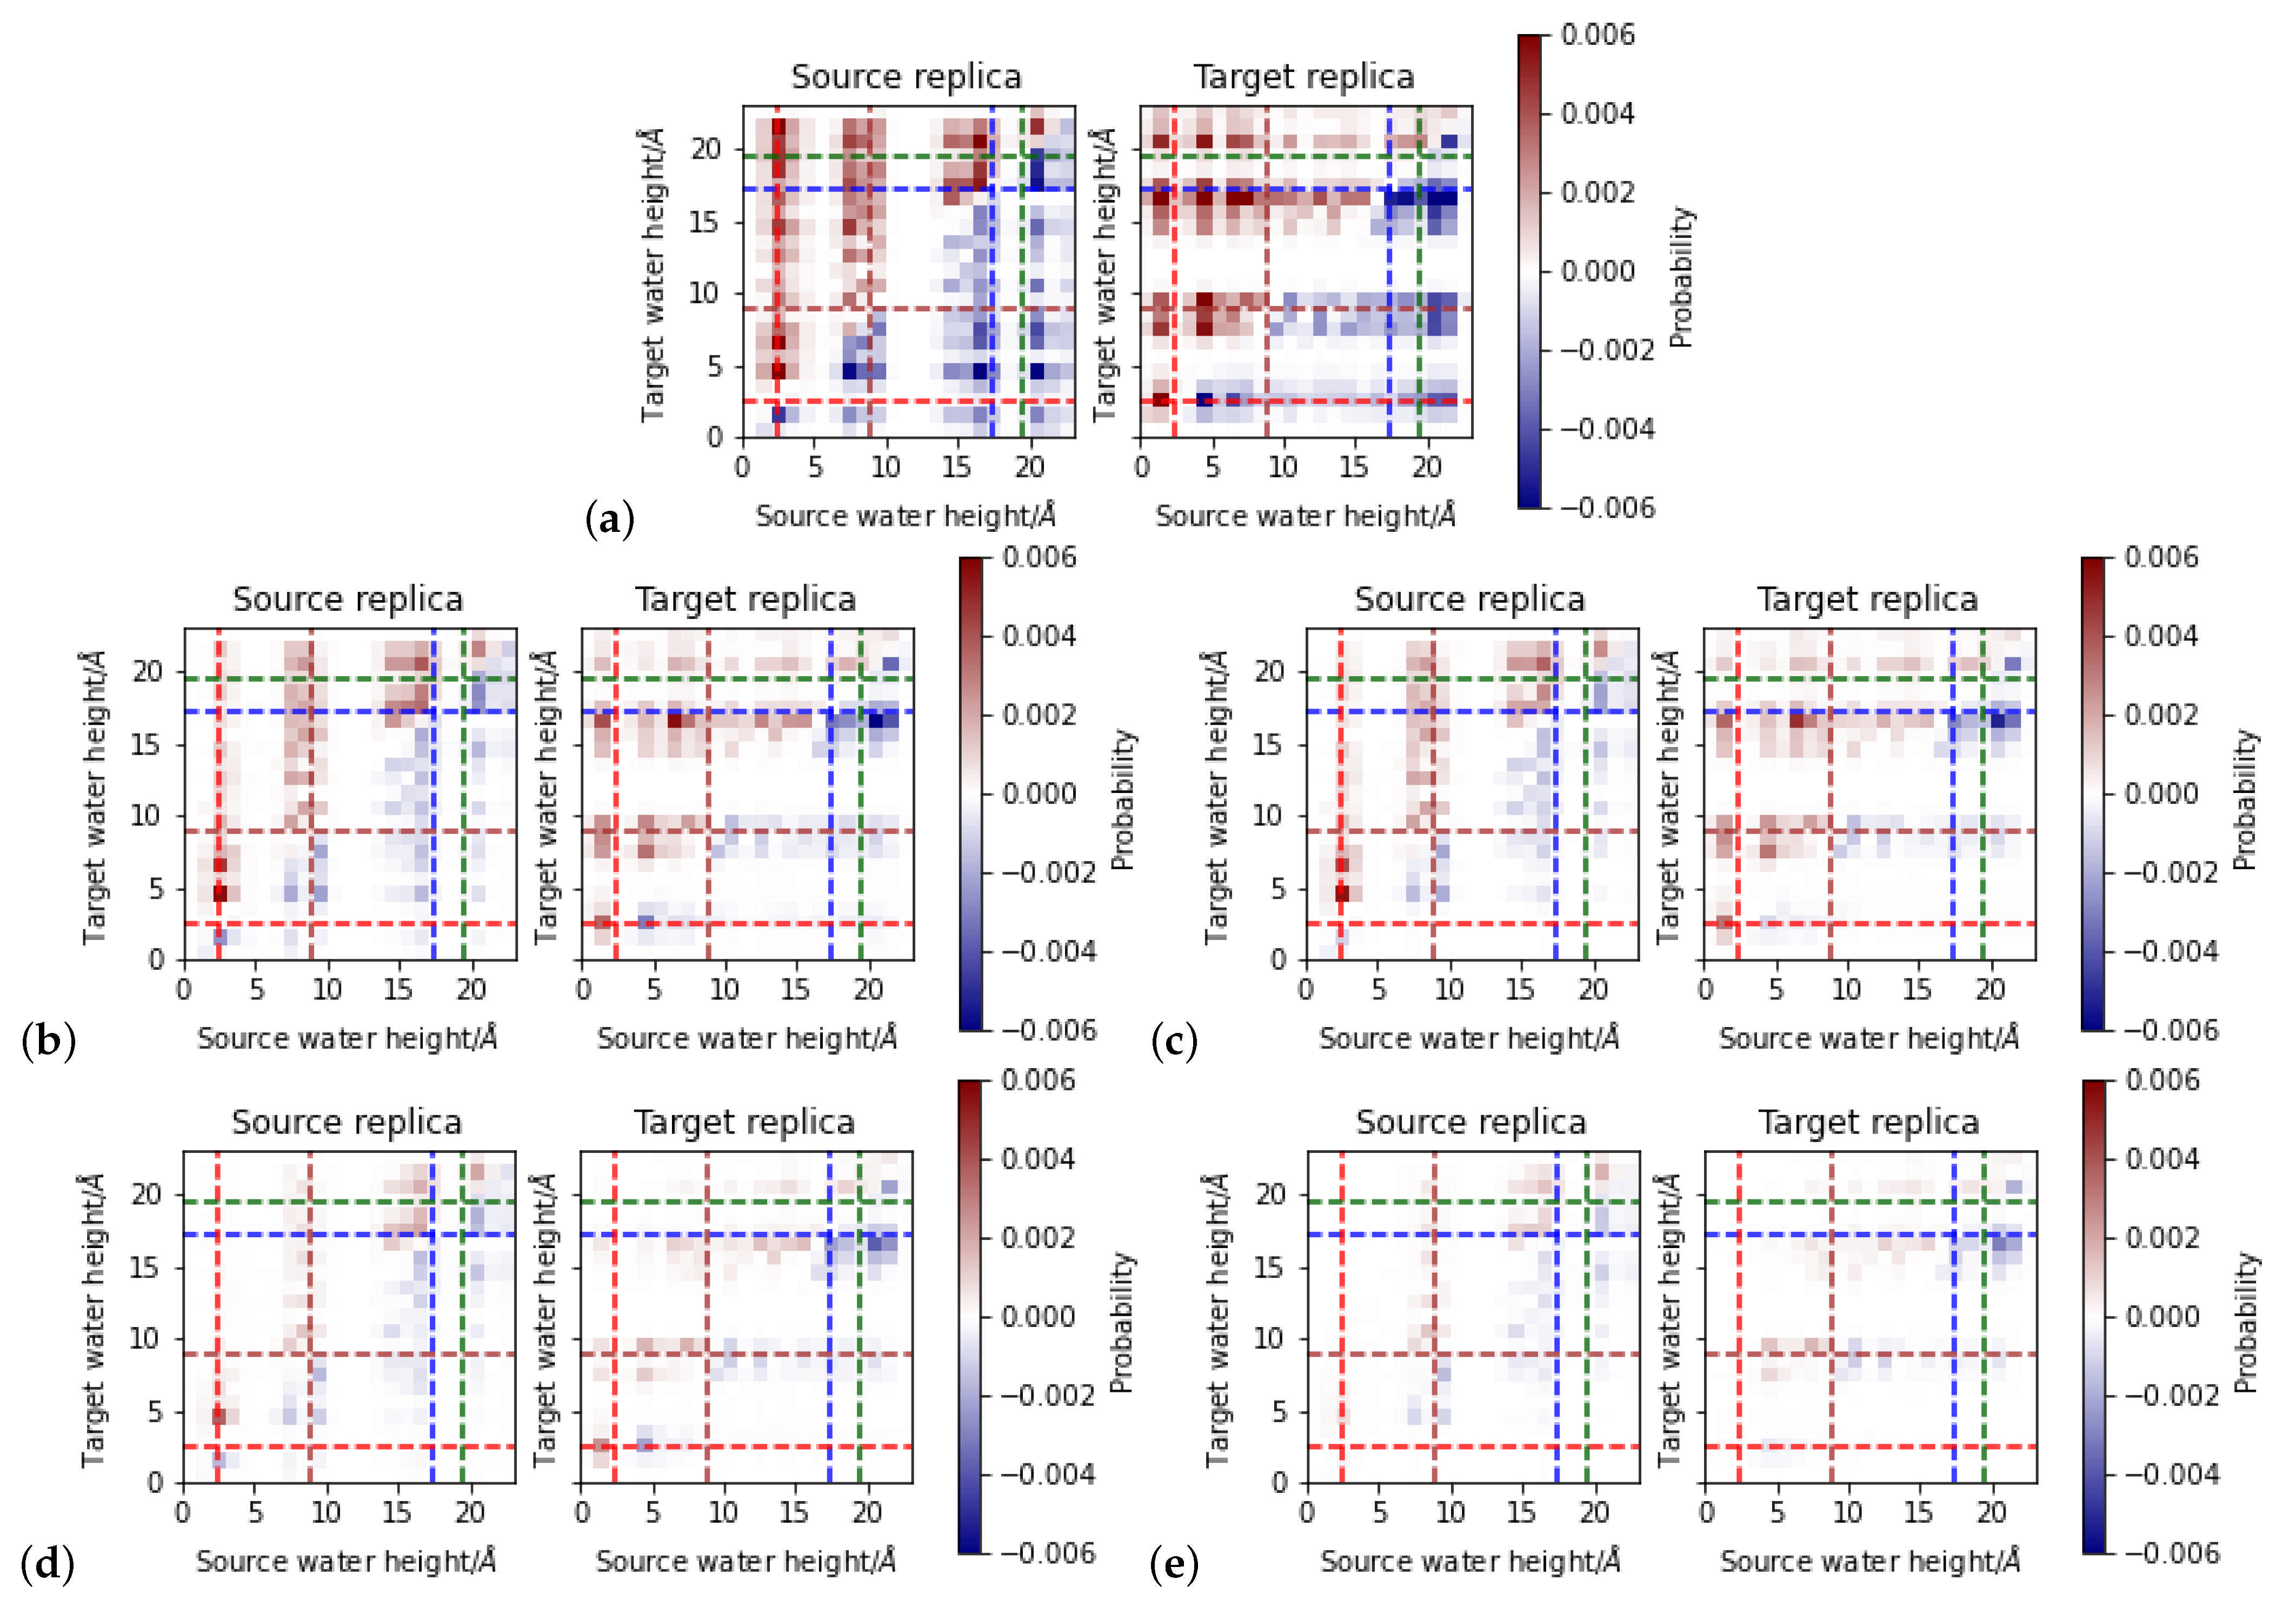
For the “down” models, proton transfer starting below K362 is only upwards, consistent with the direction of the hydrogen-bonded network. The longest paths are found for source water molecules located at the bottom of the channel. Paths starting from positions higher up in the channel are shorter, indicating that there are no “detours” along the hydrogen-bonded chains. At just below K362, some longer paths leading down the channel are also observed. Moreover, proton transfer paths starting above K362 all lead “downwards”, again in agreementwith the directionality of the hydrogen-bonded network. Paths spanning from the bottom of the channel to above K362, or vice versa, reach lengths of more than 10 residues involved (see Figure 10).
The “up” models show proton transfer starting from about the height of T359 and above is mainly in “downwards” direction, whereas paths starting just below K362 lead “upwards” (see Figure 11). This is also reflecting the directed hydrogen-bonded networks which point “down” from the protonated water molecules in models w13, w14, and w15 in the top part of the channel, and mainly up in models w9 and w10. If only the hydrogen-bonded connections in the source replicas are considered, paths starting at the lower end of the channel do reach up to the same lengths in the “up” models as observed in the “down” models, even though the protonated water molecules in those cases are located significantly more above E101 than in the “down” models. Implementing the stricter criterion of a hydrogen-bonded connection also in the target replica reduces the probability for long paths significantly in the “up” models. The paths starting above K362 reach lengths of six residues as opposed to more than 10 residues observed for the “down” models, in agreement with the disrupted hydrogen-bonded networks in the “up” models.
It is also interesting to note that, while paths starting at about the height of S365 can have either direction in the “up” models, as long as only the hydrogen-bonded connection in the source replica is relevant, only the “downwards” paths survive the test for the additional hydrogen-bonded connection in the target replica. In the “down” models, in contrast, paths starting up to the height of S365 always lead “upwards”. In these “down” models, the stricter criterion reduces the overall probability but does not affect the predominant direction. In these models, the “fork in the road” of the more probable direction of proton transfer is at about the height of K362.
The stricter criterion of directed hydrogen-bonded connections, either in the source replica only or in source and target replica, reduces, as anticipated, the probability for proton transfer in “up” and “down” models, evenly to and from all regions that show proton transfer along undirected hydrogen bonds.
3.4. Interplay of K362 Conformation, Hydrogen-Bonded Connections, and Proton Transfer Probabilities
The overall proton transfer acceptance probabilities of about one half based on energetic considerations suggest that the energy difference between the source and target replica, and thus also the position of the excess proton, is dominant. Further consideration of hydrogen-bonded connections, by analyzing the hydrogen-bonded networks, and by introducing the existence of such a connection as an additional criterion for the acceptance of a proton transfer, afforded us with an understanding of preferred proton transfer directions (“upwards” or “downwards”) and its dependence on the location of the excess proton. The differences between the models built from a snapshot with K362 in an “up” conformation and those built from a snapshot with K362 in a “down” conformation, gave us furthermore insight into the interplay of the hydrogen-bonded connections with the conformation of this residue, and thus also its possible role in proton transfer through the K-channel of CcO. In the “down” models, proton transfer is possible throughout the channel, that is, from the lower part up to almost Y288 or in the other direction, depending on the position of the excess proton. In the “up” models, in contrast, the hydrogen-bonded networks in the channel are disrupted such that lower and upper part of the channel, below or above K362, are disconnected. Consequently, proton transfer along hydrogen-bonded chains is only possible within the lower or upper part. Once in the upper region, hydrogen-bonded connections between the proton carrier and the terminal residue of the channel, Y288 exist, and a transfer to this residue is conceivable. Passage from lower to upper part has thus to take place while K362 is in a “down” conformation. Whether it is K362 itself that carries the proton up or not has not been considered in this work. Extensive QM/MM simulations [32] show that proton transfer from K362 to Y288 is a feasible pathway and facilitated by an “up” conformation of K362. Our data suggest that the proton transfer can also occur between water molecules as long as K362 remains “down”. The “up” conformation has been discussed to be predominant for protonated K362 but may also have higher probability for an excess proton in the vicinity of K362, that is, in the upper part of the channel. Among our “up” models, those with a proton in higher positions indeed show a preference for an “up” conformation of K362, whereas models with an excess proton located towards the bottom of the channel also exhibit “down” conformations. In the “down” models, K362 does not flip up, indicating that in the rather short MD simulations used to sample the water positions and hydrogen bonded connections such a transition is not feasible. In longer simulations [30,33], such transitions are observed, rendering proton transport by K362 as a carrier a possible, but not the only route. Instead, K362’s role can be regarded as a valve, separating the upper and lower parts of the K-channel and, in an “up” position, preventing proton transport back to the bottom of the channel but possibly also the translocation of another proton before the next step in the catalytic cycle. In [32] it is discussed that “The side chain dynamics of the neutral Lys-319 and the consequent loss of a hydrogen-bonded connectivity could help in preventing the chemical proton from leaking backwards towards the N-side.” The “loss of hydrogen-bonded connectivity” [32], is not observed in our “down” models, as it is also a consequence of the significantly lower channel hydration with neutral lysine, and we have kept the amount of water molecules in the channel constant at fifteen to facilitate comparison between our “up” and “down” models.
3.5. Strengths and Limitations of the Presented Sampling Approach
Our present sampling approach of proton transfer probabilities along hydrogen-bonded chains is not a true replica exchange approach as the simulations are not continued after exchanges and therefore possible direct jumps back are artificially excluded. This can be seen by proton transfers that are accepted into unfavorable regions for hydronium ions but not out of regions unfavorable for hydronium ions. While such a behavior seems to violate detailed balance, it is mainly a problem of too little sampling of the source distribution: the conditional probability to transfer from an unfavorable proton position to a more favorable one (which will for sure be accepted) vanishes because the condition for the proton to be in that position is very low according to the MD simulations. Continuation of the MD simulations after exchanges, as is done in actual replica-exchange simulations, is a straightforward way to improve the sampling of those otherwise difficult to reach states. We have in this work instead focused on the effect of the hydrogen-bond criterion in the acceptance step. The request for an existing hydrogen-bonded connection reduces the accepted proton transfers to those cases in which a proton-relay mechanism is conceivable. By allowing hydrogen-bonded connections of any length, this approach also allows proton transfers over significantly larger distances than hopping to only the next hydrogen-bonded neighbor and thus also includes the possibilities of concerted proton transfer events.
For simplicity and to be able to use standard empirical force fields for a direct comparison of energies, we have limited the sampling to proton transfer between water molecules. However, our approach can easily be extended to include protein residues. This, however, needs a QM/MM setting for the energy evaluation (thought not for the MD simulations) or other effective potentials that allow the comparison of different topologies such as provided by EVB [9,10] or reactive force fields [11,12].
As a validation for the proton transfer estimates provided by our method some further simulations with increasing complexity can be carried out. First, an actual, though artificialproton exchange could be carried out by placing the excess proton at the target water molecule of the target replicafollowed by a short MD simulation in this new configuration. This way, the probability for the newly generated hydronium ion to actually be found at the position of the target water molecules can be evaluated. As another, computationally more demanding, approachthe proton can be “transferred” by -dynamics, annihilating it at the source water molecule while creating an excess proton at the target water molecule.This way, free energy differences between the two protonation states can be computed. Moreover, finally, the actual proton transfer can be calculated by, e.g., umbrella sampling simulations, so as to obtain a free energy barrier for the proton transfer step as well as the free energy difference between the end states. For those calculations, however, a potential that can describe different topologies has to be used. Given the computational demand of these more elaborate methods, our simplistic approach can serve as a first, broad screening of which proton transfer steps may be feasible and worth inspecting with higher-level methods.
4. Conclusions
We have explored the proton transfer probabilities in the K-channel of cytochrome c oxidase by a combination of short MD simulations of discrete protonation states that sample the local dynamics of the environment of the excess proton, and exchange between those discrete states by a Monte Carlo-like approach. Implementing a hydrogen bond criterion such that proton transfer is only accepted when the source water molecule carrying the excess proton and the target water molecule are connected by one or several hydrogen bonds, accepted proton transfersare restrained to situations in which an actual proton relay mechanism can take place. Due to this further criterion, we could analyze the interplay of hydrogen-bonded connectivity in the different regions of the K-channel in CcO, in particular the part below and above residue K362, to the position of the excess proton and the conformation of K362. Our rather simplistic modeling approach is a computationally tractable way to sample where and in which direction proton transfer is conceivable and can easily be augmented by computations of the actual transfer. Already from the present analysis of discrete protonation states, combined with the different conformations of K362, the importance of the position of the excess proton for the directionality of the hydrogen-bonded connections and thus the direction of proton transfer becomes apparent. The connectivity of the networks, however, largely depends on the conformation of K362, with connections between lower and upper part and back for K362 in a “down” conformation and a disrupted network for K362 in an “up” conformation. These findings suggest that K362’s role in proton transport through the K-channel is not necessarily predominantly that of a proton carrier, but rather that of a semipermeable lock that allows (and perhaps also facilitates) proton transport towards the BNC but prevents back leakage to the inner side of the membrane.
Supplementary Materials
The following are available online at https://0-www-mdpi-com.brum.beds.ac.uk/2227-9717/9/2/265/s1. Figure S1: Distribution of side chain dihedral angles, X1, X2, and X3 of residue E101 in the MD simulations with the excess proton located at different sites. a) Simulations of the reduced model based on a snapshot with K362 in an “up” position, b) simulations of the reduced model based on a snapshot with K362 in a “down” position., Figure S2: Distribution of side chain dihedral angles, X1 and X2 of residue H96 in the MD simula-tions with the excess proton located at different sites. a) Simulations of the reduced model based on a snapshot with K362 in an “up” position, b) simulations of the reduced model based on a snapshot with K362 in a “down” position., Figure S3: Undirected and directed hydrogen-bond networks of simulations with H96 or E101 protonated, started from a snapshot with K362 in a “down” or an “up” conformation, respectively. The nodes of the network are the protein residues (in grey) Y288, T359, K362, S365, H96, or E101, and the fifteen water molecules (in blue) in the channel. The residue carrying the excess proton is highlighted in magenta. Edges of the network correspond to hydrogen bonds, shown as lines for undirected and as arrows pointing from donor to acceptor residue for directed networks. The thickness of the lines indicate the probability of the hydrogen bonds., Figure S4: Energies of the snapshots used for crossing attempts vs. height of the protonated water mole-cules’ oxygen atoms. a) Simulations of the reduced model based on a snapshot with K362 in an “up” position, b) simulations of the reduced model based on a snapshot with K362 in a “down” position., Figure S5: Position-dependent acceptance for proton exchange in “up” models as function of the transition step size as measured by the length of the hydrogen-bonded chain. Left: “upwards” (direction from H96 to Y288) transitions, right: “downwards” (direction from Y288 to H96) tran-sitions. Dashed lines indicate the average position of protein residues E101 (red), S365 (brown), K362 (blue), and T359 (green). a) existence of a hydrogen-bonded connection in the source replica, b) existence of a directed hydrogen-bonded connection in the source replica, c) existence of a di-rected hydrogen-bonded connection in the source replica, and d) existence of a directed hydro-gen-bonded connection in the source and target replica as additional criterion., Figure S6: Posi-tion-dependent acceptance for proton exchange in “down” models as function of the transition step size as measured by the length of the hydrogen-bonded chain. Left: “upwards” (direction from H96 to Y288) transitons, right: “downwards” (direction from Y288 to H96) transitions. Dashed lines indicate the average position of protein residues E101 (red), S365 (brown), K362 (blue), and T359 (green). a) existence of a hydrogen-bonded connection in the source replica, b) existence of a di-rected hydrogen-bonded connection in the source replica, c) existence of a directed hydro-gen-bonded connection in the source replica, and d) existence of a directed hydrogen-bonded connection in the source and target replica as additional criterion., Table S1: Average positions of oxygen atom OH of Y288, the nitrogen atom NZ of K362, the CD atom of E101, and the CE1 atom of H96.Simulations of the reduced model based on a snapshot with K362 in an “up” position, b) simulations of the reduced model based on a snapshot with K362 in a “down” position.
Author Contributions
Conceptualization, P.I.; methodology, V.S.; investigation, V.S., R.F.G., and P.I.; data curation, V.S., R.F.G., and P.I.; writing—original draft preparation, V.S. and P.I. All authors have read and agreed to the published version of the manuscript.
Funding
This work has been funded by the Deutsche Forschungsgemeinschaft (DFG) through project C5 of the CRC1078 “Protonation dynamics in protein function”.
Institutional Review Board Statement
Not applicable.
Informed Consent Statement
Not applicable.
Data Availability Statement
Not applicable.
Acknowledgments
R.G. is grateful for support by a scholarship from the Elsa-Neumann foundation. High-performance computational resources provided by the North-German Supercomputing Alliance (HLRN) are gratefully acknowledged. We thank the ZEDAT at FU Berlin for computing time on Curta.
Conflicts of Interest
The authors declare no conflict of interest. The funders had no role in the design of the study; in the collection, analyses, or interpretation of data; in the writing of the manuscript; or in the decision to publish the results.
Abbreviations
The following abbreviations are used in this manuscript:
| CcO | Cytochrome c oxidase |
| MD | Molecular dynamics |
| BNC | Binuclear center |
References
- Grotthuss, C.D. Memoir on the decomposition of water and of the bodies that it holds in solution by means of galvanic electricity. Biochim. Biophys. Acta (BBA) Bioenergy 2006, 1757, 871–875. [Google Scholar] [CrossRef] [Green Version]
- Ren, P.; Wu, C.; Ponder, J.W. Polarizable Atomic Multipole-Based Molecular Mechanics for Organic Molecules. J. Chem. Theory Comput. 2011, 7, 3143–3161. [Google Scholar] [CrossRef] [Green Version]
- Kognole, A.; Aytenfisu, A.; MacKerell, A. Balanced polarizable Drude force field parameters for molecular anions: Phosphates, sulfates, sulfamates, and oxides. J. Mol. Model. 2020, 26, 152. [Google Scholar] [CrossRef] [PubMed]
- König, G.; Pickard, F.; Huang, J.; Thiel, W.; MacKerell, A.; Brooks, B.R.; York, D.M. A Comparison of QM/MM Simulations with and without the Drude Oscillator Model Based on Hydration Free Energies of Simple Solutes. Molecules 2018, 23, 2695. [Google Scholar] [CrossRef] [PubMed] [Green Version]
- Bulo, R.E.; Ensing, B.; Sikkema, J.; Visscher, L. Toward a practical method for adaptive QM/MM simulations. J. Chem. Theory Comput. 2009, 5, 2212–2221. [Google Scholar] [CrossRef] [PubMed]
- Pezeshki, S.; Lin, H. Adaptive-partitioning redistributed charge and dipole schemes for QM/MM dynamics simulations: On-the-fly relocation of boundaries that pass through covalent bonds. J. Chem. Theory Comput. 2011, 7, 3625–3634. [Google Scholar] [CrossRef] [PubMed]
- Duster, A.W.; Wang, C.H.; Lin, H. Adaptive QM/MM for Molecular Dynamics Simulations: 5. On the Energy-Conserved Permuted Adaptive-Partitioning Schemes. Molecules 2018, 23, 2170. [Google Scholar] [CrossRef] [PubMed] [Green Version]
- Böckmann, M.; Doltsinis, N.L.; Marx, D. Adaptive switching of interaction potentials in the time domain: An extended lagrangian approach tailored to transmute force field to QM/MM simulations and back. J. Chem. Theory Comput. 2015, 11, 2429–2439. [Google Scholar] [CrossRef]
- Åqvist, J. Modelling of Proton Transfer Reactions in Enzymes. In Computational Approaches to Biochemical Reactivity. Understanding Chemical Reactivity; Náray-Szabó, G., Warshel, A., Eds.; Springer: Dordrecht, The Netherlands, 2002; Volume 19. [Google Scholar]
- Kamerlin, S.C.L.; Warshel, A. The empirical valence bond model: Theory and applications. WIREs Comput. Mol. Sci. 2011, 1, 30–45. [Google Scholar] [CrossRef]
- Lammers, S.; Lutz, S.; Meuwly, M. Reactive force fields for proton transfer dynamics. J. Comput. Chem. 2008, 29, 1048. [Google Scholar] [CrossRef]
- Xu, Z.H.; Meuwly, M. Multistate Reactive Molecular Dynamics Simulations of Proton Diffusion in Water Clusters and in the Bulk. J. Phys. Chem. B 2019, 123, 9846–9861. [Google Scholar] [CrossRef] [PubMed] [Green Version]
- Lee, S.; Liang, R.; Voth, G.A.; Swanson, J.M.J. Computationally Efficient Multiscale Reactive Molecular Dynamics to Describe Amino Acid Deprotonation in Proteins. J. Chem. Theory Comput. 2016, 12, 879–891. [Google Scholar] [CrossRef] [PubMed]
- Lill, M.; Helms, V. Molecular dynamics simulation of proton transport with quantum mechanically derived proton hopping rates (Q-HOP MD). J. Chem. Phys. 2001, 115, 7993. [Google Scholar] [CrossRef]
- Wolf, M.; Groenhof, G. Explicit Proton Transfer in Classical Molecular DynamicsSimulations. J. Comp. Chem. 2014, 35, 657–671. [Google Scholar] [CrossRef] [Green Version]
- Bürgi, R.; Kollman, P.; Gunsteren, W.V. Simulating proteins at constant pH: An approach combining molecular dynamics and Monte Carlo simulation. Proteins 2002, 47, 469–480. [Google Scholar] [CrossRef] [PubMed]
- Mongan, J.; Case, D.; McCammon, J. Constant pH molecular dynamics in generalized Born implicit solvent. J. Comput. Chem. 2004, 25, 2038–2048. [Google Scholar] [CrossRef]
- Chen, J.; Brooks, C.L., III; Khandogin, J. Recent advances in implicit solvent-based methods for biomolecular simulations. Curr. Opin. Struct. Biol. 2008, 18, 140–148. [Google Scholar] [CrossRef] [Green Version]
- Chen, W.; Morrow, B.; Shi, C.; Shen, J. Recent development and application of constant pH molecular dynamics. Mol. Simul. 2014, 40, 830–838. [Google Scholar] [CrossRef]
- Wallace, J.A.; Shen, J.K. Predicting pKa values with continuous constant pH molecular dynamics. Methods Enzymol. 2009, 466, 455–475. [Google Scholar]
- Itoh, S.; Damjanovic, A.; Brooks, B. pH replica-exchange method based on discrete protonation states. Proteins 2011, 79, 3420–3436. [Google Scholar] [CrossRef] [Green Version]
- Sabri Dashti, D.; Meng, Y.; Roitberg, A.E. pH-Replica Exchange Molecular Dynamics in Proteins Using a Discrete Protonation Method. J. Phys. Chem. B 2012, 116, 8805–8811. [Google Scholar] [CrossRef] [PubMed] [Green Version]
- Wikstrom, M.; Krab, K.; Sharma, V. Oxygen Activation and Energy Conservation by Cytochrome c Oxidase. Chem. Rev. 2018, 118, 2469–2490. [Google Scholar] [CrossRef] [Green Version]
- Konstantinov, A.A.; Siletsky, S.; Mitchell, D.; Kaulen, A.; Gennis, R.B. The roles of the two proton input channels in cytochrome c oxidase from Rhodobacter sphaeroides probed by the effects of site-directed mutations on time-resolved electrogenic intraprotein proton transfer. Proc. Nat. Acad. Sci. USA 1997, 94, 9085–9090. [Google Scholar] [CrossRef] [Green Version]
- Belevich, I.; Bloch, D.A.; Belevich, N.; Wikström, M.; Verkhovsky, M.I. Exploring the proton pump mechanism of cytochrome c oxidase in real time. Proc. Nat. Acad. Sci. USA 2007, 104, 2685–2690. [Google Scholar] [CrossRef] [Green Version]
- Gorbikova, E.; Wikström, M.; Verkhovsky, M. The protonation state of the cross-linked tyrosine during the catalytic cycle of cytochrome c oxidase. J. Biol. Chem. 2008, 283, 34907–34912. [Google Scholar] [CrossRef] [PubMed] [Green Version]
- Brändén, M.; Tomson, F.; Gennis, R.B.; Brzezinski, P. The entry point of the K-proton-transfer pathway in cytochrome c oxidase. Biochemistry 2002, 41, 10794–10798. [Google Scholar] [CrossRef] [PubMed]
- Tomson, F.L.; Morgan, J.E.; Gu, G.; Barquera, B.; Vygodina, T.V.; Gennis, R.B. Substitutions for Glutamate 101 in Subunit II of Cytochrome c Oxidase from Rhodobacter sphaeroides Result in Blocking the Proton-Conducting K-Channel. Biochemistry 2003, 42, 1711–1717. [Google Scholar] [CrossRef] [PubMed]
- Ädelroth, P.; Gennis, R.B.; Brzezinski, P. Role of the pathway through K (I-362) in proton transfer in cytochrome c oxidase from R. sphaeroides. Biochemistry 1998, 37, 2470–2476. [Google Scholar] [CrossRef] [PubMed]
- Woelke, A.L.; Galstyan, G.; Knapp, E.W. Lysine 362 in cytochrome c oxidase regulates opening of the K-channel via changes in pKA and conformation. Biochim. Biophys. Acta (BBA) Bioenergy 2014, 1837, 1998–2003. [Google Scholar] [CrossRef] [PubMed] [Green Version]
- Lepp, H.; Svahn, E.; Faxén, K.; Brzezinski, P. Charge Transfer in the K Proton Pathway Linked to Electron Transfer to the Catalytic Site in Cytochrome c Oxidase. Biochemistry 2008, 47, 4929–4935. [Google Scholar] [CrossRef] [PubMed]
- Supekar, S.; Kaila, V.R.I. Dewetting transitions coupled to K-channel activation in cytochrome c oxidase. Chem. Sci. 2018, 32, 6703–6710. [Google Scholar] [CrossRef] [PubMed] [Green Version]
- Helabad, M.B.; Ghane, T.; Reidelbach, M.; Woelke, A.L.; Knapp, E.W.; Imhof, P. Protonation-State-Dependent Communication in Cytochrome c Oxidase. Biophys. J. 2017, 113, 817–828. [Google Scholar] [CrossRef] [PubMed] [Green Version]
- Berman, H.M.; Westbrook, J.; Zeng, F.; Gilliland, G.; Bhat, T.N.; Weissig, H.; Shindiyalov, I.N.; Bourne, P.E. The Protein Databank. Nucleic Acid Res. 2000, 28, 283–422. [Google Scholar] [CrossRef] [Green Version]
- Qin, L.; Hiser, C.; Mulichak, A.; Garavita, R.M.; Ferguson-Miller, S. Identification of conserved lipid/detergent-binding in a high resolution structure of the membrane protein cytochrome c oxidase. Proc. Natl. Aacd. Sci. USA 2006, 103, 16117–16122. [Google Scholar] [CrossRef] [Green Version]
- Jorgensen, W.L.; Chandrasekhar, J.; Madura, J.D.; Impey, R.W.; Klein, M.L. Comparison of simple potential functions for simulating liquid water. J. Chem. Phys. 1983, 79, 926–935. [Google Scholar] [CrossRef]
- MacKerell, A.D., Jr.; Bashford, D.; Bellott, M.; Dunbrack, R.L., Jr.; Evanseck, J.D.; Field, M.J.; Fischer, S.; Gao, J.; Guo, H.; Ha, S.; et al. All-Atom Empirical Potential for Molecular Modeling and Dynamics Studies of Proteins. J. Phys. Chem. B 1998, 102, 3586–3616. [Google Scholar] [CrossRef] [PubMed]
- Klauda, J.B.; Venable, R.M.; Freites, J.A.; O’Connor, J.W.; Tobias, D.J.; Mondragon-Ramirez, C.; Vorobyov, I.; MacKerell, A.D., Jr.; Pastor, R.W. Update of the CHARMM all-atom additive force field for lipids: Validation on six lipid types. J. Phys. Chem. B 2010, 114, 7830–7843. [Google Scholar] [CrossRef] [Green Version]
- Darden, T.; York, D.; Pedersen, L.G. Particle mesh Ewald: An Nlog(N) method for Ewald sums in large systems. J. Chem. Phys. 1993, 98, 10089–10092. [Google Scholar] [CrossRef] [Green Version]
- Ryckaert, J.P.; Ciccotti, G.; Berendsen, H.J.C. Numerical integration of the cartesian equations of motion of a system with constraints: Molecular dynamics of n-alkanes. J. Comp. Phys. 1977, 23, 327–341. [Google Scholar] [CrossRef] [Green Version]
- Phillips, J.C.; Braun, R.; Wang, W.; Gumbart, J.; Tajkhorshid, E.; Villa, E.; Chipot, C.; Skeel, R.D.; Kale, L.; Schulten, K. Scalable molecular dynamics with NAMD. J. Comput. Chem. 2005, 26, 1781–1802. [Google Scholar] [CrossRef] [Green Version]
- Bagga, J.; Heinz, A. JGraph—A Java Based System for Drawing Graphs and Running Graph Algorithms. In Graph Drawing; Mutzel, P., Jünger, M., Leipert, S., Eds.; Lecture Notes in Computer Science; Springer: Berlin/Heidelberg, Germany, 2002; Volume 2265, pp. 459–460. [Google Scholar]
- Humphrey, W.; Dalke, A.; Schulten, K. VMD—Visual Molecular Dynamics. J. Mol. Graph. 1996, 14, 33–38. [Google Scholar] [CrossRef]
- Hutter, J.D. Matplotlib: A 2D graphics environment. Comput. Sci. Eng. 2007, 9, 90–95. [Google Scholar] [CrossRef]
- Sagnella, D.; Voth, G. Structure and dynamics of hydronium in the ion channel gramicidin A. Biophys. J. 1996, 70, 2043–2051. [Google Scholar] [CrossRef] [Green Version]
- Ghane, T.; Gorriz, R.F.; Wrzalek, S.; Volkenandt, S.; Delatieh, F.; Reidelbach, M.; Imhof, P. Hydrogen-Bonded Network and Water Dynamics in the D-channel of Cytochrome c Oxidase. J. Membr. Biol. 2018, 251, 299–314. [Google Scholar] [CrossRef] [PubMed]
- Dijkstra, E. A note on two problems in connexion with graphs. Num. Math. 1959, 1, 269–271. [Google Scholar] [CrossRef] [Green Version]
Figure 1.
Model of the K-channel in cytochrome c oxidase: (a) based on a snapshot with K362 in an “up” position and (b) based on a snapshot with K362 in a “down” position. Left: protein residues considered in the hydrogen-bond and proton transfer analyses. Water molecules are shown as cyan spheres and labeled according to their position (height) in the channel. Right: Schematic representation of the channel, representing the residues of interest as ellipses and labeled as in the snapshots. Snapshots are not aligned with respect to each other but rather rotated such that an optimal view of the water molecules is possible.

Figure 2.
Occupancies of water positions, represented by their height in the K-channel. (a) Simulations of the reduced model based on a snapshot with K362 in an “up” position, (b) simulations of the reduced model based on a snapshot with K362 in a “down” position. The dashed horizontal lines represent the average height of the hydroxyl oxygen atom of Y288 (pink), the hydroxyl oxygen atom of T359 (green), the nitrogen atom of K362 (blue), the hydroxyl oxygen atom of S365 (brown), the CD atom of E101 (red), and the CE1 atom of H96 (cornflowerblue). The dashed black line marks the water molecule that is protonated in the respective simulation.

Figure 3.
Distribution of side chain dihedral angles, ,,, and of residue K362 in the MD simulations with the excess proton located at different sites. (a) Simulations of the reduced model based on a snapshot with K362 in an “up” position, and (b) simulations of the reduced model based on a snapshot with K362 in a “down” position.

Figure 4.
Undirected hydrogen bonded network computed from the MD simulations with the excess proton located at different residues, based on a snapshot with K362 in “up” position. The nodes of the network are the protein residues (in gray) Y288, T359, K362, S365, H96, or E101, and the fifteen water molecules (in blue) in the channel. The residue carrying the excess proton is highlighted in magenta. Edges of the network correspond to hydrogen bonds and are shown as lines. The thickness of the lines indicate the probability of the hydrogen bonds. Hydrogen-bonded networks of models with protonated H96 and E101, respectively, are shown in Supplementary Figure S3.

Figure 5.
Directed hydrogen-bonded network computed from the MD simulations of “up” models with the excess proton located at different residues. The nodes of the network are the protein residues (in gray) Y288, T359, K362, S365, H96, or E101, and the fifteen water molecules (in blue) in the channel. The residue carrying the excess proton is highlighted in magenta. Edges of the network correspond to hydrogen bonds, shown as arrows pointing from donor to acceptor residue. The thickness of the lines indicate the probability of the hydrogen bonds. Hydrogen-bonded networks of models with protonated H96 and E101, respectively, are shown in Supplementary Figure S3.

Figure 6.
Undirected hydrogen-bonded network computed from the MD simulations with the excess proton located at different residues, based on a snapshot with K362 in “down” position. The nodes of the network are the protein residues (in gray) Y288, T359, K362, S365, H96, or E101, and the fifteen water molecules (in blue) in the channel. The residue carrying the excess proton is highlighted in magenta. Edges of the network correspond to hydrogen bonds and are shown as lines. The thickness of the lines indicate the probability of the hydrogen bonds. Hydrogen-bonded networks of models with protonated H96 and E101, respectively, are shown in Supplementary Figure S3.

Figure 7.
Directed hydrogen-bonded network computed from the MD simulations of “down” models with the excess proton located at different residues. The nodes of the network are the protein residues (in grey) Y288, T359, K362, S365, H96, or E101, and the fifteen water molecules (in blue) in the channel. The residue carrying the excess proton is highlighted in magenta. Edges of the network correspond to hydrogen bonds, shown as arrows pointing from donor to acceptor residue. The thickness of the lines indicate the probability of the hydrogen bonds. Hydrogen-bonded networks of models with protonated H96 and E101, respectively, are shown in Supplementary Figure S3.

Figure 8.
Position-dependent acceptance ratio for proton exchange in “up” models. Blue and minus signs indicate “downwards” (direction from Y288 to H96) transitions and red indicates “upwards” (direction from H96 to Y288) transitions. Dashed lines indicate the average position of protein residues E101 (red), S365 (brown), K362 (blue), and T359 (green). (a) Energy as only acceptance criterion, (b) existence of a hydrogen-bonded connection in the source replica (c) existence of a directed hydrogen-bonded connection in the source replica, (d) existence of a directed hydrogen-bonded connection in the source replica, and (e) existence of a directed hydrogen-bonded connection in the source and target replica as additional criterion.

Figure 9.
Position-dependent acceptance ratio for proton exchange in “down” models. Blue and minus signs indicate “downwards” (direction from Y288 to H96) transitions and red indicates “upwards” (direction from H96 to Y288) transitions. Dashed lines indicate the average position of protein residues E101 (red), S365 (brown), K362 (blue), and T359 (green). (a) Energy as only acceptance criterion, (b) existence of a hydrogen-bonded connection in the source replica (c) existence of a directed hydrogen-bonded connection in the source replica, (d) existence of a directed hydrogen-bonded connection in the source replica, and (e) existence of a directed hydrogen-bonded connection in the source and target replica as additional criterion.

Figure 10.
Difference in position-dependent acceptance for proton exchange between “downwards” (direction from Y288 to H96) transitions and “upwards” (direction from H96 to Y288) transitions, as a function of the transition step size as measured by the length of the hydrogen-bonded chain in “down” models. Blue and negative signs represent more “downwards”, and red represents more “upwards” transitions. The probabilities for “upwards” and “downwards” are shown separately in supplementary Figure S6. Dashed lines indicate the average position of protein residues E101 (red), S365 (brown), K362 (blue), and T359 (green). Criteria for proton transfer acceptance other than energy: (a) existence of a hydrogen-bonded connection in the source replica, (b) existence of a directed hydrogen-bonded connection in the source replica, (c) existence of a directed hydrogen-bonded connection in the source replica, and (d) existence of a directed hydrogen-bonded connection in the source and target replica as additional criterion.

Figure 11.
Difference in position-dependent acceptance for proton exchange between “downwards” (direction from Y288 to H96) transitions and “upwards” (direction from H96 to Y288) transitions, as a function of the transition step size as measured by the length of the hydrogen-bonded chain in “up” models. Blue and negative signs represent more “downwards”, and red represents more “upwards” transitions. The probabilities for “upwards” and “downwards” are shown separately in supplementary Figure S5. Dashed lines indicate the average position of protein residues E101 (red), S365 (brown), K362 (blue), and T359 (green). Criteria for proton transfer acceptance other than energy: (a) existence of a hydrogen-bonded connection in the source replica, (b) existence of a directed hydrogen-bonded connection in the source replica, (c) existence of a directed hydrogen-bonded connection in the source replica, and (d) existence of a directed hydrogen-bonded connection in the source and target replica as additional criterion.


Table 1.
Average positions (as measured by the height in cylinder) of the protonated water molecule in the different simulations.
Table 1.
Average positions (as measured by the height in cylinder) of the protonated water molecule in the different simulations.
| “Down” | Height/Å | “Up” | Height/Å |
|---|---|---|---|
| w15 | 22.8 ± 0.8 | w15 | 20.3 ± 1.0 |
| w14 | 21.6 ± 0.2 | w14 | 19.6 ± 0.7 |
| w13 | 19.9 ± 1.5 | w13 | 19.5 ± 0.5 |
| w12 | 18.2 ± 1.2 | w12 | 19.2 ± 1.0 |
| w11 | 17.7 ± 0.4 | w11 | 18.7 ± 0.5 |
| w10 | 17.5 ± 0.4 | w10 | 18.7 ± 1.7 |
| w9 | 16.9 ± 0.3 | w9 | 17.9 ± 0.6 |
| w8 | 15.4 ± 0.4 | w8 | 16.2 ± 1.1 |
| w7 | 9.9 ± 0.9 | w7 | 9.2 ± 1.1 |
| w6 | 9.7 ± 1.0 | w6 | 9.2 ± 1.4 |
| w5 | 9.2 ± 0.2 | w5 | 9.1 ± 0.9 |
| w4 | 8.4 ± 0.7 | w4 | 8.5 ± 1.2 |
| w3 | 3.9 ± 0.8 | w3 | 5.6 ± 0.2 |
| w2 | 3.9 ± 0.5 | w2 | 5.6 ± 0.2 |
| w1 | 3.5 ± 0.6 | w1 | 5.6 ± 0.2 |
Publisher’s Note: MDPI stays neutral with regard to jurisdictional claims in published maps and institutional affiliations. |
© 2021 by the authors. Licensee MDPI, Basel, Switzerland. This article is an open access article distributed under the terms and conditions of the Creative Commons Attribution (CC BY) license (http://creativecommons.org/licenses/by/4.0/).
Share and Cite
MDPI and ACS Style
Stegmaier, V.; Gorriz, R.F.; Imhof, P. Protonation Dynamics in the K-Channel of Cytochrome c Oxidase Estimated from Molecular Dynamics Simulations. Processes 2021, 9, 265. https://0-doi-org.brum.beds.ac.uk/10.3390/pr9020265
AMA Style
Stegmaier V, Gorriz RF, Imhof P. Protonation Dynamics in the K-Channel of Cytochrome c Oxidase Estimated from Molecular Dynamics Simulations. Processes. 2021; 9(2):265. https://0-doi-org.brum.beds.ac.uk/10.3390/pr9020265
Chicago/Turabian StyleStegmaier, Vincent, Rene F. Gorriz, and Petra Imhof. 2021. "Protonation Dynamics in the K-Channel of Cytochrome c Oxidase Estimated from Molecular Dynamics Simulations" Processes 9, no. 2: 265. https://0-doi-org.brum.beds.ac.uk/10.3390/pr9020265
Note that from the first issue of 2016, this journal uses article numbers instead of page numbers. See further details here.