Article

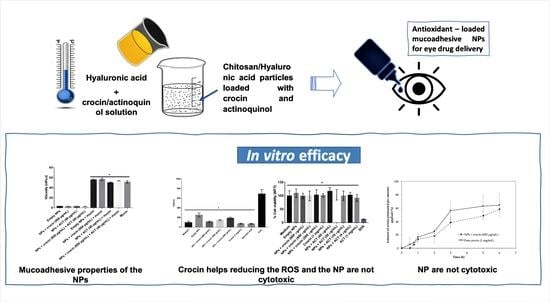
Antioxidant-Loaded Mucoadhesive Nanoparticles for Eye Drug Delivery: A New Strategy to Reduce Oxidative Stress

by
Sandra Cordeiro
1,
Beatriz Silva
1,2,
Ana Margarida Martins
1,
Helena Margarida Ribeiro
1,
Lídia Gonçalves
1,* and
Joana Marto
1,*
1
Research Institute for Medicines (iMed.ULisboa), Faculty of Pharmacy, University of Lisbon, 1649-003 Lisbon, Portugal
2
CIISA—Center of Interdisciplinary Research in Animal Health, Faculty of Veterinary Medicine, University of Lisbon, 1300-477 Lisbon, Portugal
*
Authors to whom correspondence should be addressed.
Submission received: 29 December 2020 / Revised: 3 February 2021 / Accepted: 10 February 2021 / Published: 19 February 2021
(This article belongs to the Special Issue Development and Characterization of Nanocarriers for Drugs)

Abstract

:
There are several approaches to treat ocular diseases, which can be invasive or non-invasive. Within the non-invasive, new pharmaceutical strategies based on nanotechnology and mucoadhesive polymers are emerging methodologies, which aim to reach an efficient treatment of eye diseases. The aim of this work was the development of novel chitosan/hyaluronic acid nanoparticle systems with mucoadhesive properties, intended to encapsulate antioxidant molecules (e.g., crocin) aiming to reduce eye oxidative stress and, consequently, ocular disease. An ultraviolet (UV) absorber molecule, actinoquinol, was also added to the nanoparticles, to further decrease oxidative stress. The developed nanoparticles were characterized and the results showed a mean particle size lower than 400 nm, polydispersity index of 0.220 ± 0.034, positive zeta potential, and high yield. The nanoparticles were also characterized in terms of pH, osmolality, and viscosity. Mucoadhesion studies involving the determination of zeta potential, viscosity, and tackiness, showed a strong interaction between the nanoparticles and mucin. In vitro release studies using synthetic membranes in Franz diffusion cells were conducted to unravel the drug release kinetic profile. Ex vitro studies using pig eye scleras in Franz diffusion cells were performed to evaluate the permeation of the nanoparticles. Furthermore, in vitro assays using the ARPE-19 (adult retinal pigment epithelium) cell line showed that the nanoparticles can efficiently decrease oxidative stress and showed low cytotoxicity. Thus, the developed chitosan/hyaluronic acid nanoparticles are a promising system for the delivery of antioxidants to the eye, by increasing their residence time and controlling their delivery.

Graphical Abstract

1. Introduction

Daily, living beings are exposed to oxidative stress (OS) due to reactive oxygen species (ROS) produced within the cells or in the environment [1]. In the case of humans, some of the most exposed and vulnerable tissues are located in the eye, such as the anterior segment, cornea, lens, and trabecular meshwork [2,3]. Reactive oxygen species may result from the normal aerobic cellular metabolism (mitochondrial electron transport chain) or from the incidence of UV radiation, among others. Cells possess several antioxidant defense systems that help to eliminate/neutralize ROS [2,3,4,5]. The OS causes an imbalance between the production of ROS and the antioxidant power of the cell, leading to damage in DNA and proteins, and causing harmful effects, which might even lead to cell apoptosis [2,3]. Oxidative stress can cause damage to neuronal cells, significantly contributing to the development of neurodegenerative diseases, such as Alzheimer’s disease, Parkinson’s disease, macular degeneration, glaucoma, and others [5]. The eyes are mostly affected by the incidence of UV radiation, which is responsible for some pathologies of the ocular tissues, such as glaucoma [2,3,4,5]. Therefore, the eye has evolved excellent antioxidant defenses that act at different levels and are mainly located in the more exposed ocular tissues [3]. The human eye has an approximately globular, very complex structure composed of several distinct tissues [6,7]. The tear film of the eye, the constant flow that exists on the cornea, is constituted by three main layers (the oily or lipid layer, the aqueous layer, and the mucus layer) and it has a normal mean pH value of 7.4 [8]. The eye is also composed of several barriers with the function to keep the systematic circulation separated from the ocular tissues, such as the cornea, the barrier for topical drug absorption, the retina, the barrier to macromolecules, and the sclera, the barrier to diffusion of macromolecules [6,7,9].
The most common eye neurodegenerative pathologies occur at the retinal level, and can affect the outer retina, such as in age-related macular degeneration, or the inner retina, in glaucoma [9,10]. The use of antioxidants for the therapeutics of neurodegenerative diseases is promising, because they have the capacity to scavenge ROS [5]. The cell antioxidant defense system involves enzymatic and non-enzymatic antioxidants [11,12]. The non-enzymatic antioxidants act by reducing ROS, originating more stable molecules, that are less noxious to cells. Examples of such antioxidants are ascorbic acid, vitamin E, vitamin A, reduced glutathione, and crocin [11]. Crocin is a rare carotenoid found in nature, which can easily be dissolved in water and, consequently, is widely applied as a colorant in food and medicine, in comparison to other carotenoids [13]. Crocin is responsible for the color of saffron (Crocus sativus L.) and its ethanolic extract has been used in traditional medicine for the treatment of numerous illnesses (e.g., tumors). Due to its powerful antioxidant activity, the extracts may also be useful for the treatment of brain neurodegenerative disorders and ocular diseases [14,15,16]. In terms of eye drug delivery, the treatment of posterior ocular diseases can be done by invasive or non-invasive approaches. Non-invasive drug delivery methods, like topical delivery, could potentially eliminate the risks of injection into the eyes, but their development has been challenging due to the unique anatomy of the eye, which limits the bioavailability of these non-invasive treatments [17,18]. In fact, one of the major challenges in ophthalmic drug delivery is to overcome the physical and blood-ocular barriers of the eye. It has been suggested that nanoparticles (NPs), capable of encapsulating and delivering drugs to the eye, may help overcome these barriers [18]. Nanoparticles can be produced through chemical processes or simple self-assembly processes and be tailored to control the release of therapeutic agents [18,19,20,21]. The properties of the NPs are important factors in ocular delivery, such as their surface charge, which determines their distribution in different regions of the eye, their size, since they need to be small enough to penetrate the ocular barriers, and their long-term release of the drug, which reduce the frequency of administration [18,19].
Polymers with mucoadhesive properties used to develop drug delivery systems (DDS) may increase drug bioavailability, through the increase of its retention time [22,23,24]. In the case of eye drug delivery systems, these polymers can attach themselves to corneal or conjunctival mucin, through non-covalent bonds, and this mucoadhesive property enhances bioavailability, through the prolongation of residence time, increased rate of absorption, and drug targeting [22,25,26]. Mucoadhesion is characterized by the interaction between the adhesive molecules and mucus glycoproteins, followed by the establishment of secondary chemical bonds. In the case of the eye, the interaction occurs between the mucoadhesive DDS and eye mucins, with subsequent formation of non-covalent bonds [22,25,27]. The used mucoadhesive polymers can be water-soluble or water-insoluble and should have enough hydrogen-bounding chemical groups, anionic surface charges, high molecular weight, high chain flexibility, induction of spreading by surface tensions, be non-irritant, and their degradation products should be nontoxic [22,25,26].
Currently, chitosan (CS) and hyaluronic acid (HA) are two of the most used mucoadhesive polymers in DDS [8]. Chitosan is derived from chitin, by deacetylation, and presents mucoadhesive properties as well as pH response, with shear thinning and viscoelastic behavior [8,23,27]. This polymer is biocompatible, biodegradable, and shows antimicrobial and wound healing properties [27]. The mucoadhesive properties of CS are based on electrostatic interactions between its positively charged amino groups and the negatively charged sialic acid residues of mucin, which prolong the residence time of the polymer in the eye cornea [23,27,28]. Hyaluronic acid is a high molecular weight linear polymer composed of long chains of repeating disaccharide units of N-acetylglucosamine and glucuronic acid, which is present in the synovial fluid and extracellular matrix of connective tissues in vertebrates [27,29,30,31]. This polymer is frequently used in ocular DDS, such as eye drops, due its biocompatibility, biodegradability, and mucoadhesive properties which extend the pre-corneal residence time [27,32]. Hyaluronic acid also protects the corneal epithelium against dehydration, reduces healing time, decreases the inflammatory response caused by dehydration, and lubricates of the ocular surface [32].
The goal of the study reported herein was to prepare and evaluate an eye drop formulation containing CS/HA NPs for the delivery of crocin and actinoquinol (ACT) into the eye. Actinoquinol (C11H11NO4S) is a chemical compound that acts by absorbing UVB radiation. Thus, when combined with HA in eye drops, it can provide protection against the damaging effect of UVB radiation [33,34]. The ACT-HA eye drops help maintaining corneal optics and suppress oxidative damage in the UVB-irradiated cornea [34]. The NPs were characterized in terms of mean particle size, polydispersity index, zeta potential, encapsulation efficiency, shape, interaction between components, and stability. To the best of our knowledge, there is no reference in the literature showing the potential of these nanoparticulate systems for the successful ocular administration of antioxidants.

2. Materials and Methods

2.1. Materials

Low-molecular weight chitosan (LMW CS, 100 kDa, 92% deacetylation) was obtained from VegeTec (La Riche, France), sodium hyaluronate PrimalHyal™ brand (50 kDa, 1000 kDa, 3000 kDa) from Soliance (Argenteuil, France), and the sodium hyaluronate eye drop grade quality (300 kDa—Eye) from Shandong Topscience was a kind gift from Inquiaroma (Barcelona, Spain). Sodium chloride (NaCl) was from AppliChem (Darmstadt, Germany), ACT was from TCI Deutschland GmbH (Eschborn, Germany), while crocin, 10 mM phosphate-buffered saline (PBS), and mucin from porcine stomach were obtained from Sigma-Aldrich (Irvine, UK). All other reagents and solvents were of the purest grade available and were generally used without further treatment. Purified water was of Milli-Rx quality (Merck Millipore, Darmstadt, Germany).
The ARPE-19 (ATCC® CRL-2302™) cell line was obtained from the American Type Cell Culture collection (Manassas, VA, USA). Cell culture media and supplements were from Gibco (Thermo Fisher Scientific, Paisley, UK). The dyes used in the cytotoxicity studies were from Sigma-Aldrich (Irvine, UK) and from Molecular Probes (Thermo Fisher Scientific, Paisley, UK).

2.2. Methods

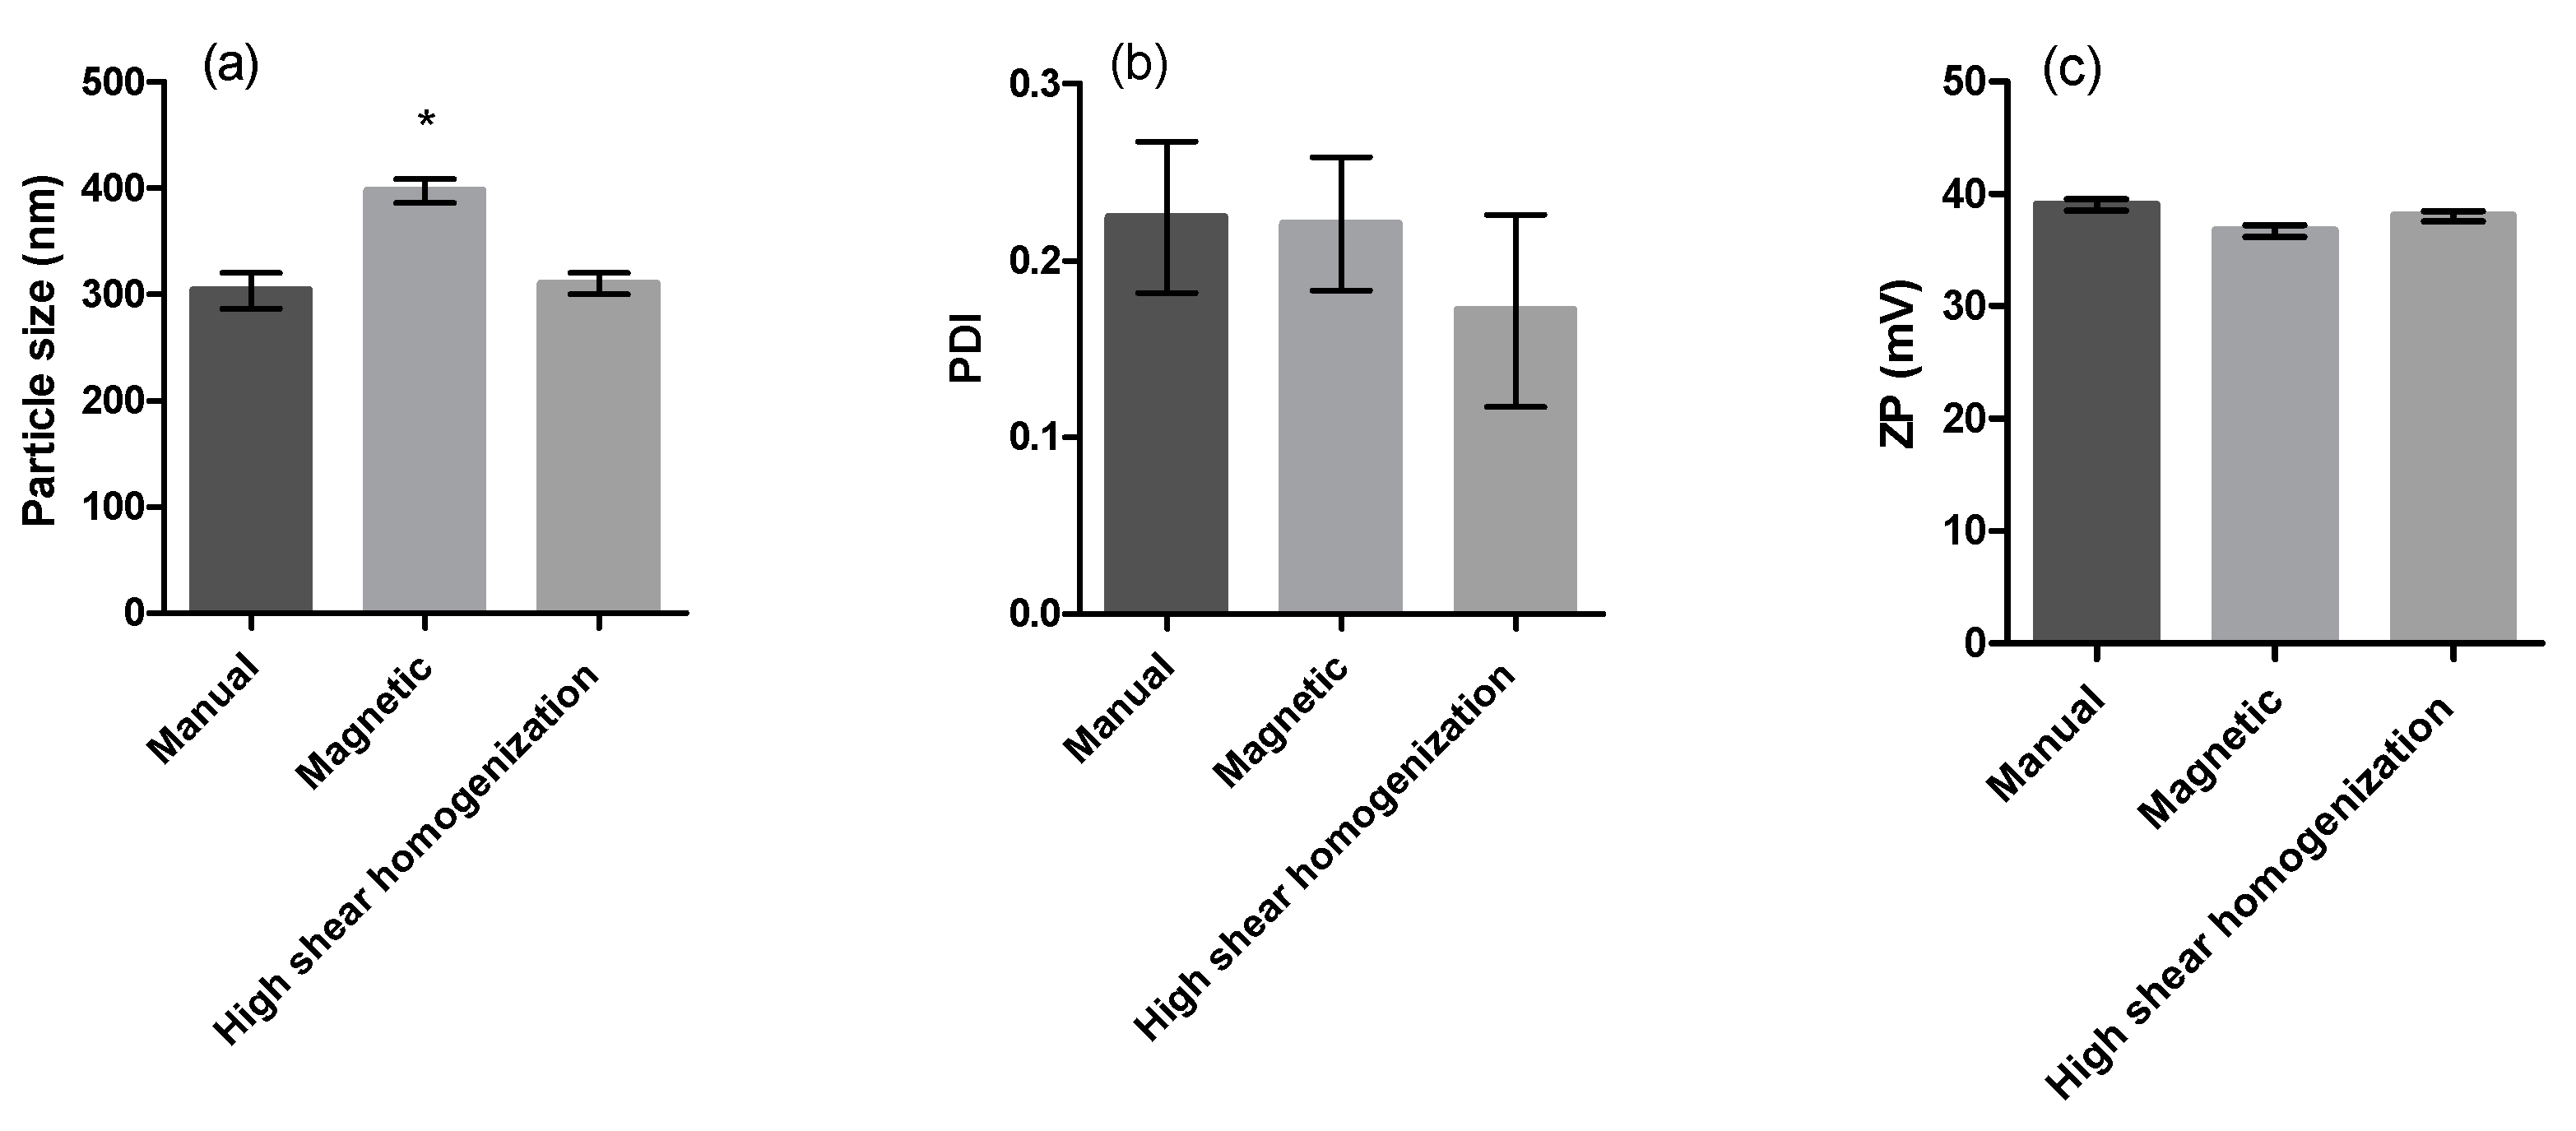
2.2.1. Manufacturing Process

The CS/HA, CS/HA/crocin, CS/HA/ACT, and CS/HA/crocin/ACT nanoparticles were prepared using an ionic gelation technique, based on the complexation between oppositely charged macromolecules, such as the establishment of hydrogen and ionic bonds between the positively charged amino groups of CS and carboxyl groups of HA, as previously described [27,35]. The homogenization process was done by magnetic stirrer at 300 rpm for 15 min, with high shear homogenization using Ultra-Turrax T10 basic at 1400 rpm (IKA-Labortechnik, Germany) for 15 min and 2 min by manual stirring. Low-molecular weight CS 1% (w/v) was prepared in a 1% (v/v) acetic acid aqueous solution. The CS solution was diluted in 0.9% NaCl to prepare 1 mg/mL CS solutions, with pH adjusted to 5.0 using 1 N NaOH. To prepare CS/HA nanoparticles, solutions of HA with different molecular weight were prepared (HA 50 kDa, HA 1000 kDa, HA 3000 kDa, and HA 300 kDa at 10 mg/mL). The CS/HA/crocin NPs were obtained by adding different volumes of the solutions of HA and crocin (1 mg/mL) to the CS solution. The range of tested crocin concentrations was from 4 to 1200 µg/mL. The same process was used to prepare CS/HA/ACT NPs, but the ACT solution (1 mg/mL) was added to the CS solution instead of being added to the HA solution. The range of concentrations tested for ACT was from 4 to 40 µg/mL. The CS/HA/crocin/ACT NP was obtained by combining the two processes of preparation of CS/HA/crocin and CS/HA/ACT NPs. All the solutions previously mentioned were prepared at room temperature and using purified water.

2.2.2. Nanoparticles Characterization

The particle size and size distribution (polydispersity index, PDI) were determined by dynamic light scattering using a Zetasizer Nanoseries Nano S (Malvern Instruments, Malvern, UK). The Zeta Potential (ZP) was measured using a Zetasizer Nanoseries Nano Z (Malvern Instruments, Malvern, UK). The samples were diluted in filtered 0.22 μm purified water and analyzed at 25 °C. The process yield was determined by the measure of the absorbance at 600 nm [35] using FLUOstar Omega with a resolution from 1 to 10 nm (The Microplate Reader Company, BMG LABTECH, Ortenberg, Germany). All the measurements were performed at room temperature and in triplicate (n = 3), and the results are presented as the mean ± standard deviation (SD).

Encapsulation Efficiency and Drug Loading Determination

To determine the percentage of the drug encapsulation efficiency (%EE), 1 mL of each of the samples (CS/HA/crocin, CS/HA/ACT and CS/HA/crocin/ACT NPs) was centrifuged at 15,000× g for 15 min. The supernatant was analyzed to quantify the amount of free drug by measuring the absorbance at 324 nm for crocin and 305 nm for ACT using UV-Visible spectrophotometry (FLUOstar Omega, BMGLabtech, Ortenberg, Germany). The concentration of each drug in the supernatants was determined using calibration curves (500 µg/mL to 244 ng/mL concentration range for crocin and 250 µg/mL to 244 ng/mL, for ACT). The crocin and ACT %EE and percentage of drug loading (%DL) of NPs were determined using the following equations [35]:
%   EE   =   ( C t - C f ) C t   ×   100 ,
%   DL   =   ( C t - C f ) W np   ×   100 ,
where Cf is the concentration of free crocin/ACT, Ct is the total concentration added to the NP, and Wnp is the weight of the NPs.

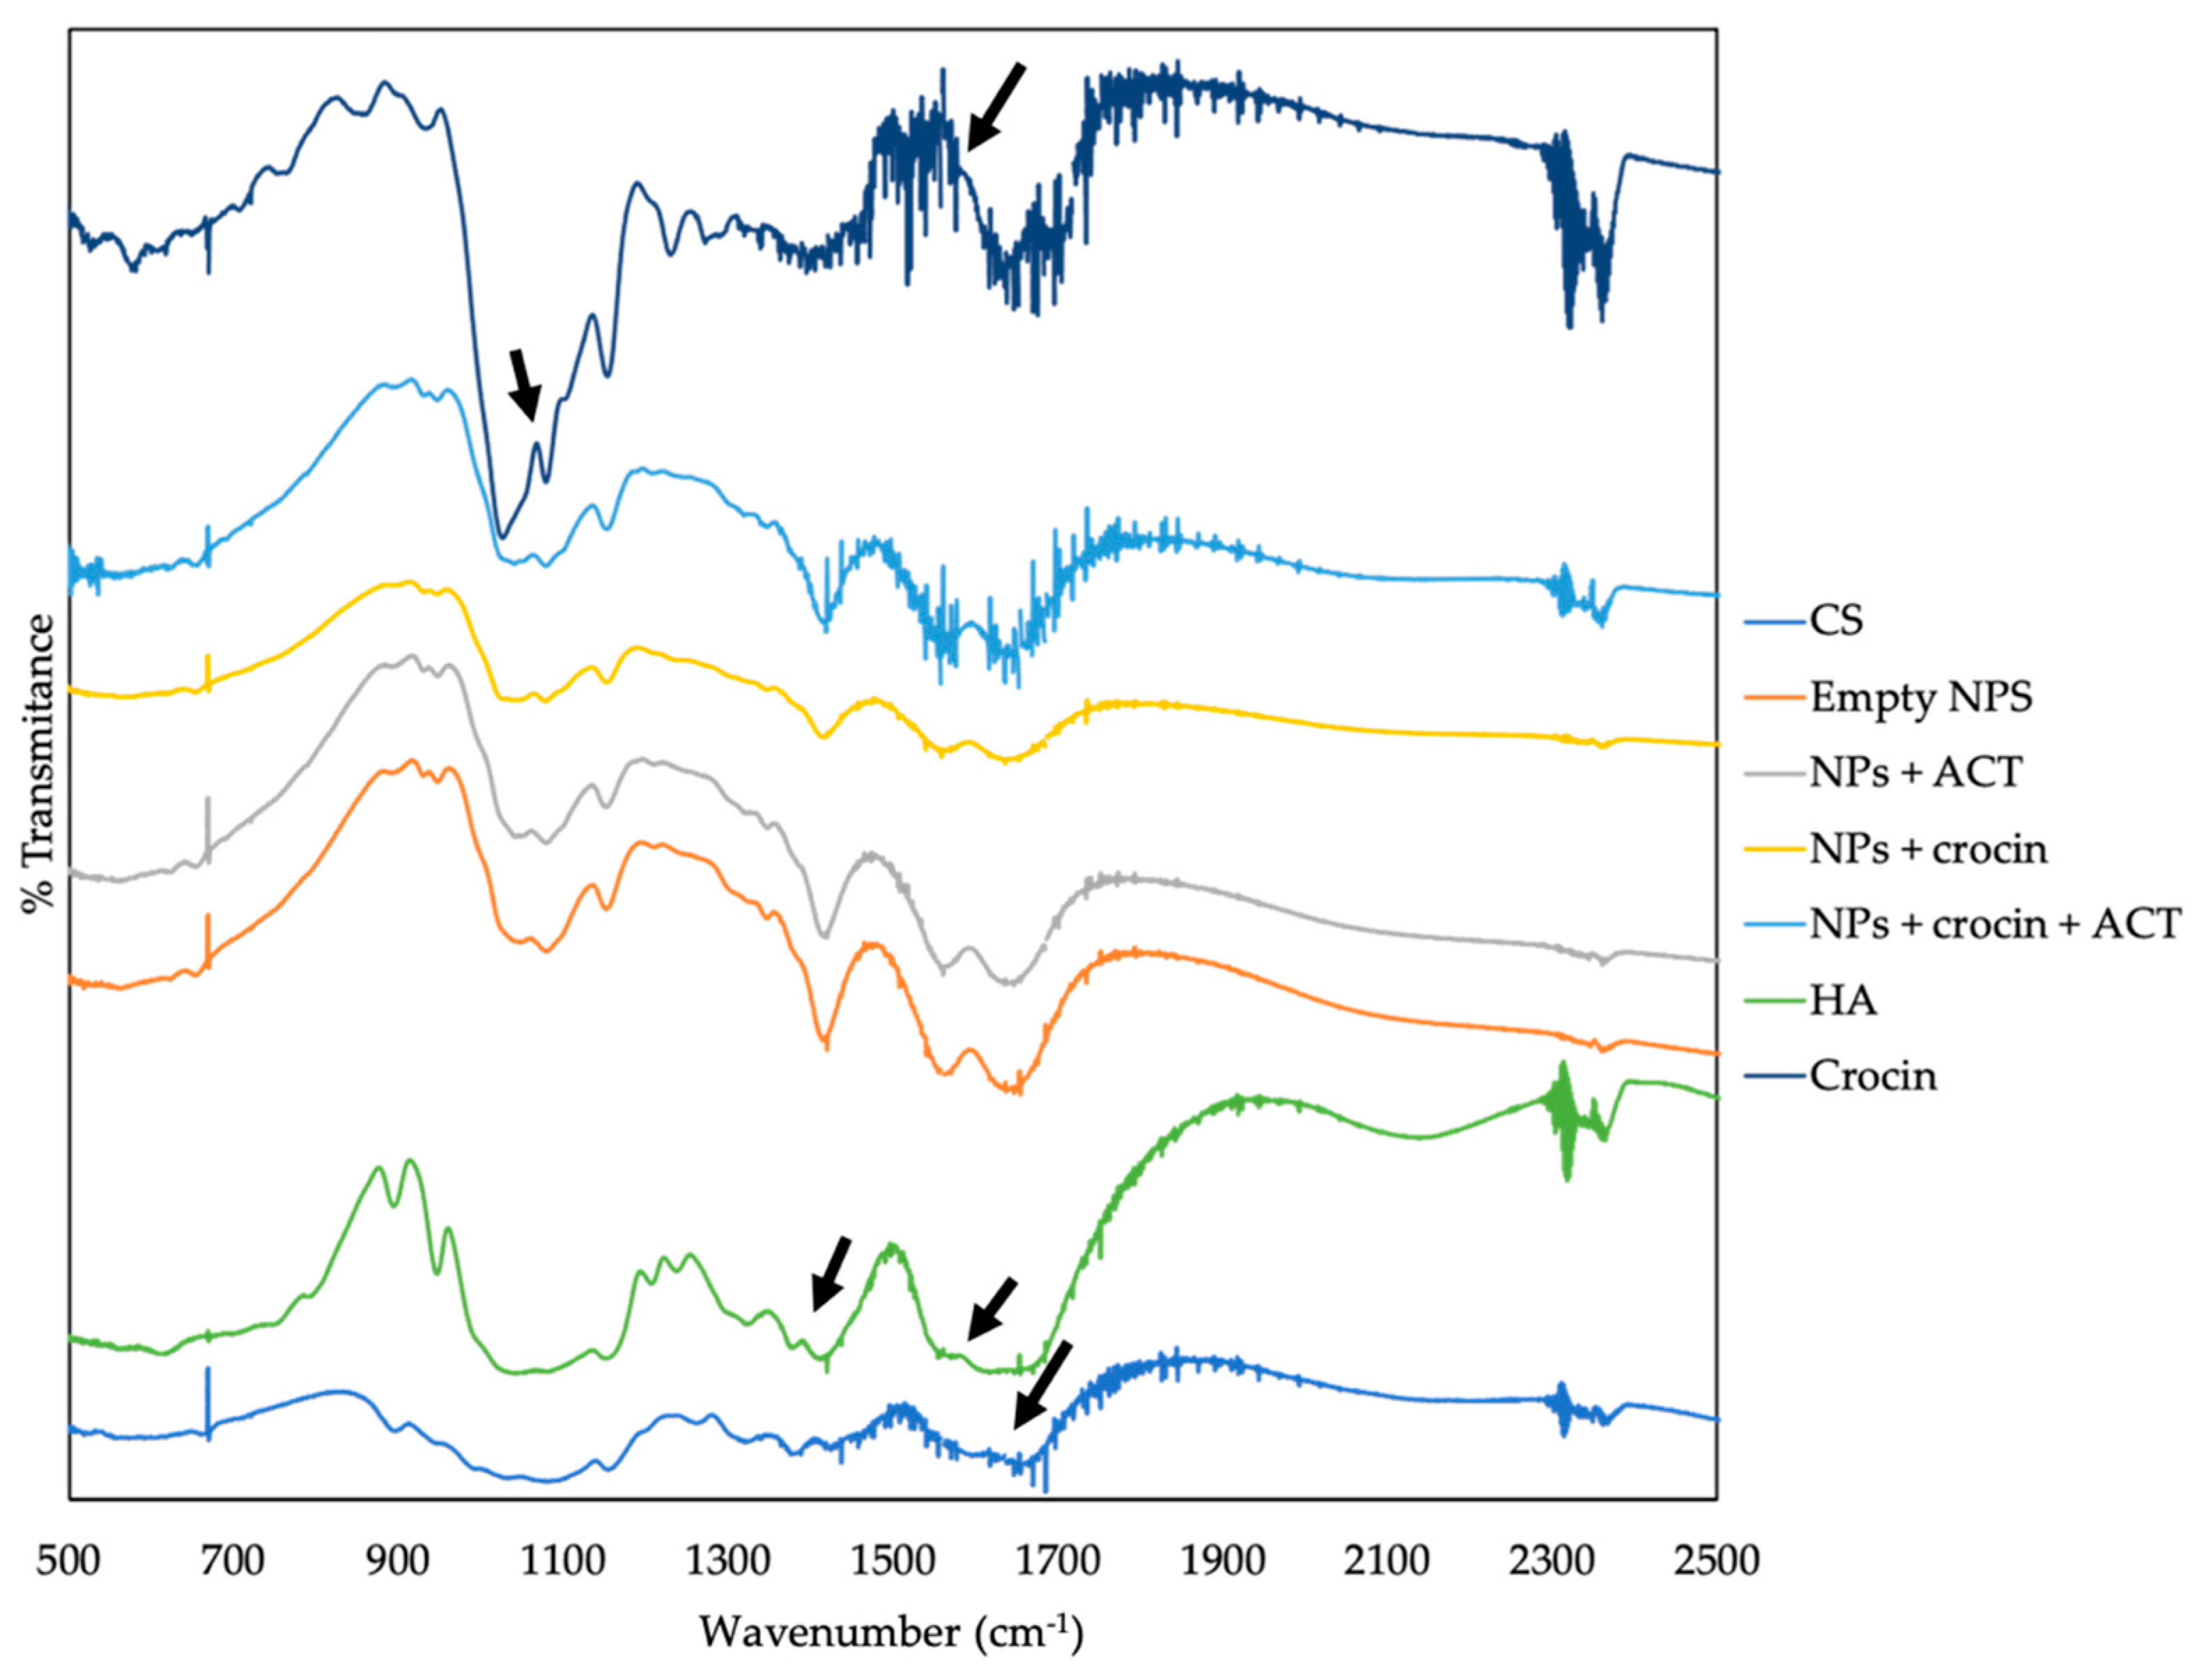
Fourier-Transform Infrared Spectroscopy (FTIR)

For the FTIR analyses, the nanoparticles were freeze-dried for 24 h in the presence of trehalose (10% w/v) as cryoprotector (Christ Alpha 1–4, Osterode am Harz, Germany). The freeze-dried NPs were then mixed with KBr (3:1 KBr/sample ratio) and, after compression, the tablets were analyzed in an IRAffinity-1 (Shimadzu Corporation, Kyoto, Japan). All spectra were recorded at room temperature at a 4 cm−1 resolution and 50 times scanning between 4000 and 500 cm−1.

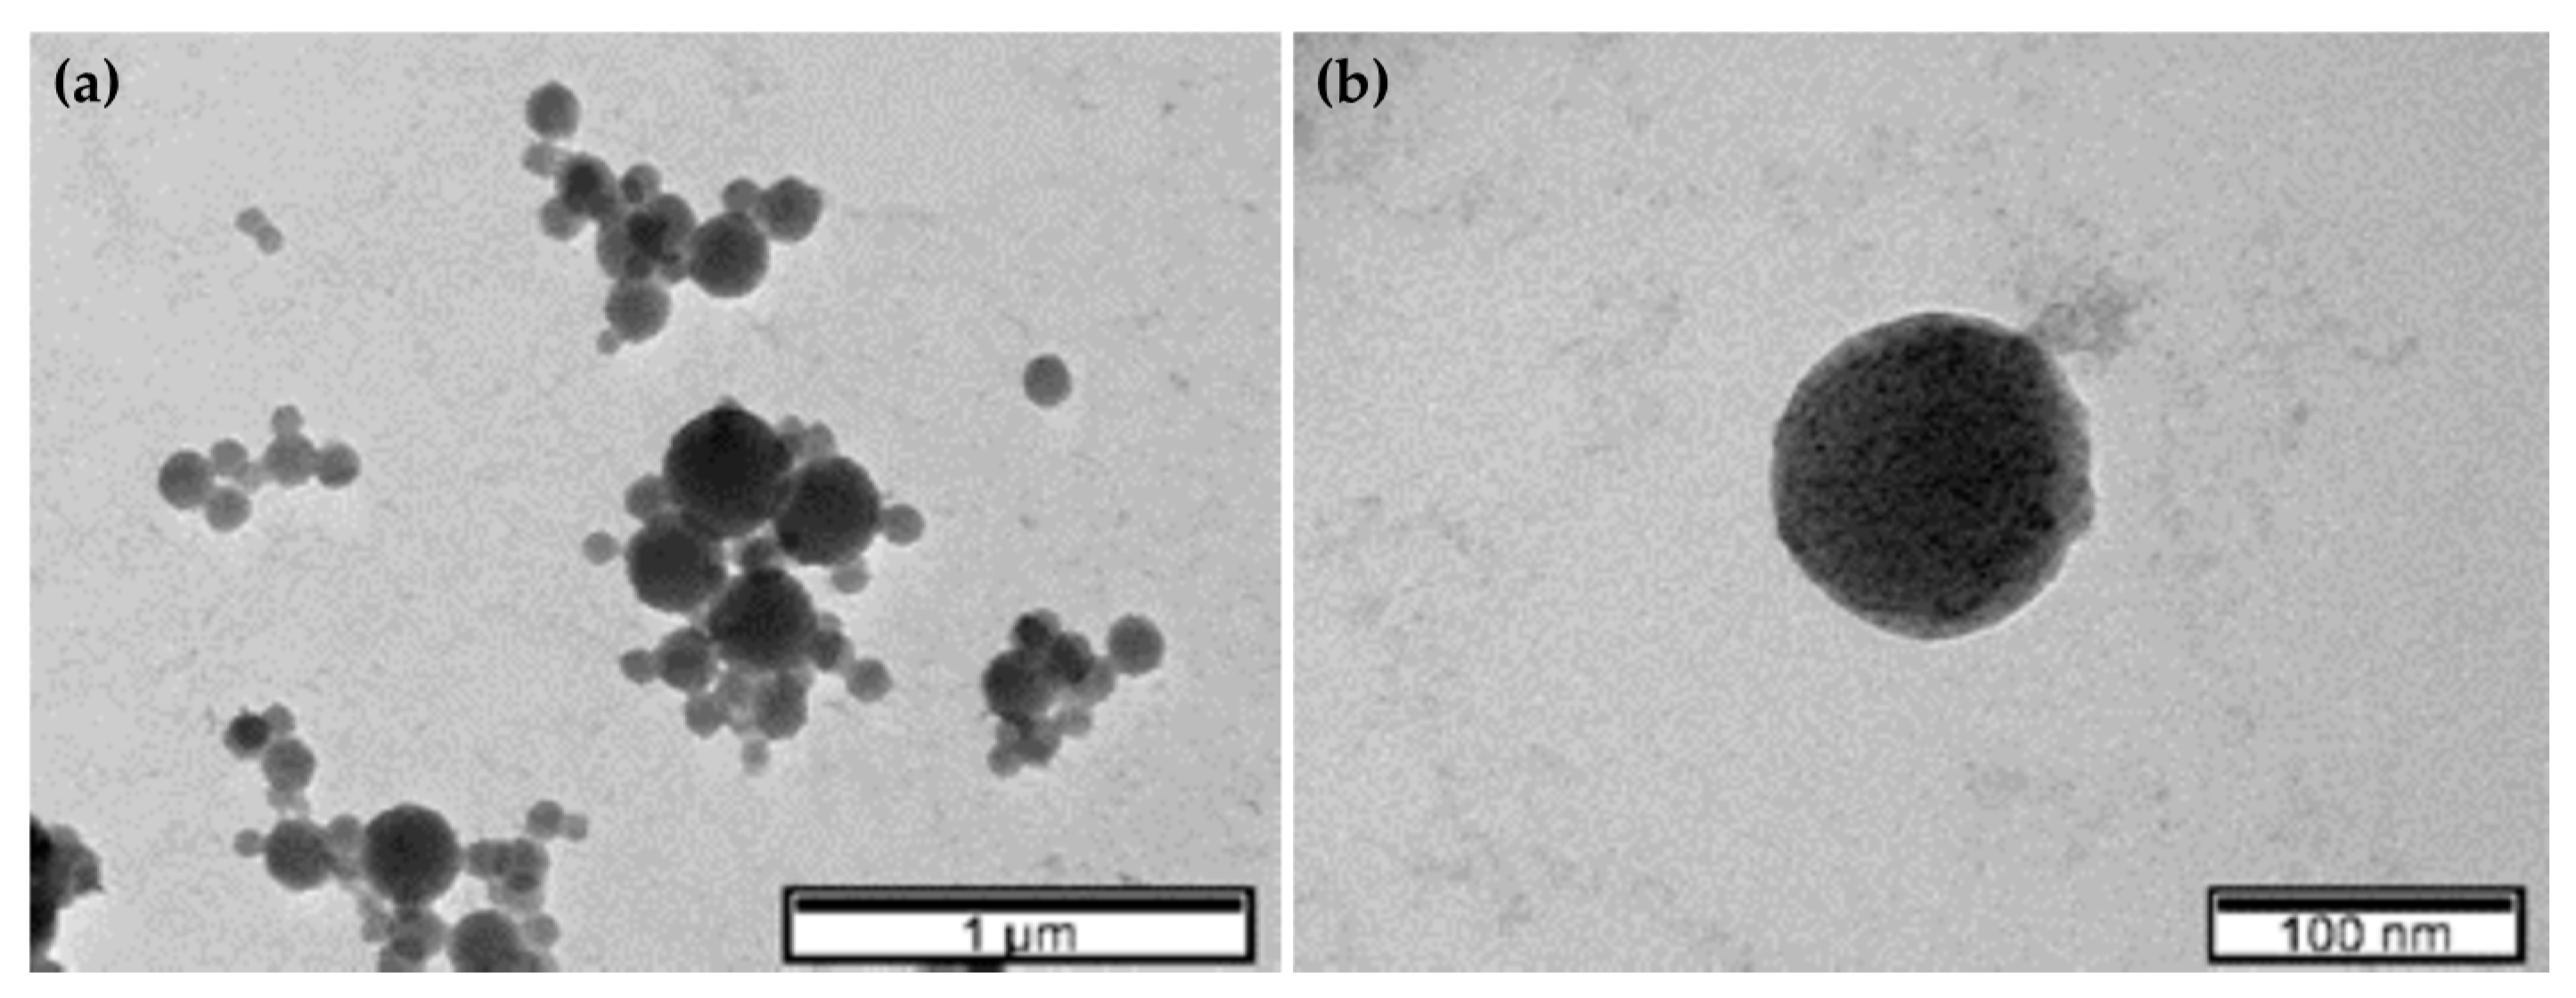
Transmission Electron Microscopy (TEM)

The particles morphology analysis was performed using TEM according to the method described by Marto et al. [36]. The optimized NPs were applied to the cooper grid, dried at room temperature, and analyzed on Hitachi 8100 with ThermoNoran light elements EDS detector and digital image acquisition.

2.2.3. Stability Testing

For the stability test, NPs were characterized and analyzed in terms of size, PDI, and ZP, using the Zetasizer Nanoseries Nano S (for the size and PDI) and Zetasizer Nanoseries Nano Z (for ZP). The testing was performed for 32 days, with samples collected at days 0, 8, 15, and 32. The times used for the stability studies were chosen based on a one-month preliminary study. All the measurements were executed in triplicate (n = 3) at 4 °C and the results were presented as mean ± SD.

2.2.4. In Vitro Assays

In these assays, the NP were tested for their cytotoxicity in human cells, and their antioxidant activity was evaluated. The ARPE-19 (human retinal pigment epithelial) cell line was maintained in RPMI 1640 culture medium supplemented with 10% fetal bovine serum, 100 units/mL of penicillin G (sodium salt) (Life Technologies, Paisley, UK), 100 μg/mL of streptomycin sulfate, and 2 mM L-glutamine, at 37 °C and 5% CO2.

Cytotoxicity

The cytotoxicity was evaluated in the ARPE-19 (human retinal pigment epithelial) cell line (ATCC® CRL-2302™) as previously reported by Silva et al. [35]. Two endpoints were analyzed after 24 h of exposition of the 2 × 10⁴ cells/well to the different nanoparticles preparations, the cell membrane integrity by propidium iodide (PI) uptake and the cell metabolic state by the 3-(4,5-dimethyl-2-thiazolyl)-2,5-diphenyl-2H-tetrazolium bromide (MTT) reduction assays
The relative cell viability (%), i.e., the viability compared to control cells, was calculated for each cytotoxicity method, PI uptake ratio (3), and MTT (4) assays [35]:
PI   uptake   ratio   =   Fluorescence sample Fluorescence control   ,
Cell   viability   ( % )   =   [ ( Absorbance ) ] sample [ ( Absorbance ) ] control   ×   100 .

Oxidative Stress Tests

The intracellular ROS production by chemical (500 µM, H2O2) and by physical induction (UV radiation incidence) was evaluated using the 2′,7′dichlorofluorescein diacetate (H2DCFDA, ThermoFisher Scientific, Paisley, UK) probe in ARPE-19 cells according to a previously published procedure [37]. Briefly, the probe was added to the wells to a final concentration of 20 µM. After 30 min of incubation in the same conditions, the medium was replaced by fresh medium and the different NPs were added to the respective wells (10 µL/well). The cells were incubated again for 2 h in the same conditions.
The relative ROS production percentage compared to control cells was calculated and expressed as shown in Equation (5) [37]:
Fluorescence   ratio   =   Fluorescence exposed   cells Fluorescence unexposed   control .

2.2.5. In Vitro Release and Permeation Studies

The in vitro release and permeation studies of the NPs with crocin and free crocin solution were performed using Franz diffusion cells, with either cellulose membranes (release studies) or pig eyes scleras (permeation studies). The donor phase consisted of 200 µL of each sample, six samples of each NP, and six samples of the free crocin solution (n = 6), while the receptor compartment was filled with 3 to 3.5 mL of PSB pH 7.4. The Franz cells were incubated at 37 °C with magnetic stirring at 300 rpm. Volumes of 200 µL were collected from the receptor phase every 15 min until 1 h and, afterwards, every hour until 24 h, and replaced with the same volumes of PBS solution maintained at the same temperature. The collected samples were used to determine the amount of crocin released, by UV-spectrophotometry at 324 nm, in a microplate reader (FLUOstar Omega, Champigny-sur-Marne, France). The percentage of cumulative amount of crocin (Qt) permeated through the membrane (% µg/cm2) was plotted as a function of time and determined using Equation (6) [35]:
Q t   ( % )   =   V r   ×   C t   +   t = 0 t - 1 V S   ×   C i A M   ×   100 μ gCF ,
where Ct is the crocin concentration in the receptor solution at each sampling time, Ci is the crocin concentration in the receptor solution at each past sampling time, Vr is the volume of the receptor solution, and Vs is the volume of the sample. The AM value is the membrane area (1 cm2). The weight of CF (µg) corresponds to:
CF   ( µ g )   =   m NP / solution   in   Franz   cell   ( g )   ×   C NP / solution   ( mg / g )   D NP / solution   ×   1000 ,
where mNP/solution is the mass of NP/solution in the Franz cell, CNP/solution is the concentration of the NP/solution, and DNP/solution is the density of the NP/solution.
To evaluate the mechanism of crocin release from the NPs, the in vitro release data obtained were computed using DDsolver [38], an excel-plugin module, and fitted to four different kinetic models [39]:
(i)
Zero order kinetics
Q t =   Q 0 +   K 0 t ,
where Q0 is the initial amount of crocin, Qt is the cumulative amount of drug release at time t, and K0 is the zero-order release constant.
(ii)
First order kinetics
log   Q t = logQ 0 -   K 1 t 2 . 303 ,
where Q0 is the initial amount of crocin, Qt is the cumulative amount of drug release at time t, and K1 is the first order release constant.
(iii)
Higuchi model
Q t = K H   t ,
where Qt is the cumulative amount of drug release at time t and KH is the Higuchi constant.
(iv)
Korsmeyer-Peppas model
F   =   K KP ×   t n ,
where KKP is the release constant incorporating structural and geometric characteristics of the drug-dosage form and n is the diffusional exponent indicating the drug-release mechanism.
The best fitted model was selected based on the highest correlation coefficient (R2) values and lowest Akaike information criterion (AIC).

2.2.6. Mucoadhesion Studies

These studies were carried out using three different methods: viscometry, rheology, and ZP.

Ostwald Viscometer

The viscosity of the NPs diluted 1:1 in water, the viscosity of the NPs added to mucin in a 1:1 ratio, and the viscosity of the mucin dispersion in water (1 mg/mL) were measured at 25 °C, using a capillary Ostwald Viscometer, and each determination was repeated three times (n = 3). The viscosity component due to bioadhesion or rheological synergism parameter (∆η) was calculated with Equation (12) [40]:
Δ η   =   η mix -   ( η muc +   η pol ) ,
where ηmix is the viscosity of the NP-mucin mixture (mPa·s); ηpol is the viscosity of the NP having the same concentration as in the mixture; ηmuc is the viscosity of mucin dispersion having the same concentration as in the mixture (mPa·s).

Rotational Rheometer

The rheological characteristics of the NPs were examined using a controlled stress Malvern Kinexus Lab + Rheometer (Malvern Instruments, Malvern, UK). The adhesive strength was also measured with a plate and plate geometry. A toolkit was used, with the conditions of 0.1 mm/s, 5 mm, and 0.15 mm of GAP at 20–25 °C. All the measurements were executed six times (n = 6), and data are presented as the mean ± SD.

Zeta Potential

Another method to evaluate the interaction between the NPs and mucin is the measurement of the ZP of the NPs with and without mucin. The method used was as described in Section 2.2.2. All the measurements were executed in triplicate (n = 3) at room temperature and data are presented as the mean ± SD.

2.2.7. Statistical Data Analysis

Statistical evaluation of data was performed using one-way analysis of variance (ANOVA). The Tukey–Kramer multiple comparison tests (GraphPad PRISM 5 software, La Jolla, CA, USA) were used to compare the significance of the difference between the groups, and results were considered statistically significant for p < 0.05.

3. Results and Discussion

3.1. Manufacturing Process and Nanoparticles Characterization

Mucoadhesive polymers have characteristics that make them a good choice for NPs to be used as DDS. Among others, these polymers are nontoxic, biodegradable, are able to encapsulate drug molecules and protect them from degradation, prolong the residence time and bioavailability of the encapsulated drug in the ocular surface, and constitute a non-invasive DDS [17,18,27]. In this research work, NPs of CS and HA were prepared aiming to interact with the ophthalmic mucosal barrier and to facilitate the transport of an antioxidant, crocin, and a UV absorber, ACT.
The NPs were prepared by the ionic gelation technique, as previously described in Section 2.2.1. First, different mass proportions of CS and HA were tested, with different molecular weight HA (HA 50 kDa, HA 1000 kDa, HA 3000 kDa, and HA Eye), and different CS solvents (H2O and 0.9% NaCl). The pH of CS solution was adjusted to 5, so the positively charged amino groups of CS can interact with the negatively charged groups of added HA and with the mucin of the eye [8,24,41]. The NPs yield, particle size, PDI, and ZP were determined. The study of the characteristics of CS/HA NPs was previously performed by Silva et al. [35]. The 1:1 CS:HA eye mass ratio resulted in the best characteristics in terms of particle size (339 ± 11 nm), PDI (0.220 ± 0.034), and ZP (+44.5 ± 0.7 mV). These results agree with data previously reported in the literature [41].
In preliminary studies, it was observed that the addition of crocin to the solution of HA resulted in higher encapsulation of crocin than when crocin was added to a CS solution. This can be attributed to the different pH value of the solutions which promotes different ionization groups that will determine the interactions between the different components. The same studies were conducted with the ACT molecule and the best encapsulation was obtained when this molecule was added to the HA solution. Thus, the method used in this work was the addition of crocin to the solution of HA and the addition of ACT to the CS solution.
The technique used for the preparation of the NPs has been reported to produce particles with sizes in the range of 200–500 nm, spherical shape, and positive charge, with a ZP of +30.0 to +57.0 mV, which validates the results obtained in this work and indicates that the NPs are stable [18,27,35]. The ZP indicates that the NPs are positively charged, promoting repulsion between them, and keeping them stable. The positive charge also promotes the interaction between the NPs and the mucin of the eye surface, which is negatively charged, increasing the retention time of the drug in the eye [23,27]. The PDI should be the lowest possible in order to promote the corneal uptake and stabilize the NPs [23,27]. The results obtained for PDI (<0.300) show no significant differences between the sizes of the different NPs.
After the optimization of the composition of NPs, the production process was optimized by testing three types of homogenization: manual, magnetic stirring, and high shear homogenization (Figure 1).
The method of homogenization has an impact on the NPs size and PDI (Figure 1). This could be due to the fact that better homogenization of the NPs enables a better interaction between the different components of the NPs. The homogenization with magnetic stirring produces significantly (p < 0.0001) larger NPs (397.6 ± 4.3) when compared to the other two types of homogenization (303.7 ± 2.8 nm e 310.3 ± 4.7 nm, for manual and high shear homogenization, respectively). For PDI and ZP (Figure 1b,c), no significant differences (p > 0.05) were observed. However, since the value obtained for PDI when using the high shear rate homogenization is lower (0.172 ± 0.027), this homogenization method was chosen to be used during the production process of the NPs.

3.1.1. Encapsulation Efficiency and Drug Loading Determination

The encapsulation of crocin and of ACT were evaluated using the optimized method (CS:HA Eye, 1:1, high shear homogenization). These two compounds were chosen due to their ROS reduction properties. Since the eye is very affected by the incident of light [3], ACT was used in the NPs which, together with the HA, can absorb the UV radiation and decrease the ROS effects on the eye [22,34]. Crocin, on the other hand, is a carotenoid that can scavenge ROS, especially superoxide anions, reducing their concentration [14,15].
A higher percentage of encapsulation efficiency was obtained for crocin than for ACT (Table 1). Increasing ACT concentration does not result in an encapsulation increase, possibly due to interactions between ACT, HA, and CS, separately [22,34]. This interaction may be affected by the bonds between HA and CS. FTIR studies were used to evaluate the interaction between all the components used for the CS/HA, CS/HA/crocin, CS/HA/ACT, and CS/HA/crocin/ACT NPs (Figure 2). Although ACT was not efficiently encapsulated in the NPs, it still absorbs UV radiation [22,34] and was kept in the NPs and evaluated in subsequent OS studies (results in Section 3.3.2).
The CS/HA/crocin, CS/HA/ACT, and CS/HA/crocin/ACT NPs were also characterized in terms of size, PDI, and ZP (Table 2). No statistically significant differences were observed between the NPs, and the results of crocin and ACT encapsulations agree with what has been reported in the literature [18,27,35].

3.1.2. FTIR

For a better analysis of the interactions between the NP components, a FTIR analysis was performed (Figure 2).
In all the spectra shown, it is possible to observe bands between 675 and 900 cm−1 (out-of-plane bands) that are also characteristic of the aromatic substitution pattern [42]. The pure HA spectrum (orange) shows a band at 1406 cm−1 for N-H bending vibration, which is one of the characteristic bands of this compound. The bands between 1640–1690 cm−1 present in the spectra of pure HA and pure CS are assigned C=O stretching of amide I. This region is also the most characteristic of CS [43,44]. In the same figure, it is also possible to identify two bands that are characteristic of the pure crocin spectrum (around 1070 cm−1 and around 1612 cm−1). The band of 1070 cm−1 is assigned to the C–O sugar groups of crocin [45]. The second band is assigned to the asymmetric and symmetric stretching peaks of carboxylic groups and slightly shifted from 1612 to 1615 cm−1 after complexation with CS [46]. The fact that the bands referred above suffer a shift in the spectra of the NPs in comparison with the spectra of the pure compounds reveal the interactions between the NP’s components (covalent and non-covalent bonds).

3.1.3. TEM

The morphology of the NPs was evaluated by TEM (Figure 3a,b) [47]. The images show NPs with a spherical morphology, which agrees with the described shape of this kind of NPs in the literature [28]. This shape is clear in image (b), which was obtained at a higher amplification. Figure 3a also shows the polydispersity of the NPs sample. To evaluate if the added compounds have any influence in the morphology of the initial NPs, further studies should be performed.

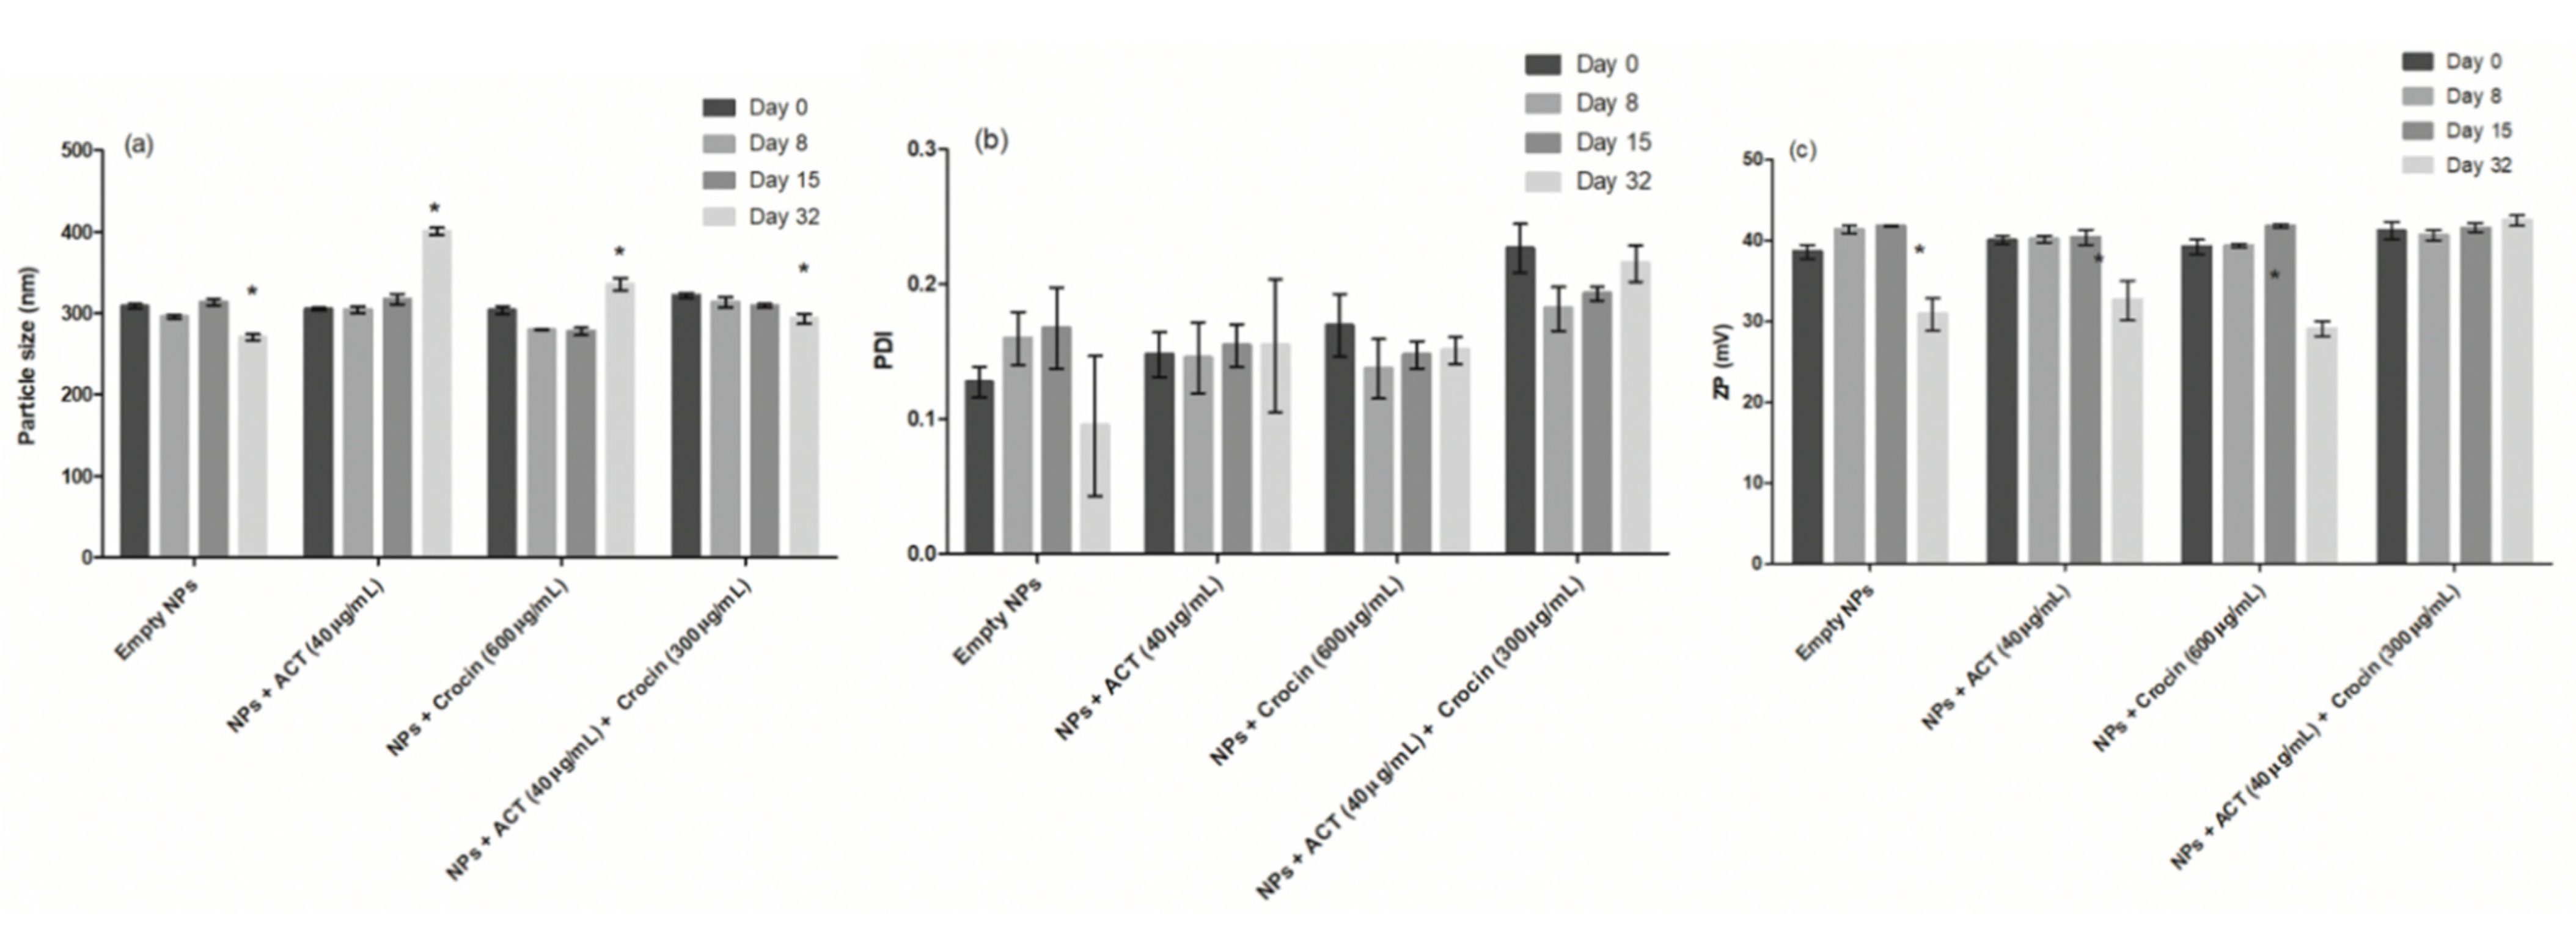
3.2. Stability Tests

The stability tests are essential to evaluate for how long the NPs will maintain their properties and will be viable to be used as a DDS. Therefore, the NPs size, PDI, and ZP were determined at 0, 8, 15, and 32 days after they were produced (Figure 4). The time points used for this study were chosen based on a one-month preliminary study, where the observation of nanoparticles at 4 °C showed some aggregation for those with encapsulated drug. Thus, the stability study was performed for a period shorter than one month, to evaluate if the properties of the NPs were maintained and to check if there were differences between empty NPs and NPs with encapsulated drug.
The results show that the NPs were not stable 32 days after production, with significant differences in both size and ZP values. The size of the NPs significantly decreased after 8 and 15 days, possibly due to the crocin release (Figure 4a). A similar trend was observed for NPs loaded with both crocin and ACT, but with differences only significant at day 32. The long-term release, evidenced by the changes in the size and ZP of the NPs, is one of the most important properties of the DDS used in this work. This phenomenon will be addressed in Section 3.4.
In addition, many variables are known to influence the particle size and physicochemical properties of NPs. The maintenance of size depends on the homogeneity of the originally synthesized materials as well as on the stabilizing agents present during storage or use. Thus, the selection of polymers, surfactants, their combination, and their concentrations has a great impact on the formation and final properties of NPs dispersions. Stability is also highly dependent on storage conditions, during which changes may occur, and on complex environments (i.e., biological systems) where displacement or encapsulation might take place [48,49].

3.3. In Vitro Assays
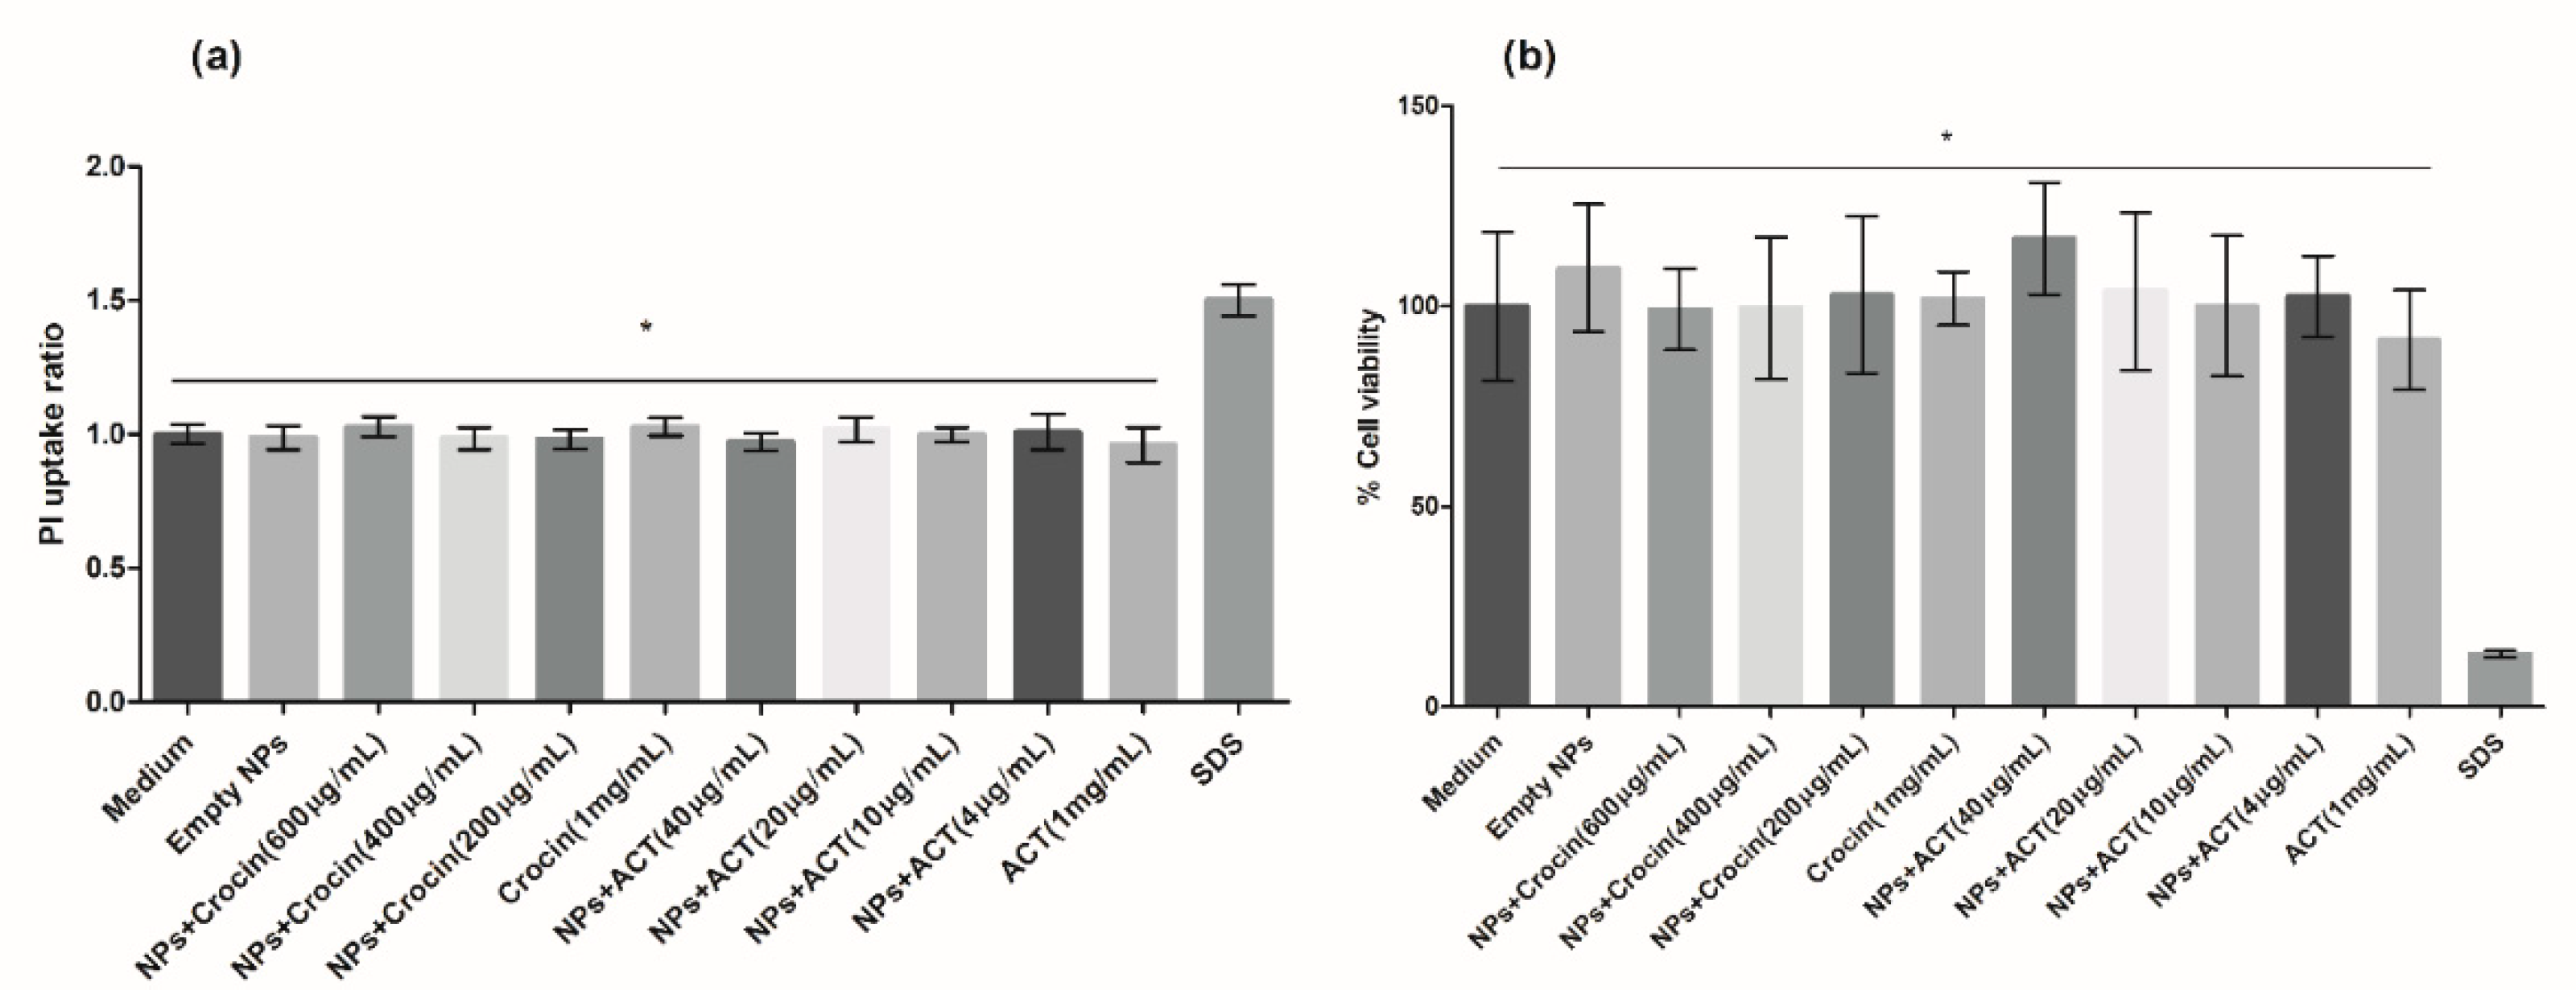
3.3.1. Cytotoxicity

The evaluation of the cytotoxicity of the NPs is a very important aspect in the development of a DDS. Since the developed NPs are intended for ophthalmic application, the cytotoxicity was evaluated using the ARPE-19 human retinal pigment epithelial cell line [50]. The cytotoxicity was evaluated by membrane integrity (PI dye uptake) and by metabolic state (MTT dye) assays (Figure 5).
The results obtained for all samples and concentrations tested are significantly different from those of the positive control SDS (p < 0.0001), while no significant differences (p > 0.05) were observed among the samples and the negative control (culture medium). Thus, the tested NPs are not cytotoxic for the tested cell line, which agrees with previously published studies [14,27,34].

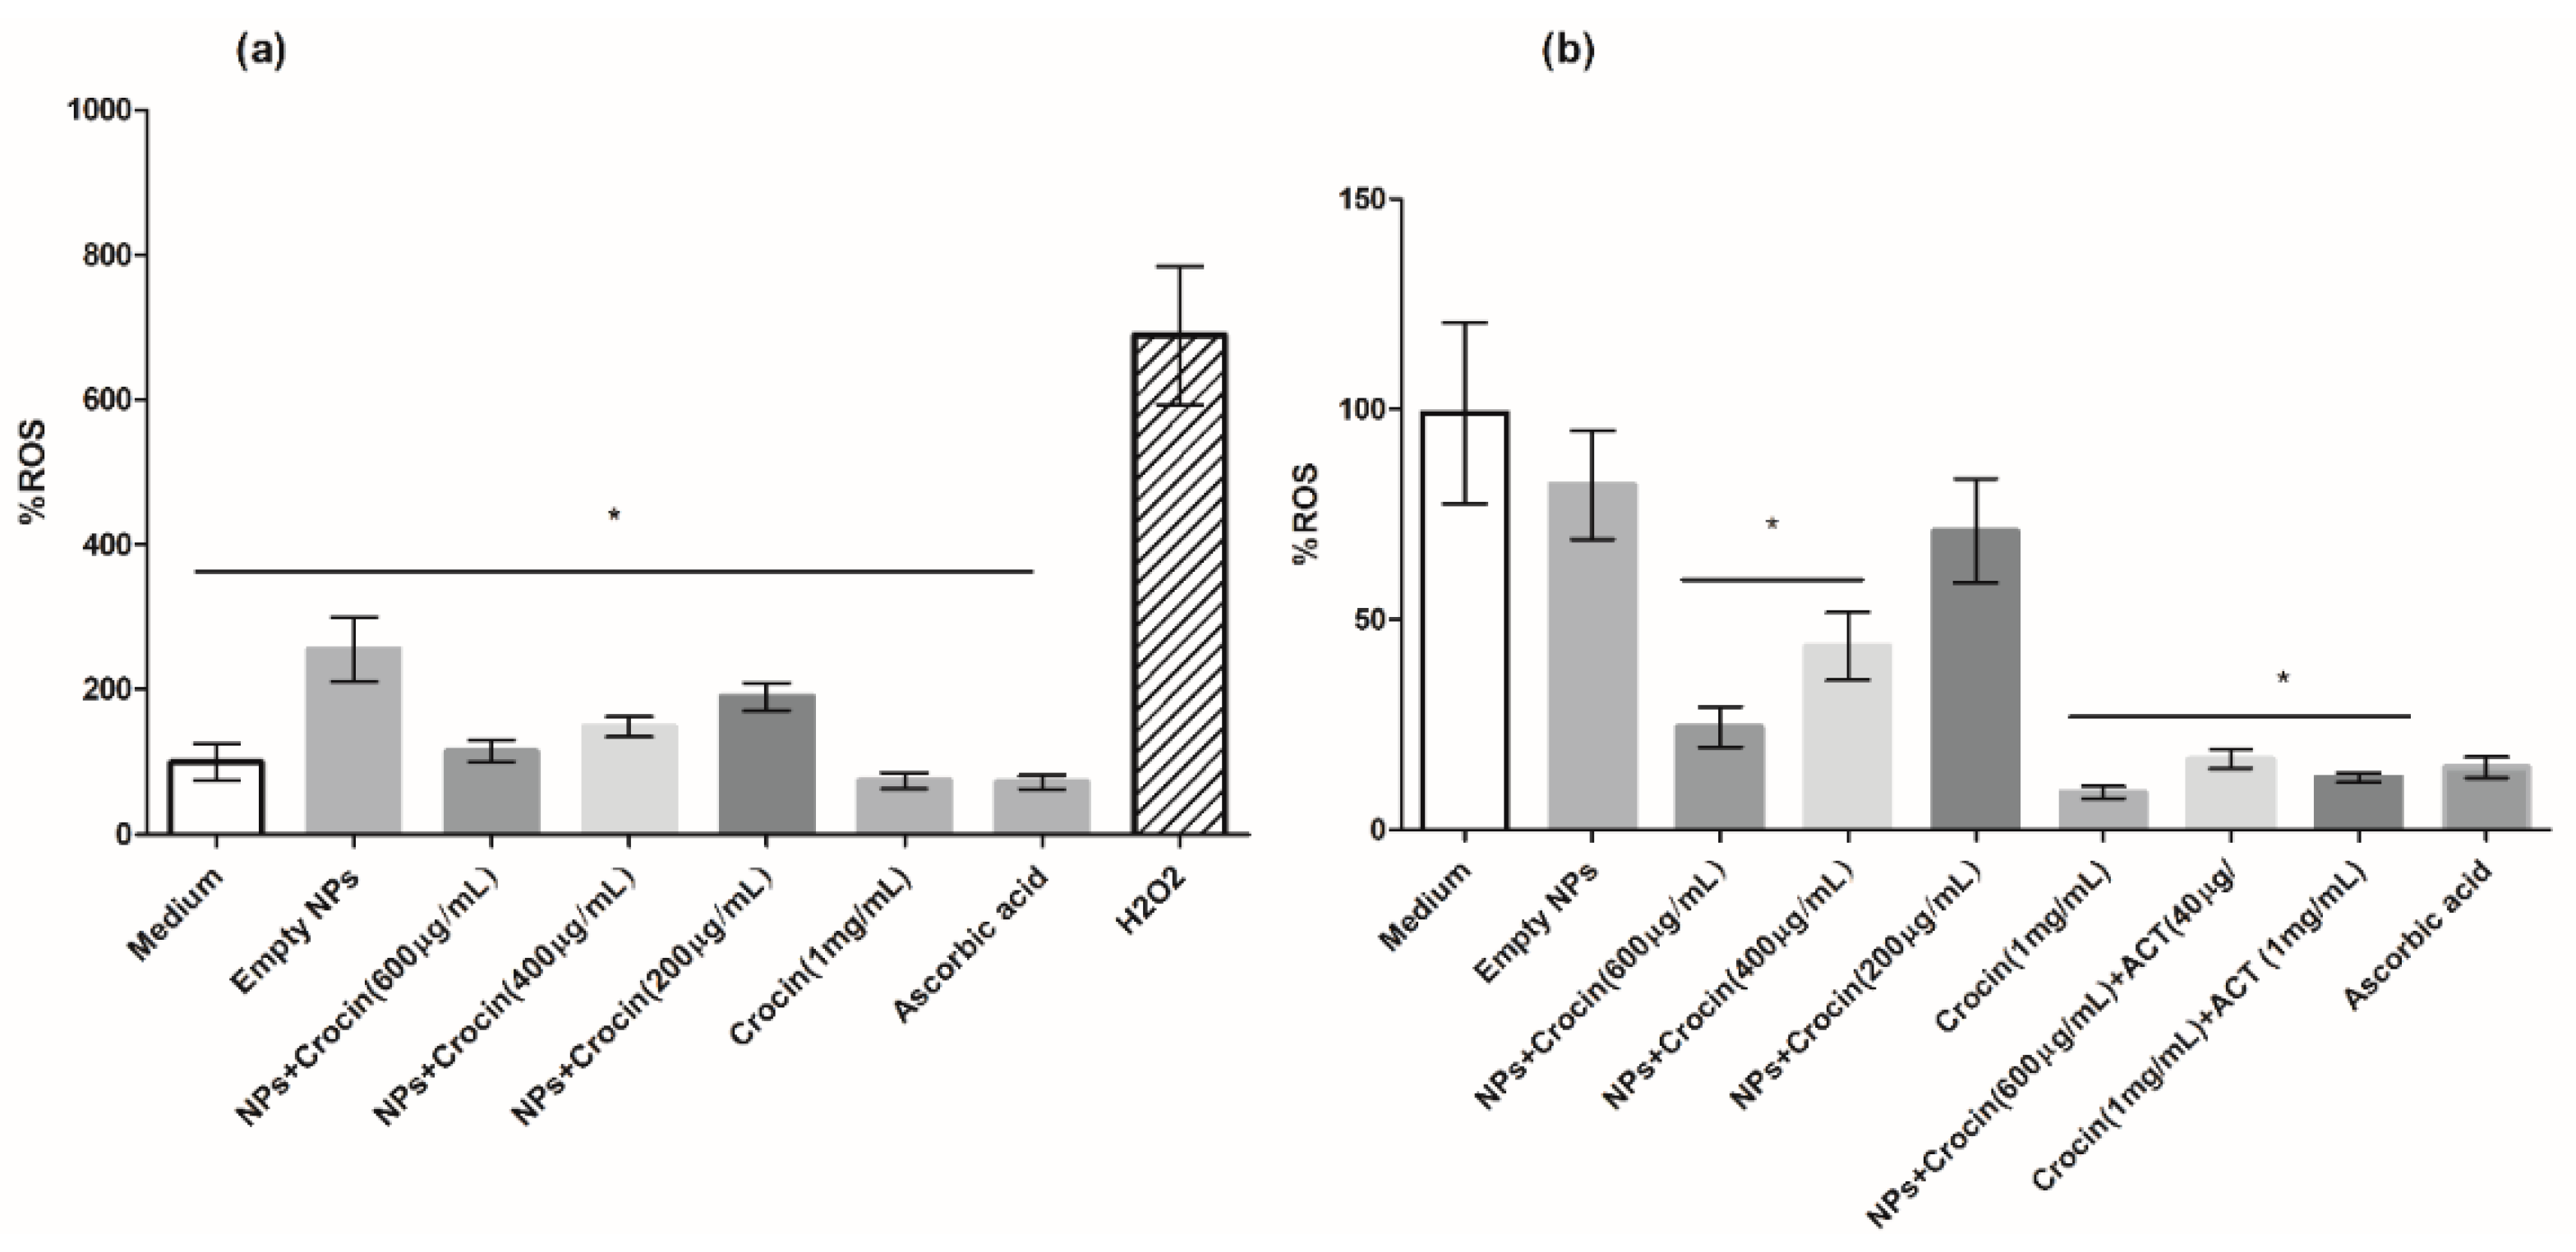
3.3.2. Oxidative Stress Tests

The NPs were tested in terms of the capacity to reduce ROS in the ARPE-19 cell line induced by either chemical (H2O2) or physical (UV radiation incidence) means [2,3,4,5,11,12]. The results are shown in Figure 6.
The results clearly show that crocin has a powerful antioxidant activity and, when in the appropriate concentrations, prevents ROS formation with a magnitude similar to that of ascorbic acid. It can also be observed that crocin loaded in CS/HA NPs has antioxidant effects similar to those of free crocin. The results further show that ACT has a protective action against UV radiation, with significant differences (p < 0.0001) observed between CS/HA NPs loaded with ACT and the medium control. The CS/HA NPs loaded with crocin and ACT also lead to a lower production of ROS, suggesting that these NPs are suitable to prevent OS in the cells and, possibly, the associated neurodegenerative diseases in the eye. Other studies suggested that the neuroprotective effects of crocin may be related to its antioxidant and anti-inflammatory properties, due to the presence of conjugated unsaturated bonds, which allow the electrons to absorb visible radiation and “disperse” their energy along the chain. In addition, like all carotenoids, crocin is able to absorb and “dilute” the energy of free radicals [14,15,16,18,22,34].

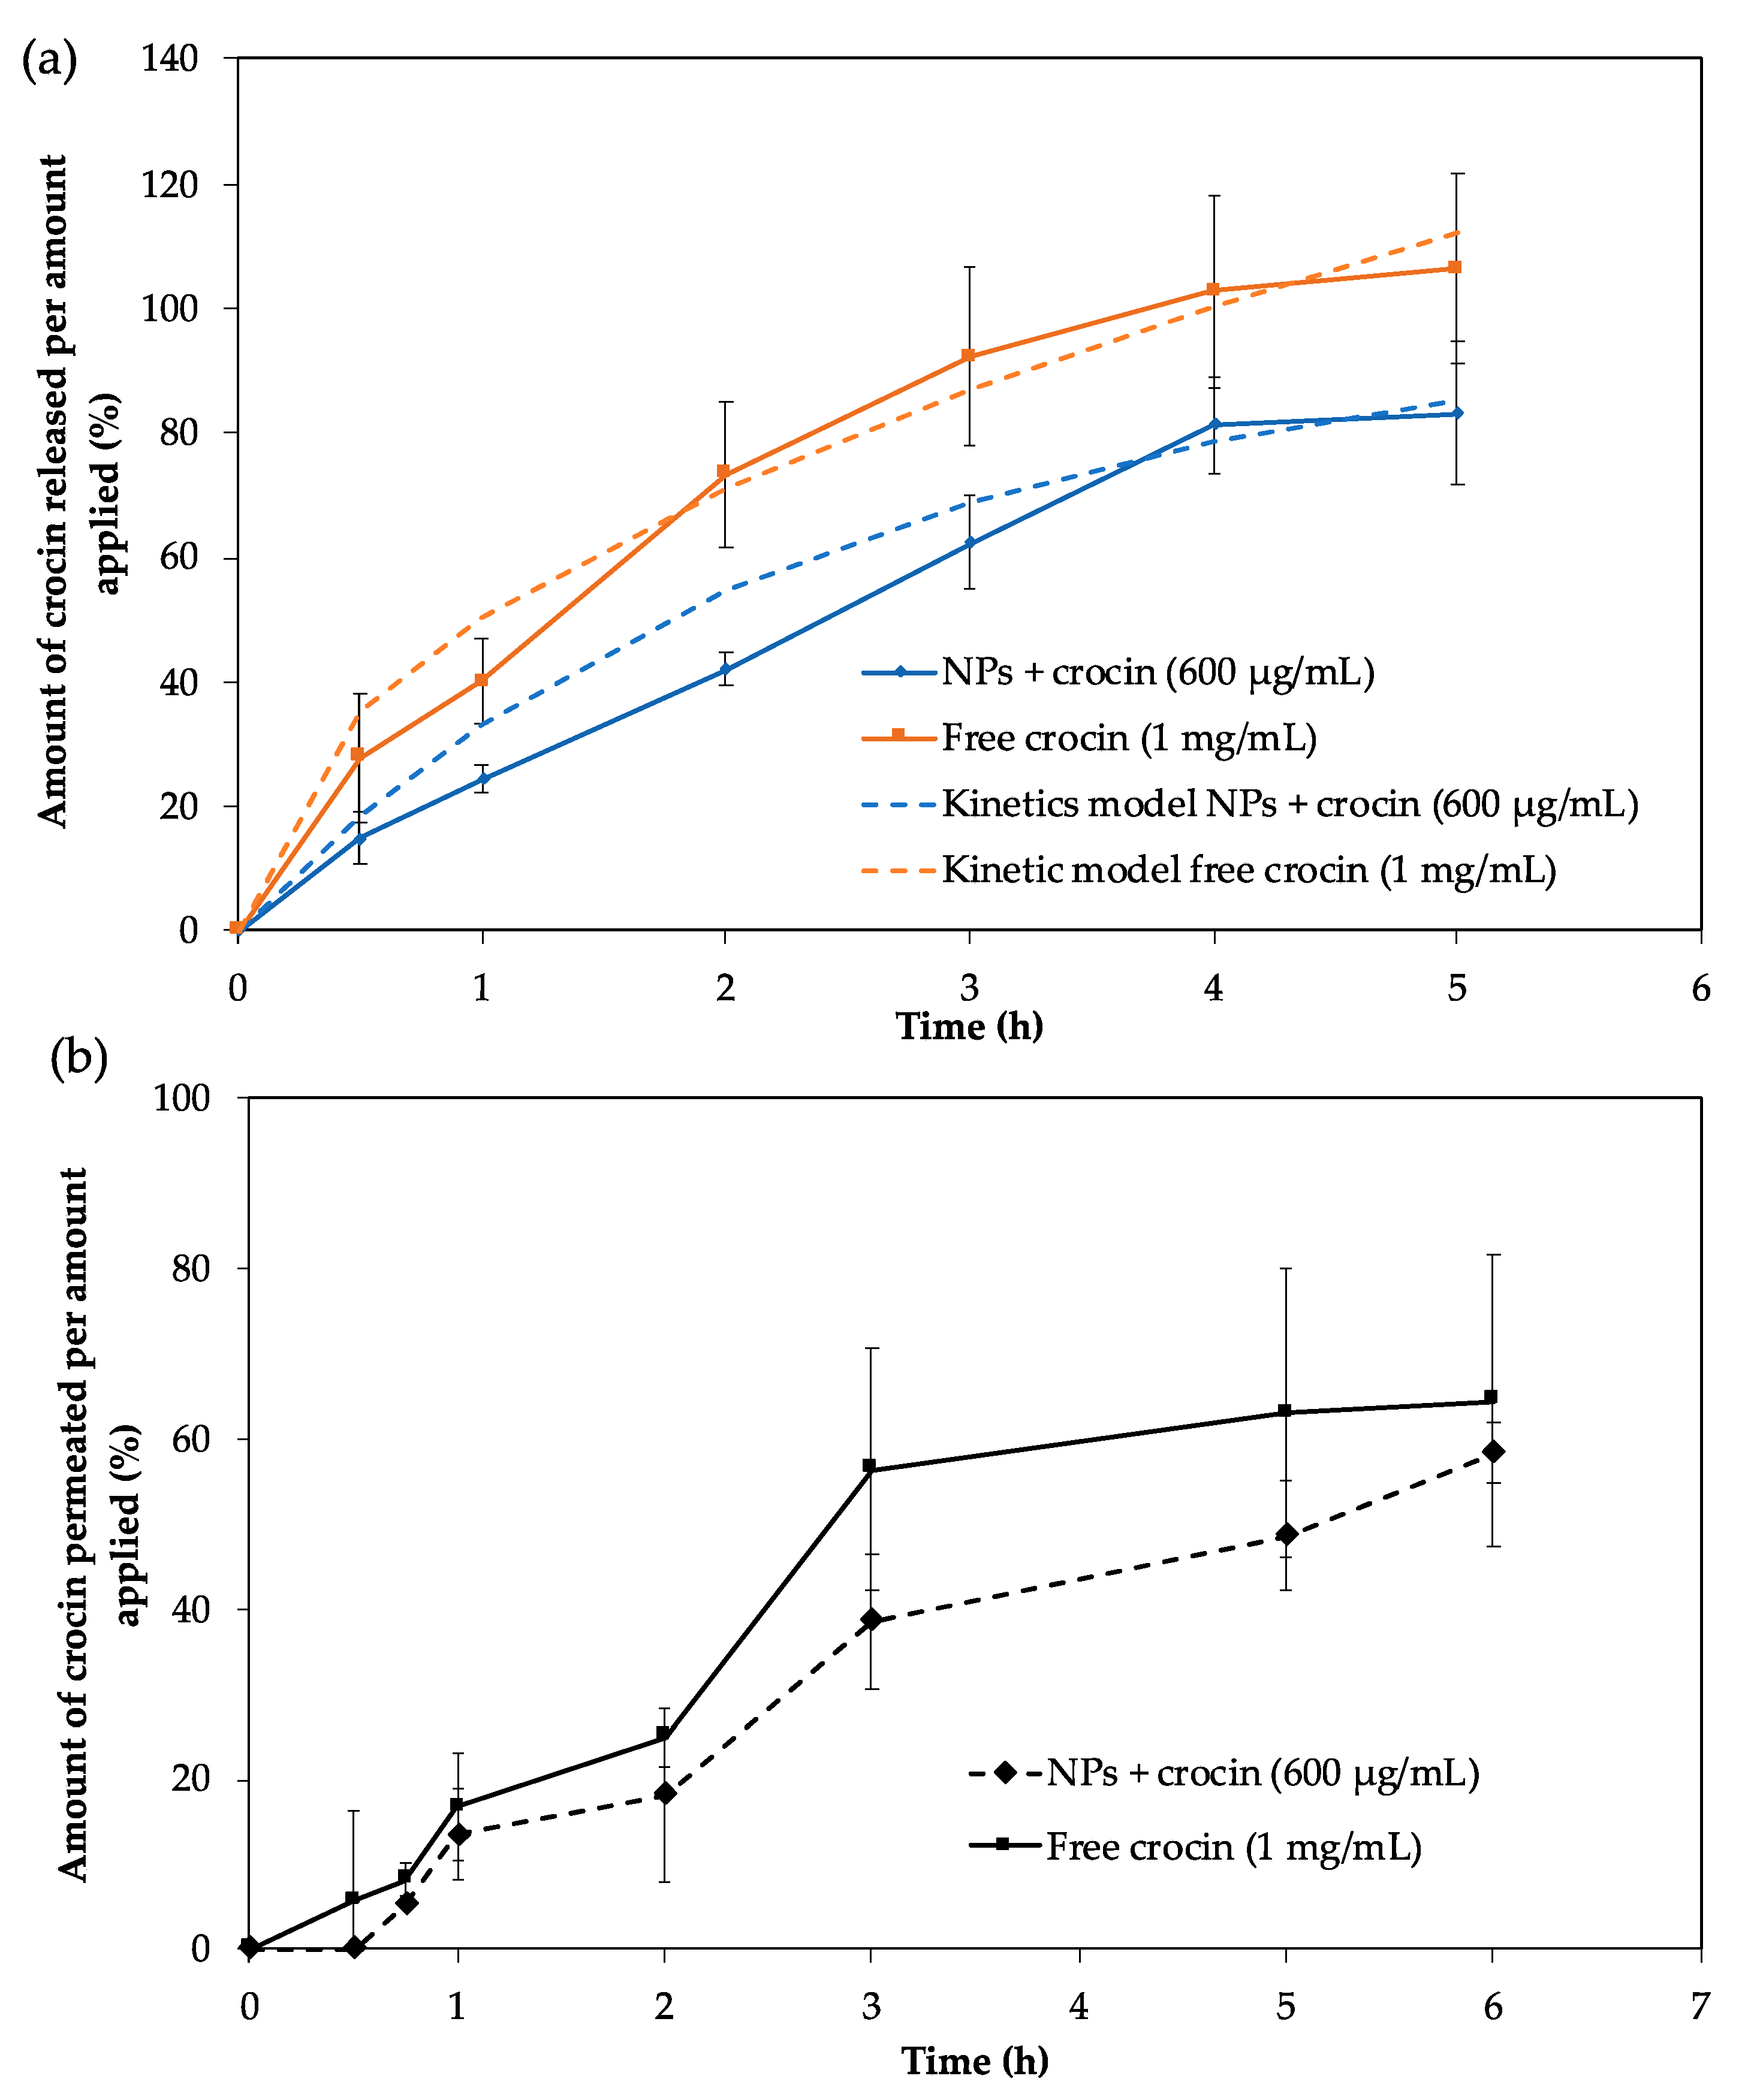
3.4. In Vitro Release and Permeation Studies

The release and permeation studies were only performed for the NPs loaded with crocin, since the ACT performs its function on the eye surface [22,34].
Release kinetics and permeation profile studies were performed by testing the NPs loaded with crocin in Franz diffusion cells, using cellulose membranes or scleras from pig eyes (Figure 7).
The in vitro release profile of crocin (Figure 7a) revealed a controlled drug release from the NPs at pH 7.4, which is the mean pH of tears [8]. It can also be observed that the incorporation of crocin in the NPs decreased its release rate. The results shown in Figure 7b reveal a slow permeation of crocin in the initial hours, which is possibly due to its interaction with the sclera components, a hypothesis supported by the color visualization in the pig eye elements after the conclusion of the study. Thus, NPs could be a suitable drug delivery system for increasing crocin ocular bioavailability by enhancing its retention time on the ocular surface.
The drug release kinetics was characterized by fitting different kinetic models to the experimental results. The best fit (with the highest determination coefficient, R2, and lowest AIC values) to the release data was obtained with the Higuchi model for the free crocin solution, and the first order model for the crocin-loaded NPs (Table 3). For the free crocin solution the best fitting was obtained with the Higuchi square root model (R2adjusted = 0.870), with a slightly lower R2adjusted value obtained for the fitting of the First order model (0.801) (Table 3). Regarding the NPs loaded with crocin, the R2adjusted obtained for the first order model fitting was 0.855 while for the Korsmeyer-Peppas model R2adjusted was 0.820. The obtained AIC values were close but distinct, with the First order model presenting a clear minimum (Table 3). In fact, the dissolution profile is suggestive of a diffusion-controlled release over time. According to Higuchi, this behavior is due to the dispersion of crocin in a homogeneous and uniform matrix, which acts as the diffusional [51]. In addition, the first order explains the polymer dissolution at the interface with the surrounding medium, enhancing the drug mobility and diffusion [52,53].

3.5. Mucoadhesive Studies

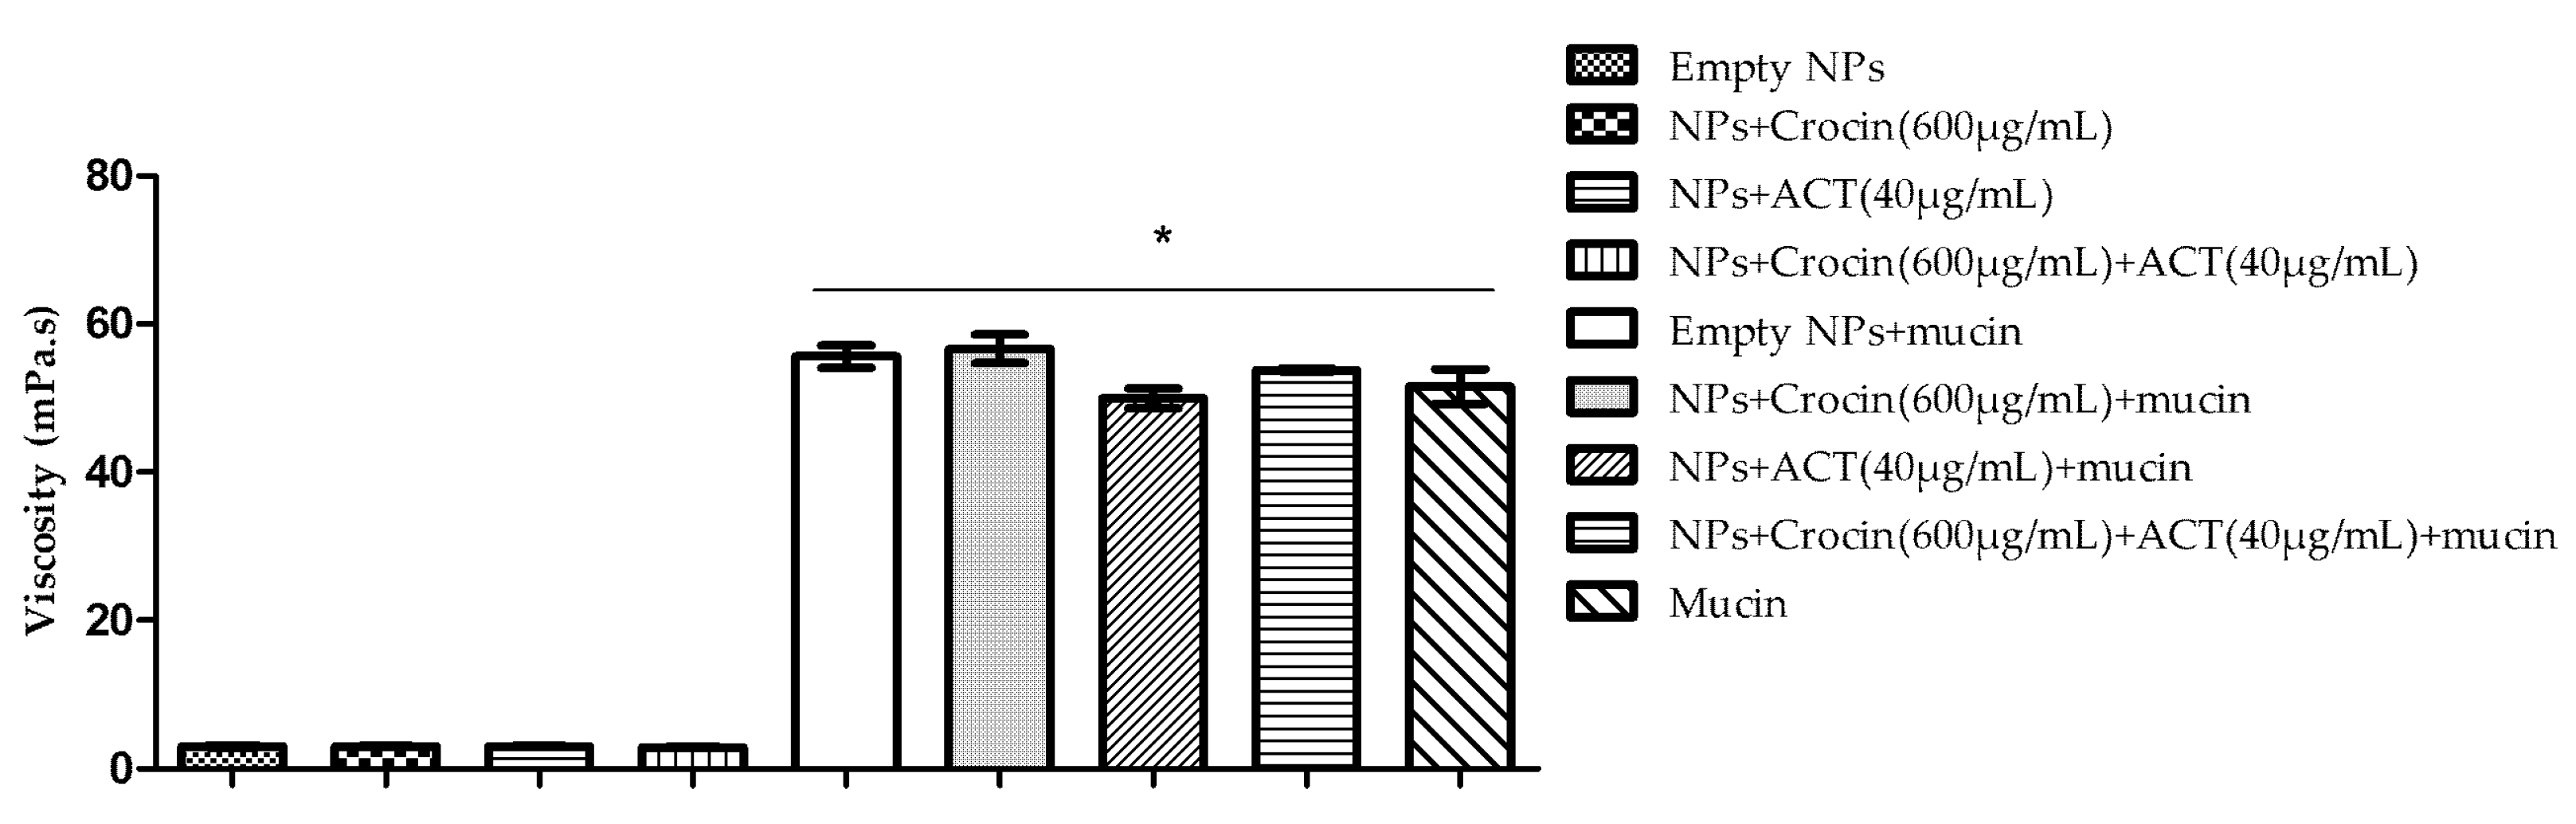
3.5.1. Ostwald Viscometer

The Ostwald viscometer was used to determine the viscosity of the NPs and evaluate their mucoadhesion, through their interaction with mucin (Figure 8).
The results show an increase in viscosity when the NPs were mixed with mucin, suggesting its interaction with the NPs surface. This observation supports the hypothesis that the positive charges of the CS on the surface of the NPs interact with the negatively charged groups of the mucin, enabling the NPs penetration into the mucin of the eye, as previously reported [22,23,25,26,27]. The interaction observed may result in a stronger mucoadhesivity and increase the drug retention time in the eyes, improving the drug absorption and reducing the frequency of administration [22,23,25,26,27]. No significative differences were observed between the different NP samples in the presence of mucin.

3.5.2. Rotational Rheometer

Tackiness in the context of material behavior is associated with stickiness and may result from adhesive forces between two materials in contact. It is measured at the maximum force needed to break the resultant bond. In this method, the peak normal force (N), which is a negative normal force, can be attributed to tack and the area under the force time curve (N.s) represents the adhesive strength (Table 4) [54].
Concerning the peak normal force, the NPs + crocin (600 µg/mL) + ACT (40 µg/mL) appears to be the tackiest, with a peak normal force of −0.178 N. On the other hand, in the case of the area under the force time curve, the NPs with the more cohesive structure appears to be the Empty NPs (0.572 N·s) and the mucin the less cohesive structure (0.414 N·s). However, no significative changes were observed between the results for the different NPs. The results relating to mucin present similar peak normal forces and areas under force time curve, suggesting that the addition of mucin to the NPs make them tackiest and more cohesive [54]. These results indicate that NPs present intrinsic mucoadhesive properties conferred by the mucoadhesive polymers used in their production (CS and HA) [7,23,27,32].

3.5.3. Zeta Potential

Another method used for the mucoadhesion studies was the determination of ZP of the NPs with and without mucin (Table 5).
These results show that when the NPs are mixed with the mucin solution there is a reduction of ZP to negative values, suggesting an interaction between the NPs and mucin. The interactions between the positively charged groups of CS and negatively charged groups of mucin (ionic interaction) are responsible for the mucoadhesive properties of the NPs, and facilitate the NPs penetration into the structure of the mucin of the eye [22,23,25,26,27]. This ionic interaction decreases the ZP value because mucin interacts with the CS in the surface of the NPs, neutralizing the positive charges. Within the same group (NPs with mucin and NPs without mucin), no significative differences were observed for the ZP values.

4. Conclusions

This study aimed to develop novel NP systems with mucoadhesive properties, intended to encapsulate antioxidant molecules to reduce the generation of OS in the eyes and consequently, with therapeutical potential for ocular diseases. The strategy involved the production of NPs composed of CS and HA, with known mucoadhesive properties, to improve the retention time of antioxidant molecules on the eye surface.
The CS/HA NPs are a promising platform for the delivery of antioxidants to the eye, by increasing their residence time and controlling their delivery. The NPs developed herein presented suitable mean average size (<350 nm), PDI (<0.300), surface charge (>+30 mV), and presented high %EE for crocin, a powerful natural antioxidant, without significantly changing their properties. This DDS showed suitable release and mucoadhesive properties, and in vitro studies using the ARPE-19 cell line showed its non-cytotoxicity and its capacity to efficiently decrease ROS concentration.
In the future, in vivo experiments would be useful to elucidate the biodistribution of drugs after ophthalmic application. Another objective will be the scale-up of the manufacturing processes using a quality by design approach, assuring the product quality and the cost-effectiveness of the production method.

Author Contributions

J.M. and L.G. conceived and designed the experiments; S.C., B.S. and L.G. performed the experiments; S.C., B.S., L.G. and J.M. analyzed the data; S.C. wrote the paper; writing—review and editing, A.M.M. H.M.R., L.G. and J.M.; supervision L.G. and J.M. All authors have read and agreed to the published version of the manuscript.

Funding

This research was funded by the Fundação para a Ciência e Tecnologia, Portugal (UIDB/04138/2020 and UIDP/04138/2020 to iMed.ULisboa, CEECINST/00145/2018 to J.Marto and Principal Researcher grant CEECIND/03143/2017 (L.Gonçalves); FCT fellowship SFRH/BD/130476/2017).

Institutional Review Board Statement

Not applicable.

Informed Consent Statement

Not applicable.

Data Availability Statement

Not applicable.

Acknowledgments

S.C. is a Master student at NOVA School of Science and Technology, Universidade Nova de Lisboa, Portugal.

Conflicts of Interest

The authors declare no conflict of interest.

References

  1. Pizzino, G.; Irrera, N.; Cucinotta, M.; Pallio, G.; Mannino, F.; Arcoraci, V.; Squadrito, F.; Altavilla, D.; Bitto, A. Oxidative Stress: Harms and Benefits for Human Health. Oxidative Med. Cell. Longev. 2017. [Google Scholar] [CrossRef]
  2. Umapathy, A.; Donaldson, P.; Lim, J. Antioxidant Delivery Pathways in the Anterior Eye. BioMed Res. Int. 2013, 2013, 1–10. [Google Scholar] [CrossRef] [PubMed] [Green Version]
  3. Saccà, S.C.; Roszkowska, A.M.; Izzotti, A. Environmental Light and Endogenous Antioxidants as the Main Determinants of Non-cancer Ocular Diseases. Mutat. Res. 2013, 752, 153–171. [Google Scholar] [CrossRef]
  4. Tezel, G. The Role of Glia, Mitochondria, and the Immune System in Glaucoma. Investig. Opthalmol. Vis. Sci. 2009, 50, 1001–1012. [Google Scholar] [CrossRef]
  5. Uttara, B.; Singh, A.V.; Zamboni, P.; Mahajan, R.T. Oxidative Stress and Neurodegenerative Diseases: A Review of Upstream and Downstream Antioxidant Therapeutic Options. Curr. Neuropharmacol. 2009, 7, 65–74. [Google Scholar] [CrossRef] [Green Version]
  6. Kim, Y.C.; Chiang, B.; Wu, X.; Prausnitz, M.R. Ocular Delivery of Macromolecules. J. Control. Release 2014, 190, 172–181. [Google Scholar] [CrossRef] [Green Version]
  7. Kumar, A.; Malviya, R.; Sharma, P.K. Recent Trends in Ocular Drug Delivery: A Short Review. Eur. J. Appl. Sci. 2011, 3, 86–92. [Google Scholar]
  8. Ludwing, A. The Use of Mucoadhesive Polymers in Ocular Drug Delivery. Adv. Drug Deliv. Rev. 2005, 57, 1595–1639. [Google Scholar] [CrossRef]
  9. London, A.; Benhar, I.; Schwartz, M. The Retina as a Window to the Brain—From Eye Research to CNS Disorders. Nat. Rev. Neurol. 2013, 9, 44–53. [Google Scholar] [CrossRef]
  10. Bull, N.D.; Martin, K.R. Concise Review: Toward Stem Cell-Based Therapies for Retinal Neurodegenerative Diseases. STEM CELLS 2011, 29, 1170–1175. [Google Scholar] [CrossRef] [PubMed]
  11. Cabrera, M.P.; Chihuailaf, R.H. Antioxidants and the Integrity of Ocular Tissues. Vet. Med. Int. 2011, 2011, 1–8. [Google Scholar] [CrossRef] [Green Version]
  12. Simonian, N.; Coyle, J. Oxidative Stress in Neurodegenerative Diseases. Annu. Rev. Pharmacol. Toxicol. 1996, 36, 83–106. [Google Scholar] [CrossRef] [PubMed]
  13. Moghaddasi, S.M. Chemicals and Medicine Usage. J. Med. Plants Res. 2010, 4, 427–430. [Google Scholar] [CrossRef]
  14. Heitmar, R.; Brown, J.; Kyrou, I. Saffron (Crocus sativus L.) in Ocular Diseases: A Narrative Review of the Existing Evidence from Clinical Studies. Nutrients 2019, 11, 649. [Google Scholar] [CrossRef] [Green Version]
  15. Amin, A.; Hamza, A.A.; Daoud, S.; Khazanehdari, K.; Al Hrout, A.; Baig, B.; Chaiboonchoe, A.E.; Adrian, T.; Zaki, N.; Salehi-Ashtiani, K. Saffron-Based Crocin Prevents Early Lesions of Liver Cancer: In vivo, in vitro and Network Analyses. Recent Pat. Anticancer Drug Discov. 2016, 11, 121–133. [Google Scholar] [CrossRef] [PubMed]
  16. Laabich, A.; Vissvesvaran, G.P.; Lieu, K.L.; Murata, K.; McGinn, T.E.; Manmoto, C.C.; Sinclair, J.R.; Karliga, I.; Leung, D.W.; Fawzi, A.; et al. Protective Effect of Crocin against Blue Light– and White Light–Mediated Photoreceptor Cell Death in Bovine and Primate Retinal Primary Cell Culture. Invest. Opthalmol. Vis. Sci. 2006, 47, 3156–3163. [Google Scholar] [CrossRef]
  17. Del Amo, E.M.; Urtti, A. Current and Future Ophthalmic Drug Delivery systems: A Shift to the Posterior Segment. Drug Discov. Today 2008, 13, 135–143. [Google Scholar] [CrossRef]
  18. Tsai, C.-H.; Wang, P.-Y.; Lin, I.-C.; Huang, H.; Liu, G.-S.; Tseng, C.-L. Ocular Drug Delivery: Role of Degradable Polymeric Nanocarriers for Ophthalmic Application. Int. J. Mol. Sci. 2018, 19, 2830. [Google Scholar] [CrossRef] [Green Version]
  19. Liu, S.; Jones, L.; Gu, F.X. Nanomaterials for Ocular Drug Delivery. Macromol. Biosci. 2012, 12, 608–620. [Google Scholar] [CrossRef]
  20. Mohanraj, V.; Chen, Y. Nanoparticles - A Review. Trop. J. Pharm. Res. 2006, 5, 561–573. [Google Scholar] [CrossRef] [Green Version]
  21. Cacciotti, I.; Chronopoulou, L.; Palocci, C.; Amalfitano, A.; Cantiani, M.; Cordaro, M.; Lajolo, C.; Callà, C.; Boninsegna, A.; Lucchetti, D.; et al. Controlled Release of 18-β-Glycyrrhetic Acid by Nanodelivery Systems Increases Cytotoxicity on Oral Carcinoma Cell Line. Nanotechnology 2018, 29, 285101. [Google Scholar] [CrossRef]
  22. Kashikar, V.S. Ophthalmic Mucoadhesive Polymers—A Literature Review. Int. J. Pharm. Sci. Rev. Res. 2011, 7, 68–73. [Google Scholar]
  23. Almeida, H.; Amaral, M.H.; Lobão, P.; Silva, A.C.; Loboa, J.M.S. Applications of Polymeric and Lipid Nanoparticles in Ophthalmic Pharmaceutical Formulations: Present and Future Considerations. J. Pharm. Pharm. Sci. 2014, 17, 278–293. [Google Scholar] [CrossRef] [PubMed] [Green Version]
  24. Ceci, C.; Graziani, G.; Faraoni, I.; Cacciotti, I. Strategies to Improve Ellagic Acid Bioavailability: From Natural or Semisynthetic Derivatives to Nanotechnological Approaches Based on Innovative Carriers. Nanotechnology 2020, 31, 382001. [Google Scholar] [CrossRef]
  25. Donnelly, R.F.; Shaikh, R.; Singh, T.R.R.; Garland, M.J.; Woolfson, A.D. Mucoadhesive Drug Delivery Systems. J. Pharm. Bioallied Sci. 2011, 3, 89–100. [Google Scholar] [CrossRef]
  26. SaraswathiI, B.; Balaji, A.; Umashankar, M. Polymers in Mucoadhesive Drug Delivery System-Latest Updates. Int. J. Pharm. Sci. Rev. Res. 2013, 5, 423–430. [Google Scholar]
  27. Silva, M.M.; Calado, R.; Marto, J.; Bettencourt, A.; Almeida, A.J.; Gonçalves, L.M.D. Chitosan Nanoparticles as a Mucoadhesive Drug Delivery System for Ocular Administration. Mar. Drugs 2017, 15, 370. [Google Scholar] [CrossRef] [Green Version]
  28. Menchicchi, B.; Fuenzalida, J.P.; Hensel, A.; Swamy, M.J.; David, L.; Rochas, C.; Goycoolea, F.M. Biophysical Analysis of the Molecular Interactions between Polysaccharides and Mucin. Biomacromolecules 2015, 16, 924–935. [Google Scholar] [CrossRef] [PubMed]
  29. Choi, J.H.; Kim, J.H.; Li, Z.; Oh, H.J.; Ahn, K.Y.; Yoon, K.C. Efficacy of the Mineral Oil and Hyaluronic Acid Mixture Eye Drops in Murine Dry Eye. Korean J. Ophthalmol. 2015, 29, 131–137. [Google Scholar] [CrossRef] [Green Version]
  30. Apaolaza, P.S.; Delgado, D.; Del Pozo-Rodríguez, A.; Gascón, A.R.; Solinis, M.A. A Novel Gene Therapy Vector Based on Hyaluronic Acid and Solid Lipid Nanoparticles for Ocular Diseases. Int. J. Pharm. 2014, 465, 413–426. [Google Scholar] [CrossRef]
  31. Kogan, G.; Šoltés, L.; Stern, R.; Gemeiner, P. Hyaluronic Acid: A Natural Biopolymer with a Broad Range of Biomedical and Industrial Applications. Biotechnol. Lett. 2006, 29, 17–25. [Google Scholar] [CrossRef] [PubMed]
  32. 32. Salzillo, R.; Schiraldi, C.; Corsuto, L.; D’Agostino, A.; Filosa, R.; De Rosa, M.; La Gatta, A. Optimization of Hyalu-ronan-based Eye Drop Formulations. Carbohydr. Polym. 2016, 153, 275–283. [Google Scholar] [CrossRef] [PubMed] [Green Version]
  33. Čejke, Č.; Luyckx, J.; Čejkova, J. Central Corneal Thickness Considered an Index of Corneal Hydration of the UVB Irra-diated Rabbit Cornea as Influenced by UVB Absorber. Physiol. Res. 2012, 61, 299–306. [Google Scholar] [CrossRef]
  34. Čejka, Č.; Luyckx, J.; Ardan, T.; Pláteník, J.; Širc, J.; Michálek, J.; Čejková, J. The Effect of Actinoquinol with Hyaluronic Acid in Eye Drops on the Optical Properties and Oxidative Damage of the Rabbit Cornea Irradiated with UVB Rays. Photochem. Photobiol. 2010, 86, 1294–1306. [Google Scholar] [CrossRef]
  35. Silva, B.; Marto, J.; Braz, B.S.; Delgado, E.; Almeida, A.J.; Gonçalves, L. New nanoparticles for topical ocular delivery of erythropoietin. Int. J. Pharm. 2020, 576, 119020. [Google Scholar] [CrossRef]
  36. Marto, J.; Gouveia, L.; Gonçalves, L.; Gaspar, D.; Pinto, P.; Carvalho, F.; Oliveira, E.; Ribeiro, H.; Almeida, A. A Quality by Design (QbD) Approach on Starch-based Nanocapsules: A Promising Platform for Topical Drug Delivery. Colloids Surf. B: Biointerfaces 2016, 143, 177–185. [Google Scholar] [CrossRef]
  37. Marto, J.; Neves, Â.; Gonçalves, L.; Pinto, P.; Almeida, C.; Simões, S. Rice Water: A Traditional Ingredient with Anti-Aging Efficacy. Cosmetics 2018, 5, 26. [Google Scholar] [CrossRef] [Green Version]
  38. Zhang, Y.; Huo, M.; Zhou, J.; Zou, A.; Li, W.; Yao, C.; Xie, S. DDSolver: An Add-in Program for Modeling and Comparison of Drug Dissolution Profiles. AAPS J. 2010, 12, 263–271. [Google Scholar] [CrossRef] [Green Version]
  39. Marto, J.; Ruivo, E.; Lucas, S.; Gonçalves, L.; Simões, S.; Gouveia, L.; Felix, R.; Moreira, R.; Ribeiro, H.; Almeida, A. Starch Nanocapsules Containing a Novel Neutrophil Elastase Inhibitor with Improved Pharmaceutical Performance. Eur. J. Pharm. Biopharm. 2018, 127, 1–11. [Google Scholar] [CrossRef] [PubMed]
  40. Mahmoud, A.A.; El-Feky, G.S.; Kamel, R.; Awad, G.E. Chitosan/Sulfobutylether-β-cyclodextrin Nanoparticles as a Potential Approach for Ocular Drug Delivery. Int. J. Pharm. 2011, 413, 229–236. [Google Scholar] [CrossRef]
  41. Yang, L.; Gao, S.; Asghar, S.; Liu, G.; Song, J.; Wang, X.; Ping, Q.; Zhang, C.; Xiao, Y. Hyaluronic acid/chitosan Nanopar-ticles for Delivery of Curcuminoid and its in vitro Evaluation in Glioma Cells. Int. J. Biol. Macromol. 2015, 72, 1391–1401. [Google Scholar] [CrossRef]
  42. Organic Chemistry. IR Spectroscopy Tutorial: Aromatics. Available online: https://orgchemboulder.com/Spectroscopy/irtutor/aromaticsir.shtml (accessed on 14 September 2019).
  43. Anisha, B.; Biswas, R.; Chennazhi, K.; Jayakumar, R. Chitosan–hyaluronic acid/nano Silver Composite Sponges for Drug Resistant Bacteria Infected Diabetic Wounds. Int. J. Biol. Macromol. 2013, 62, 310–320. [Google Scholar] [CrossRef]
  44. Correia, C.; Moreira-Teixeira, L.; Moroni, L.; Reis, R.; van Blitterswijk, C.; Karperien, M.; Mano, J. Chitosan Scaffolds Containing Hyaluronic Acid for Cartilage Tissue Engineering. Tissue Eng. Part C Methods 2011, 17, 717–730. [Google Scholar] [CrossRef] [Green Version]
  45. Tarantilis, P.A.; Beljebbar, A.; Manfait, M.; Polissiou, M. FT-IR, FT-Raman Spectroscopic Study of Carotenoids from Saffron (Crocus sativus L.) and Some Derivatives. Spectrochim. Acta Part A: Mol. Biomol. Spectrosc. 1998, 54, 651–657. [Google Scholar] [CrossRef]
  46. Rahaiee, S.; Shojaosadati, S.; Hashemi, M.; Moini, S.; Razavi, S. Improvement of Crocin Stability by Biodegradeble Na-noparticles of Chitosan-alginate. Int. J. Biol. Macromol. 2015, 79, 423–432. [Google Scholar] [CrossRef]
  47. Transmission Electron Microscopy—An Overview. Available online: https://0-www-sciencedirect-com.brum.beds.ac.uk/topics/food-science/transmission-electron-microscopy (accessed on 31 July 2019).
  48. Phan, H.T.; Haes, A.J. What Does Nanoparticle Stability Mean? J. Phys. Chem. C 2019, 123, 16495–16507. [Google Scholar] [CrossRef] [PubMed]
  49. Mancini, G.; Lopes, R.M.; Clemente, P.; Raposo, S.; Gonçalves, L.M.D.; Bica, A.; Ribeiro, H.M.; Almeida, A.J. Lecithin and Parabens Play a Crucial Role in Tripalmitin-based Lipid Nanoparticle Stabilization Throughout Moist Heat Sterilization and Freeze-drying. Eur. J. Lipid Sci. Technol. 2015, 117, 1947–1959. [Google Scholar] [CrossRef]
  50. Dunn, K.; Aotaki-Keen, A.; Putkey, F.; Hjelmeland, L. ARPE-19, A Human Retinal Pigment Epithelial Cell Line with Differentiated Properties. Exp. Eye Res. 1996, 62, 155–170. [Google Scholar] [CrossRef]
  51. Paul, D. Elaborations on the Higuchi Model for Drug Delivery. Int. J. Pharm. 2011, 418, 13–17. [Google Scholar] [CrossRef]
  52. Dash, S.; Murthy, P.N.; Nath, L.; Chowdhury, P. Kinetic Modeling on Drug Release from Controlled Drug Delivery Systems. Acta Pol. Pharm. Drug Res. 2010, 67, 217–223. [Google Scholar]
  53. Mulye, N.V.; Turco, S.J. A Simple Model Based on First Order Kinetics to Explain Release of Highly Water Soluble Drugs from Porous Dicalcium Phosphate Dihydrate Matrices. Drug Dev. Ind. Pharm. 1995, 21, 943–953. [Google Scholar] [CrossRef]
  54. Malvern Panalytical. Using a Rotational Rheometer to Assess Adhesion and Tackiness. Available online: https://www.azom.com/article.aspx?ArticleID=12166 (accessed on 30 July 2019).
Figure 1. Characteristics of nanoparticles (chitosan: hyaluronic acid - CS:HA Eye, mass ratio 1:1) prepared using different homogenization methods (manual, magnetic stirring, and high shear homogenization): (a) particle size, (b) PDI (polydispersity index), and (c) ZP (zeta potential). Results are mean ± SD, n = 3. * Significant differences (p < 0.0001).
Processes 09 00379 g001
Figure 2. FTIR spectra of NPs and CS (chitosan), HA (hyaluronic acid) eye, and crocin samples. The black arrows represent the lengths where changes occur.
Processes 09 00379 g002
Figure 3. TEM microscopy pictures of the (a) CS/HA/ACT NPs and (b) CS/HA/ACT NPs 10x magnification.
Processes 09 00379 g003
Figure 4. Stability data (a) NPs size; (b) PDI; (c) ZP. Results are mean ± SD, n = 3. * Significant differences (p < 0.0001) when comparing the data with time zero results.
Processes 09 00379 g004
Figure 5. In vitro cytotoxicity of the CS:HA NPs on ARPE-19 cell line, evaluated after 24 h of exposition to different NP concentrations. (a) PI uptake ratio; (b) MTT assay. Results are mean ± SD, n = 8. * Significant differences (p < 0.0001) when comparing the samples tested with the positive control SDS.
Processes 09 00379 g005
Figure 6. Formation of reactive oxygen species by chemical (H2O2) or physical (UV radiation incidence) induction, in the ARPE-19 cell line in the presence or absence of the developed NPs. (a) Percentage of ROS production by chemical induction in the presence or absence of the NPs loaded with crocin; (b) Percentage of ROS production by physical induction in the presence or absence of the NPs loaded with crocin. Results are mean ± SD, n = 8. * Significant differences (p < 0.0001) when comparing the samples tested with the positive control ascorbic acid in the chemical induction and when comparing the samples tested with the medium control in the physical induction.
Processes 09 00379 g006
Figure 7. Release and permeation profiles of crocin-loaded NPs. (a) Release studies using a cellulose membrane, showing the experimental data for NPs loaded with crocin (blue), and a free crocin solution (orange), and the correspondent model fitted kinetic profiles (first order model and Higuchi model, respectively); (b) Permeation studies using scleras of pig eyes, for crocin-loaded NPs and free crocin solution. All studies were performed in 10 mM PBS pH 7.4 using Franz cells at 37 °C. Results are mean ± SD, n = 6.
Processes 09 00379 g007
Figure 8. Viscosity of the NPs with and without mucin. Results are mean ± SD, n = 3. * Significant differences (p < 0.0001) when comparing samples with and without mucin.
Processes 09 00379 g008
Table 1. The percentage of EE (encapsulation efficiency) and DL (drug loading) of NPs for different concentrations of crocin and ACT (actinoquinol). Results are mean ± SD, n = 3.
NPsTotal Concentration (µg/mL)EE (%)DL (%)
Crocin120089.8 ± 0.129.927 ± 0.038
60074.9 ± 1.011.228 ± 0.149
20078.8 ± 0.23.939 ± 0.004
4023.5 ± 2.70.235 ± 0.027
2044.4 ± 3.80.222 ± 0.019
491.7 ± 2.70.092 ± 0.003
ACT402.6 ± 8.20.026 ± 0.082
204.8 ± 3.40.024 ± 0.017
45.6 ± 40.40.006 ± 0.040
Table 2. Size, PDI, and ZP of CS/HA, CS/HA/crocin, CS/HA/ACT, and CS/HA/crocin/ACT NPs, produced using the high shear homogenization process. Results are mean ± SD, n = 3.
NPsTotal Concentration (µg/mL)Size (nm)PDIZeta Potential (mV)
Empty NPs0323.4 ± 9.90.186 ± 0.029+37.7 ± 1.1
Crocin1200295.3 ± 1.10.174 ± 0.020+38.8 ± 0.8
600309.2 ± 4.40.193 ± 0.006+37.6 ± 0.4
200304.1 ± 3.10.196 ± 0.008+38.9 ± 0.9
40296.5 ± 5.10.179 ± 0.020+33.2 ± 0.9
20302.4 ± 5.10.177 ± 0.015+35.0 ± 1.2
4292.4 ± 2.90.142 ± 0.030+36.0 ± 2.2
ACT40316.5 ± 2.50.196 ± 0.009+36.6 ± 0.5
20328.9 ± 4.00.235 ± 0.017+36.8 ± 0.8
4318.6 ± 1.70.189 ± 0.025+37.0 ± 0.7
Crocin + ACT600 + 40330.1 ± 5.50.232 ± 0.013+41.0 ± 0.4
Table 3. Mathematical models and respective parameters (correlation coefficients and release constants). The models were fitted to the experimental data corresponding to a crocin release from CS/HA NPs.
ModelsParametersFree CrocinNPs + Crocin
Zero orderR2adj0.6800.770
AIC46.90743.275
k0 (µg/h)26.21220.546
First orderR2adj0.8010.855
AIC44.27739.479
k1 (h−1)0.7430.407
HiguchiR2adj0.8700.801
AIC41.94143.081
kH (h−0.5)50.20338.853
Korsmeyer-PeppasR2adj0.7790.820
AIC44.19942.753
kKP (hn)48.47329.720
N0.5760.731
R2ajusted—adjusted coefficient of determination; AIC—Akaike information criterion; K—release constant; n—release exponent.
Table 4. Analyses of the mucoadhesion of the NPs with and without mucin. The mucin solution is the control of this study. Results are mean ± SD, n = 6.
SamplesPeak Normal Force-Normal Force (N)Area under Force Time Curve (N·s)
Empty NPs−0.132 ± 0.0060.572 ± 0.428
NPs + crocin (600 µg/mL)−0.178 ± 0.0180.507 ± 0.081
NPs + ACT (40 µg/mL)−0.172 ± 0.0060.416 ± 0.100
NPs + crocin (600 µg/mL) + ACT (40 µg/mL)−0.178 ± 0.0120.438 ± 0.085
Mucin−0.166 ± 0.0060.414 ± 0.061
Empty NPs + Mucin−0.162 ± 0.0090.469 ± 0.047
NPs + crocin (600 µg/mL) + Mucin−0.167 ± 0.0080.422 ± 0.058
NPs + ACT (40 µg/mL) + Mucin−0.169 ± 0.0050.466 ± 0.069
NPs + crocin (600 µg/mL) + ACT (40 µg/mL) + Mucin−0.165 ± 0.0030.479 ± 0.103
Table 5. Determination of the ZP (mV) of the NPs with and without mucin. The mucin solution is the control of this study. Results are mean ± SD, n = 3.
SampleZP (mV)
Empty NPs+34.1 ± 1.9
NPs + crocin (600 µg/mL)+39.2 ± 1.3
NPs + ACT (40 µg/mL)+41.4 ± 2.0
NPs + crocin (600 µg/mL) + ACT (40 µg/mL)+40.2 ± 1.6
Mucin−7.0 ± 0.2
Empty NPs + Mucin−9.7 ± 1.1
NPs + crocin (600 µg/mL) + Mucin−9.3 ± 0.3
NPs + ACT (40 µg/mL) + Mucin−10.4 ± 0.6
NPs + crocin (600 µg/mL) + ACT (40 µg/mL) + Mucin−9.3 ± 0.4
Publisher’s Note: MDPI stays neutral with regard to jurisdictional claims in published maps and institutional affiliations.

