Article

Fe2+ and UV Catalytically Enhanced Ozonation of Selected Environmentally Persistent Antibiotics

1
Faculty of Chemistry and Chemical Technology, University of Ljubljana, Večna pot 113, SI-1000 Ljubljana, Slovenia
2
Department of Environmental Engineering, Faculty of Chemistry and Food Technology, Slovak Technical University, Radlinského 9, 812 37 Bratislava, Slovakia
*
Author to whom correspondence should be addressed.
Submission received: 24 January 2021 / Revised: 4 March 2021 / Accepted: 5 March 2021 / Published: 13 March 2021
(This article belongs to the Section Environmental and Green Processes)

Abstract

:
The aim of the study was to determine oxidation potential of selected persistent, environmentally relevant antibiotics (Amoxicillin, Levofloxacin, and their mixture with Vancomycin) to reduce their environmental emissions. Ozonation (O3) and indirect ozonation at pH 9.5 (O3/pH9.5) were catalytically enhanced by addition of Fe2+ (O3/Fe2+) and photocatalytic ozonation in combination with Fe2+ and UV-A black light (O3/Fe2+/UV) at two temperatures using total organic carbon (TOC) and chemical oxygen demand (COD) to identify formation of by-products. Oxidative degradation followed pseudo-first order consecutive reactions. Initial phase of oxidation was more intensive than mineralisation at 21 and 40 °C: up to 57.3% and 69.2%, respectively. After 120 min mineralization at 21 °C was up to 64.9% while at 40 °C it was up to 84.6%. Oxidation reached up to 86.6% and 93.4% at 21 °C and 40 °C, respectively. The most efficient processes were indirect ozonation at pH 9.5 (O3/pH9.5) (up to 93.4%) and photocatalytic enhanced ozonation with Fe2+ and UV-A black light (O3/Fe2+/UV) (up to 89.8%). The lowest efficiency was determined in experiments with direct ozonation (up to 75.5%). Amoxicillin was the only one completely mineralised. Study confirmed that ozonation with addition of Fe2+ and UV radiation has the potential to improve efficiency of the antibiotic-removal processes. Further experiments varying amounts of Fe2+ and other experimental conditions should be accomplished to set up more general methodological approach for reduction of antibiotics emissions.

Graphical Abstract

1. Introduction

Broad use of pharmaceuticals is polluting environment and thus they are becoming a global environmental problem [1]. Analyses of wastewater treatment plants’ effluents and surface waters have been reporting presence of a wide range of pharmaceuticals since 1980s. Their removal from wastewaters is incomplete and they easily enter natural water system including drinking water [2]. Most risky pharmaceuticals are antibiotics because of their high animal and human consumption resulted from application in treatment of bacterial infections and nowadays they are considered as emerging contaminants (ECs). The main sources of antibiotics in environment are incorrect discharge when expired, human excretion and agricultural activities with emphasis on livestock production. In the environment antibiotics can be in their original form or as pharmacologically active metabolites or as transformational products [3,4]. They are accumulated in the environment and consequently induce bacterial resistance to antibiotics [5]. The rapid growth of resistant strains results in highly resistant bacteria and therefore bacterial infections may not be treated as successfully as in the past. Furthermore, the World Health Organization (WHO) declared antimicrobial resistance to be global life-threatening danger [3,6].
Striving to predict environmental risks of antibiotic persistence, several studies have already been made, following guidelines given by the Environmental Protection Agency (EPA) and the Organization for Economic Co-operation and Development (OECD) [3]. Many studies confirmed that the annual mean antibiotic concentrations are relatively low (below 10 ng·L−1 [7]), or up to few µg·L−1 [8] in most of the European rivers and also in North America, but studies from Africa demonstrate concentrations from ng·L−1 to several orders of magnitude higher [6].
One of the often-used antibiotic is Amoxicillin (AM). It prevents building of cell wall in bacteria suppressing infections such as arthritis, pneumonia, tonsillitis, bronchitis and infections of the ear, skin, nose and urinary tract [4,9]. It was detected in the effluents of the Italian WWTPs from 1.80–120 ng·L−1 [3]. In the surface waters of China its median concentration was 1 ng·L−1 [10]. It is toxic to algae M. aeruginosa (72hEC50 = 0.0037 mg·L−1), S. capricornutum (72hNOEC = 250 mg·L−1), S. leopoliensis (EC50 = 2.22 µg·L−1, NOEC = 0.78 µg·L−1, LOEC = 1.56 µg·L−1), all based on measurement of growth inhibition [11]. It was also toxic to bacteria V. fischeri: 15minEC50 = 3597 mg·L−1 [11].
Levofloxacin (LV) which is used for treating pneumonia, skin infections, bronchitis, sinusitis, active tuberculosis, anthrax and some types of plague in human medicine [4,12] was found in South Korea river water in concentration up to 87.4 ± 13.0 ng·L−1 [11]. In effluent from municipal WWTPs in Japan LV was detected at concentrations 152–323 ng·L−1 [12]. In river water in Shandong province in eastern China concentration range was 0.3–6.0 ng·L−1 while in wastewater higher concentrations were detected (0.5–19,981.6 ng·L−1). Different environmental samples were also found to contain LV: river sediments (0.77–100.91 μg·kg−1), soil (0.2–6.5 μg·kg−1), pig manure (0.51–5.66 μg·kg−1) and vegetable (0.602 μg·kg−1) [13]. Growth inhibition to algae P. subcapitata (96hEC50 = 1200 µg·L−1, 96hNOEC = 310 µg·L−1, LOEC = 630 µg·L−1) was caused by LV [12]. It was also toxic to fish O. latipes (96hLC50 > 100 mg·L−1), crustaceans T. platyurus (24hLC50 > 100 mg·L−1) and D. magna (21dEC50 = 340 µg·L−1, 21dLOEC = 63 µg·L−1) [11]. Toxicity testing with V. fischeri up to 8.2 mg·L−1 of LV did not confirm significant toxic effect [12].
Environmental occurrence of Vancomycin (VM) in the environment was also determined. It is used for treating infections caused by Gram-positive organisms [4,14,15]. Influent concentration of VM in Milan city WWTP was 9.6 ± 1.8 mg·day−1·1000 inhabitants−1 while in Varese city WWTP it was 14 ± 20 mg·day−1·1000 inhabitants−1. VM mean concentrations in the river Po and Arno were 4.8 ± 4.9 ng·L−1 and 2.6 ± 2.2 ng·L−1, respectively [16]. It is toxic to D. magna (48hEC50 = 686.9 mg·L−1), P. subcapitata (72hEC50 = 370.8 mg·L−1) and F. candida (28dEC50 = 546 mg·kg−1) [17].
It is important to develop efficient and environmentally friendly methods for complete removal of emerging contaminants. The most efficient methods to degrade them and prevent their entrance into the environment seem to be advanced oxidation processes (AOPs). AOPs are aqueous phase treatment processes based on in-situ production of powerful oxidants such as hydroxyl radicals (•OH) and ozone (O3) which results in a variety of degradation mechanisms of pollutants, reduction of their toxicity and increased biodegradability. Those processes are ozonation, ozonation in combination with UV-light (photocatalytic processes) and/or H2O2 and/or Fe2+ or other catalysts, mainly metal oxides [2,18,19,20]. There are two mechanisms of ozonation. Direct ozonation at lower pH is slow and selective and usually results in formation of aldehydes and carboxylic acids, which means that total mineralization of organics does not occur. Second mechanism is indirect ozonation at higher pH through production of hydroxyl radicals (•OH), which are non-selective. Indirect ozonation quickly degrades organics and mainly leads to more complete mineralization [21,22]. However, it was proven that ozone efficiently oxidizes antibiotics leading to changes in their molecular structure or functional groups [23]. Nevertheless, much is still unknown about by-products of ozonation and other advanced oxidation processes of antibiotics [24].
There are a lot of data on feasibility of AOPs and their optimization attempts for removal of human and veterinary antibiotics form different aquatic samples [20,23,25]. However, due to the different and sometimes poorly described methods and experimental conditions used it is not possible to make direct comparison and evaluate technical feasibility of the process. Kidak et al. [26] confirmed good mineralization of Amoxicillin with ozonation at pH = 7. At average ozone concentration of 23 ± 2 mg·L−1 more than 99% of Amoxicillin was removed in 10 min. In the study of Marcelino et al. [27], wastewater was a mixture of water, cleaning products, antibiotics, solvents and excipients, which had been generated during the formulation of Amoxicillin-based medicines. Flux of the ozone produced was 18 mg·L−1, pH = 10 and time of ozonation 180 min. Ozonation itself was able to remove wastewater original colour by removing up to 99% of the initial Amoxicillin content and up to 80% of aromaticity. Removal of TOC was 46% and COD 73%. Ozonation experiments were carried out also with Levofloxacin. 20.5 mg∙L−1 of ozone led to its complete degradation [28]. Vancomycin was also confirmed as highly reactive toward O3 between pH = 3 and 8 [29]. However, there is a lack of data on efficiency of ozonation in various experimental conditions (pH, T, etc.) and in combination with other processes (H2O2, Fe2+, Fe3+, zero-valent iron, UV-light, etc.) especially when processes in actual wastewaters containing mixture of different antibiotics or scale-up is considered.
The aim of this research was to study degradation of Amoxicillin (AM), Levofloxacin (LV), and their mixture with Vancomycin (MIX) in aqueous solutions—model wastewaters. Different methods such as direct ozonation (O3), indirect ozonation at pH = 9.5 (O3/pH9.5), catalytic ozonation with Fe2+ (O3/Fe2+) and photocatalytic ozonation with Fe2+ and UV-A black light (O3/Fe2+/UV) were accomplished at two temperatures (21/40 ± 1 °C) and compared. The removal efficiency of each method was determined by total organic carbon (TOC) and chemical oxygen demand (COD) measurements. The kinetics of degradation was also determined and related to temperature of the processes. Lab-scale experiments led to preliminary determination of the most feasible conditions in the above mentioned ozonation-based processes for removal of selected persistent antibiotics and their mixture.

2. Materials and Methods

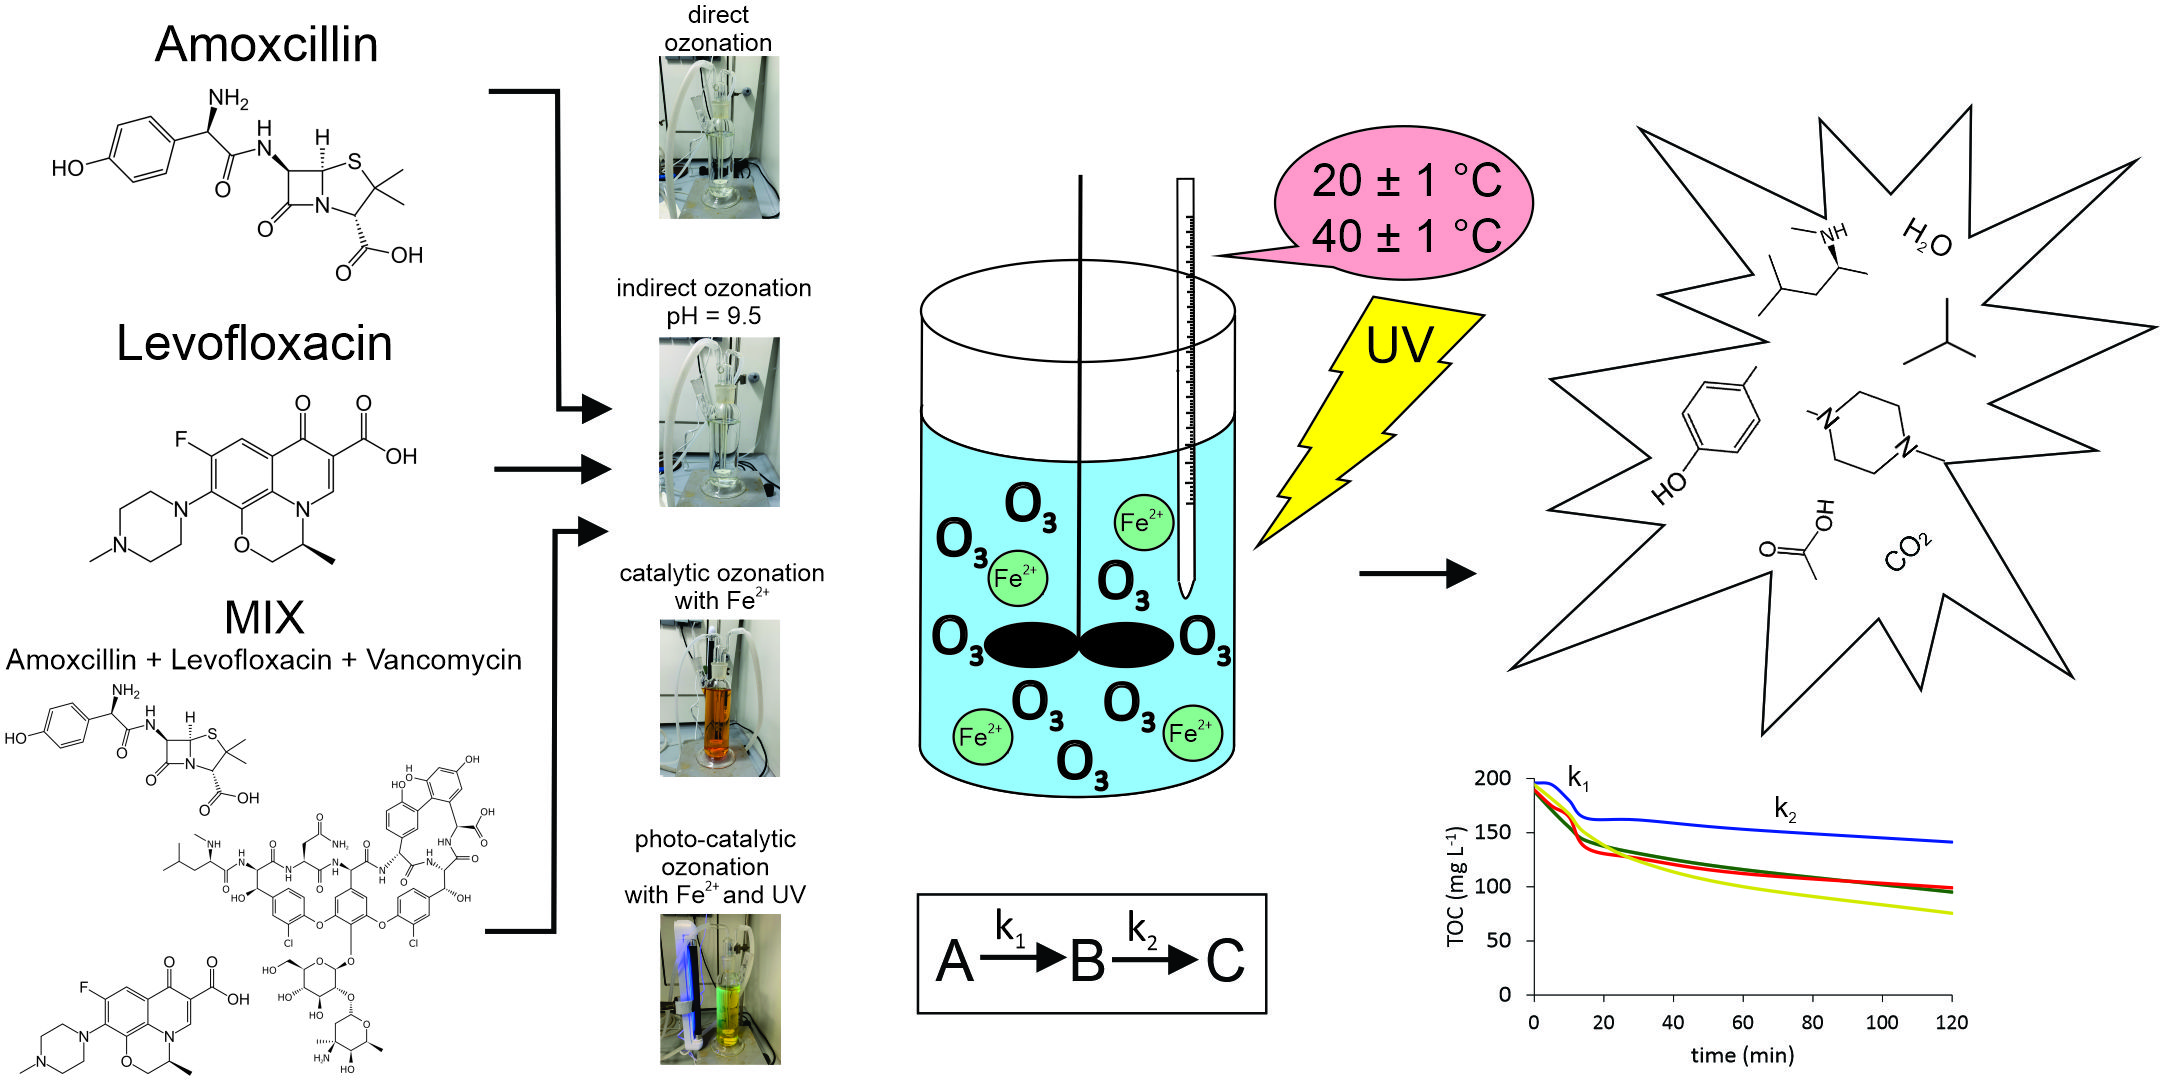
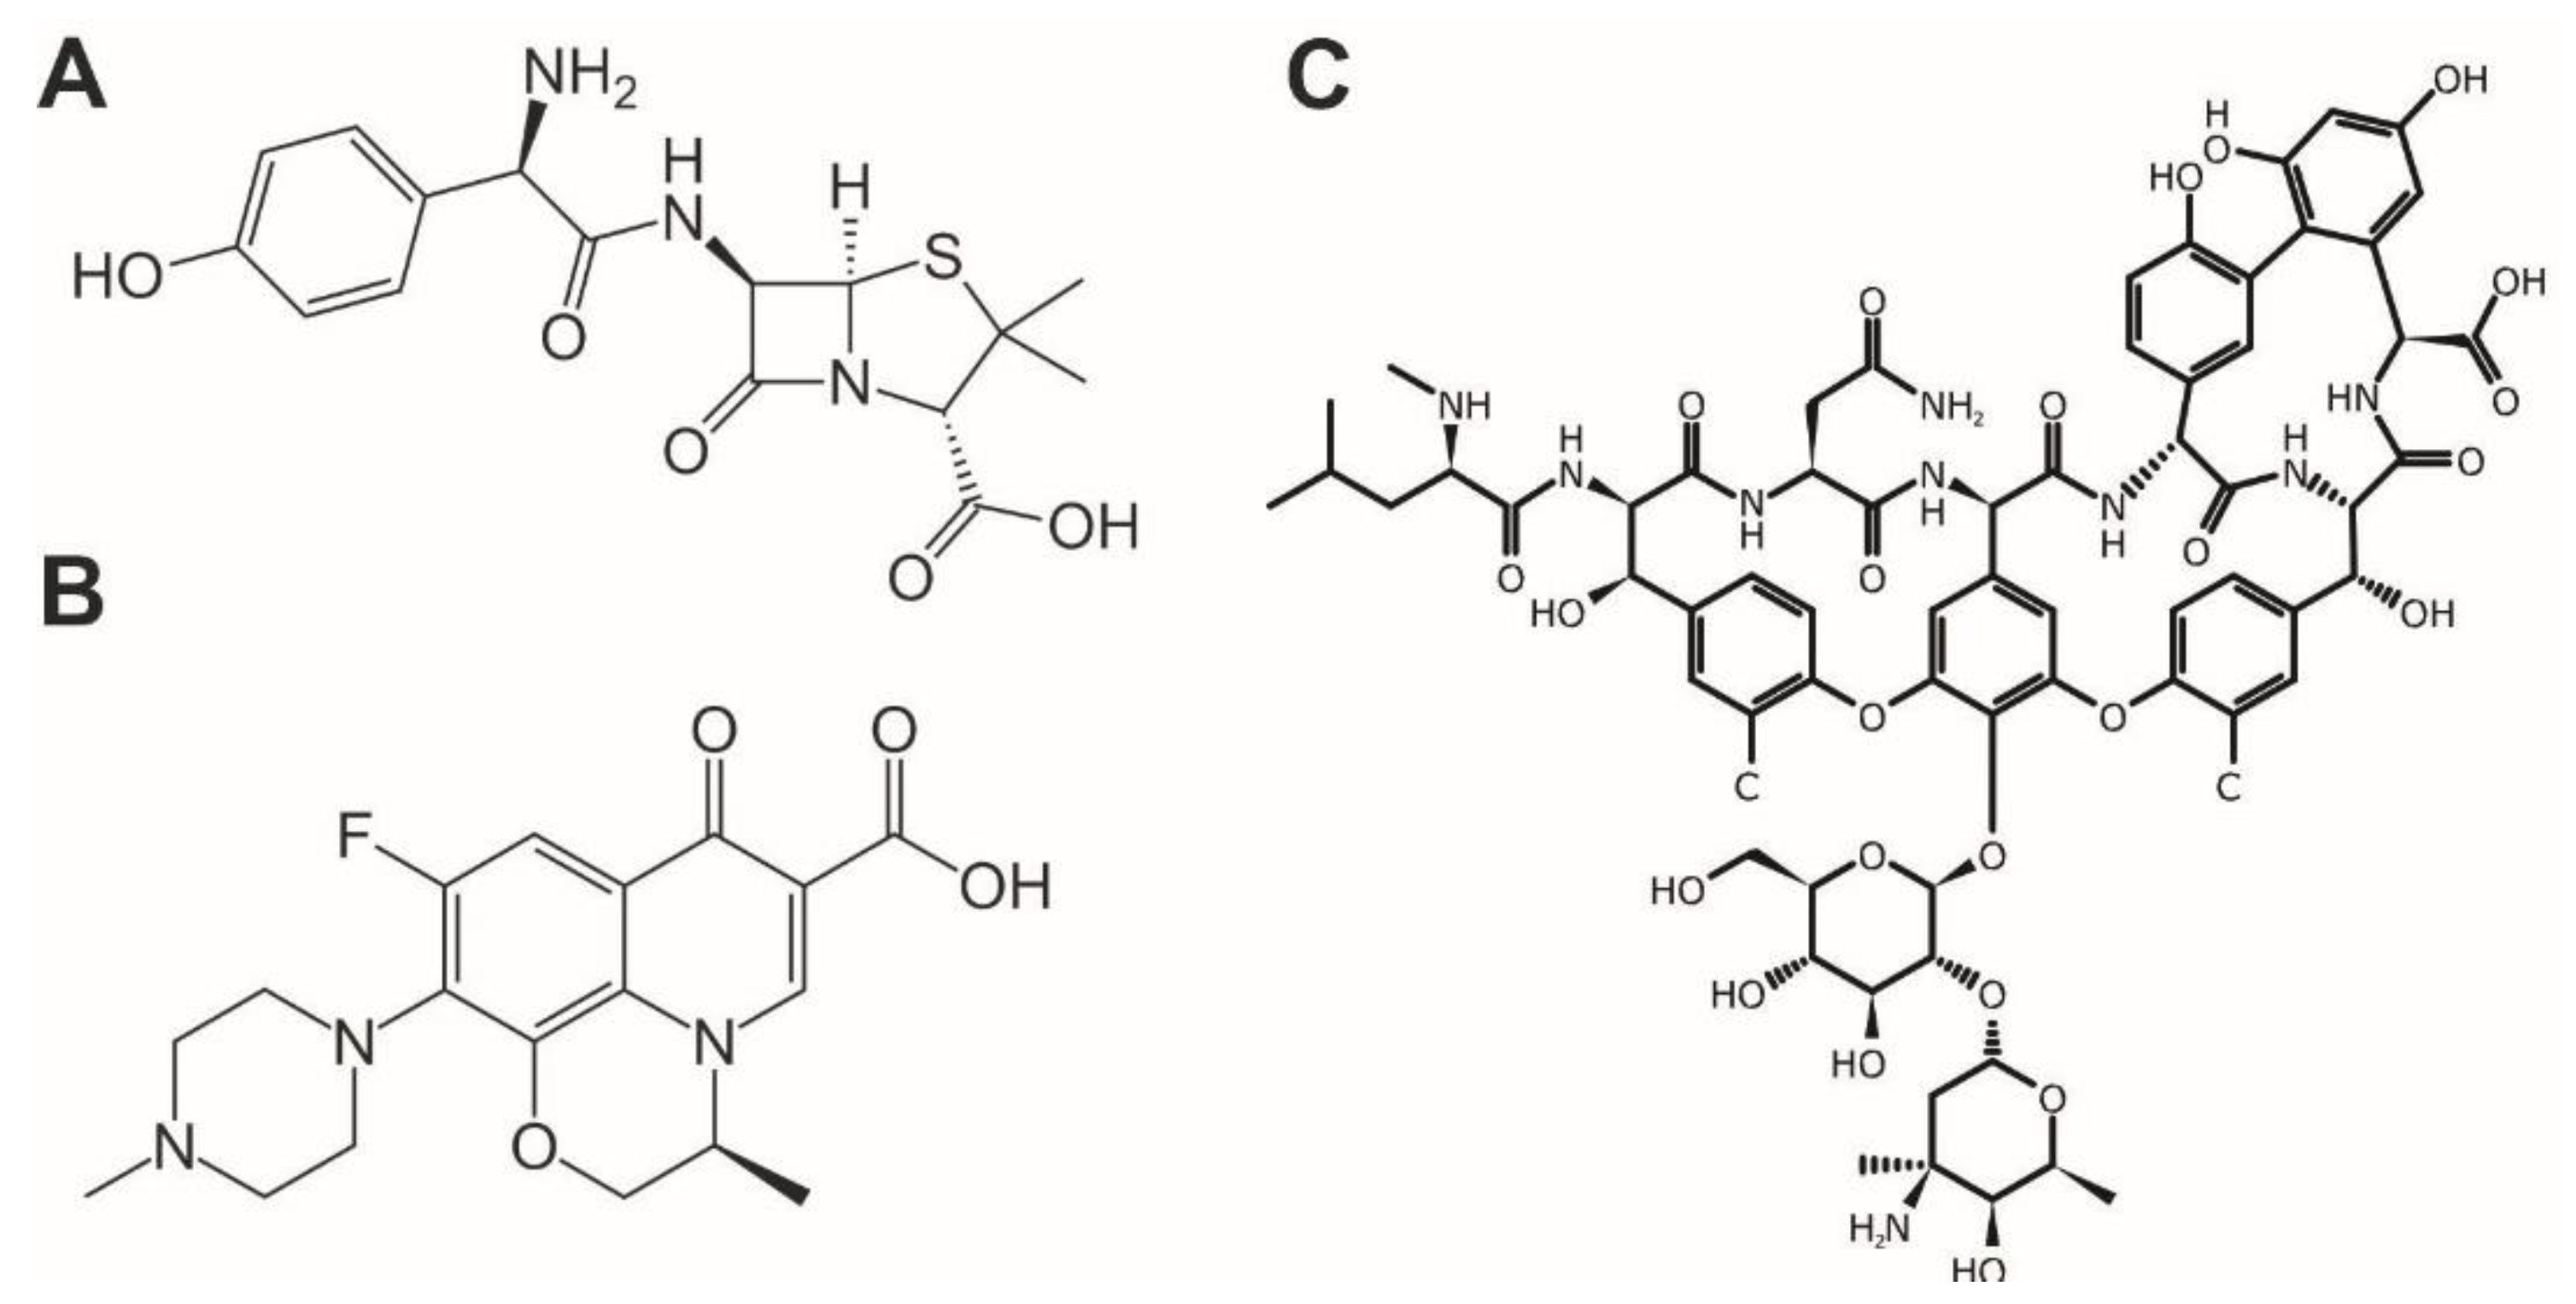
2.1. Model Antibiotics

As model substances two antibiotics Amoxicillin (AM) and Levofloxacin (LV) were used (Figure 1). They belong to different groups of antibiotics with different modes of microbial action. These antibiotics were selected as they have been already found in municipal treatment plant effluents and surface waters in several studies and represent environmental concern [3,12,30,31].
AM is structured of a thiazolidine ring and β-lactam ring which classifies it as penicillin. Its molecular weight is 353.4 g·mol−1 and its molecular formula is C16H19N3O5S [3]. LV belongs to the group of fluoroquinolones because it consists of two rings with ketone group, carboxylic group, and fluorine. Its molecular weight is 361.4 g·mol−1 and its molecular formula is C18H20FN3O4 [4,12]. VM is glycopeptide antibiotic. Its structure consists of carbohydrates and amino acids. Its molecular weight is 1449.3 g·mol−1 and molecular formula C66H75Cl2N9O24 [1].
Susceptibility to oxidation processes was studied for each antibiotic separately (400 mg·L−1) as well as their mixture (MIX) with another resistant antibiotic Vancomycin (100 mg·L−1 each) was investigated. Vancomycin (VM) was added because its presence was often confirmed in environmental samples [11].

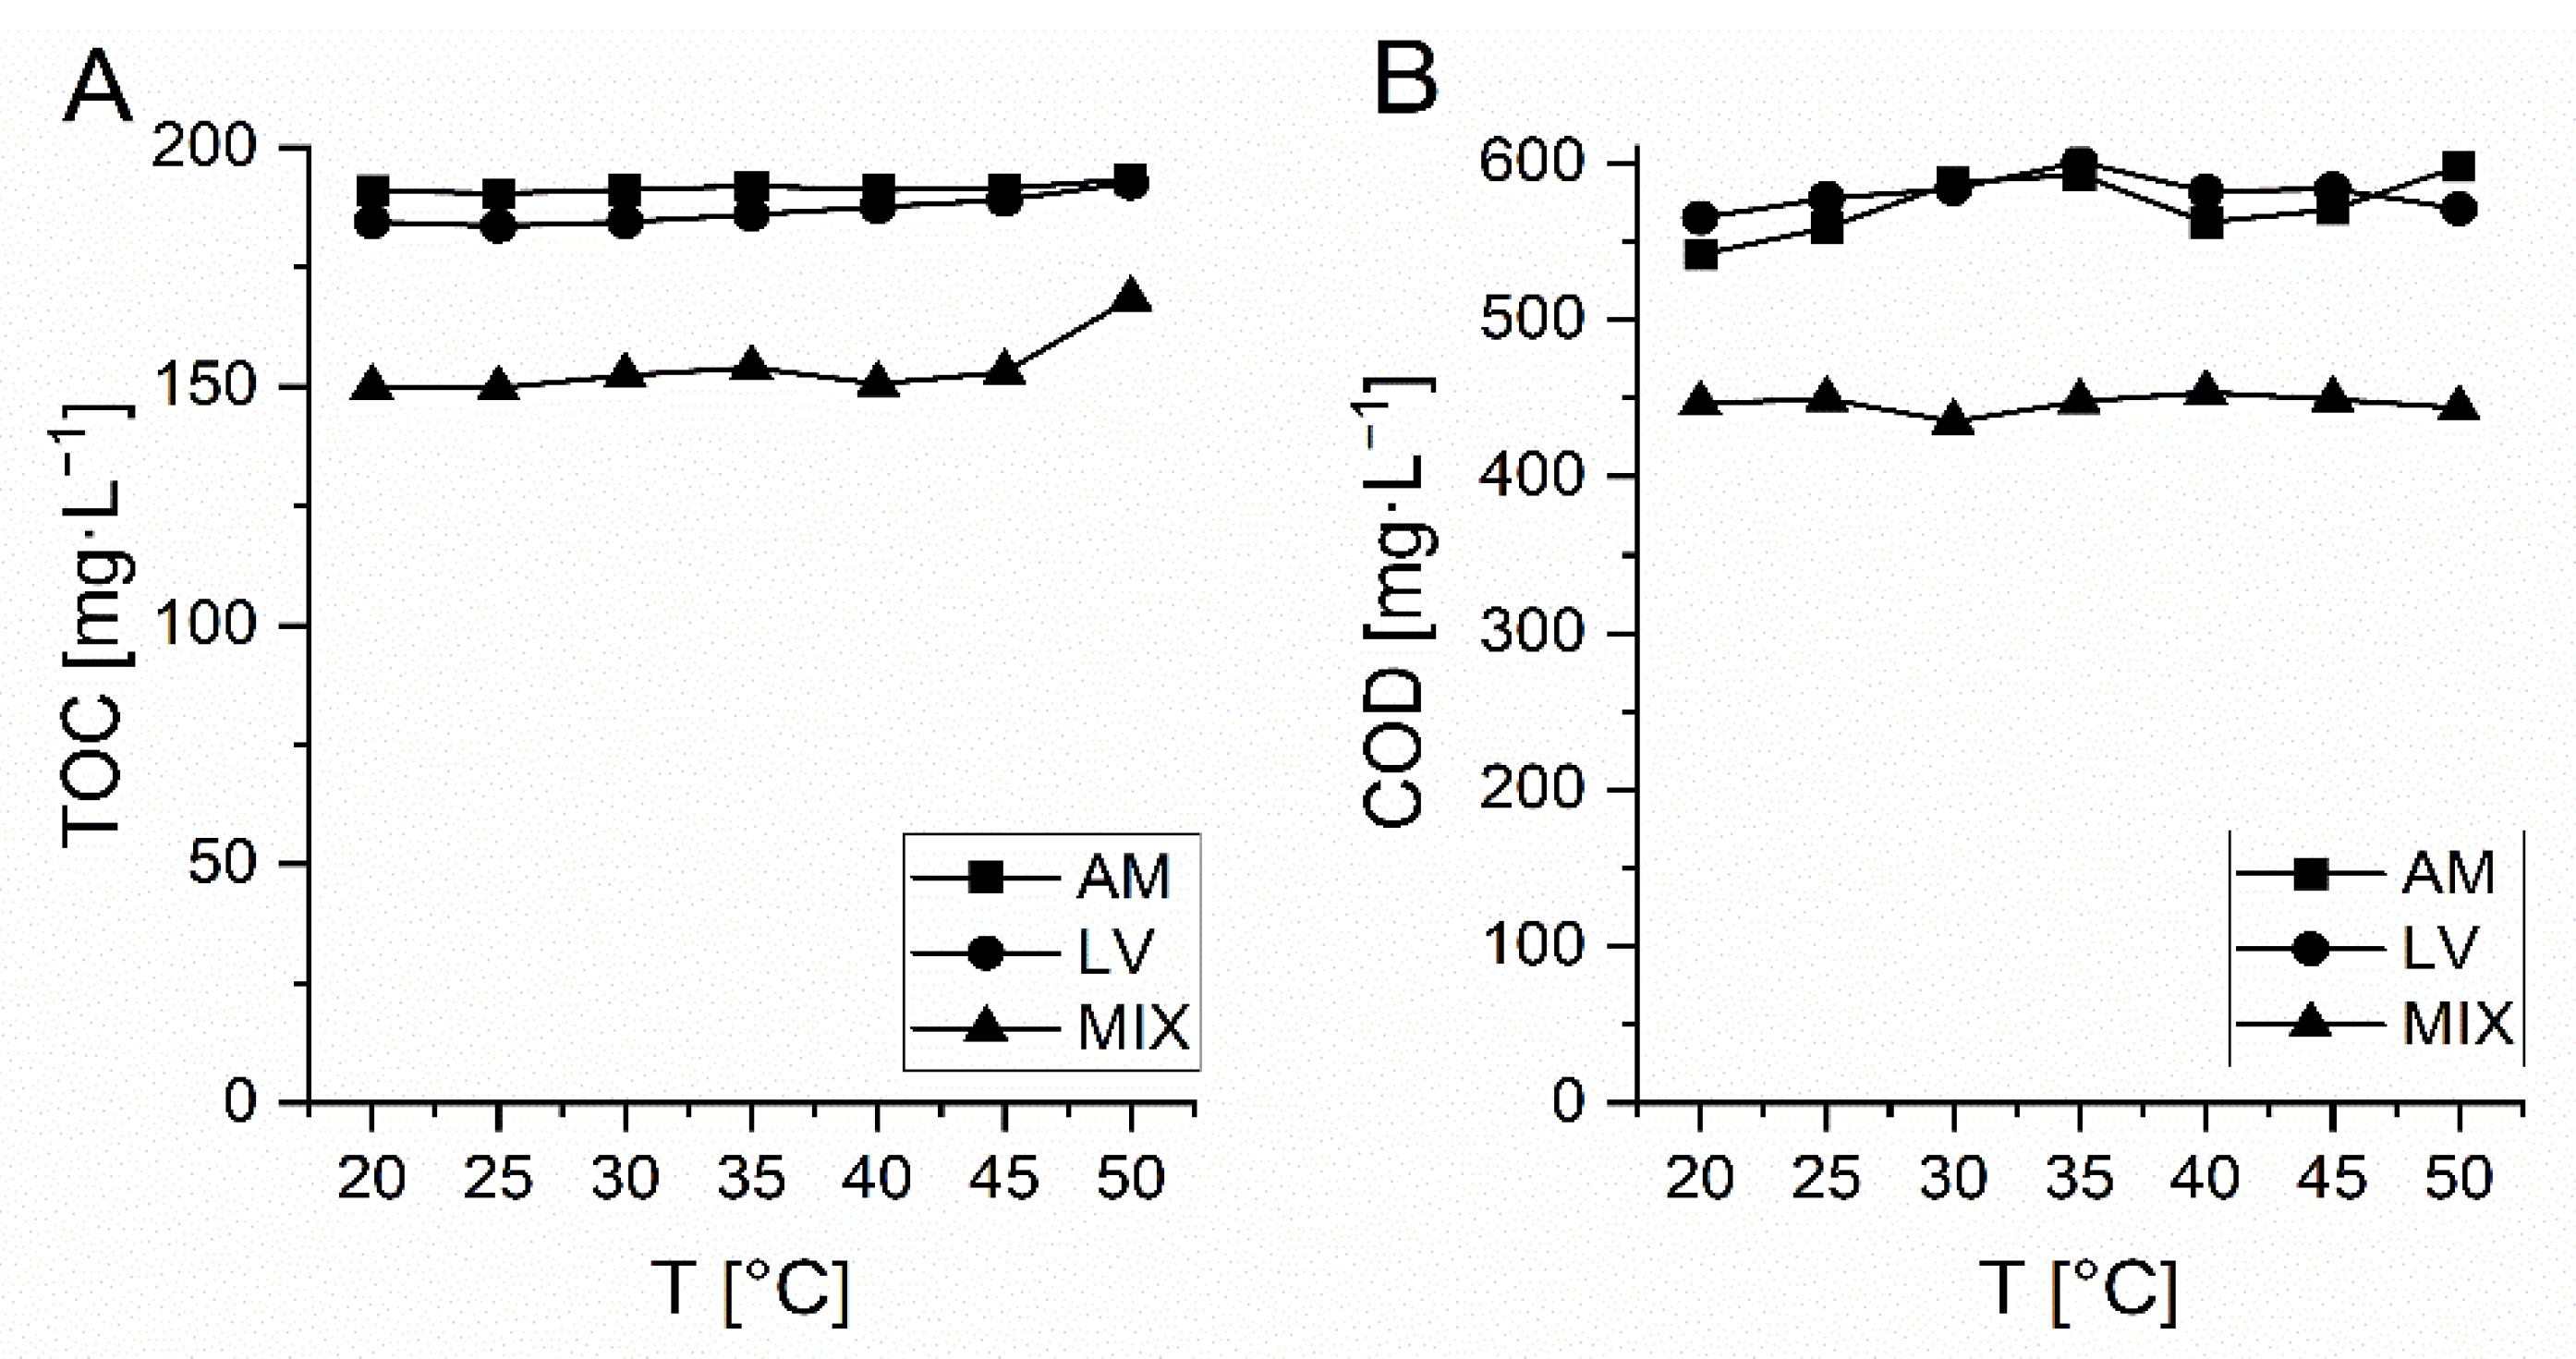
2.2. Thermal Stability Testing

All investigated antibiotics were tested for thermal stability before ozonation experiments. To obtain temperature dependence of the oxidation reaction rate constants experiments at different temperatures were accomplished (21/40 ± 1 °C). Each of the antibiotic’s solution (400 mg·L−1) was heated from 20 to 50 °C. At temperature increase for every 5 °C sample was taken, and total organic carbon (TOC) and chemical oxygen demand (COD) were determined to confirm thermal stability of the substance.

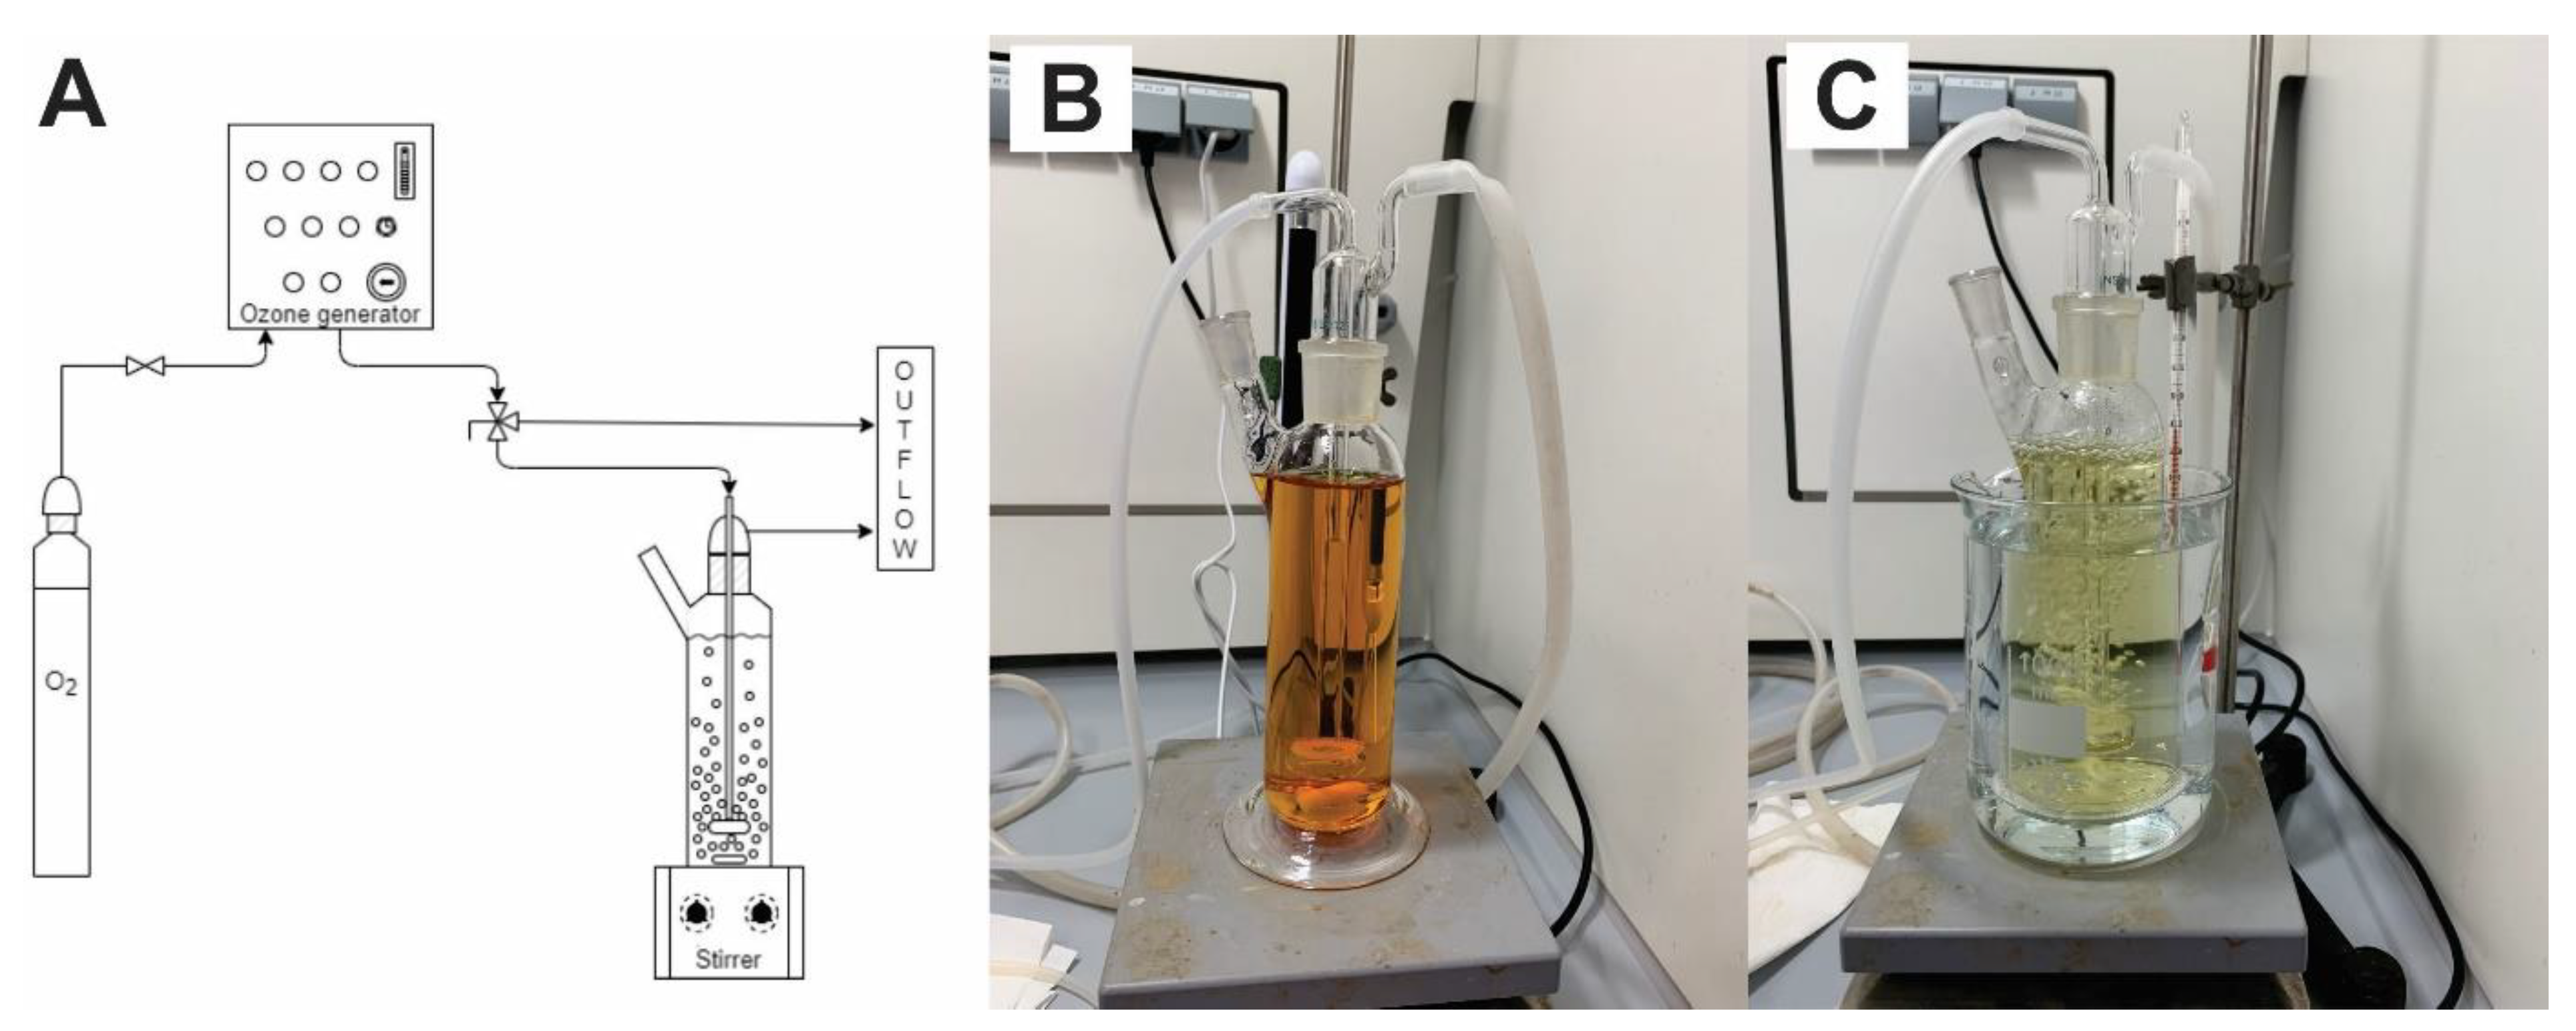
2.3. Experimental Set-Up

To compare efficiency of ozone-based oxidation methods for removal of persistent antibiotics, different methods such as ozonation (O3), indirect ozonation at pH 9.5 (O3/pH9.5), catalytic ozonation with Fe2+ (O3/Fe2+) and photocatalytic ozonation with Fe2+ and UV-A black light (O3/Fe2+/UV) were studied (Table 1). Volume of the solution was 300 mL. When performing indirect ozonation at pH 9.5 ± 0.2, antibiotic was solubilized directly in a buffer solution, which was prepared from 0.05 M di-sodium tetraborate 10-hydrate and 0.1 M NaOH at volume ratio of 4/1. The initial concentration of each investigated antibiotic (AM, LV) was 400 mg·L−1. When testing the mixture (MIX), concentration of each antibiotic (AM, LV, VM) was 100 mg·L−1.
In oxidation experiments solid iron (II) sulphate heptahydrate (FeSO4∙7H2O, 99.0–103.4%) and sodium hydroxide (NaOH, 98–100.5%) were used, obtained from Sigma-Adrich. For buffer solution solid di-sodium tetraborate 10-hydrate (Na2B4O7 10H2O, 99.5%) was obtained from Kemika d.d. UV light used was 6 W and 42 V (436.0 ± 9.6 lux).
In the laboratory experimental set-up ozone generator was connected to a cylindrical glass reactor with volume of 300 mL (Figure 2). Experiments were conducted in a batch mode. The reactor was placed on the magnetic stirrer (600 rpm) and ozone was introduced into the reactor via a porous glass frit. Experiments were performed under following conditions: pressure of the ozone generator was 0.5 bar, the gas flow was 30 L·h−1, the nominal concentration of ozone in the gas phase was 0.1 g·L−1 and an overall system capacity of ozone production was 3 g·h−1. Parameters and ozone doses were determined previously in studies with persistent veterinary antibiotic Tiamulin [32]. Ozone dose in experiment with single antibiotic increased with time and it was 0, 2.08, 4.16, 6.25, 12.5, 25 and 50 mgozone·mgsubstance−1 at 0, 5, 10, 15, 30, 60 and 120 min, respectively. In the experiments with mixture of the antibiotics, doses were lower (0, 0.52, 1.04, 1.56, 3.12, 6.25 and 12.50 mgozone·mgsubstance−1) regarding each antibiotic in the solution (3 × 100 mg·L−1). All calculations are based on initial concentrations of the antibiotics.
To assess actual mass transport of ozone and the range of its expected concentrations in solution of the antibiotics additional experiments were accomplished. 3 L of deionized water was first purged with nitrogen for one hour to remove all dissolved oxygen. Then, while stirring (600 rpm, 22 ± 2 °C), ozone was introduced under the same conditions as described above and the dissolved ozone concentration was measured every 2 min till final concentration plateau was reached. 118,755 Merck Ozone test was used, based on the reaction of ozone in weakly acidic solution with dipropyl-p-phenylenediamine (DPD) to form a red-violet dye (>0.007 mgozone·L−1) semi-quantitatively by visual comparison of the colour. The ozone concentration in (mg·L−1) vs. time (min) was plotted and the constant of mass transfer calculated from the linear part of the curve (0.66 mgozone·min−1, R2 = 0.9341). It was confirmed that actual ozone doses in the solution were lower as determined on the basis of nominal ozone concentrations in the gaseous phase. In 15 min, theoretical ozone dose was 12.5 mgozone·mgsubstance−1 while on the basis of ozone concentrations measurement it was 9.9 mgozone·mgsubstance−1. Concentrations of ozone were followed in liquid phase also during some of the experiments (0.3–18 mg·L−1), but measurements were not reliable and repeatable enough to be considered for any material balance of ozone.
All experiments were run for 120 min, samples were redrawn at 0, 5, 10, 15, 30, 60 and 120 min, where chemical oxygen demand (COD) and total organic carbon (TOC) was determined, according to ISO 6060 (1989) and ISO 8245 (1999), respectively. pH was also followed during the experiments. When direct ozonation was performed, the initial pH values were approximately 5.0 ± 0.3, 6.8 ± 0.2 and 6.0 ± 0.3 for AM, LV, and MIX, respectively. At the end of the ozonation pH lowered to approximately 2.5 ± 0.5 in all treated solutions. Indirect ozonation (O3/pH9.5) was performed in a buffer solution, therefore the pH was constant over time (9.5 ± 0.5) for all samples. When performing catalytic ozonation with Fe2+ (O3/Fe2+, O3/Fe2+/UV), initial pH value was 3.4 ± 0.5 for all samples and was decreasing with time to pH 2.5 ± 0.5.
Experiments were performed at two different temperatures (21/40 ± 1 °C) to determine the effect of the temperature to the oxidation efficiency and Arrhenius parameters were determined. Experiments at lower temperature (21 ± 1 °C) were performed twice, standard deviations were calculated. To maintain required temperature, reactor was put into the water bath (Figure 2C) and the temperature was monitored during the experiment periodically.
For correct interpretation of experimental data obtained at different temperatures the impact of temperature on ozone solubility must be considered [33]. It is dependent upon the temperature of water, concentration of ozone gas, and pressure of water. A small change in water temperature may create a large difference in potential ozone dissolved into water. Moreover, changes in ozone concentration in gaseous phase will change the ozone solubility dramatically. Experimental ozone concentration of 6.99% by weight (100 mgozone·L−1 in gaseous phase, Table 1) corresponds to 14.3 g·m−3 (1% by weight). Solubility of ozone at 5, 10, 20 and 40 °C is approx. 50, 39, 24 and 10 mg·L−1, respectively [33]. The ratio among solubility at 20 and 40 °C is high (2.4-times), affecting dose of ozone in liquid phase as well as mass ratio of ozone to substance significantly. This should also be considered when results are discussed.

2.4. Degradation Kinetics

Ozone-based degradation reactions usually occur in two consecutive steps. In the first step initial oxidation of the substance occurs and in the second step slow degradation of formed intermediates is proceeded [21]. Degradation kinetics of individual antibiotics and their mixture was determined using Equation (1). Rate constant (k) was calculated by Equations (2) and (3) for two consecutive steps of degradation based on the TOC and COD measurements using least-squares curve fitting to the experimental data.
d C d t = k c
l n T O C T O C 0 = k t
l n C O D C O D 0 = k t
C is the concentration of the substance [mg·L−1] at time t, k is a pseudo-first order rate constant [min−1], t is time [min], TOC0 is the initial total organic carbon [mg·L−1], TOC is total organic carbon at time t [mg·L−1], COD0 is the initial chemical oxygen demand [mg·L−1] and COD is chemical oxygen demand [mg·L−1] at time t. TOC and COD were plotted versus time and rate constant k1 [min−1] was determined from the first part of the graph, while the second part was related to k2 [min−1]. k1 was calculated from the TOC and COD data obtained in the first 15 min of the experiments with majority having R2 between 0.900–1.000. Only five R2 values were in the range of 0.6888–0.9000. k2 was generally calculated from TOC and COD data in the second phase (15–120 min) where R2 was in the range of 0.7433–1.000 with majority of them above 0.9000.
Experiments were run for each antibiotic at two different temperatures (21 ± 1 °C and 40 ± 1 °C). The rate constant was related to the temperature of the reaction according to the Arrhenius law (Equation (4)), where A is the frequency factor [min−1], ∆E is the activation energy [J·mol−1], R the gas constant [8.314 J·mol−1·K−1] and T is the temperature [K].
k = A · exp ( E R · T )
In any case, removal of the antibiotic depends upon dispersion of ozone in liquid phase (bubble size and mixing regime), its dissolution and possible dissociation into hydroxyl radicals depending upon pH and other factors of the system [34]. If the ozone is utilized fast enough through substances’ removal reactions, then mass transfer is usually limiting.

3. Results and Discussion

3.1. Model Antibiotics

In the Table 2 TOC [mg·L−1] and COD [mg·L−1] of initial solutions of model antibiotics Amoxicillin (AM) and Levofloxacin (LV) and their mixture (MIX) with Vancomycin (VM) are presented. Despite different chemical structure of selected compounds, initial TOC values were comparable (209.4–233.9 mg·L−1) as well as COD values (575.6–598.5 mg·L−1). Based on these measurements also the amount of antibiotics in the mixture were selected (100 mg·L−1 of each). Additional persistent antibiotic Vancomycin (VM) was added to have comparable TOC and COD values of the mixture to those of single compounds. This led to easy data evaluation due to the comparable ozone dose applied in each of the experiment.
In Figure 3 TOC and COD during thermal stability testing of AM, LV and MIX (AM+LV+VM) are presented. In the investigated temperature range (20–50 °C) COD and TOC of the solutions did not change significantly (± 4%) and thus it was confirmed that measured changes of both parameters are due to the oxidative treatment and not related to the temperature changes.

3.2. Ozonation

Ozonation (O3), indirect ozonation at pH 9.5 (O3/pH9.5), catalytic ozonation with Fe2+ (O3/Fe2+) and photocatalytic ozonation with Fe2+ and UV-A black light (O3/Fe2+/UV) were studied at two different temperatures (21 ± 1 °C and 40 ± 1 °C) for AM and LV as well as their mixture with VM. Data on treatment efficiencies vs. time were used to calculate reaction rate constants (k1 and k2, min−1) using Equations (2) and (3) and temperature dependency (Equation (4)). k1 was obtained from the first 15 min of the experiment (the first phase), while k2 was calculated from 15–120 min data (the second phase, Section 2.4).

3.2.1. Ozonation

Treatment efficiencies of direct ozonation (O3) are presented in Table 3. Results were obtained at both investigated temperatures (21 ± 1 °C and 40 ± 1 °C) after 15 (the first phase) and 120 min (the second phase) of ozonation.
120 min ozonation at 21 °C of AM led to 27.7% and 60.6% TOC and COD removal, respectively. Measurements confirmed that complete mineralisation was not achieved at this temperature (Table 3). Higher temperature increased TOC (40.8%) and COD (68.5%) removal. The difference among the first and the second phase removal at 21 °C for AM was significant (9.8/27.7% according to TOC and 38.3/60.6% according to COD) but it was a consequence of intensive increase in ozone dose with time (15/120 min). The same was also noticed at higher temperature (40 °C, Table 3). Ozonation of LV was more efficient than ozonation of AM even at lower temperature in both phases. Increased temperature was not important in the first phase according to TOC (16.2%/10.9%) and COD (42.7%/41.9%) measurements while it contributed to more efficient removal efficiencies (38.5%/56.4% according to TOC and 67.2%/75.1% according to COD) in the second phase. The oxidative removal of MIX was comparable to oxidation efficiency of single AM and LV. According to COD and TOC measurements temperature increased oxidation (75.7%/67.2%) and also mineralization (36.4%/60.4%, Table 3).
Initial pH of the test mixtures was for all of the samples in the range of 5.0–6.8 (Section 2.3) and was decreasing with time to pH 2.5 ± 0.5. It was assumed, that main mechanism is selective ozonation and thus by-products were formed as can be seen from COD (oxidation) and TOC measurements (mineralisation) comparison [21,22]. If data for the second phase of ozonation in Table 3 are compared we can clearly see, that in general only 50–75% of mineralization is achieved. For LV at 21 °C mineralization reached 57% (TOC/COD = 38.5%/67.2%), while at 40 °C it was 75% (TOC/COD = 56.4%/75.1%).
At both temperatures reaction rate constants in the first phase were higher confirming oxidation (COD removal) as well as mineralisation (TOC removal) of AM, LV and MIX (Table 4). In some cases, the difference was up to 10-folder magnitude (e.g., k1/k2 at 21 °C for TOC: 0.0125/0.0015). Generally, the reaction was faster with higher temperature, while in some cases it was reduced. Temperature significantly reduces solubility of ozone in liquid phase leading to lower actual ozone dose. Thus, lower reaction rate at higher temperature could be a consequence of lower dose of ozone not increased temperature. At the same time, higher reaction rates and better removal efficiencies at higher temperature could be assigned to a positive effect of increased temperature assuming that theoretically 2.4-times less ozone is available in the solution [33]. For AM higher temperature increased k2 based on TOC calculations and both rate constants according to COD. Higher temperature reduced the first phase of LV oxidation, while k2 were much higher for TOC (0.0017/0.0061) and COD (0.0036/0.0072) indicating better mineralisation of LV in terms of TOC removal. The elevated temperature increased rate constants for both parameters of MIX. Added VM did not significantly affect ozonation potential of investigated antibiotics. Reaction rate constants of MIX were comparable to AM and LV (Table 4).
In Table 5 Arrhenius parameters obtained during direct ozonation are presented. In some cases, Ea [J·mol−1] was not possible to calculate due to low differences in k1/k2 at different temperatures leading to calculated negative values of Ea. According to TOC measurements for MIX, Ea in the second phase is higher, while according to COD it is lower due to the previously accomplished mineralisation in the second phase. However, oxidation processes are affected by dissolution of ozone in liquid phase, its mass transfer and chemical reaction rate and thus on the basis of presented data is not possible to reliably confirm the reaction order. The same is even more evident in the case of mixture, where pseudo-first order generally fit the most summarizing different reaction rates of substances present. Low mass transfer coefficient (0.66 mgozone·min−1, Section 2.3) indicated that the reaction kinetics are largely controlled by mass transfer. This can be also seen from time-increased removal efficiency of AM, LV, and MIX (Table 3).
Feasibility of the direct ozonation of selected antibiotics was also confirmed by other authors. In the study of Kidak et al. [26] ozonation (ozone dose 6.67 mgozone·min−1, 23 ± 2 mgozone·L−1 in liquid phase) of aqueous AM solutions (25 and 100 mg·L−1) in a 250 mL batch reactor was run. More than 99% of AM removal was achieved in 10 min at pH = 7. Pseudo-first order reaction rate constant for ozonation was 0.321 ± 0.028 min−1. In our case TOC and COD removal efficiency and rates were lower (up to 60% at 21 °C) because we did not follow actual concentration of the substance. At the same time, pH was lower and thus direct ozonation was favorized [2]. However, reaction rate at comparable pH = 3 (0.064 ± 0.006 min−1) was in the same range as it has been determined in our study (0.0125–0.0352 min−1, Table 4). TOC and COD indicated formation of by-products, which were confirmed in study of Kidak et al. [26] by toxicity testing. Mojiri et al. [35] also confirmed 90% removal of AM after 4 min and 18% mineralization after 20 min of ozonation (1.6 × 10⁻⁴ M O3, pH = 2.5–7.2). In our case after 15 and 120 min 9.8% and 27.7% mineralization in terms of TOC removal was determined despite higher O3 doses we had applied (2.08 - 50 mgozone·mgAM−1 vs. 0.307 mgozone·mgAM−1).
Nasuhoglu et al. [28] preformed ozonation experiments (3.3 gozone·h−1) in a 2 L reactor containing 500 mL of LV solution (20 mg·L−1). After 45 s (dose of 20.5 mgozone·L−1) no LV was detected. The applied dose of ozone (1.02 mgozone·mgLV−1) was lower than applied in presented experiments (6.25 mgozone·mgLV−1 in 15 min) to achieve 16.2% TOC and 42.7% COD removal. However, they had measured concentration of LV and did not determine any possible by-products while in our case mineralization was followed (TOC/COD). Results of Witte et al. [36] who observed half-life time about 80-times longer (12.8 min, initial concentration of LV was 16.4 mg·L−1) than Nasuhoglu et al. [28], are more correlated to data obtained in this study.
Ozonation experiments were conducted in batch system with VM-spiked wastewater at various O3 doses, at 20 °C and pH 7.7 [29]. Ozone doses above 3 mg·L−1 yielded in more than 99% depletion of contaminants. In the paper presented data do not allow direct comparison to our study due to different experimental approaches.

3.2.2. Indirect Ozonation

Treatment efficiencies of indirect ozonation at pH 9.5 (O3/pH9.5) are presented in Table 6. Results were obtained at both investigated temperatures (21 ± 1 °C and 40 ± 1 °C) after 15/120 min of ozonation at increased pH to favor formation of non-selective •OH radicals with higher oxidation potential [2]. 120 min O3/pH9.5 process at 21 °C led to more efficient removal of AM in comparison to ozonation; 49.5% and 86.6% of TOC and COD removal was achieved, respectively. Complete mineralisation was again not achieved at this temperature (Table 6). Higher temperature increased TOC (73.5%) and COD (91.9%) removal indicating better oxidation and lower formation of by-products. The removal in the second phase at 21 °C for AM was twice as high as in the first phase (21.1/49.5% according to TOC and 56.2/86.6% according to COD), which was a consequence of longer oxidation (15/120 min). Higher temperature caused the same effect leading to quite efficient mineralisation with 73.5% removal of TOC and almost complete oxidation (91.9%). Indirect ozonation (O3/pH9.5) of LV was comparable at both temperatures in both phases, however more intensive mineralisation in terms of more reduced TOC could be observed (Table 6). The impact of the temperature on oxidation of LV was the most evident in the second phase where COD removal at 40 °C reached up to 92.1%. The oxidative removal of MIX was comparable to oxidation efficiency of single AM and LV. In all cases efficiencies were higher than obtained during direct ozonation (Table 3, Table 6). This was explained as a consequence of higher pH which because of the buffer solution added (Table 1) remained for all of the samples in the range of 9.1–9.5. It was assumed, that main mechanism is formation of hydroxyl radicals with higher oxidation potential leading to less selective ozonation accompanied by better mineralization [21,22]. If data for the second phase of ozonation in Table 6 are compared as it has been done for direct ozonation higher extent of mineralization is generally observed. For LV at 21 °C mineralization reached 76% (TOC/COD = 60.8%/79.5%), while at 40 °C it was 85% (TOC/COD = 78.1%/92.1%). Both values were 10-20% higher than in the case of direct ozonation (Section 3.2.1).
At both temperatures reaction rate in the first phase was higher confirming intensive initial oxidation (COD) as well as mineralisation (TOC) of AM, LV and MIX (Table 7). Reaction rate constants were generally twice as high as in the case of direct ozonation (Table 4, Table 7) confirming formation of •OH radicals at higher pH (3.0/9.5). Reactions were faster at higher temperature in spite of expected lower solubility of ozone in liquid phase followed by lower ozone dose [33]. Increased temperature was the most efficient in the case of AM and MIX.
Calculated Arrhenius parameters (A, Ea) obtained during indirect ozonation (O3/pH9.5) were not very comparable to those obtained in direct ozonation (Table 5, Table 8). According to TOC reduction, Ea [J·mol−1] was comparable for AM, LV, and MIX in both phases, while according to COD differences between samples were significant. Pseudo-first order again seems to be the best fit of obtained data. Hence, the mechanism of reaction is assumed to be different than in the case of direct ozonation due to the expected formation of hydroxyl radicals, which react faster and less selective with test compounds it can be again assumed, that the reaction kinetics are largely controlled by mass transfer.
There are scarce data on indirect ozonation (O3/pH9.5) of selected antibiotics. Mojiri et al. [35] determined pseudo-first order reaction rate constants for ozonation of AM at pH 10 (1.970 ± 0.051 min−1) where 32% mineralization occurred after 90 min. In presented study comparable 49.5% mineralization (TOC) in 120 min was achieved. Rate constants could not be compared due to different parameters monitored (concentration of AM vs. TOC/COD). De Witte et al. [36] performed ozonation of LV in a bubble column containing 1.75 L water buffered with 2.53 mM borax buffer (pH = 10). Initial Levofloxacin concentration was 16.4 mg·L−1. After 60 min 10% degradation was obtained with 3.80 ± 0.05 mM·min−1 reaction rate constant. Values were much lower and not comparable to our data, due to different experimental conditions and design (Table 1, Table 6).

3.3. Catalytic Ozonation

3.3.1. Ozonation with Fe2+

Treatment efficiencies of catalytic ozonation with Fe2+ (O3/Fe2+) are presented in Table 9. Experiments were conducted at both investigated temperatures (21 ± 1 °C and 40 ± 1 °C) for 15/120 min of ozonation in the presence of Fe2+ to increase formation of non-selective •OH radicals with higher oxidation potential due to the occurrence of Fenton reactions [2]. Initial addition of 14.15 mg of Fe2+ and 50 mgozone·mgsubstance−1 delivered in the solution in 120 min (Table 1) resulted in theoretical substance (AM/LV):O3:Fe2+ mass ratio of 1:50:14.15. In the case of the MIX, the mass ratio was substance (AM+LV+VM):O3:Fe2+ = 0.75:35.5:14.15 due to the fact, that MIX contains only 300 mg·L−1 of antibiotics (AM+LV+VM) in comparison to 400 mg·L−1 of single antibiotic in the solution.
After 120 min of Fe2+ enhanced ozonation at 21 °C removal efficiency of AM was twice as high as noticed in the case of direct ozonation; 46.6% and 85.8% of TOC and COD removal was achieved, respectively (Table 9). Values were comparable to those obtained in O3/pH9.5 process (Table 6). Complete mineralisation was again not achieved (Table 9) but oxidation in terms of COD removal was higher than in direct ozonation and lower than in O3/pH9.5. Identical TOC (82.7%) and COD (82.8%) removal in the case of AM indicated complete oxidation. The removal in the second phase at 21 °C for AM was again twice as high as in the first phase attributed to longer duration of the second phase. Higher temperature affected efficiency of the first phase according to TOC measurements (extent of mineralisation), while COD values were not increased. The same was also noticed for LV, where very low mineralisation was measured in the first phase at both temperatures (7.0/14.5%) accompanied with good COD removal (45.1/44.7%) explained as intensive oxidation leading to formation of by-products. As in the case of AM the impact of the temperature on oxidation of LV was the most evident in the first phase where it enhanced mineralisation. The oxidation of MIX was comparable to oxidation efficiency of single AM and LV. In all of the cases efficiencies were higher than obtained during direct ozonation (Table 3, Table 9) and lower than those obtained by indirect ozonation O3/pH9.5 (Table 6, Table 9). Catalytic ozonation employs catalysts to enhance the decomposition of O3 and intensive formation of •OH radicals. Fe2+ is often used as catalyst to increase the degradation rate of persistent organic compounds. Metal ions could influence the rate of reaction, the selectivity of oxidation by ozone and the efficiency of ozone utilization [14]. Lower efficiency of the process in comparison to indirect ozonation could also be a consequence of pH values decreasing from initial pH value 3.4 ± 0.5 to pH 2.5 ± 0.5 again favoring more selective direct ozonation [21].
At both temperatures reaction rate constants in the first phase were again higher confirming oxidation (COD) as well as mineralisation (TOC) of AM, LV and MIX (Table 10). Reaction rates in the first phase were generally twice as high as in the case of direct ozonation (Table 4, Table 10) but a bit lower than in the case of indirect O3/pH9.5 oxidation (Table 7). Reactions were faster with higher temperature despite expected lower ozone dose when mineralisation (TOC removal) is considered. In the case of COD removal, higher T did not increase the extent of oxidation in the second phase.
In Table 11 Arrhenius parameters obtained during catalytically enhanced ozonation with Fe2+ (O3/Fe2+) are presented. In some cases, Ea [J·mol−1] was not possible to calculate due to low differences in k1/k2 at different temperatures leading to calculated negative values. Calculated Arrhenius parameters (A, Ea) obtained in O3/Fe2+ process are again non comparable to those obtained in previously run experiments (Table 5, Table 8 and Table 11). According to TOC reduction, Ea [J·mol−1] was comparable for AM, LV, and MIX in the second phase, while according to COD data did not enable Ea calculations. Low Ea in the second phase calculated from TOC measurements indicated easy mineralisation in the first phase formed by-products during oxidation of all three samples. As in previous experiments, we cannot exactly determine the prevailing limiting process of the reaction and again the pseudo first reaction seemed to be the best fit.
There are not many data available on catalytic oxidation of selected antibiotics. Wang et al. [20] discussed oxidative treatment of AM using zero valent iron, Fe2+ and Fe2+ in combination with H2O2 at various pHs. Removal rates were from 80 to 100%, comparable to our values based on COD determination (Table 9). They concluded that doses of catalysts were very important as well as pH of the system associated to different ionisation state of pollutant and catalyst.

3.3.2. Ozonation with Fe2+ and UV

Removal efficiencies of photocatalytic ozonation with Fe2+ and UV-A black light (O3/Fe2+/UV) at both investigated temperatures (21 ± 1 °C and 40 ± 1 °C) are presented in Table 12 (15/120 min). The ratio of Fe2+ vs. O3 per mg of the substance was the same as in previously described experiments (Table 1, Section 2.3). UV radiation increases efficiency of catalytic system by initiating photolysis of ozone followed by the production of •OH radicals due to the reactions of •O with water. Synergistic effect of components promotes ozone decomposition by direct and indirect production of hydroxyl radicals and increases treatment efficiency [23].
After 120 min of Fe2+/UV enhanced ozonation at 21 °C better removal of AM in comparison to O3/Fe2+ process was noticed (Table 9, Table 12). 60.7% and 85.4% of TOC and COD removal was achieved, respectively indicating better mineralisation and comparable oxidation. Comparison to O3/pH9.5 process (Table 6, Table 9, Table 12) again confirmed the most efficient oxidation in O3/pH9.5 system. Higher temperature increased only TOC removal (84.6%) indicating better mineralisation of AM in such conditions. UV radiation also improved TOC and COD removal of LV in comparison to O3/Fe2+, but not significantly. The difference in TOC and COD removal at both temperatures in the first phase of LV removal was again related to intensive oxidation leading to formation of by-products. The oxidation of MIX was comparable to oxidation efficiency of single AM and LV. In all the cases efficiencies were generally higher than those obtained during direct ozonation or catalytic ozonation (O3/Fe2+) (Table 3, Table 9, Table 12) and lower than those obtained by indirect ozonation O3/pH9.5 (Table 6, Table 12). Increased temperature again showed positive effect only in some cases, mainly it increased mineralisation in terms of more efficient TOC removal. In the case of AM at 40 °C almost complete mineralisation was attained at the end of experiment, because TOC removal equals COD decrease. The extent of mineralisation due to the temperature increase was the most evident for AM (Table 12).
At 21 °C reaction rate in the first phase was again higher confirming oxidation (COD) as well as mineralisation (TOC) of AM (Table 13), while higher temperature reduced rate constants as a consequence of lower ozone solubility. They were generally higher than in the case of direct ozonation (Table 4, Table 13) and comparable to values obtained by catalytic O3/Fe2+ process (Table 10, Table 13). In the case of LV and MIX at lower temperature reaction rates are lower than in O3/Fe2+ process. The impact of temperature was not consistent.
In some cases, Ea [J·mol−1] was not possible to calculate (Table 14). It can be concluded that reaction rate is not solemnly affected by chemical reaction but also by mass transfer and solubility of ozone in liquid phase led to non-reliable characterization of temperature dependency of the oxidation process (Table 5, Table 8, Table 11, Table 14).
Lofrano et al. [37] measured photocatalytic degradation of VM B using different TiO2 doses of 0.1 and 0.2 g·L−1. Removal rates of 0.013 and 0.036 min−1 were determined based on measurement of VM B concentrations. Values are comparable to the reaction rates obtained in the first phase for MIX containing VM (Table 13). Wang et al. [20] also addressed the impact of radiation on degradation of different antibiotics. AM degraded in the UV-A/TiO2 system 100% [38] while LV was removed by TiO2 and rGO-CdS up to 90 and 82.7%, respectively [39,40]. In our case AM was removed 85.4% according to COD and 60.7% according to TOC (21 °C, 120 min, Table 12). The difference can again be attributed to different analytical techniques (concentration of the substance vs. summary parameters) which enables us detection of oxidation by-products still present in the solution. The same applies also for LV. Removal rate of VM was 95% in the study of Lofrano et al. [37]. It is not possible to make direct comparison due to the different concentration of substances, experimental systems and analytical approaches used.

4. Conclusions

The aim of this research was to study oxidative degradation of two environmentally relevant antibiotics (Amoxicillin, Levofloxacin) and their mixture with persistent Vancomycin in aqueous solutions. Methods of direct ozonation (O3), indirect ozonation at pH 9.5 (O3/pH9.5), catalytic ozonation with Fe2+ (O3/Fe2+) and photocatalytic ozonation with Fe2+ and UV-A black light (O3/Fe2+/UV) were accomplished at two temperatures (21 and 40 °C). Thermal stability of the antibiotics was confirmed. Only in the case of ozonation of Amoxicillin complete mineralisation occurred. Addition of persistent Vancomycin to the mixture did not significantly affect the treatability of Amoxicillin and Levofloxacin. Determination of COD and TOC simultaneously confirmed formation of oxidative by-products. In the first 15 min intensive oxidation at 21 and 40 °C was measured: 28.3–57.3% and 34.5–69.2%, respectively. Lower mineralization took place in this phase: 7.0–27.7% (21 °C) and 8.1–51.5% (40 °C), respectively. Longer ozonation led to better treatment potential. The difference between antibiotics and processes were not significant, but the most efficient seemed to be indirect ozonation at pH 9.5 (O3/pH9.5) and photocatalytic ozonation with Fe2+ and UV-A black light (O3/Fe2+/UV) where the highest final treatment efficiencies were determined (up to 93.4% and 89.8%, respectively). The lowest efficiency was obtained by direct ozonation (up to 75.7%). Reaction rate based on presumption of pseudo-first order kinetics was affected by mass transfer and solubility of ozone in liquid phase due to different conditions leading to unreliable characterization of temperature dependency of the processes. It was concluded that ozone-based oxidation is a viable option for effective removal of antibiotics, but they are relatively demanding to accomplish complete mineralization of pollutants. Further research is focused on optimization of applied enhanced ozonation processes for removal of selected antibiotics and their mixtures by determination of by-products using chemical analyses and biotests.

Author Contributions

Conceptualization, A.Ž.G., J.D. and M.V.; methodology, A.Ž.G. and M.V.; software, U.R.; validation, A.Ž.G., M.V. and U.R.; formal analysis, A.Ž.G., U.R. and M.V.; investigation, U.R., T.A., M.V. and T.U.; resources, A.Ž.G.; data curation, A.Ž.G.; writing—original draft preparation, A.Ž.G., T.A., T.U. and U.R.; writing—review and editing, A.Ž.G. and U.R.; visualization, U.R. and A.Ž.G.; supervision, A.Ž.G.; project administration, A.Ž.G.; funding acquisition, A.Ž.G. and J.D. All authors have read and agreed to the published version of the manuscript.

Funding

This work was supported by the Slovenian Research Agency ARRS (Research Program Chemical Engineering P2-0191) and the Agency for Research and Development (Slovakia) under the contract No. APVV-0656-12. The research work was partially accomplished in the framework of the National Scholarship Programme of the Slovak Republic for a scholarship stay of A.Ž.G. in Slovakia (ID 29291 (2020) and ID 25614 (2019), SAIA).

Institutional Review Board Statement

Not applicable.

Informed Consent Statement

Not applicable.

Data Availability Statement

The data presented in this study are available on request from the corresponding author.

Acknowledgments

The authors are grateful to Vesna Delalut for her excellent laboratory assistance.

Conflicts of Interest

The authors declare no conflict of interest.

References

  1. Ay, F.; Kargi, F. Advanced Oxidation of Amoxicillin by Fenton’s Reagent Treatment. J. Hazard. Mater. 2010, 179, 622–627. [Google Scholar] [CrossRef] [PubMed]
  2. Arslan-Alaton, I.; Dogruel, S. Pre-Treatment of Penicillin Formulation Effluent by Advanced Oxidation Processes. J. Hazard. Mater. 2004, 112, 105–113. [Google Scholar] [CrossRef] [PubMed]
  3. Andreozzi, R.; Caprio, V.; Ciniglia, C.; De Champdoré, M.; Lo Giudice, R.; Marotta, R.; Zuccato, E. Antibiotics in the Environment: Occurrence in Italian STPs, Fate, and Preliminary Assessment on Algal Toxicity of Amoxicillin. Environ. Sci. Technol. 2004, 38, 6832–6838. [Google Scholar] [CrossRef]
  4. Homem, V.; Santos, L. Degradation and Removal Methods of Antibiotics from Aqueous Matrices—A Review. J. Environ. Manag. 2011, 92, 2304–2347. [Google Scholar] [CrossRef]
  5. Elmolla, E.; Chaudhuri, M. Optimization of Fenton Process for Treatment of Amoxicillin, Ampicillin and Cloxacillin Antibiotics in Aqueous Solution. J. Hazard. Mater. 2009, 170, 666–672. [Google Scholar] [CrossRef] [PubMed]
  6. Kairigo, P.; Ngumba, E.; Sundberg, L.R.; Gachanja, A.; Tuhkanen, T. Occurrence of Antibiotics and Risk of Antibiotic Resistance Evolution in Selected Kenyan Wastewaters, Surface Waters and Sediments. Sci. Total Environ. 2020, 720, 137580. [Google Scholar] [CrossRef] [PubMed]
  7. Johnson, A.C.; Keller, V.; Dumont, E.; Sumpter, J.P. Assessing the Concentrations and Risks of Toxicity from the Antibiotics Ciprofloxacin, Sulfamethoxazole, Trimethoprim and Erythromycin in European Rivers. Sci. Total Environ. 2015, 511, 747–755. [Google Scholar] [CrossRef] [Green Version]
  8. Yargeau, V.; Leclair, C. Potential of Ozonation for the Degradation of Antibiotics in Wastewater. Water Sci. Technol. 2007, 55, 321–326. [Google Scholar] [CrossRef]
  9. Adelglass, J.; DeAbate, C.A.; McElvaine, P.; Fowler, C.L.; LoCocco, J.; Campbell, T. Comparison of the Effectiveness of Levofloxacin and Amoxicillin- Clavulanate for the Treatment of Acute Sinusitis in Adults. Otolaryngol. Head Neck Surg. 1999, 120, 320–327. [Google Scholar] [CrossRef]
  10. Li, Z.; Li, M.; Zhang, Z.; Li, P.; Zang, Y.; Liu, X. Antibiotics in Aquatic Environments of China: A Review and Meta-Analysis. Ecotoxicol. Environ. Saf. 2020, 199, 110668. [Google Scholar] [CrossRef]
  11. Santos, L.H.; Araújo, A.N.; Fachini, A.; Pena, A.; Delerue-Matos, C.; Montenegro, M.C. Ecotoxicological Aspects Related to the Presence of Pharmaceuticals in the Aquatic Environment. J Hazard. Mater. 2010, 175, 45–95. [Google Scholar] [CrossRef] [PubMed] [Green Version]
  12. Yamashita, N.; Yasojima, M.; Nakada, N.; Miyajima, K.; Komori, K.; Suzuki, Y.; Tanaka, H. Effects of Antibacterial Agents, Levofloxacin and Clarithromycin, on Aquatic Organisms. Water Sci. Technol. 2006, 53, 65–72. [Google Scholar] [CrossRef] [PubMed] [Green Version]
  13. Hanna, N.; Sun, P.; Sun, Q.; Li, X.; Yang, X.; Ji, X.; Zou, H.; Ottoson, J.; Nilsson, L.E.; Berglund, B.; et al. Presence of Antibiotic Residues in Various Environmental Compartments of Shandong Province in Eastern China: Its Potential for Resistance Development and Ecological and Human Risk. Environ. Int. 2018, 114, 131–142. [Google Scholar] [CrossRef]
  14. Cao, M.; Feng, Y.; Zhang, Y.; Kang, W.; Lian, K.; Ai, L. Studies on the Metabolism and Degradation of Vancomycin in Simulated in Vitro and Aquatic Environment by UHPLC-Triple-TOF-MS/MS. Sci. Rep. 2018, 8, 1–13. [Google Scholar] [CrossRef] [PubMed]
  15. Bakhsheshian, J.; Dahdaleh, N.S.; Lam, S.K.; Savage, J.W.; Smith, Z.A. The Use of Vancomycin Powder in Modern Spine Surgery: Systematic Review and Meta-Analysis of the Clinical Evidence. World Neurosurg. 2015, 83, 816–823. [Google Scholar] [CrossRef]
  16. Zuccato, E.; Castiglioni, S.; Bagnati, R.; Melis, M.; Fanelli, R. Source, Occurrence and Fate of Antibiotics in the Italian Aquatic Environment. J. Hazard. Mater. 2010, 179, 1042–1048. [Google Scholar] [CrossRef] [PubMed]
  17. Havelkova, B.; Beklova, M.; Kovacova, V.; Hlavkova, D.; Pikula, J. Ecotoxicity of Selected Antibiotics for Organisms of Aquatic and Terrestrial Ecosystems. Neuroendocr. Lett. 2016, 37, 38–44. [Google Scholar]
  18. Chen, Y.; Xie, Y.; Yang, J.; Cao, H.; Zhang, Y. Reaction Mechanism and Metal Ion Transformation in Photocatalytic Ozonation of Phenol and Oxalic Acid with Ag+/TiO2. J. Environ. Sci. 2014, 26, 662–672. [Google Scholar] [CrossRef]
  19. Oturan, M.A.; Aaron, J.J. Advanced Oxidation Processes in Water/Wastewater Treatment: Principles and Applications. A Review. Crit. Rev. Environ. Sci. Technol. 2014, 44, 2577–2641. [Google Scholar] [CrossRef]
  20. Wang, J.; Zhuan, R. Degradation of Antibiotics by Advanced Oxidation Processes: An Overview. Sci. Total Environ. 2020, 701, 135023. [Google Scholar] [CrossRef] [PubMed]
  21. Nawrocki, J.; Kasprzyk-Hordern, B. The Efficiency and Mechanisms of Catalytic Ozonation. Appl. Catal. B Environ. 2010, 99, 27–42. [Google Scholar] [CrossRef]
  22. Anjali, R.; Shanthakumar, S. Insights on the Current Status of Occurrence and Removal of Antibiotics in Wastewater by Advanced Oxidation Processes. J. Environ. Manag. 2019, 246, 51–62. [Google Scholar] [CrossRef]
  23. Rekhate, C.V.; Srivastava, J.K. Recent Advances in Ozone-Based Advanced Oxidation Processes for Treatment of Wastewater- A Review. Chem. Eng. J. Adv. 2020, 3. [Google Scholar] [CrossRef]
  24. Boševski, I.; Kalčikova, G.; Cerkovnik, J.; Žgajnar Gotvajn, A. Ozone as a Pretreatment Method for Antibiotic Contaminated Wastewater and Sludge. Ozone Sci. Eng. 2020, 42, 128–135. [Google Scholar] [CrossRef]
  25. Mansour, S.; Knani, S.; Bensouilah, R.; Ksibi, Z. Wastewater Problems and Treatments. Curr. Trends Futur. Dev. Membr. Membr. Environ. Appl. 2019, 151–174. [Google Scholar] [CrossRef]
  26. Kıdak, R.; Doğan, Ş. Medium-High Frequency Ultrasound and Ozone Based Advanced Oxidation for Amoxicillin Removal in Water. Ultrason. Sonochem. 2018, 40, 131–139. [Google Scholar] [CrossRef]
  27. Marcelino, R.B.P.; Leão, M.M.D.; Lago, R.M.; Amorim, C.C. Multistage Ozone and Biological Treatment System for Real Wastewater Containing Antibiotics. J. Environ. Manag. 2017, 195, 110–116. [Google Scholar] [CrossRef]
  28. Nasuhoglu, D.; Rodayan, A.; Berk, D.; Yargeau, V. Removal of the Antibiotic Levofloxacin (LEVO) in Water by Ozonation and TiO2 Photocatalysis. Chem. Eng. J. 2012, 189–190, 41–48. [Google Scholar] [CrossRef] [Green Version]
  29. Dodd, M.C.; Buffle, M.O.; Von Gunten, U. Oxidation of Antibacterial Molecules by Aqueous Ozone: Moiety-Specific Reaction Kinetics and Application to Ozone-Based Wastewater Treatment. Environ. Sci. Technol. 2006, 40, 1969–1977. [Google Scholar] [CrossRef]
  30. Golet, E.M.; Alder, A.C.; Hartmann, A.; Ternes, T.A.; Giger, W. Trace Determination of Fluoroquinolone Antibacterial Agents in Urban Wastewater by Solid-Phase Extraction and Liquid Chromatography with Fluorescence Detection. Anal. Chem. 2001, 73, 3632–3638. [Google Scholar] [CrossRef]
  31. Andreozzi, R.; Canterino, M.; Marotta, R.; Paxeus, N. Antibiotic Removal from Wastewaters: The Ozonation of Amoxicillin. J. Hazard. Mater. 2005, 122, 243–250. [Google Scholar] [CrossRef] [PubMed]
  32. Žgajnar Gotvajn, A.; Derco, J.; Vrabeľ, M.; Kassai, A. Improvement of Biotreatability of Environmentally Persistent Antibiotic Tiamulin by O3 and O3/H2O2 Oxidation Processes. Environ. Technol. 2021, 1–10. [Google Scholar] [CrossRef] [PubMed]
  33. Oxidationtech. Fundementals of Ozone Solubility. Available online: https://www.oxidationtech.com/ozone/solubility/fundementals-of-ozone-solubility.html (accessed on 4 January 2021).
  34. Beltrán, F.J. Ozone Reaction Kinetics for Water and Wastewater System; Lewis Publishers: Boca Raton, FL, USA, 2004; ISBN 9781135463076. [Google Scholar]
  35. Mojiri, A.; Vakili, M.; Farraji, H.; Aziz, S.Q. Combined Ozone Oxidation Process and Adsorption Methods for the Removal of Acetaminophen and Amoxicillin from Aqueous Solution; Kinetic and Optimisation. Environ. Technol. Innov. 2019, 15, 100404. [Google Scholar] [CrossRef]
  36. De Witte, B.; Van Langenhove, H.; Hemelsoet, K.; Demeestere, K.; De Wispelaere, P.; Van Speybroeck, V.; Dewulf, J. Levofloxacin Ozonation in Water: Rate Determining Process Parameters and Reaction Pathway Elucidation. Chemosphere 2009, 76, 683–689. [Google Scholar] [CrossRef]
  37. Lofrano, G.; Carotenuto, M.; Uyguner-Demirel, C.S.; Vitagliano, A.; Siciliano, A.; Guida, M. An Integrated Chemical and Ecotoxicological Assessment for the Photocatalytic Degradation of Vancomycin. Environ. Technol. 2014, 35, 1234–1242. [Google Scholar] [CrossRef] [Green Version]
  38. Dimitrakopoulou, D.; Rethemiotaki, I.; Frontistis, Z.; Xekoukoulotakis, N.P.; Venieri, D.; Mantzavinos, D. Degradation, Mineralization and Antibiotic Inactivation of Amoxicillin by UV-A/TiO 2 Photocatalysis. J. Environ. Manag. 2012, 98, 168–174. [Google Scholar] [CrossRef] [PubMed]
  39. Kansal, S.K.; Kundu, P.; Sood, S.; Lamba, R.; Umar, A.; Mehta, S.K. Photocatalytic Degradation of the Antibiotic Levofloxacin Using Highly Crystalline TiO2 Nanoparticles. New J. Chem. 2014, 38, 3220–3226. [Google Scholar] [CrossRef]
  40. Kaur, M.; Umar, A.; Mehta, S.K.; Kansal, S.K. Reduced Graphene Oxide-CdS Heterostructure: An Efficient Fluorescent Probe for the Sensing of Ag(I) and Sunset Yellow and a Visible-Light Responsive Photocatalyst for the Degradation of Levofloxacin Drug in Aqueous Phase. Appl. Catal. B Environ. 2019, 245, 143–158. [Google Scholar] [CrossRef]
Figure 1. Structure of antibiotics used in the study: (A) Amoxicillin, (B) Levofloxacin and (C) Vancomycin substances [1,21,24].
Processes 09 00521 g001
Figure 2. Laboratory set-up of oxidation experiments: (A) scheme of experimental set-up, (B) catalytic ozonation (O3/Fe2+) at t = 0 min, (C) catalytic ozonation (O3/Fe2+) at t = 120 min.
Processes 09 00521 g002
Figure 3. Thermal stability of investigated Amoxicillin (AM), Levofloxacin (LV) and mixture (MIX) of AM, LV and VM determined by TOC (A) and COD (B) measurements.
Processes 09 00521 g003
Table 1. Design of the oxidation experiments.
Treatment MethodOzonation SettingBuffer SolutionpH at t = 0 min [/]Concentration of Fe2+ [mmol·L−1]UV
Direct ozonation (O3)Ø = 30 L·h−1
γ = 0.1 g·L−1
/<3.0//
Indirect ozonation (O3/pH9.5)Ø = 30 L·h−1
γ = 0.1 g·L−1
9.5 ± 0.2//
Catalytic ozonation (O3/Fe2+)Ø = 30 L·h−1
γ = 0.1 g·L−1
/<3.01.0/
Photocatalytic ozonation (O3/Fe2+/UV)Ø = 30 L·h−1
γ = 0.1 g·L−1
/<3.01.0
Ø—Gas inflow; γ—Mass concentration of ozone in gas;/—Not added; ✓—Added.
Table 2. TOC and COD [mg·L−1] of initial solutions of model antibiotics Amoxicillin, Levofloxacin, and their mixture with Vancomycin.
AntibioticConcentration [mg·L−1]TOC [mg·L−1]COD [mg·L−1]
Amoxicillin (AM)400209.4 ± 0.8598.5 ± 1.2
Levofloxacin (LV)400233.9 ± 0.7575.6 ± 26.4
The mixture (MIX)100 AM + 100 LV + 100 VM152.3 ± 1.4428.0 ± 32.0
Table 3. Treatment efficiencies [%] in ozonation (O3) experiments.
Treatment Efficiency [%]
TOCCOD
Temperature [°C]21 ± 140 ± 121 ± 140 ± 1
Phase of ozonation1st2nd1st2nd1st2nd1st2nd
Amoxicillin (AM)9.8 ± 1.227.7 ± 5.315.740.838.3 ± 1.660.6 ± 3.149.768.5
Levofloxacin (LV)16.2 ± 1.638.5 ± 2.510.956.442.7 ± 12.767.2 ± 3.641.975.1
The mixture (MIX)19.7 ± 0.236.4 ± 3.432.060.448.2 ± 0.067.2 ± 1.838.075.7
Table 4. Rate constants [min−1] for ozonation.
Rate Constants [min−1]
TOCCOD
Temperature [°C]21 ± 140 ± 121 ± 140 ± 1
k1k2k1k2k1k2k1k2
Amoxicillin (AM)0.01250.00150.01170.00310.03520.00330.04620.0041
Levofloxacin (LV)0.01860.00170.00800.00610.04740.00360.03360.0072
The mixture (MIX)0.01630.00160.02400.00460.04470.00190.03240.0077
Table 5. Calculated frequency factors A [min−1] and activation energy Ea [J·mol−1] for ozonation.
Arrhenius Parameters
TOCCOD
Phase of Ozonation1st2nd1st2nd
A
[min−1]
Ea
[J·mol−1]
A
[min−1]
Ea
[J·mol−1]
A
[min−1]
Ea
[J·mol−1]
A
[min−1]
Ea
[J·mol−1]
Amoxicillin (AM)0/234.329,2313.1110,9500.128741
Levofloxacin (LV)0/2.35 × 10651,4474.87 × 101278,86232827,911
The mixture (MIX)2.84 × 1017108,2971.71 × 1021135,2420/1.95 × 10756,348
/—Not calculated.
Table 6. Treatment efficiencies [%] for indirect ozonation (O3/pH9.5).
Treatment Efficiency [%]
TOCCOD
Temperature [°C]21 ± 140 ± 121 ± 140 ± 1
Phase of ozonation1st2nd1st2nd1st2nd1st2nd
Amoxicillin (AM)21.1 ± 3.449.5 ± 4.736.673.556.2 ± 3.586.6 ± 1.369.291.9
Levofloxacin (LV)23.6 ± 0.760.8 ± 8.631.478.153.3 ± 3.179.5 ± 6.160.492.1
The mixture (MIX)27.7 ± 7.151.6 ± 4.233.773.655.4 ± 13.579.6 ± 1.656.293.4
Table 7. Rate constants [min−1] for indirect ozonation (O3/pH9.5).
Rate Constants [min−1]
TOCCOD
Temperature [°C]21 ± 140 ± 121 ± 140 ± 1
k1k2k1k2k1k2k1k2
Amoxicillin (AM)0.01870.00350.03020.00820.05620.00960.08200.0097
Levofloxacin (LV)0.01820.00470.02600.01010.05170.00420.06050.0070
The mixture (MIX)0.01940.00280.02630.00800.04880.00430.05280.0142
Table 8. Calculated frequency factors A [min−1] and activation energy Ea [J·mol−1] for indirect ozonation (O3/pH9.5).
Arrhenius Parameters
TOCCOD
Phase of Ozonation1st2nd1st2nd
A
[min−1]
Ea
[J·mol−1]
A
[min−1]
Ea
[J·mol−1]
A
[min−1]
Ea
[J·mol−1]
A
[min−1]
Ea
[J·mol−1]
Amoxicillin (AM)50.2419,301431734,28228.3615,2130.011417.3
Levofloxacin (LV)6.4814,362139730,8040.69632918.9620,569
The mixture (MIX)2.9212,25390,79042,2730.1831721.5·10648,104
Table 9. Treatment efficiencies [%] for catalytic ozonation with Fe2+ (O3/Fe2+).
Treatment Efficiency [%]
TOCCOD
Temperature [°C]21 ± 140 ± 121 ± 140 ± 1
Phase of ozonation1st2nd1st2nd1st2nd1st2nd
Amoxicillin (AM)17.0 ± 3.346.6 ± 14.745.182.747.6 ± 15.985.8 ± 5.745.182.8
Levofloxacin (LV)7.0 ± 1.850.7 ± 1.214.560.945.1 ± 7.481.9 ± 0.344.787.6
The mixture (MIX)15.5 ± 6.346.7 ± 1.130.162.851.4 ± 19.279.9 ± 1.154.777.4
Table 10. Rate constants [min−1] for catalytic ozonation with Fe2+ (O3/Fe2+).
Rate Constants [min−1]
TOCCOD
Temperature [°C]21 ± 140 ± 121 ± 140 ± 1
k1k2k1k2k1k2k1k2
Amoxicillin (AM)0.02110.00260.02930.00280.05340.00920.03850.0063
Levofloxacin (LV)0.01810.00380.01130.00550.04370.00890.03990.0086
The mixture (MIX)0.02280.00320.02310.00470.06050.00410.05140.0027
Table 11. Calculated frequency factors A [min−1] and activation energy Ea [J·mol−1] for catalytic ozonation with Fe2+ (O3/Fe2+).
Arrhenius Parameters
TOCCOD
Phase of Ozonation1st2nd1st2nd
A
[min−1]
Ea
[J·mol−1]
A
[min−1]
Ea
[J·mol−1]
A
[min−1]
Ea
[J·mol−1]
A
[min−1]
Ea
[J·mol−1]
Amoxicillin (AM)4.7113,2200.008829840/1.80·10−5/
Levofloxacin (LV)0/1.6814,8890.01/0.005/
The mixture (MIX)0.035261.8015,4790/4.21·10−6/
/—Not calculated.
Table 12. Treatment efficiencies [%] for catalytic ozonation with Fe2+ and UV (O3/Fe2+/UV).
Treatment Efficiency [%]
TOCCOD
Temperature [°C]21 ± 140 ± 121 ± 140 ± 1
Phase of ozonation1st2nd1st2nd1st2nd1st2nd
Amoxicillin (AM)23.4 ± 0.060.7 ± 8.451.584.657.3 ± 0.485.4 ± 3.651.584.6
Levofloxacin (LV)12.2 ± 4.859.2 ± 5.211.458.039.3 ± 5.186.0 ± 6.264.387.5
The mixture (MIX)13.0 ± 7.164.9 ± 0.68.171.528.3 ± 8.585.3 ± 2.534.589.8
Table 13. Rate constants [min−1] for photocatalytic ozonation with Fe2+ and UV (O3/Fe2+/UV).
Rate Constants [min−1]
TOCCOD
Temperature [°C]21 ± 140 ± 121 ± 140 ± 1
k1k2k1k2k1k2k1k2
Amoxicillin (AM)0.01760.00540.01460.00250.05730.00850.04870.0068
Levofloxacin (LV)0.00560.00840.00900.00570.03280.01160.06790.0099
The mixture (MIX)0.00540.00690.00520.00840.03260.00740.02820.0135
Table 14. Calculated frequency factors A [min−1] and activation energy Ea [J·mol−1] for photocatalytic ozonation with Fe2+ and UV (O3/Fe2+/UV).
Arrhenius Parameters
TOCCOD
Phase of Ozonation1st2nd1st2nd
A
[min−1]
Ea
[J·mol−1]
A
[min−1]
Ea
[J·mol−1]
A
[min−1]
Ea
[J·mol−1]
A
[min−1]
Ea
[J·mol−1]
Amoxicillin (AM)0/1.67 × 10−8/0/0.000215/
Levofloxacin (LV)13.8919,1051.41 × 10−5/526629,2980.00085/
The mixture (MIX)0/0.1879210/148.124,209
/—Not calculated.
Publisher’s Note: MDPI stays neutral with regard to jurisdictional claims in published maps and institutional affiliations.

