
Analysis of the Surface Subsidence Induced by Mining Near-Surface Thick Lead-Zinc Deposit Based on Numerical Simulation


Geomechanics Research Center, Northeastern University, Shenyang 110819, China
*
Authors to whom correspondence should be addressed.
Processes 2021, 9(4), 717; https://0-doi-org.brum.beds.ac.uk/10.3390/pr9040717
Submission received: 19 March 2021
/
Revised: 14 April 2021
/
Accepted: 14 April 2021
/
Published: 19 April 2021
(This article belongs to the Special Issue Numerical Modeling in Civil and Mining Geotechnical Engineering)
Abstract
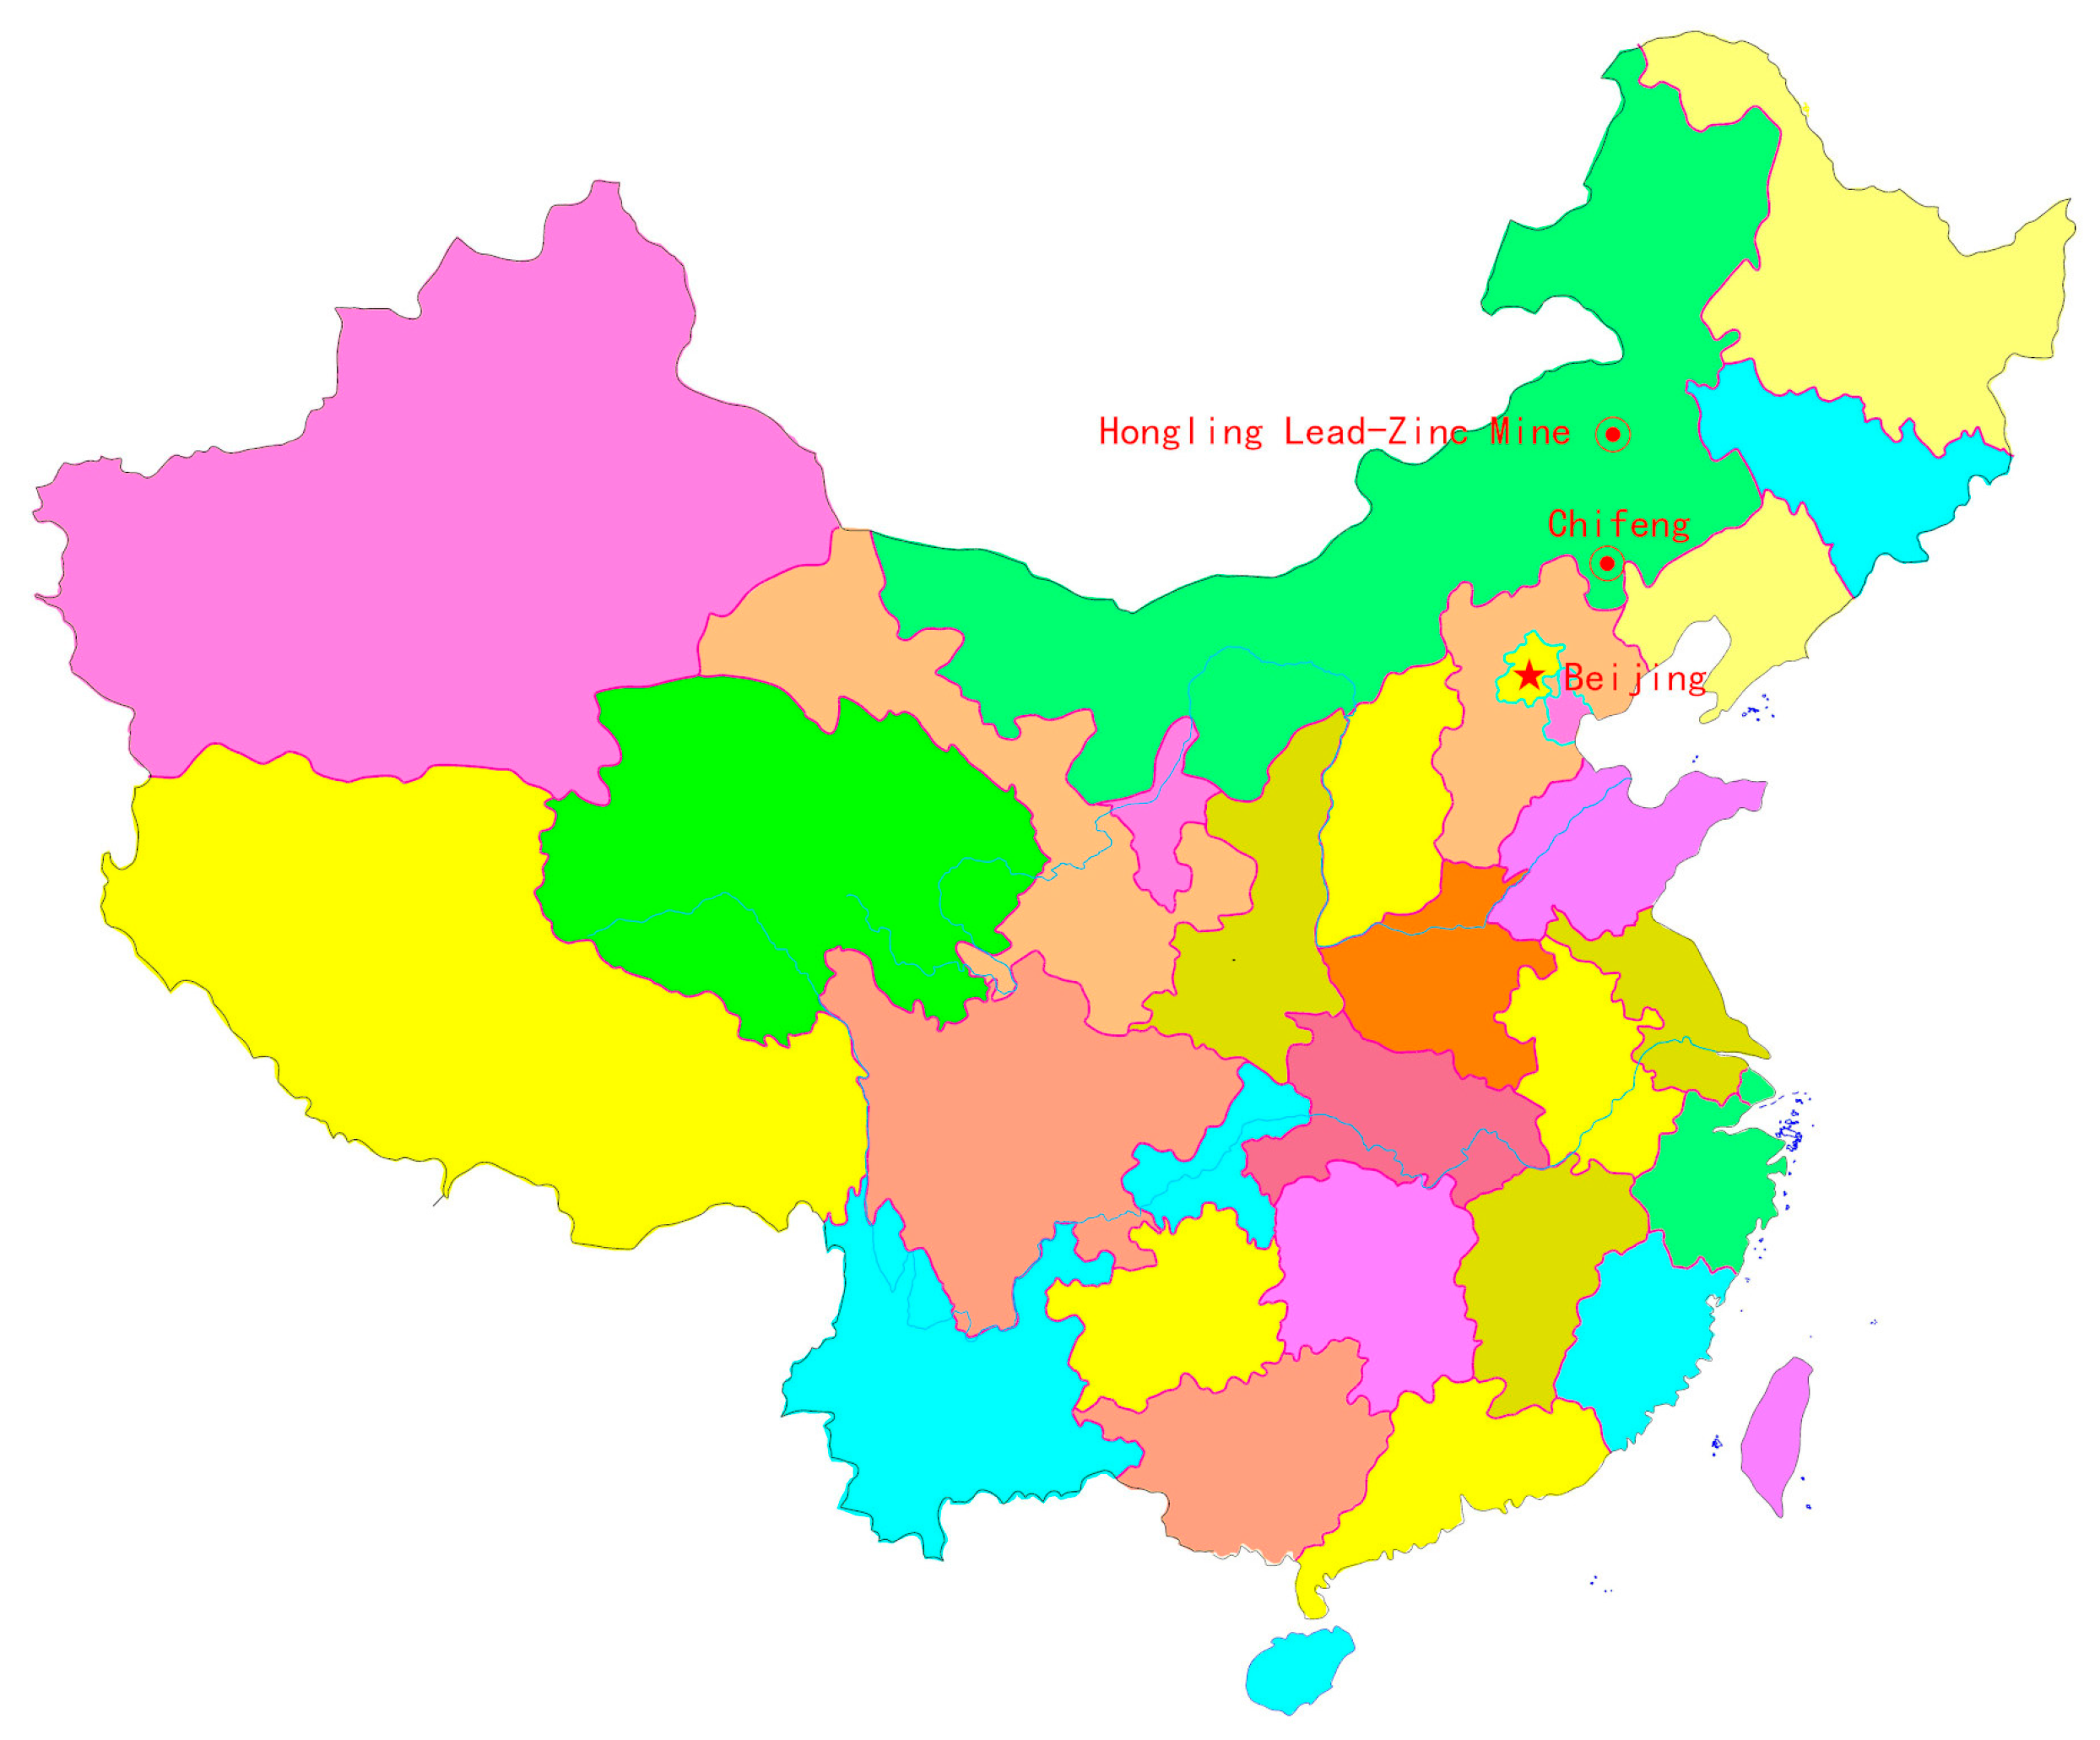
:This paper describes a case study of surface subsidence in the Hongling Lead-Zinc Mine. Hongling Lead-Zinc Mine is located in Inner Mongolia, China, about 240 km away from the border between China and Mongolia. There is a batch of outcrops of the near-surface thick steep-dip metamorphic orebody. The large-scale surface subsidence induced by underground excavation has brought some impact on the safety of herdsmen and their daily husbandry activities nearby. The requirements of reclamation for subsidence areas in the relevant laws and regulations, raise enormous pressure and risk on safe and economic operation. In this paper, a 3D numerical model of this mine was built by 3DMine and FLAC3D to analyse the excavation procedure and mechanism. The results of the simulation were in good agreement with the field subsidence data collected by satellites and unmanned aerial vehicles from 2009 to 2019. The analysis showed that the current mining method—an integrated underground method of stoping and caving—accelerated the surface subsidence, and some measures of monitoring, controlling and management were expected to take in order to improve economic and ecological benefits.
1. Introduction
Mining subsidence is the continuous deformation, and discontinuous failure of strata and surface by the destroy of in-situ stress field induced by the underground excavation [1]. The first acts and laws related to subsidence were published in Belgium between the fifteenth and sixteenth century [2]. Plenty of comprehensive researches on theory and control technology of mining subsidence have been conducted in Soviet Union, Poland, Germany, Australia, Britain, Canada, Japan and the United States, and there are a great number of results and findings on the excavation under buildings, railway, water body and above confined water [3,4,5]. In the long term, many scholars try to accurately calculate the subsidence displacement induced by underground mining. In 1838, Doris first put forward the “vertical line theory” of surface subsidence. Twenty years later, this theory was developed into “normal line theory” by Gonot, which was revised by Dumon to the calculation model of subsidence w = m × cosα [6]. In Germany, “bisection theory” and “natural slope theory” were proposed by Jlcinsky (1876) and Oesterr (1882), respectively [7,8]. Besides these theories, some other early studies including Fayol’s (1885) [9] “circular arch theory” and Hausse’s (1885–1897) “bisection theory”, analyzed the relationship between deformation and movement of overburden and surface subsidence, and established several geometric theoretical models [10]. In 1903, Halban deduced that the surface strain is inversely proportional to the radius of curvature [1]. Schimizx (1923), Keinhost (1925) and Bals (1932) studied the area of mining subsidence and formed the concept of influence function [11]. In 1947, C. Γ. Aвepшин’s monograph “Strata Movement in Underground Coal Mining”, built the differential relationship between the vertical and horizontal directions of the surface movement vector, pointed out that the subsidence section equation is in exponential form, and introduced the famous theory that the horizontal movement is inversely proportional to the ground tilt [12]. However, the theory complicated surface movement calculation formulas were of difficulty to be applied to field analysis. J. Litwaniszyn applied discontinuous medium mechanics to study the relation of strata and surface movement and introduced the stochastic medium theory, which was later developed into the widely used probability integral method [2,13,14]. Smolarski deduced the surface movement function of a stochastic medium theory under the condition of inclined coal seam mining from the viewpoint of medium symmetry [15]. Salamon combined the influence function with continuum mechanics and applied the elastic theory to put forward the surface element principle, which presented the foundation of boundary element method [16,17]. Berry derived the surface movement and deformation formula in isotropic plane, transversely isotropic plane and three-dimensional conditions based on elastic theory [18,19,20,21].
With the continuous and rapid development of computer and information technology, a variety of numerical methods and artificial intelligence algorithms have been applied to the study of surface subsidence [22,23,24]. The finite difference software—FLAC3D—developed by Itasca Inc. is widely used for the analysis of mining induced surface subsidence [25,26]. Due to the complexity of model built in FLAC3D, the combination of SURPAC and FLAC3D is popular in building the numerical models of mines [27]. Additionally, 3DMine software can be used to establish the 3D geological model of orebody which can be converted into the file containing blocky and nodes by Midas, and then the Midas file can be imported into FLAC3D model through interface program [28,29]. In this paper, the 3Dmine, Midas second method was used to build the 3D numerical model, and the field mining procedure and sequence were simulated by FLAC3D, which is employed to analyze the surface subsidence in Hongling Lead-Zinc Mine.
2. Motivation and the Study Objective
If the large-scale surface subsidence suddenly collapses in mine void, high ground pressure can be induced and cause the permanent loss and dilution of ore, even the mine is closed; strong airwave can form air blast to threaten the safety of deep underground mining, more enlarge the scope of surface subsidence. The surface is grazed by nearby herders. In order to ensure the safety of herdsmen and the normal operation of the mine, it is necessary to study the mine collapse. Thus, it was of great importance for decreasing the risk of large-scale collapse by analyzing and predicting the characteristics of surface subsidence induced by underground mining.
3. Engineering Background
3.1. Geological Setting
Hongling Lead-Zinc Mine is located in Chifeng City (Figure 1), Inner Mongolia, China, and 240 km south away from the border between China and Mongolia, with a mining area of 3.394 km2. Hongling Lead-Zinc Mine is a skarn type polymetallic deposits dominated by lead and zinc, at the north slope of the watershed in the southwest of Greater Khingan, with the surface elevation between +976 m and +1220 m. Hongling Lead-Zinc Mine has a production capacity of 5000 t/day. The surface boundary of deposit is in 17# exploratory line, and its deep boundary of deposit is in 13# exploratory line divided by the feldspar porphyry belt. The eastern side of the feldspar porphyry belt is named 1# mineralization zone, and the deposit is divided two veins by invasive marble in the west side of the feldspar porphyry belt, other northwestern deposit is called 2# mineralization zone (Figure 2). The 1# mineralization zone is 1350 m long along the strike, with an average width of 10 m, and its strikes 55–59° and has a NW dip of 65–85°, and there is a batch of outcrops vertical to the surface. The 2# mineralization zone is 975 m long along the strike, with an average width of 7 m.
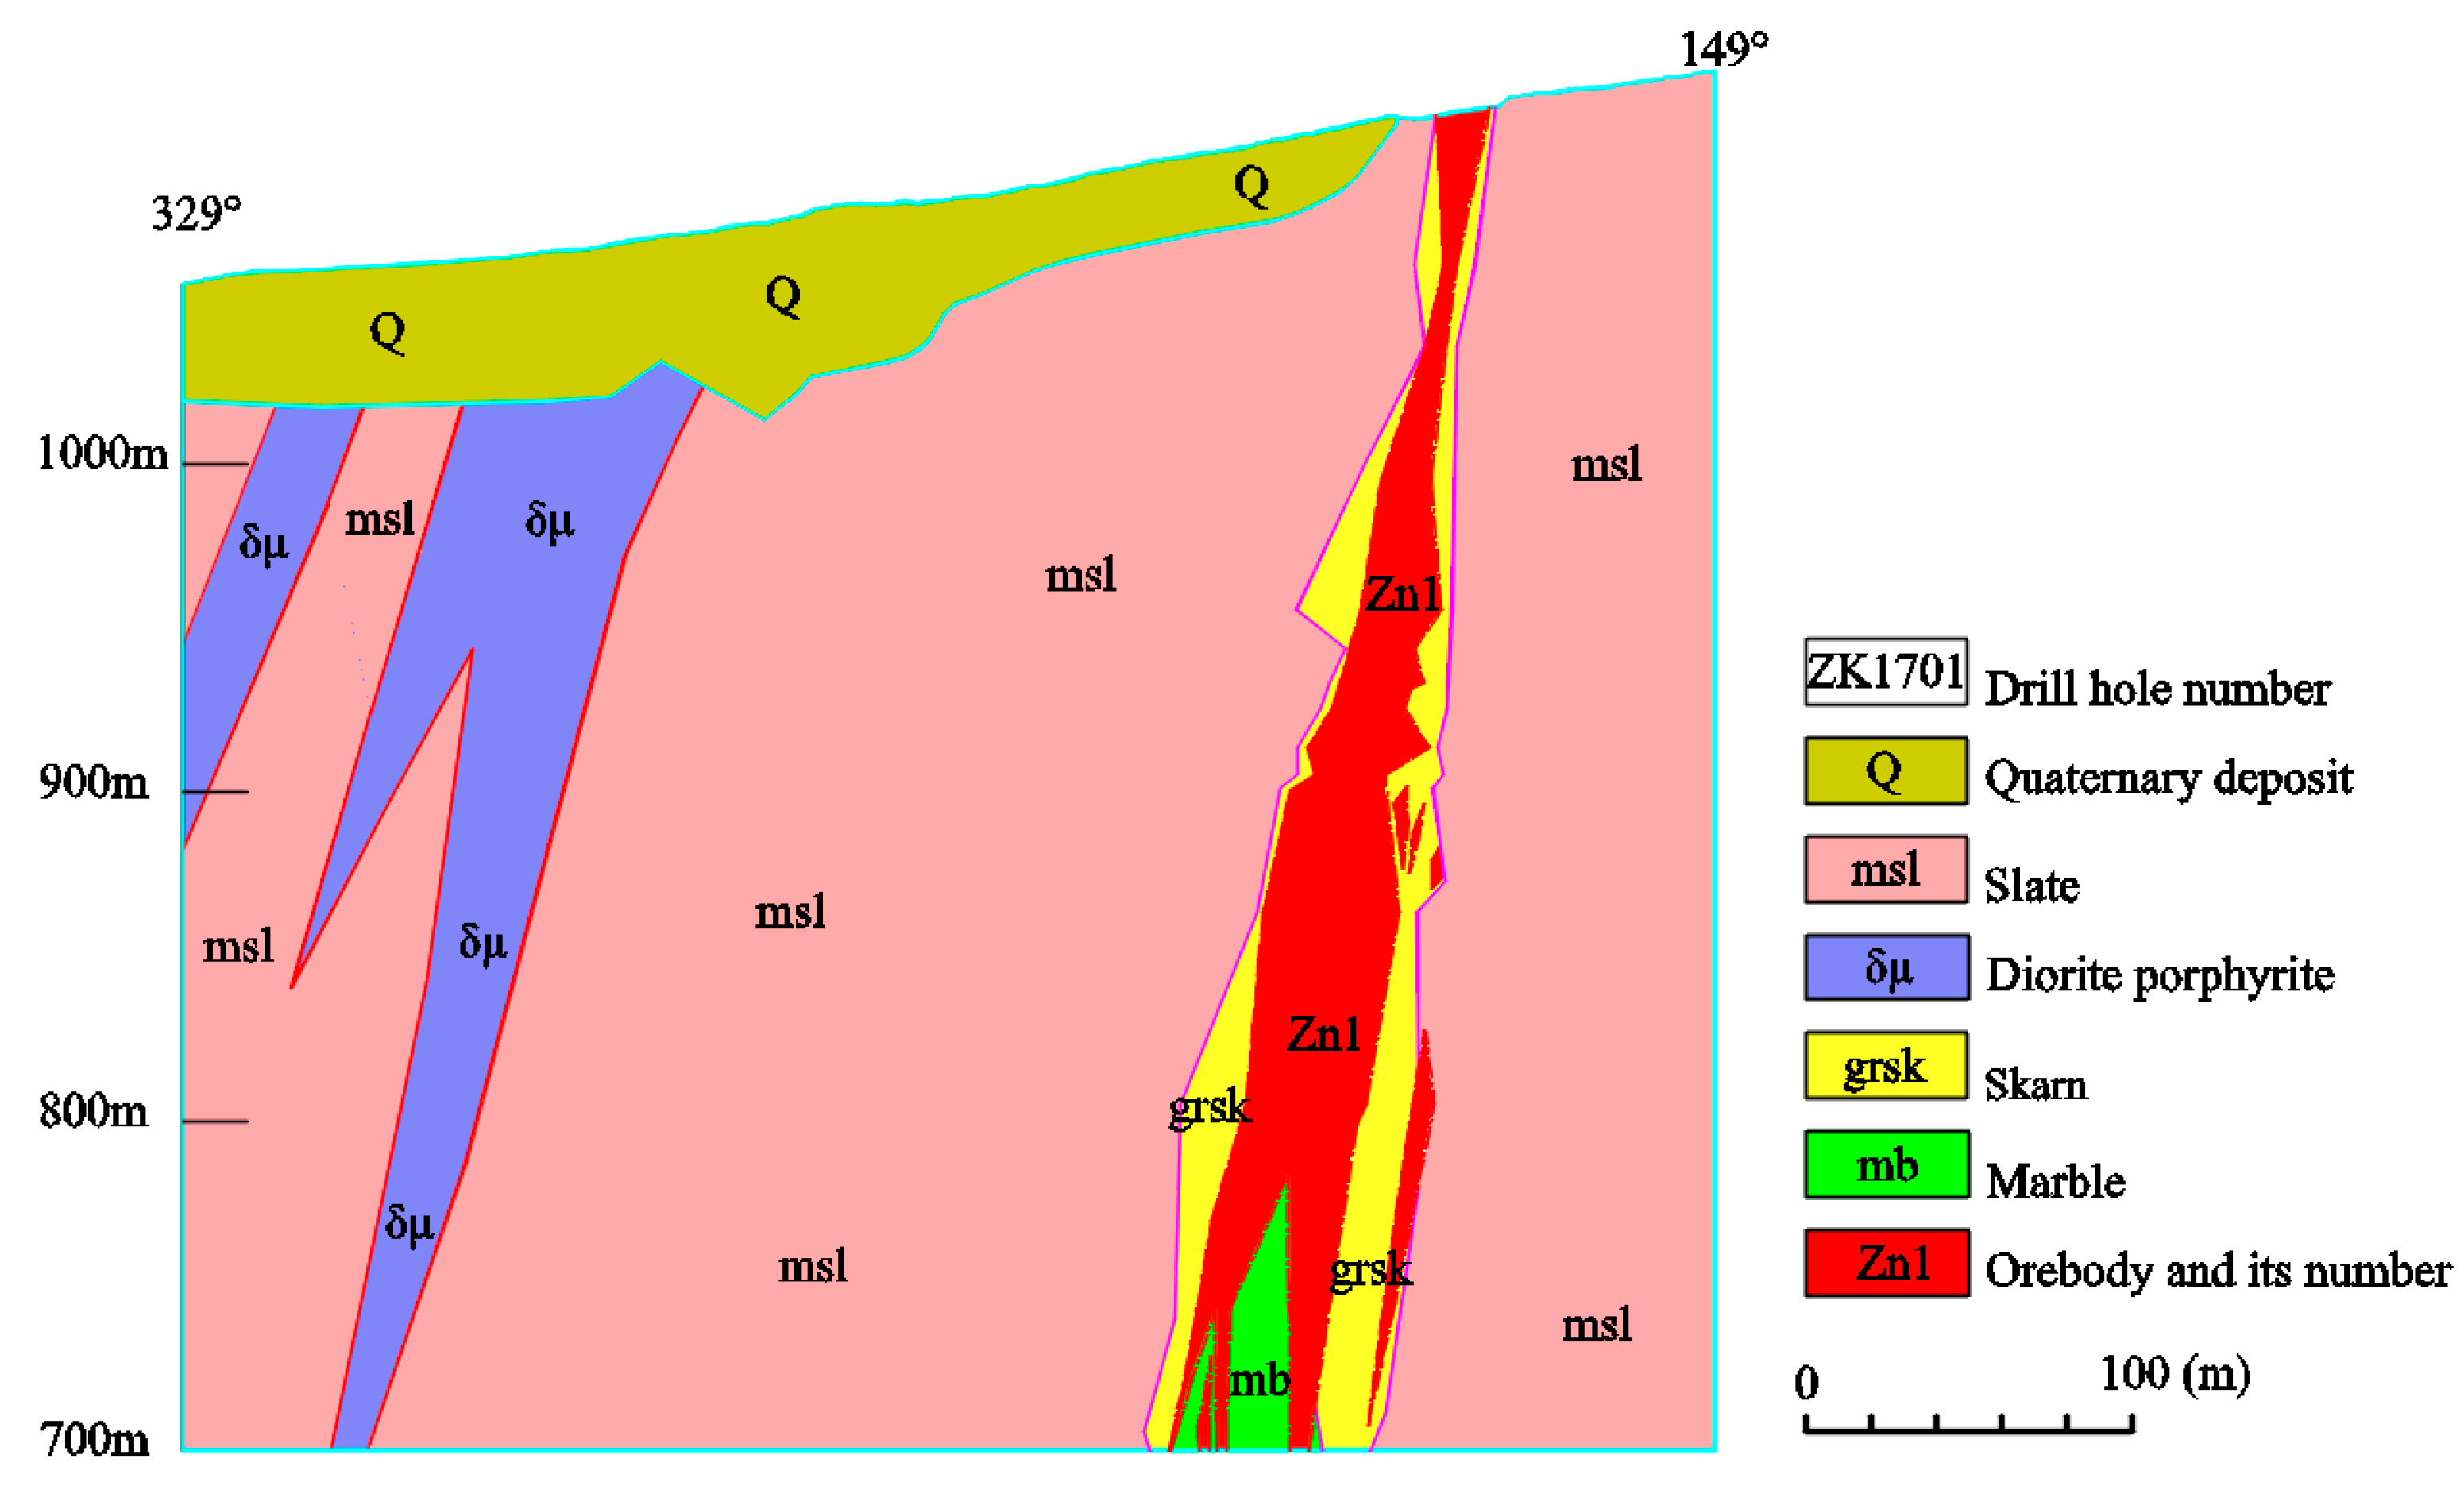
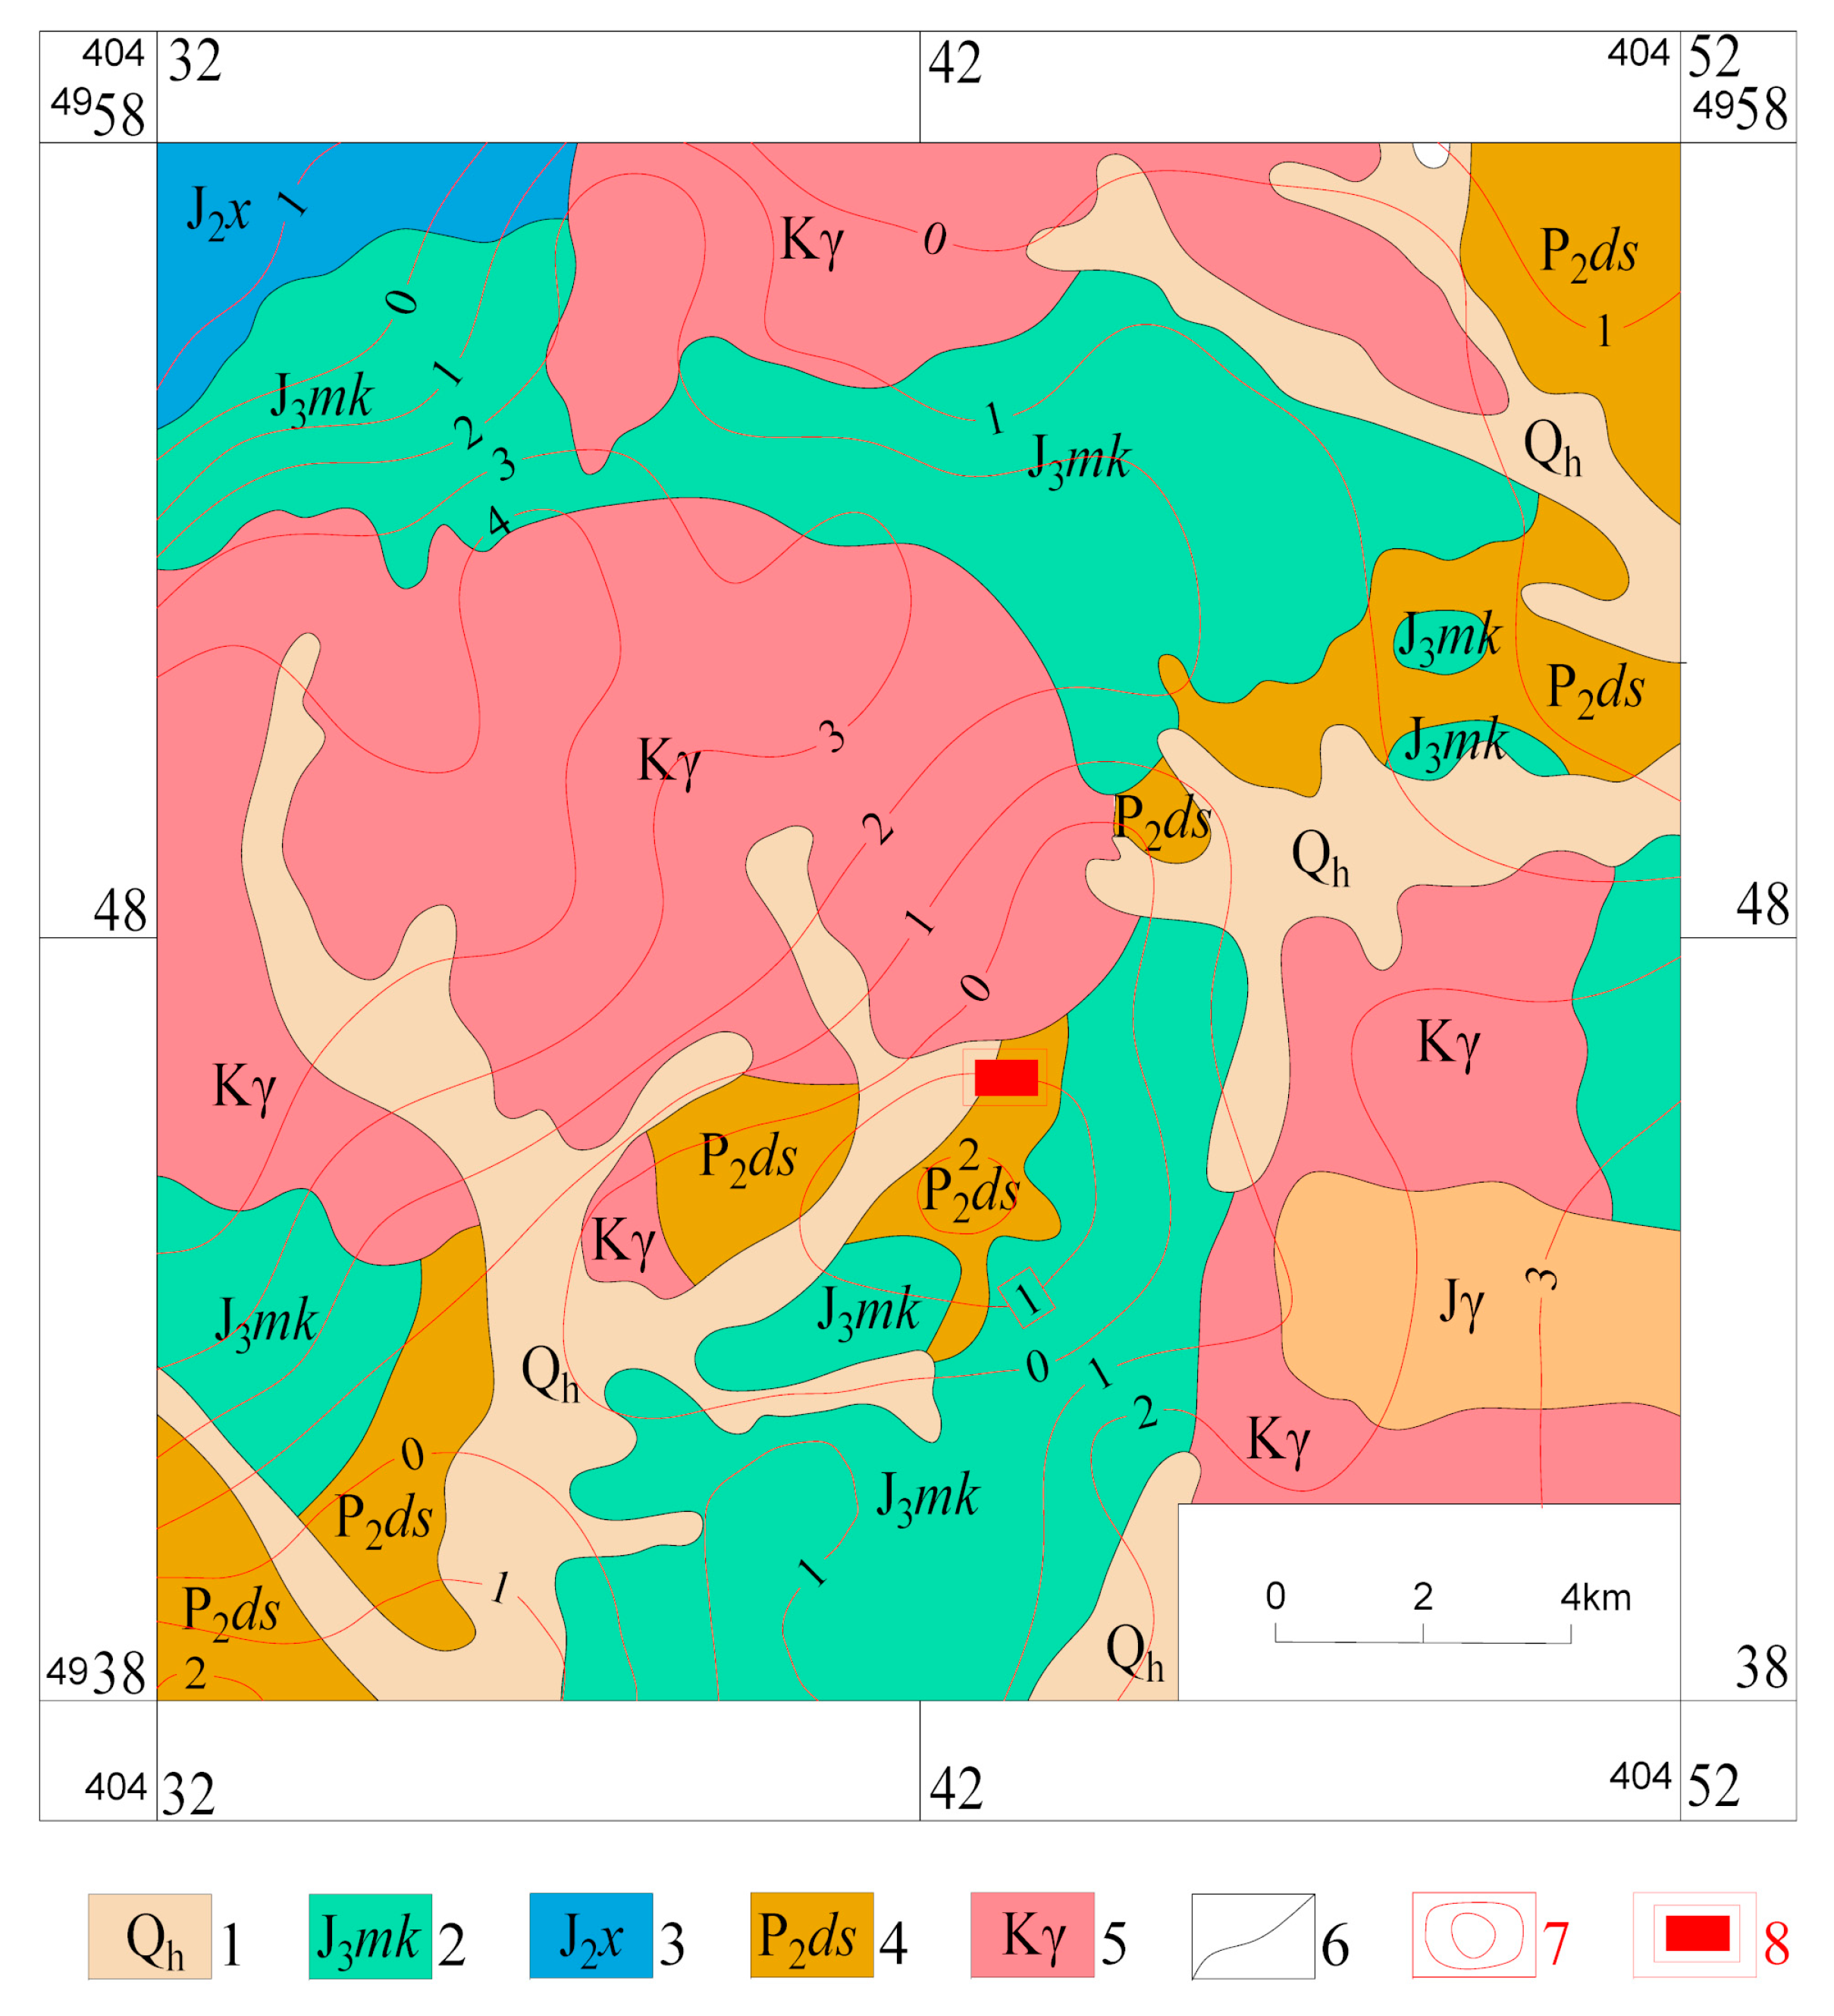
As illustrated in the cross-section of 17# exploratory line (Figure 3), the mineralization zone occurs in the skarn belt, and the bed rock is skarn with small horizontal thickness. The lithological units of the mineralization zone include slate, marble and skarn. The surrounding rock is the argillite, siltstone, metasandstone and marble. The red area shown in Figure 3 is the ore body that will be mined. It is clear that mining activity starts at the surface. The gravity anomaly map of Hongling Lead-Zinc Mine is shown in Figure 4.
3.2. Mining Method
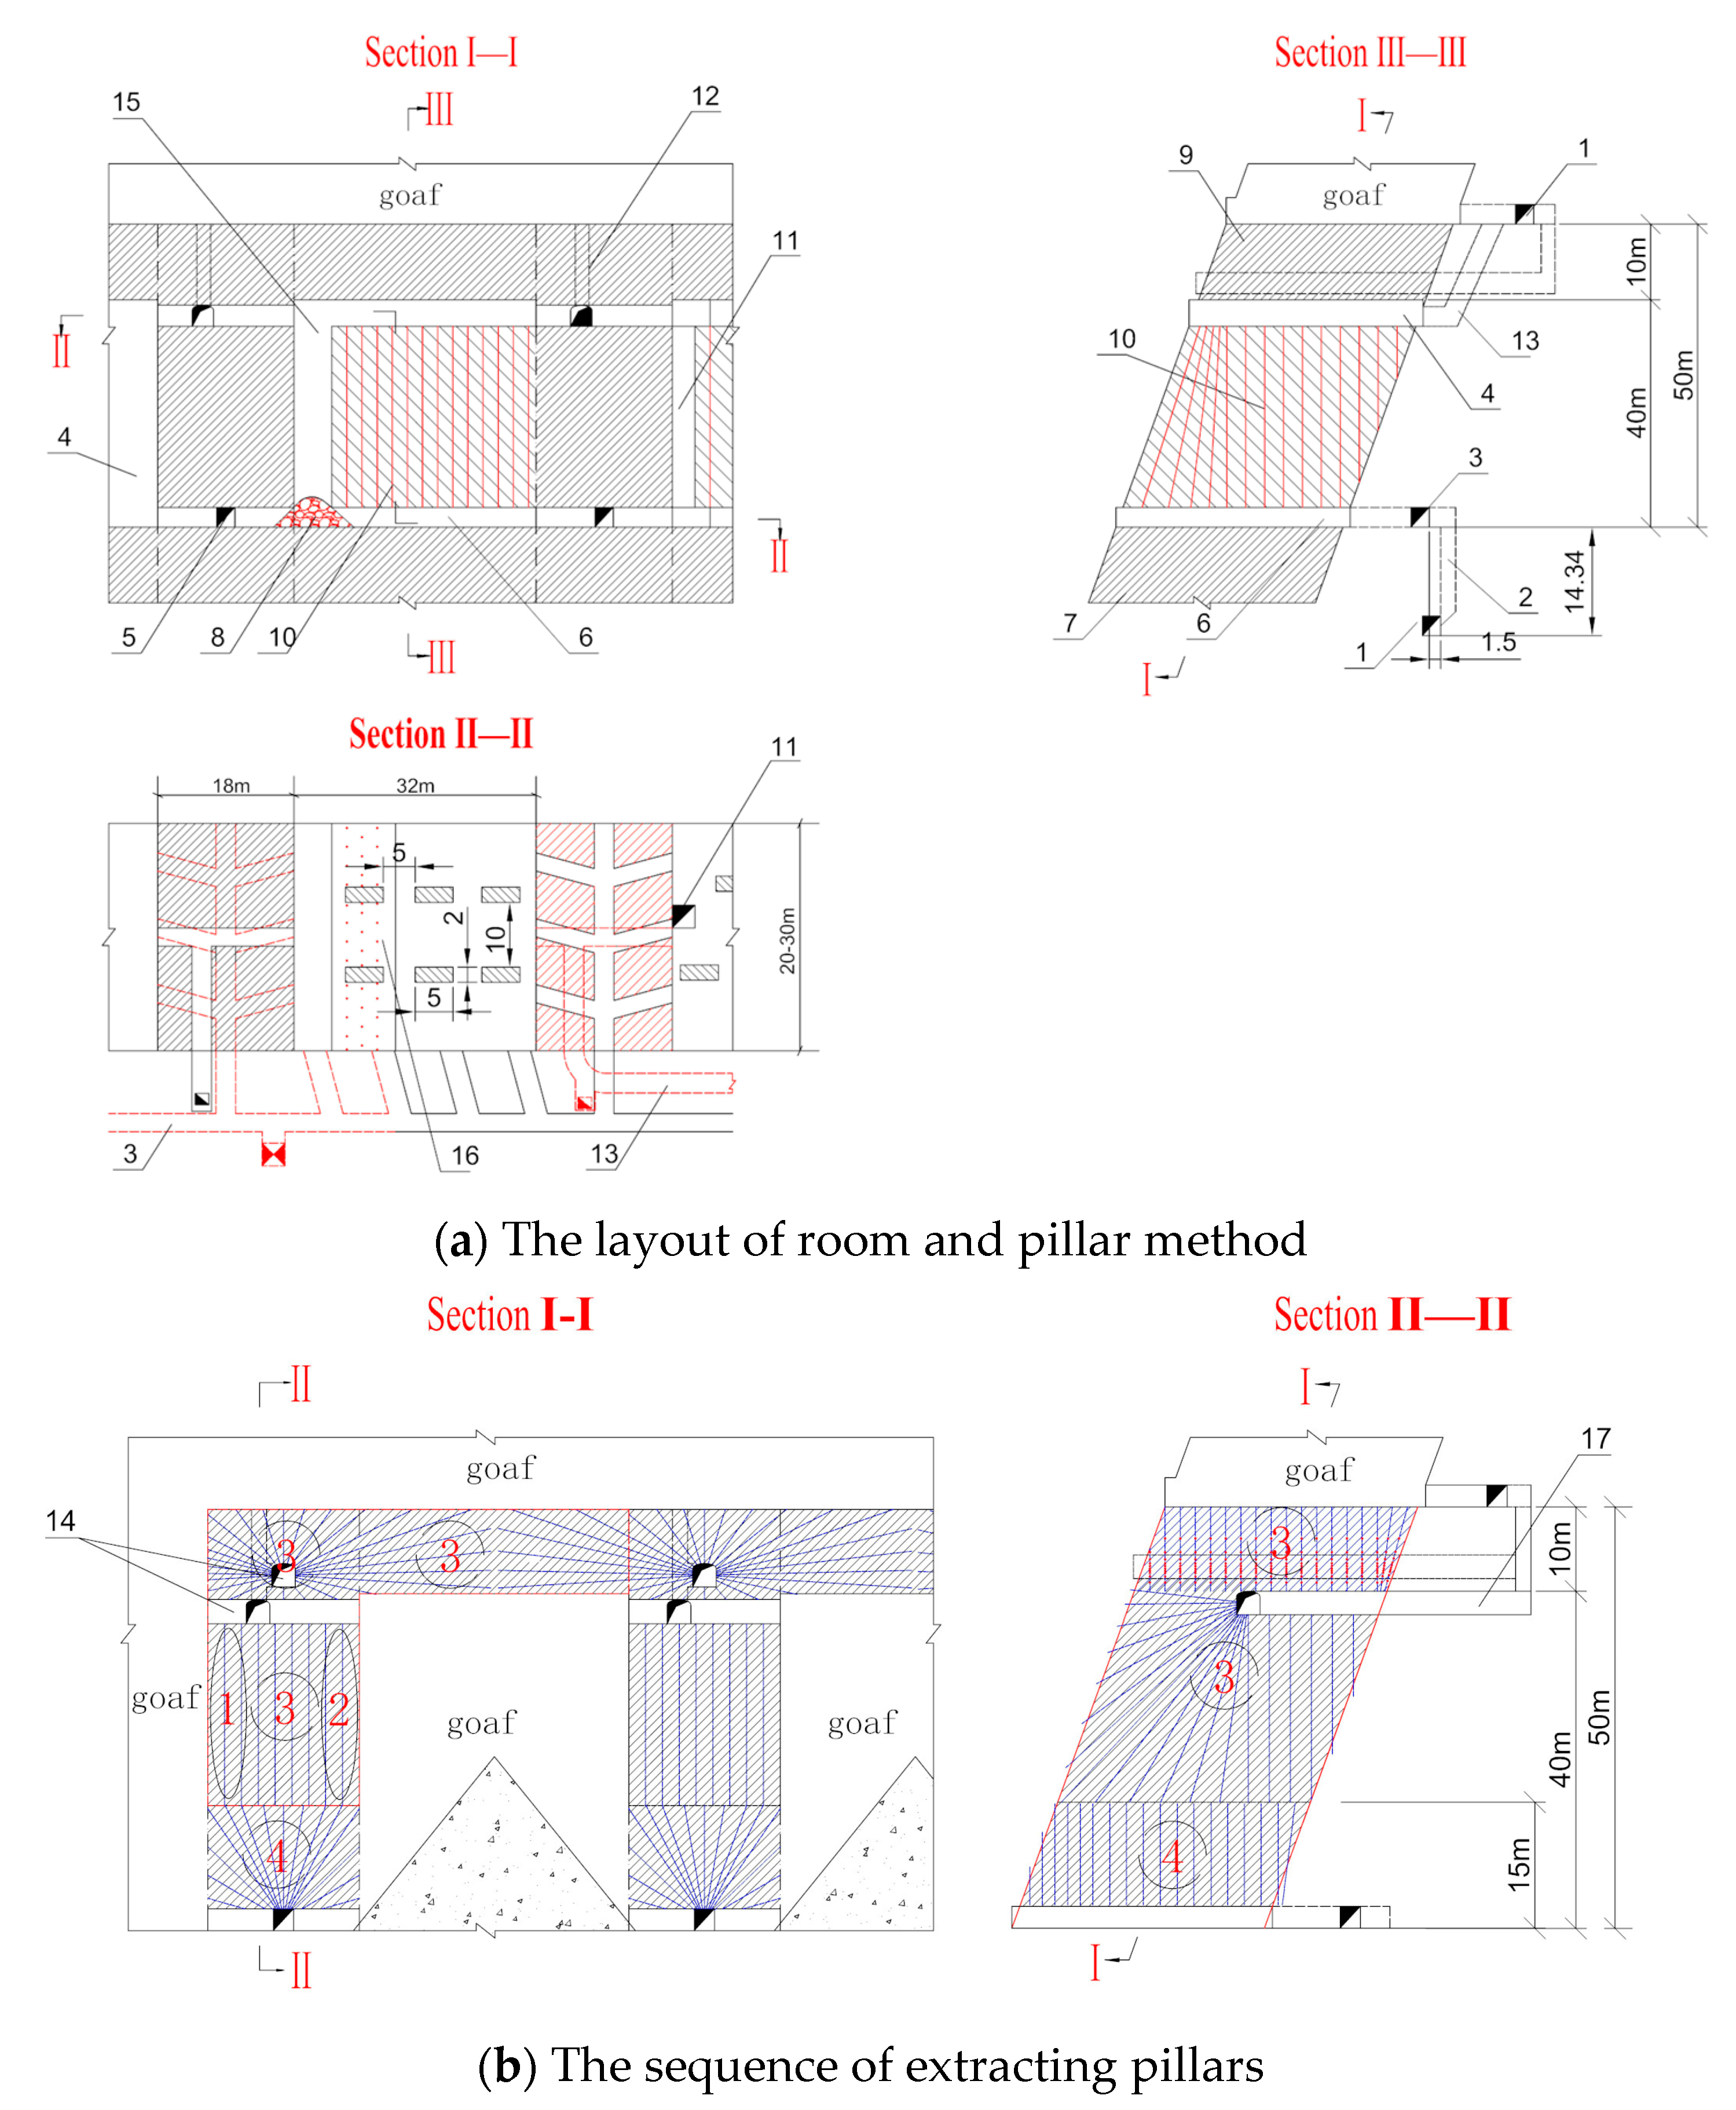
The ore is mined depending on the thickness of the ore body. In the Hongling Lead-zinc Mine, the room and pillar method has been adopted, and the typical design of mining method is shown in Figure 5a. The level interval of this mine is 50 m, the height of one stope is 40 m with 10 m thickness crown pillar. The length of one stope can be determined according to the horizontal thickness of the orebody. When the horizontal thickness of the orebody is less than 30 m, and the stope layout is along the strike of orebody, the length of one stope is 32 m, and the span of one stope is the thickness of the deposit. When the horizontal thickness of the orebody is more than 30 m, and the stope layout is perpendicular to the strike of the orebody; the length of one stope is the horizontal thickness of the orebody, and the span of one stope is 30 m. The width of the barrier pillar is 18 m. The square panel pillar is of a 5 m × 2 m cross-section, and its pattern is 5 m × 10 m in long and wide. Stoping is carried out using 175 mm diameter long hole in room; the caving method is adopted to extract the pillar, and the blasting sequence is illustrated in Figure 5b. There is no backfill for mined-out stopes.
3.3. Current Surface Subsidence
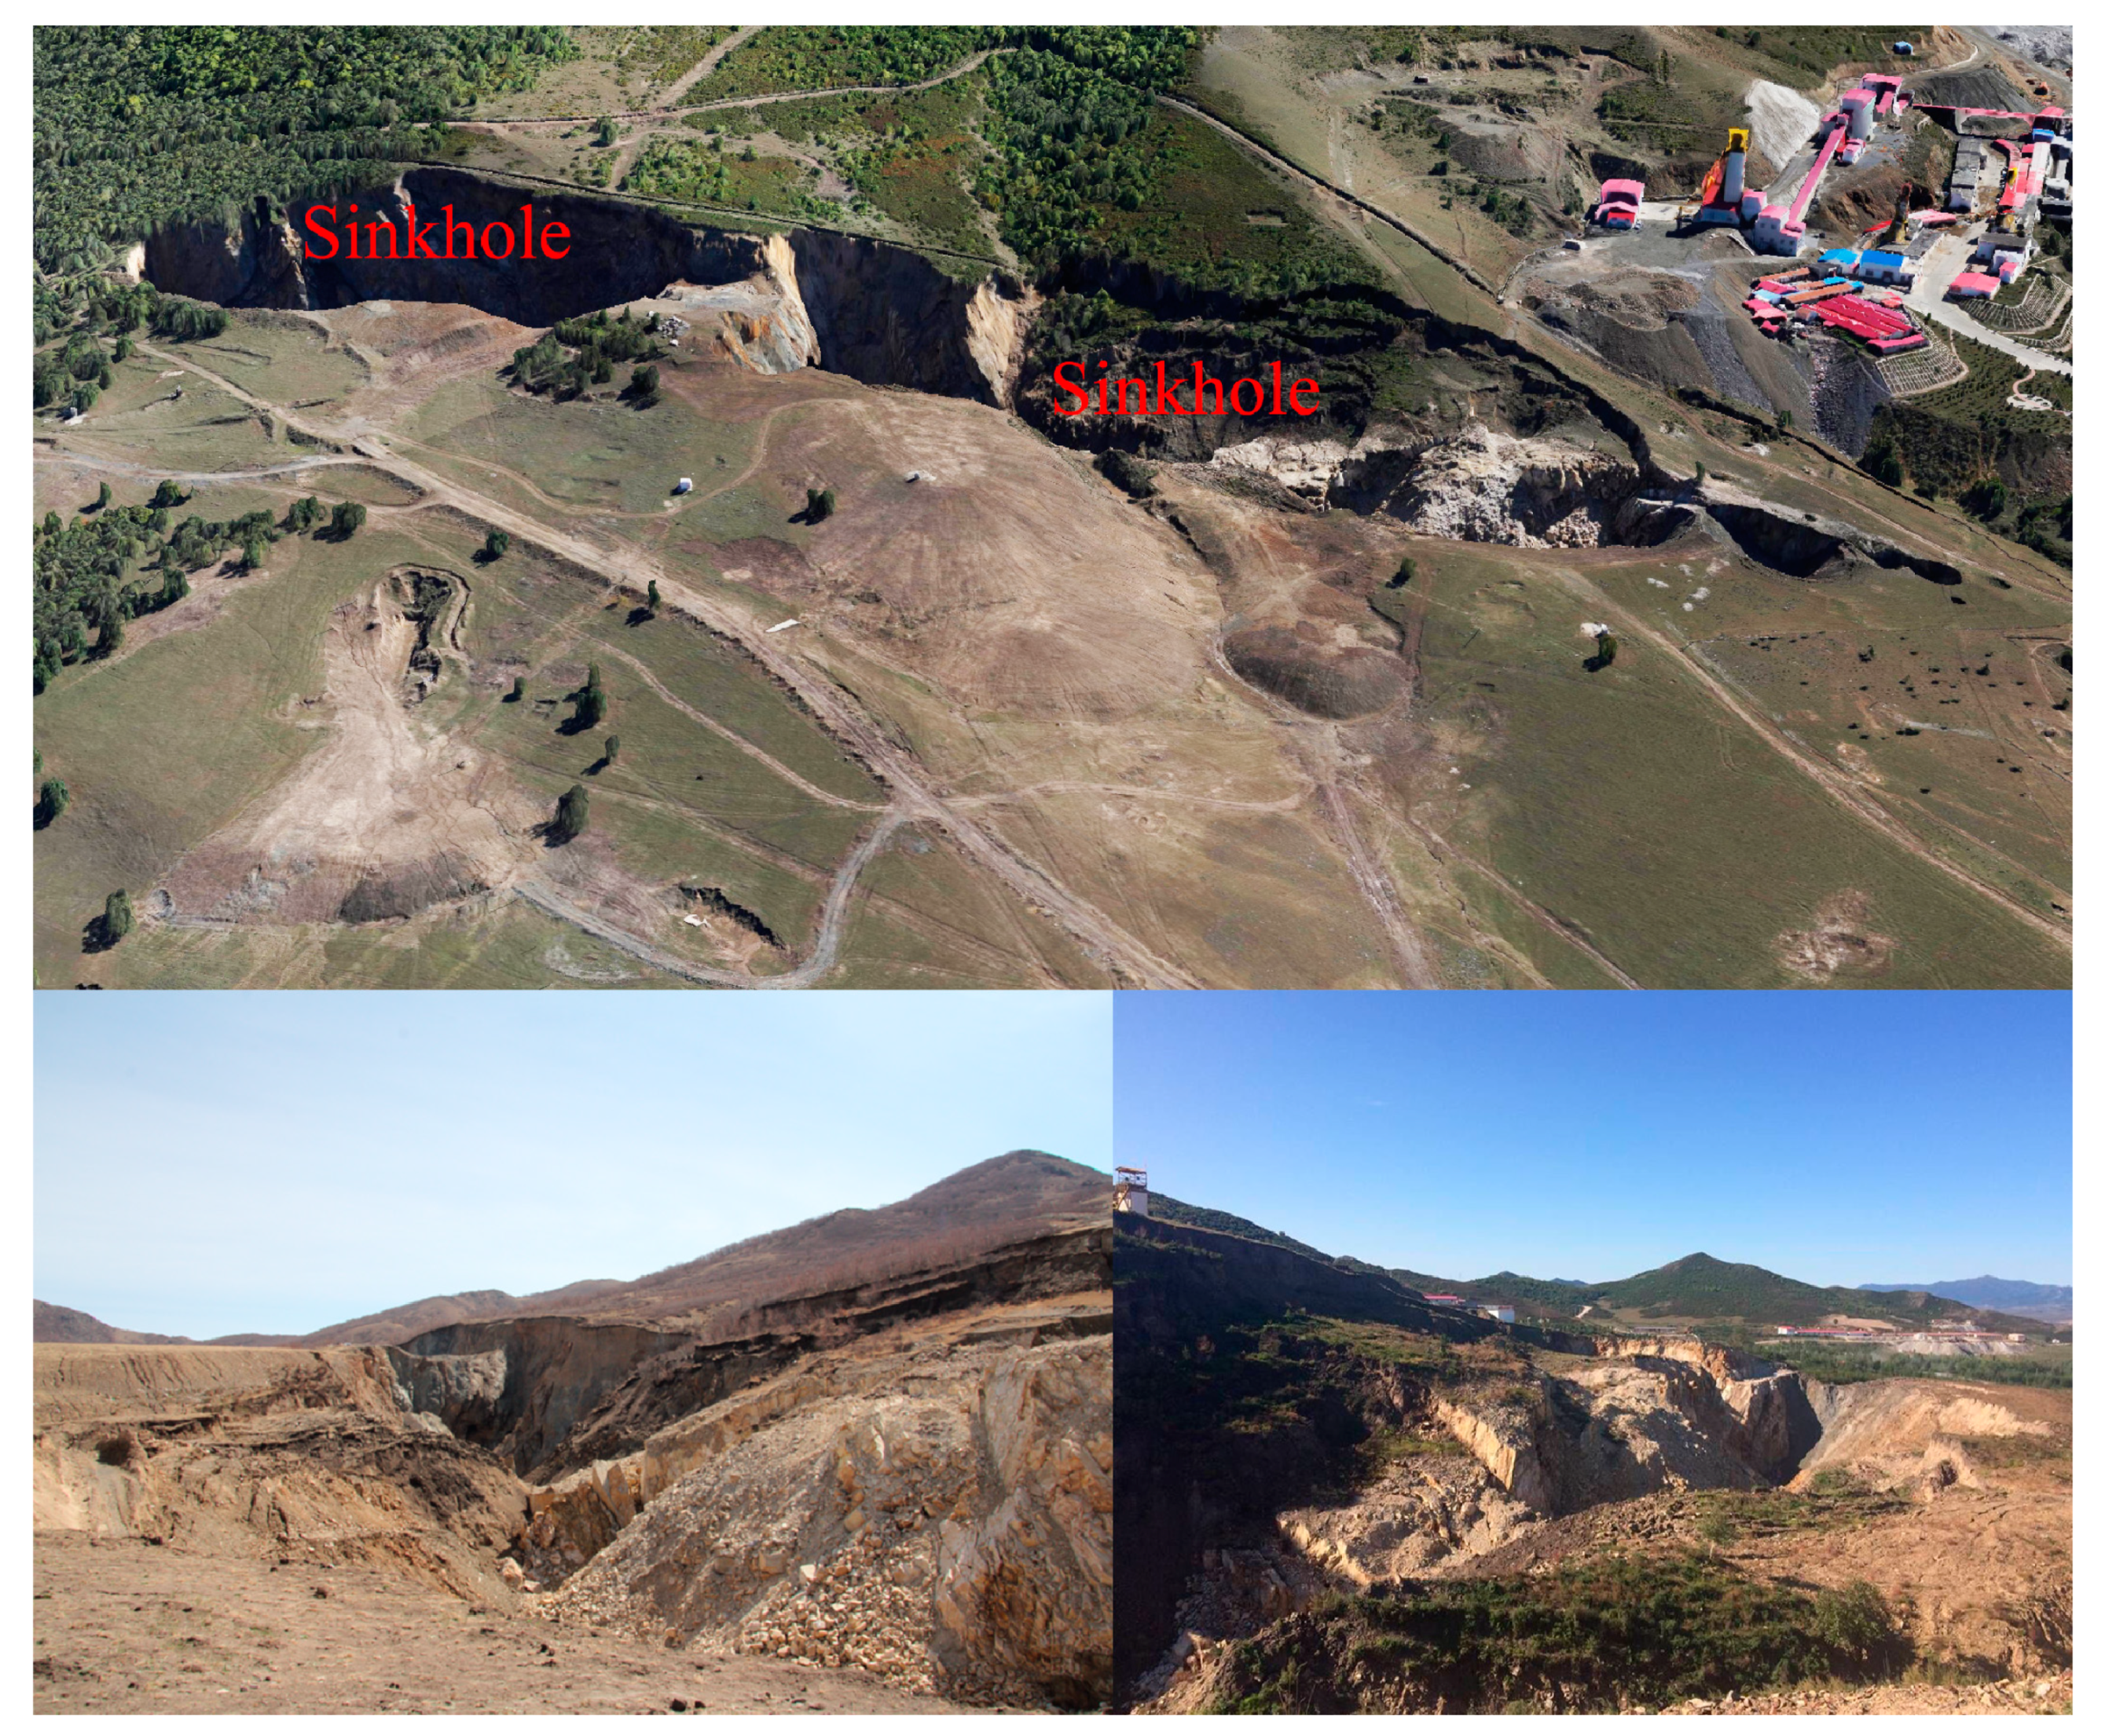
Due to continuous underground mining, extracting the pillar, and no backfill materials fill the mine void. The giant goaf has gradually formed with the development of underground mining for more than ten years, which has induced the massive surface collapse and shown in Figure 5. The overlying rock mass gradually subsided under the action of gravity and mining-induced stress, resulting in new cracks occurrence on the surface. Field surveying and data analysis have been done at +1035 m level, and above in 2016, the length of the collapse zone is 684 m, and the maximum width is 150 m, the surface collapse area is more than 60,000 m2 (Figure 6). Continuous surface cracks, ground sliding and collapse have been observed in or near the subsided pit, and the cracks were usually parallel to the edges of the surface collapse. Some cracks’ width is more than 1 m, and they were identified as the primary cracks. The surface collapse caused by underground mining in this mine also caused a slope landslide with a length of 240 m and a width of 60 m.
4. Preliminary Study
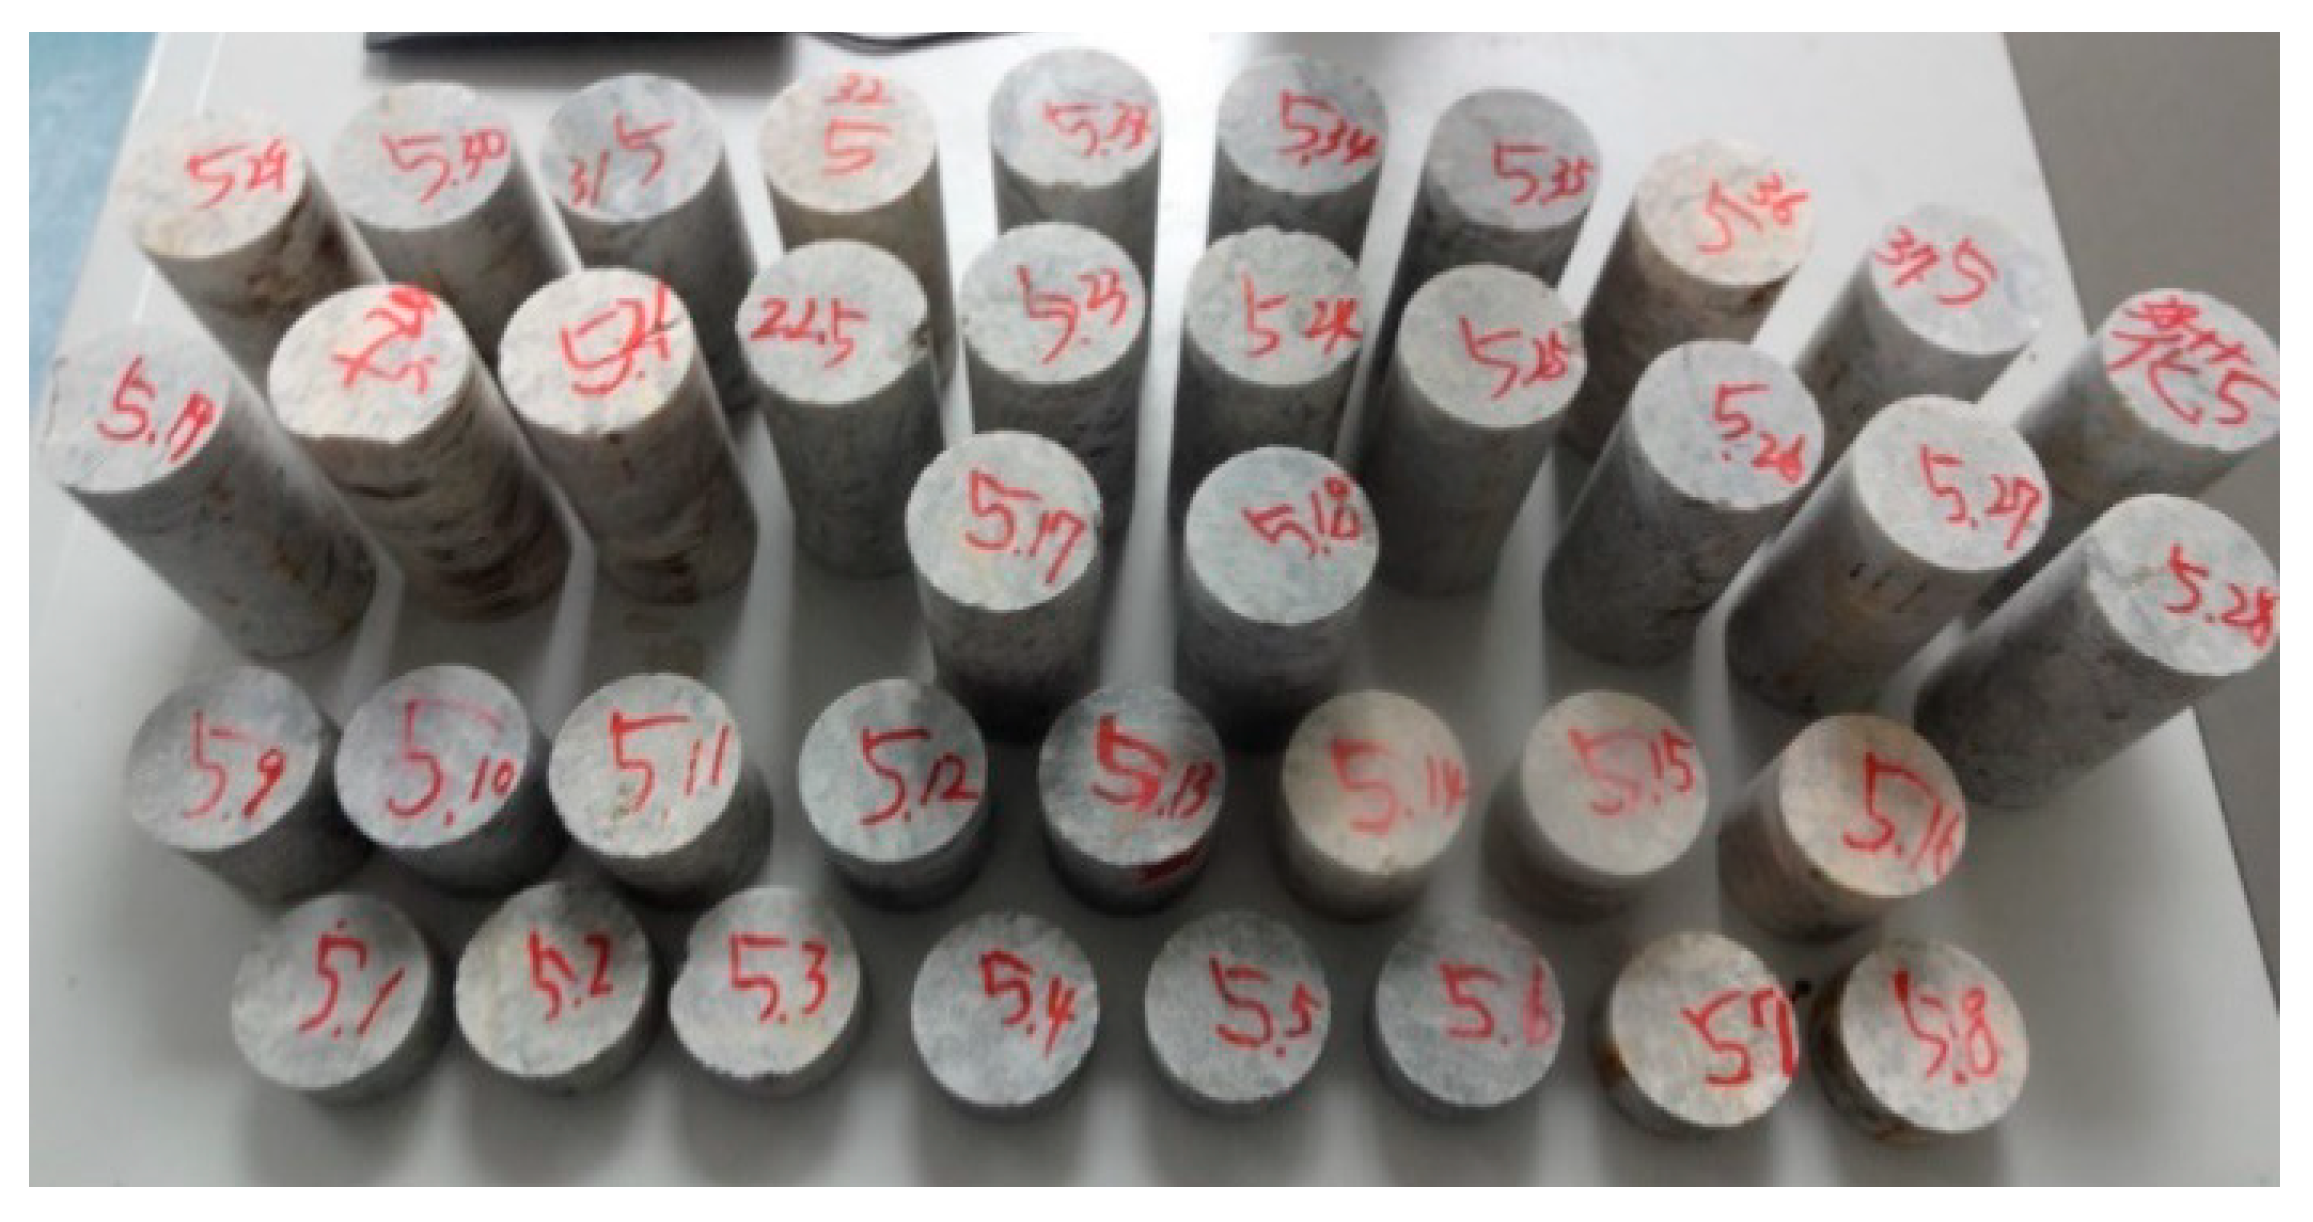
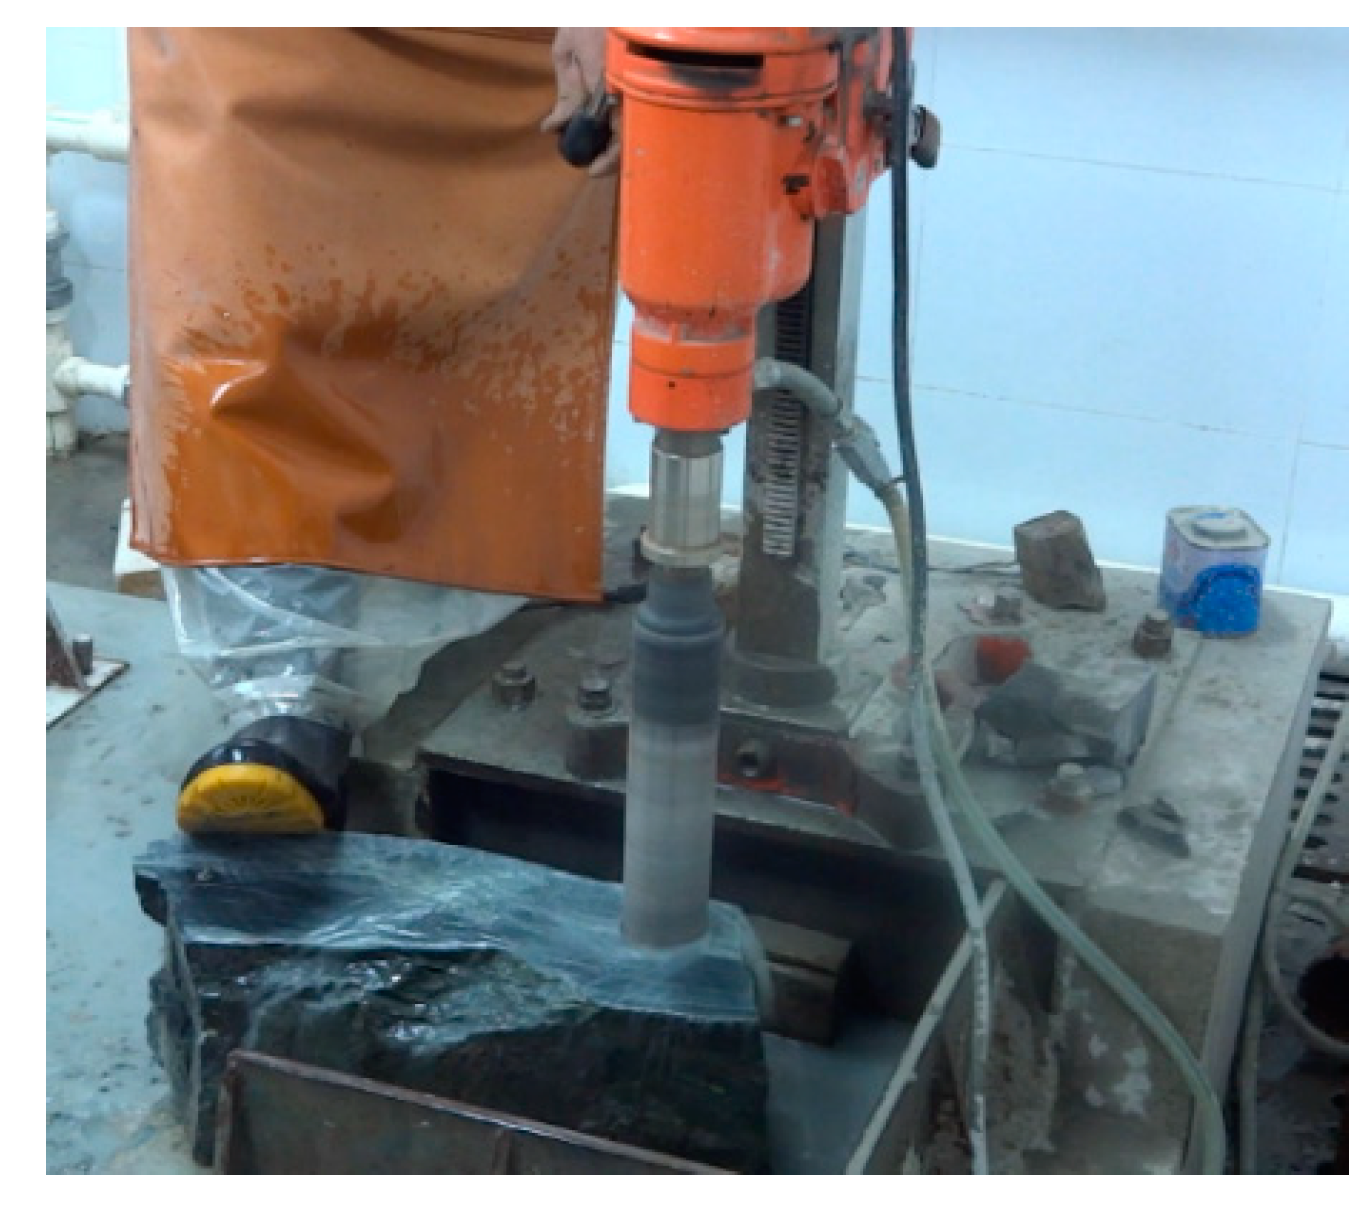
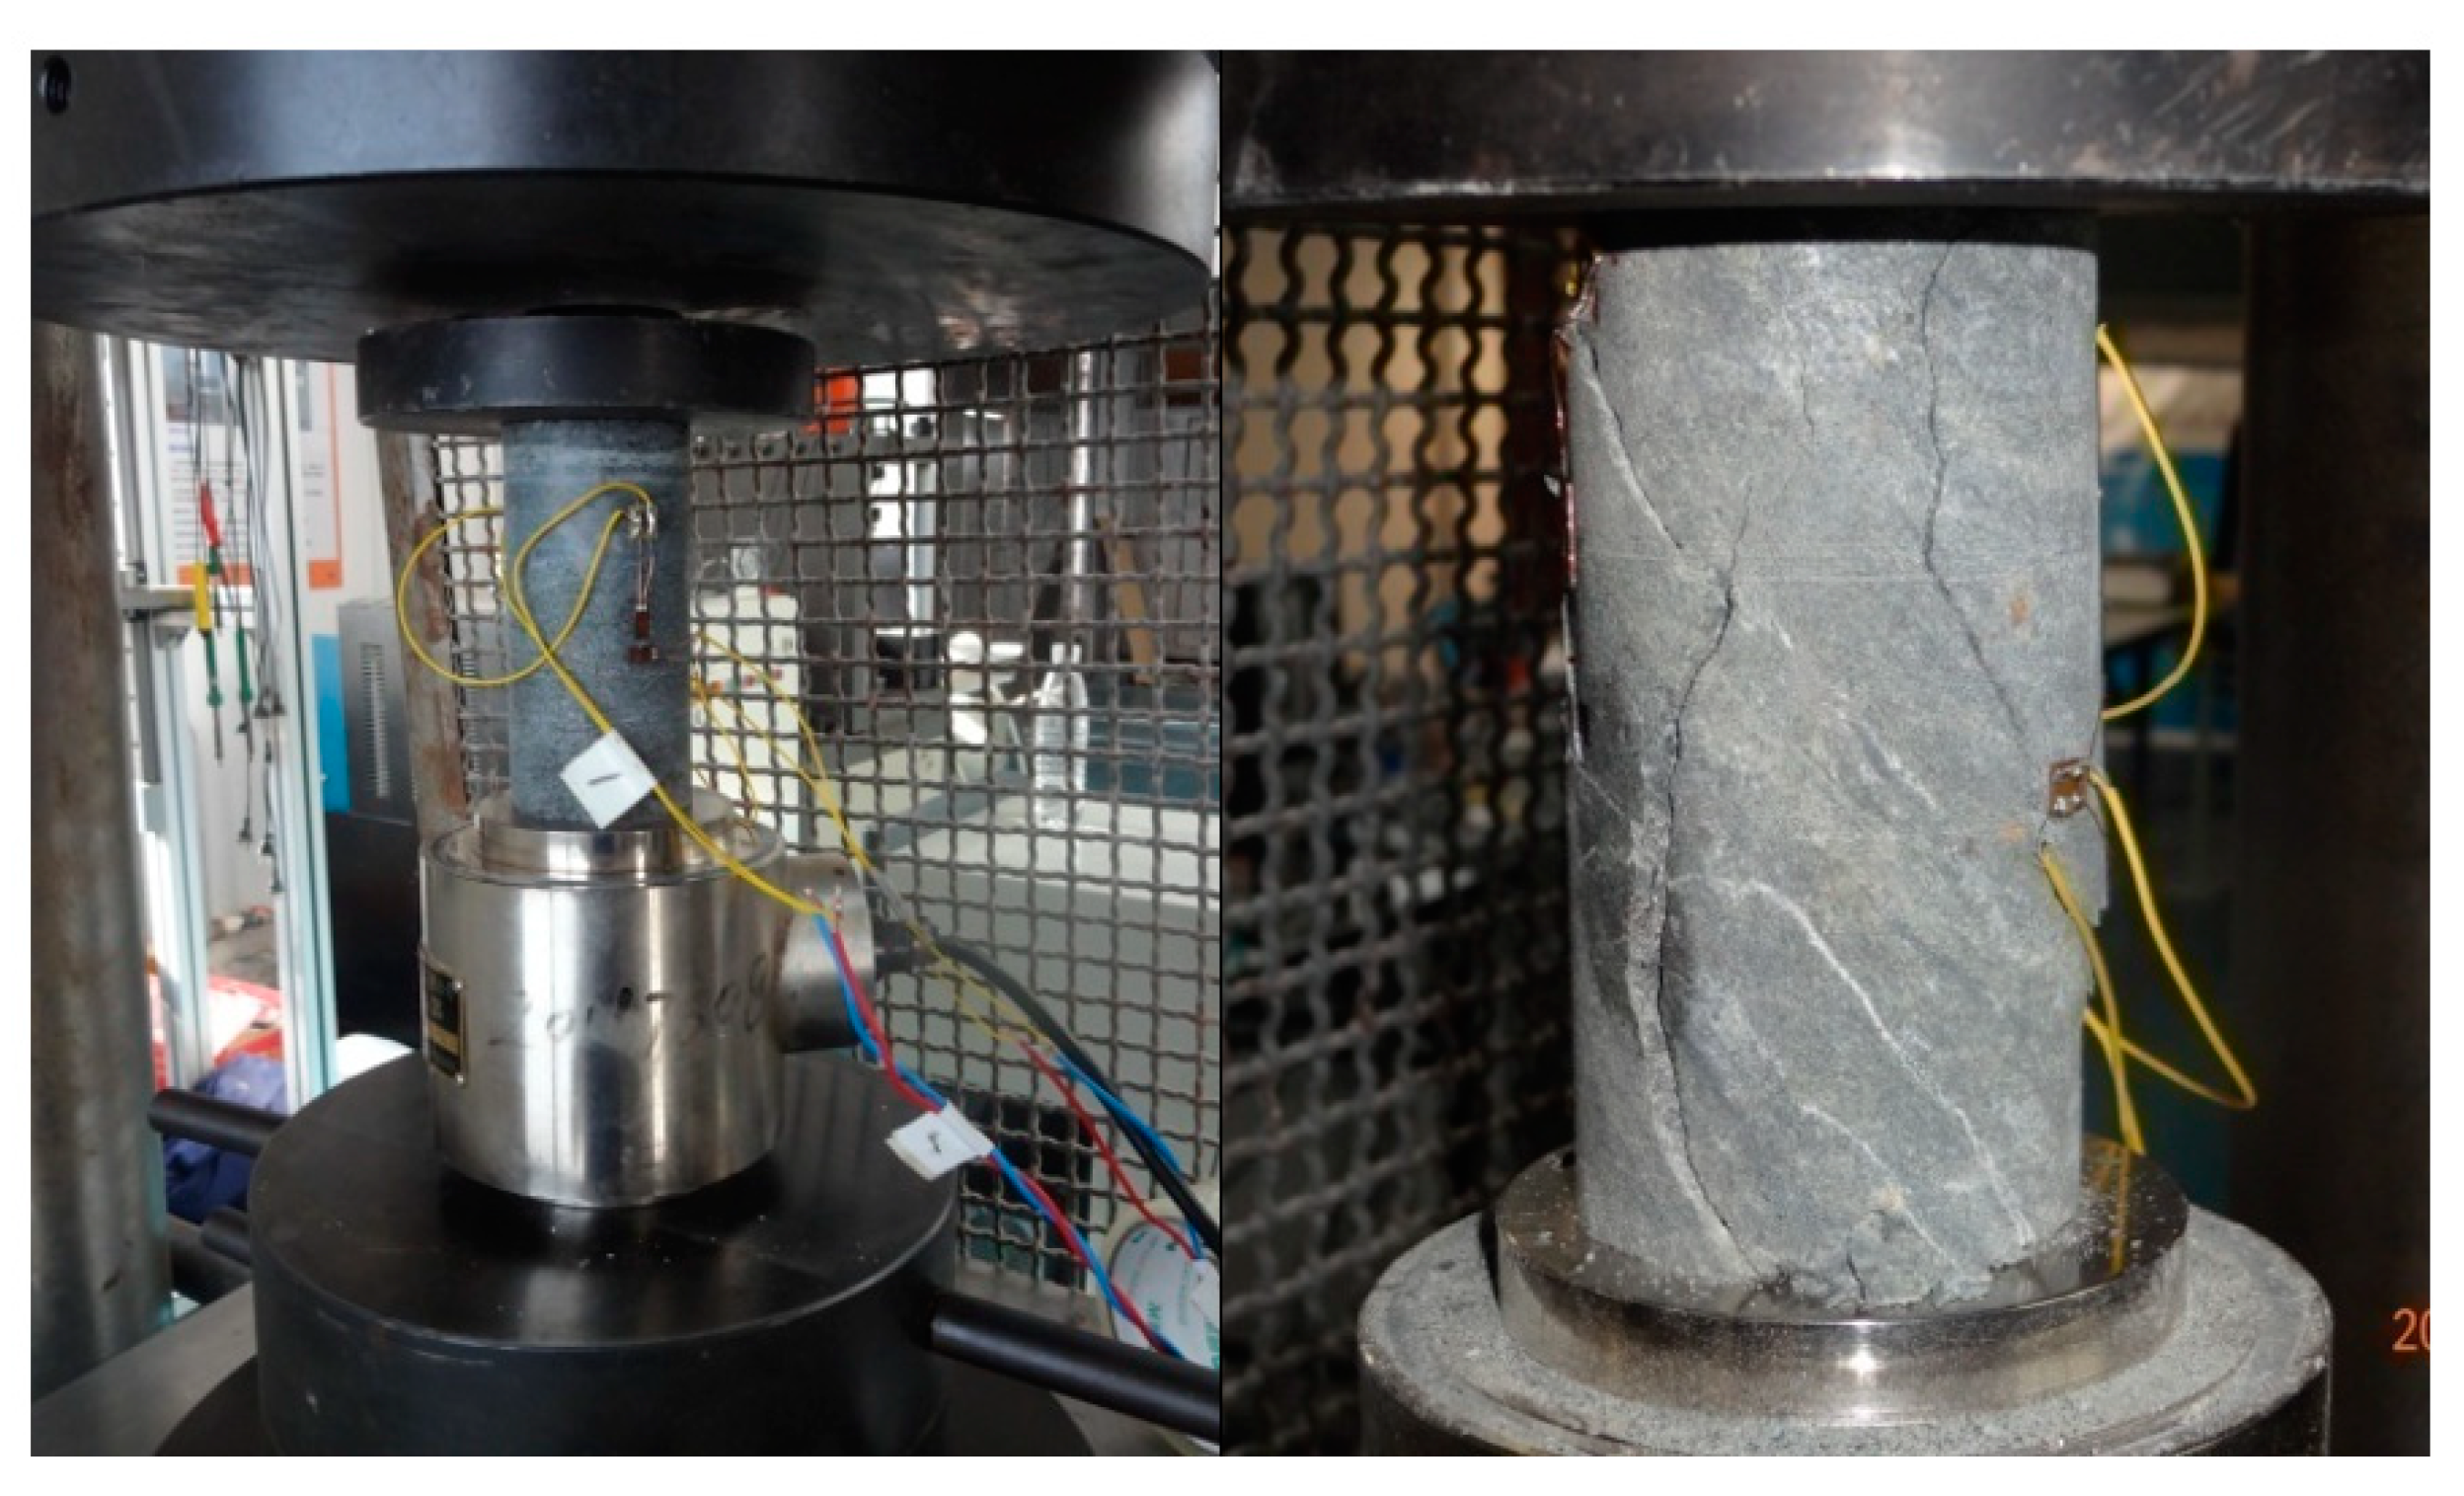
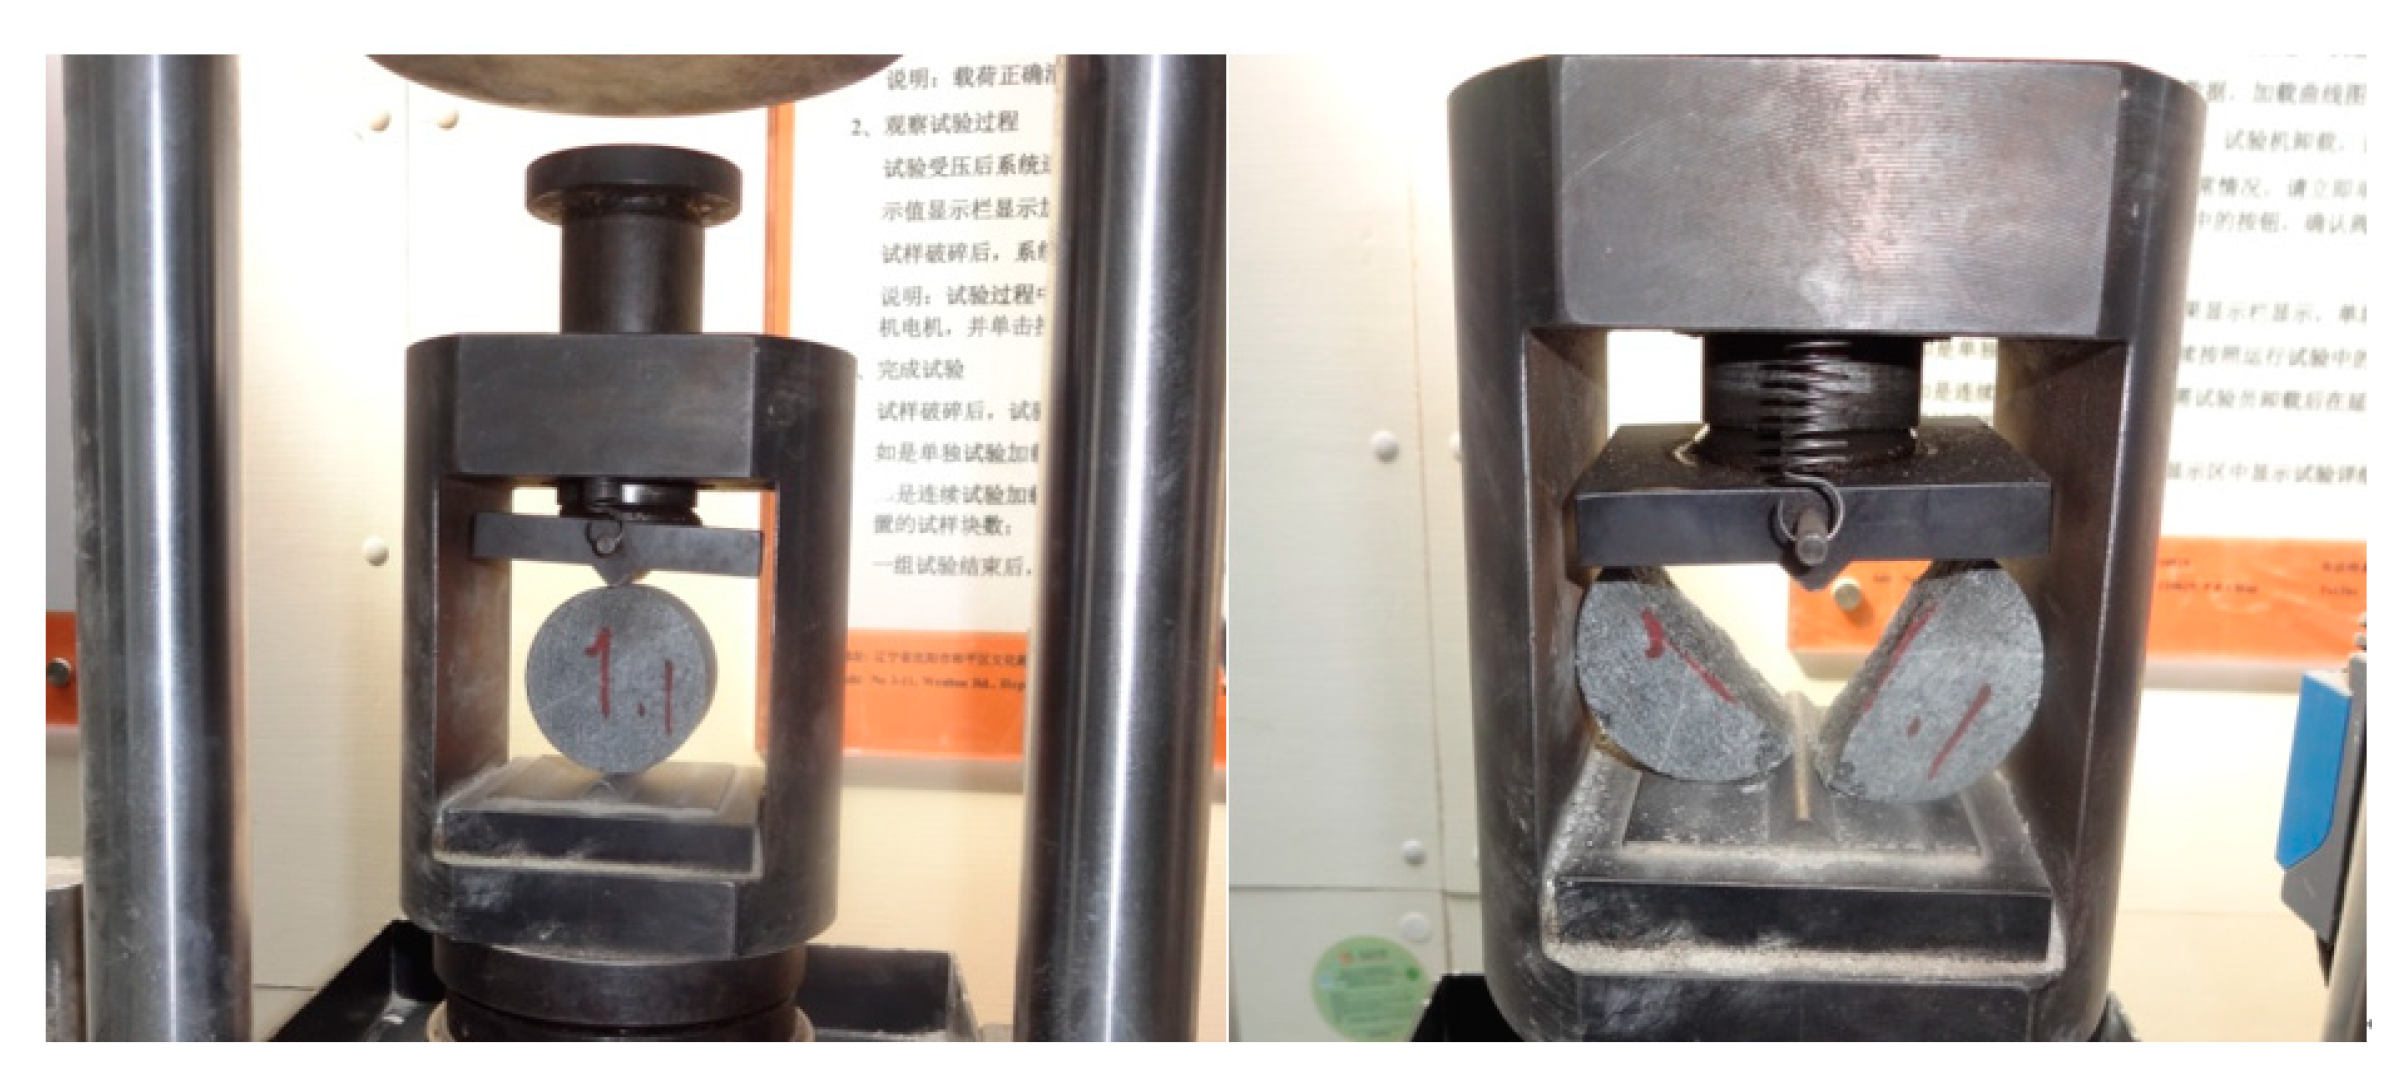
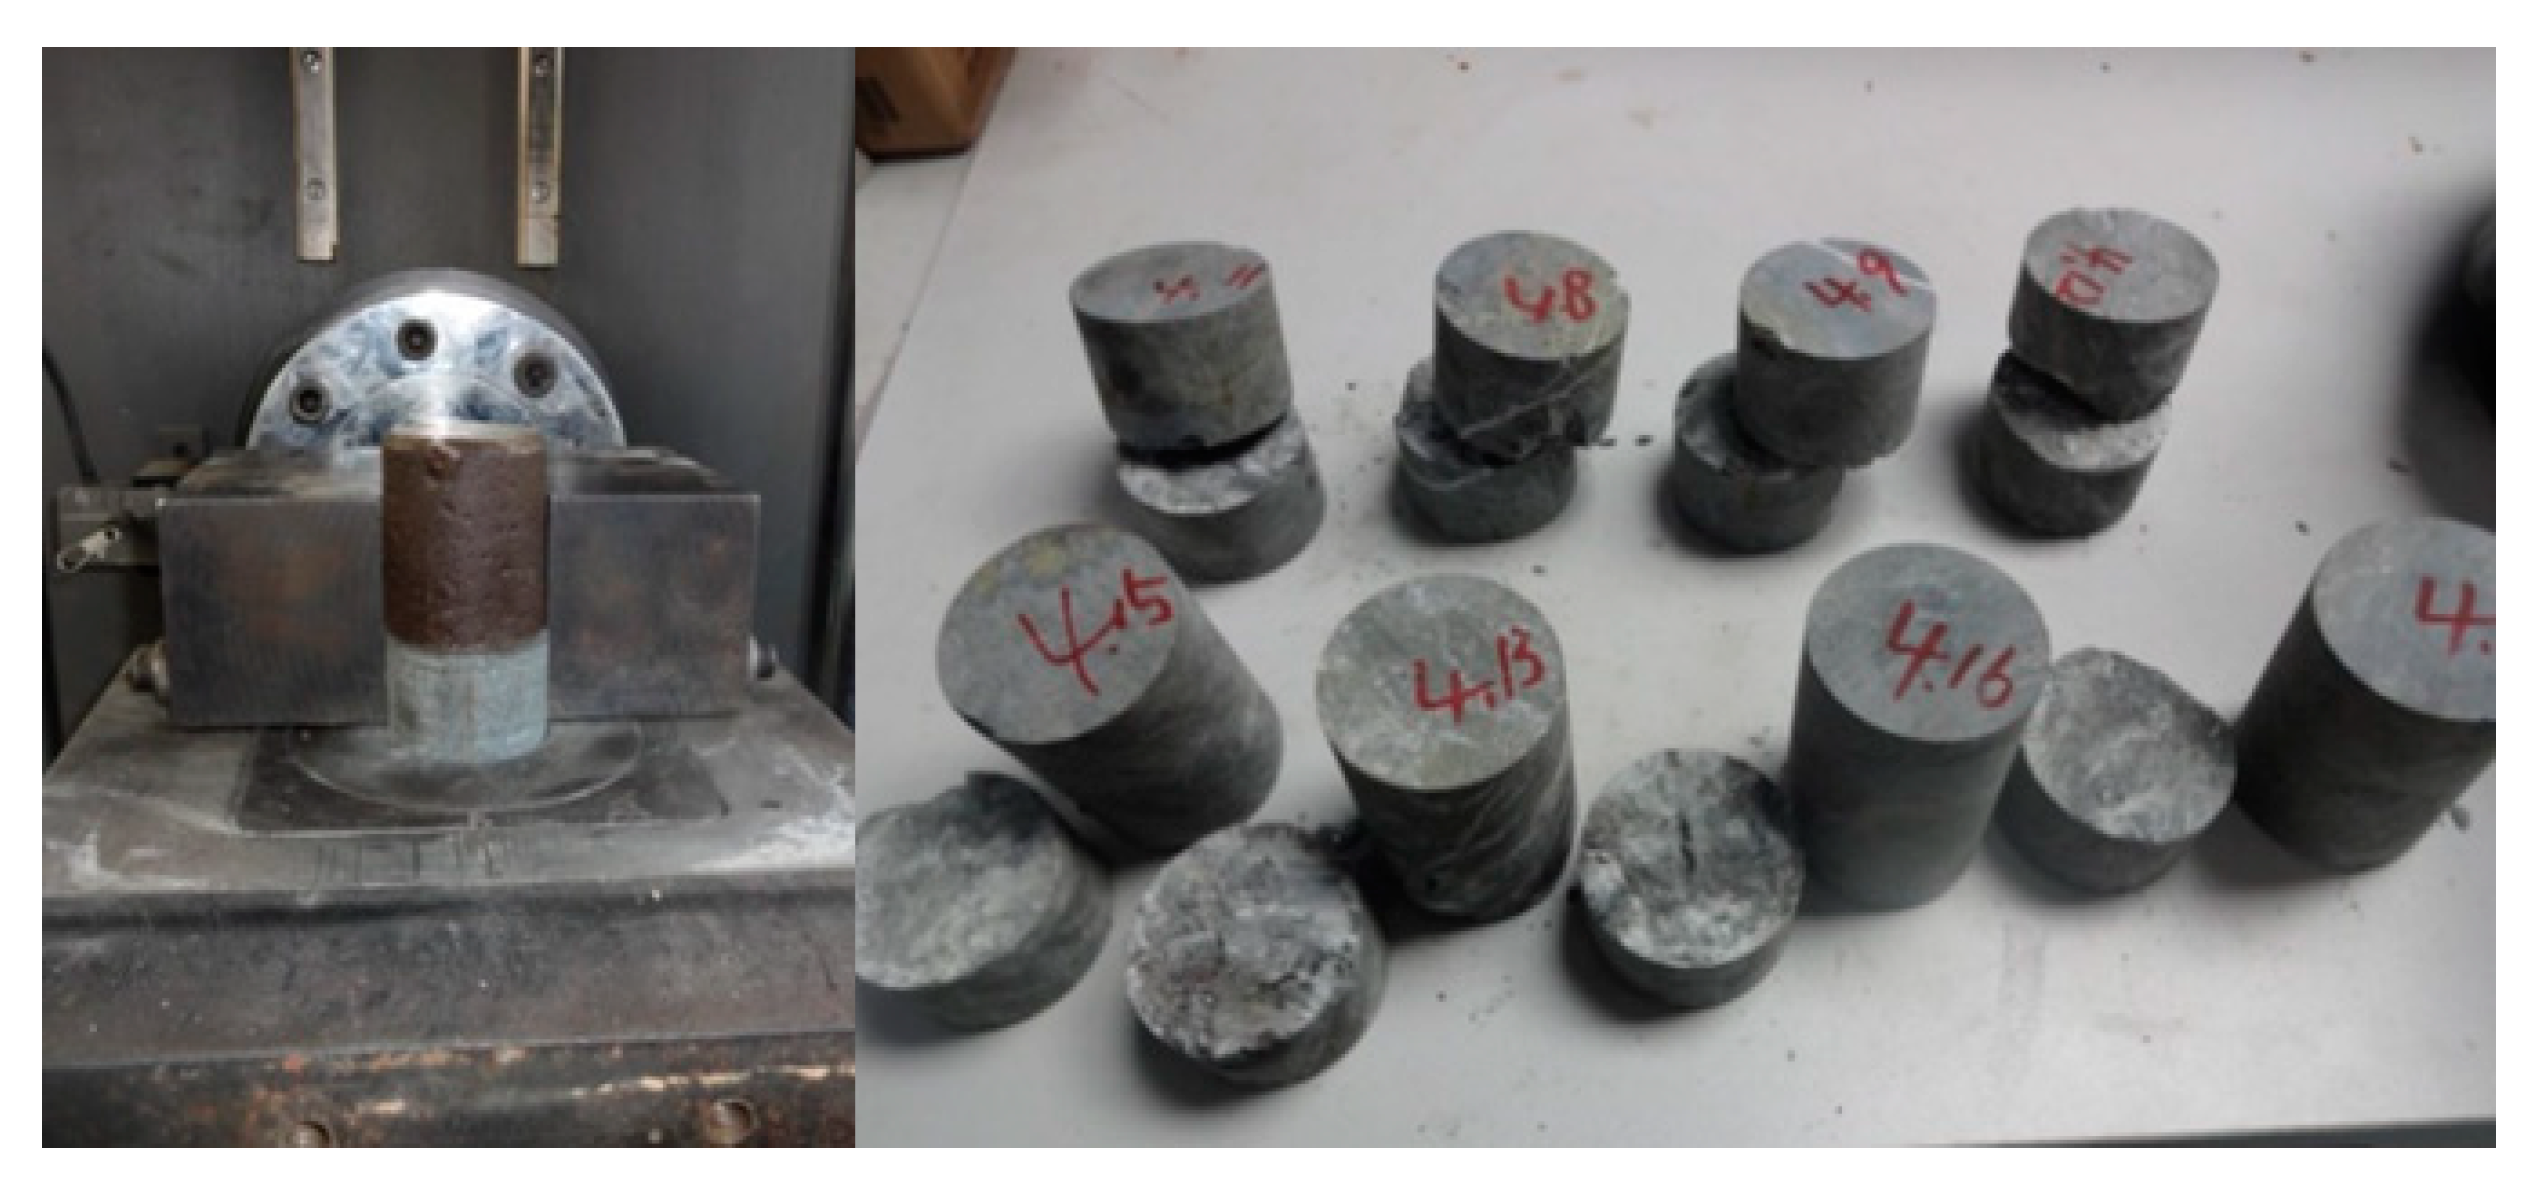
33 rock samples were collected from four different levels (+805 m, +855 m, +905 m and +955 m) of Hongling Lead-zinc Mine with five kinds of rock (ore, marble, argillaceous slate, skarn and feldspar porphyry) to ensure that the range of lithology and alteration types were included. 111 standard rock specimens (Figure 7) including cylindrical specimens with the height-to-diameter ratio of 2:1 and the size of Φ50 × 100 mm, disc specimens with the size of Φ50 × 25 mm and specimens with diameter of 50 mm and height ranged from 64 mm to 100 mm, were processed from the in-situ samples (Figure 8). The rocks’ physical and mechanical properties were determined from laboratory testing on intact rock specimens following ISRM (1981) recommended methods (Figure 9, Figure 10 and Figure 11), and the test results are given in Table 1. Uniaxial compression tests, Brazil splitting tests and direct shear tests were performed to obtain rock mechanical parameters. The uniaxial compressive strengths (UCS, σc), Young’s modulus (E) and Poisson’s ratios (μ) of specimens were estimated by YE4-100 hydraulic pressure testing machine with the maximum loading of 100 t, and stress sensors and UCOM-60A static acquisition instrument were applied to monitor stress distributions and axial and lateral strains (Figure 9). The tensile strengths (σt) and shear strengths were determined by YAW-300 microcomputer controlled electro hydraulic servo direct shear testing machine. The densities (ρ) of specimens were calculated by measured weights and volumes. All the laboratory tests were carried out under the Standards Press of China GB/T50266-99. The cohesion (c) and internal friction angle (φ) of rocks were obtained by the means of linear regression with the shear stresses and normal stresses measured in the direct shear tests under the Mohr-Coulomb criterion.
The quantitative value of GSI was deeply studied by Bertuzzi et al. In this paper, the GSI value of rock mass was determined according to the results of geological survey based on the research results of Bertuzzi et al. [30]. The geological survey work includes the collection of borehole data, structural plane measurements (weathering, roughness, water, etc.). The value of D was determined depended on experience in the mine according to the reference of Hoek et al.’s paper in 2002 [31].
According to the China GB50218-94 Standard for engineering classification of rock masses [32], the samples of skarn, slate, feldspar porphyry and ore were hard rock (σc ≥ 60 MPa), and the marble were medium hard rock (30 MPa ≤ σc ≤ 60 MPa). The tensile strength and shear strength of contact surrounding rock of orebody—skarn were the weakest, which is not conducive to the mined-out area’s stability. Because the bedrock in the mining zone is slate, and the development and extension of collapses and subsidence were close to slate distribution and mechanical properties.
5. Numerical Model Set-Up
The current underground mining of Hongling Lead-Zinc Mine has caused surface subsidence. As the orebody is mined, which will induce subsidence, and it is necessary to retain pillars and fill mine void during mining. To solve this series of problems, a 3D numerical model was built to analyze the stability of the surface subsidence area in Hongling Lead-Zinc Mine, judge the impact of surface collapse extraction on the, and predict the development of the subsidence scope.
Build a 3D numerical model for FLAC3D to calculate and analyze the surface subsidence, and there were eight steps in this numerical model set-up progress:
- ①
- Establish geological database including drilling sheet, survey sheet, geological sheet and mineral grade sheet in 3DMine software;
- ②
- Generate a 3D model (Figure 12) in 3DMine and export the surface elevation data;
- ③
- Import the surface elevation data into MidasGTSNX and generate the 3D surface and surrounding rock model;
- ④
- Import the orebody data and optimize the 3D orebody model in MidasGTSNX;
- ⑤
- Connect the surrounding rock model with the orebody model and optimize topological relations;
- ⑥
- Mesh the orebody and surrounding rock model;
- ⑦
- Export the grid node and element data;
- ⑧
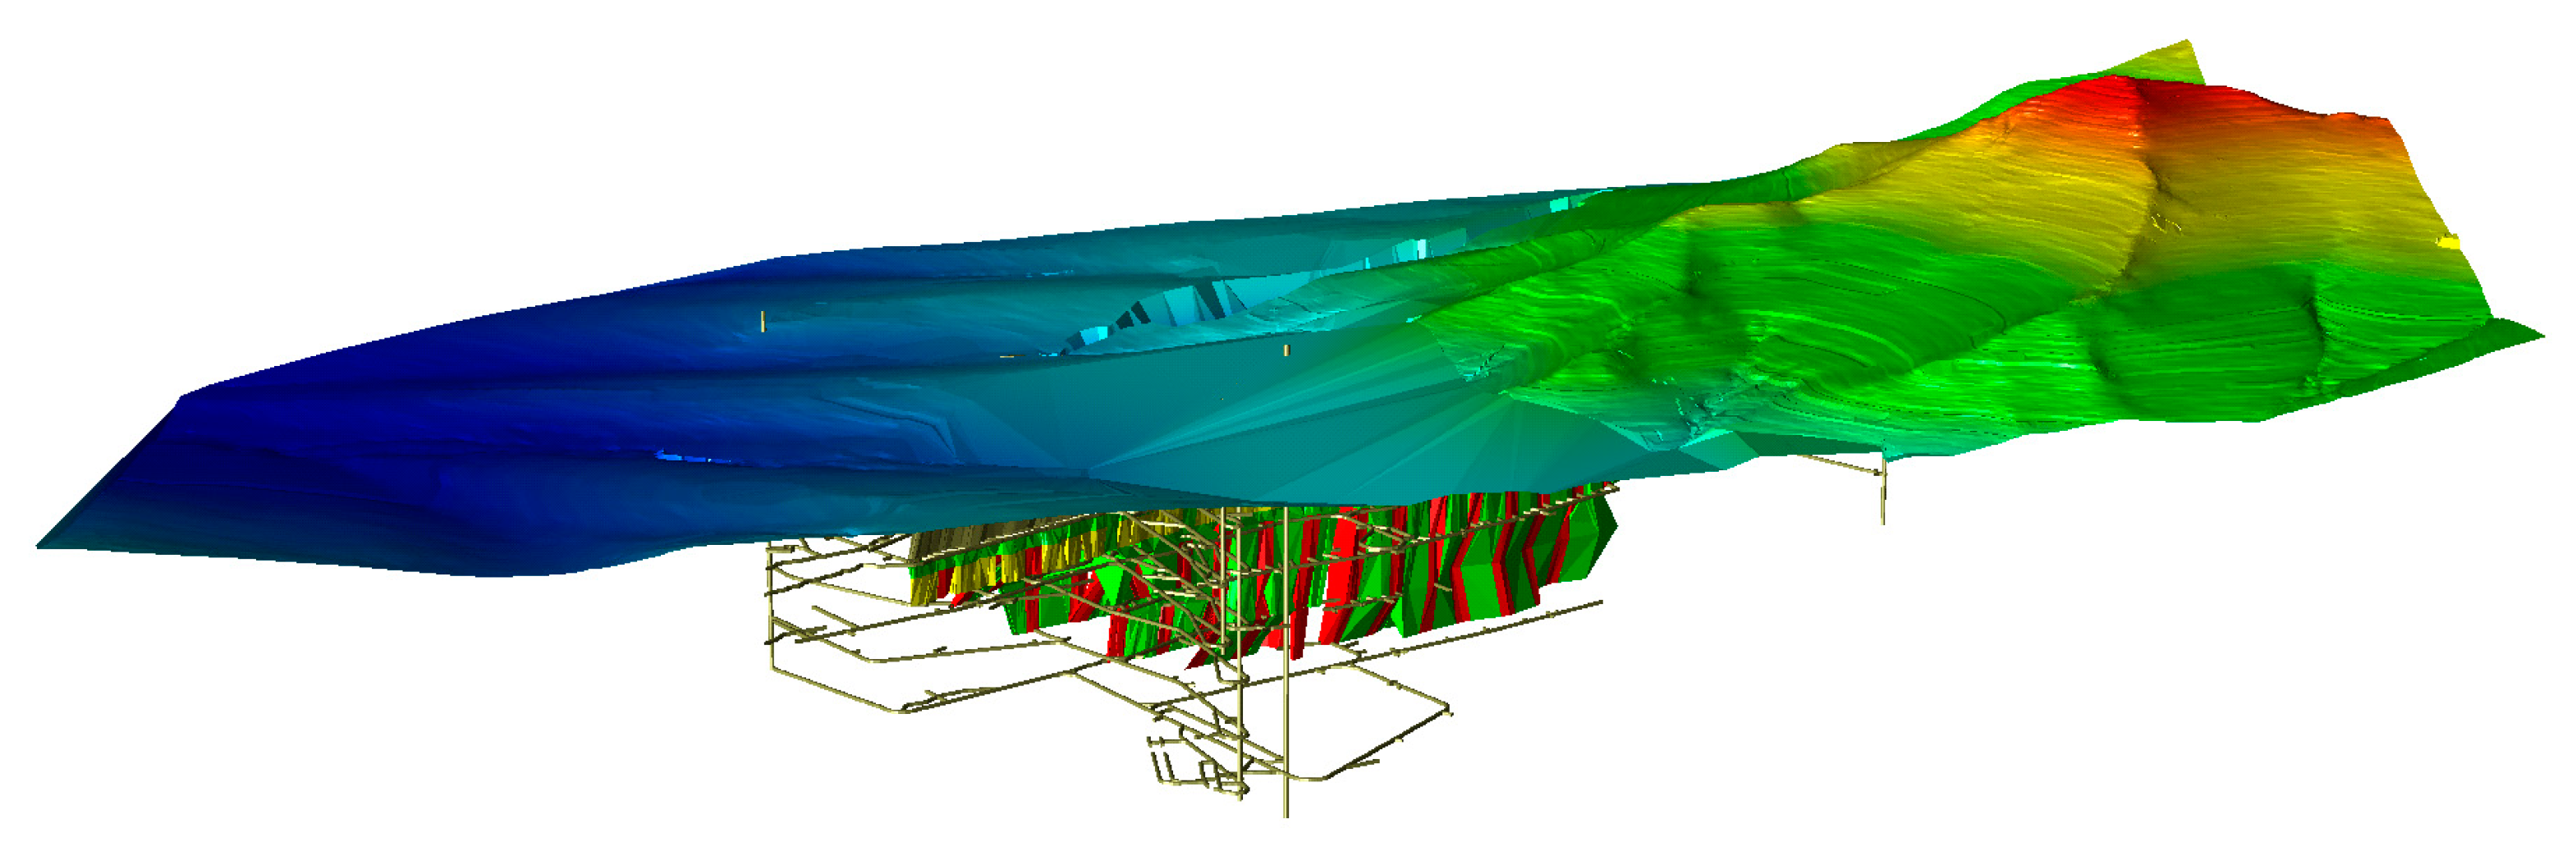
- Convert data into flac3d format and import to FLAC3D (Figure 13).
Figure 12.
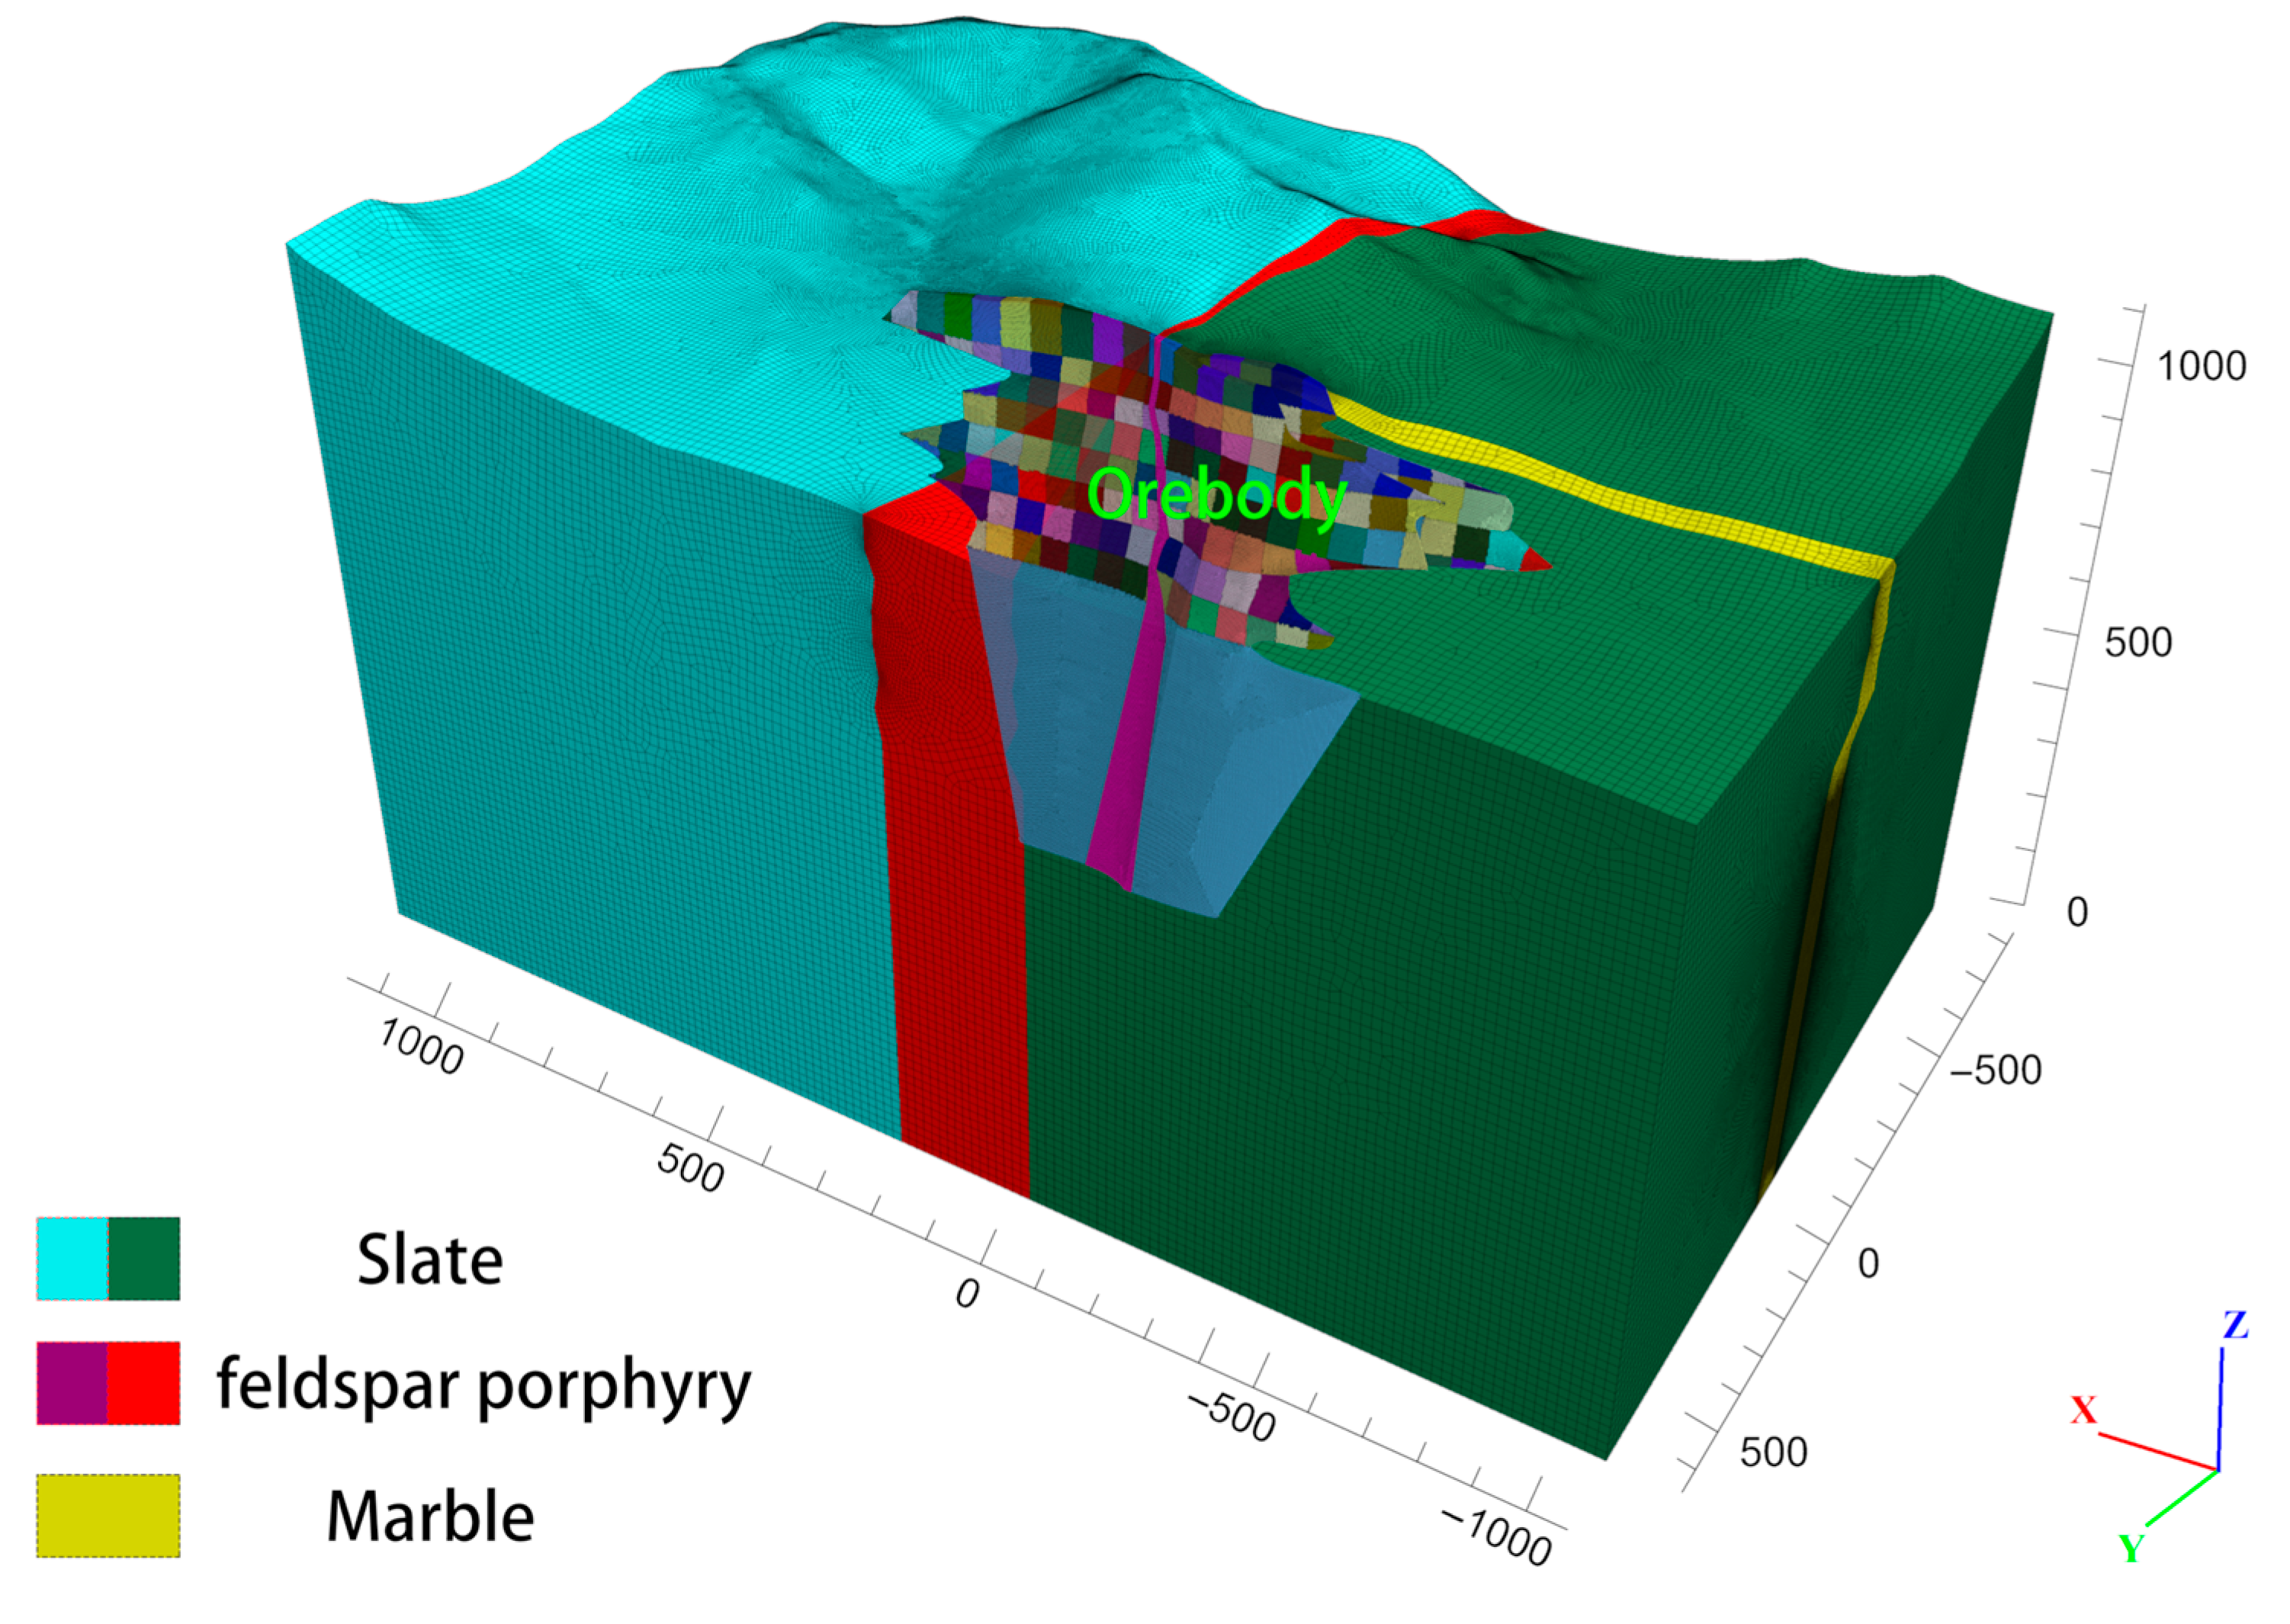
A 3D model of mine structure, orebody and surface.

Figure 13.
The FLAC3D model.

When generating a 3D model in FLAC3D, the original coordinate point is taken as 49,444,800, 40,443,100. Taking the original coordinate point as the rotation center, the orebody was rotated 31 degrees clockwise, so that the dip direction of the orebody was the positive direction of the y axis of the coordinate system, and the trend is the x-axis. The model extended from point (−1075 m, −830 m) to point (1160 m, 660 m) with the size of 2235 m × 1490 m and height ranging from 980 m to 1300 m.
6. Numerical Modelling and Analysis
6.1. Numerical Model Introduction
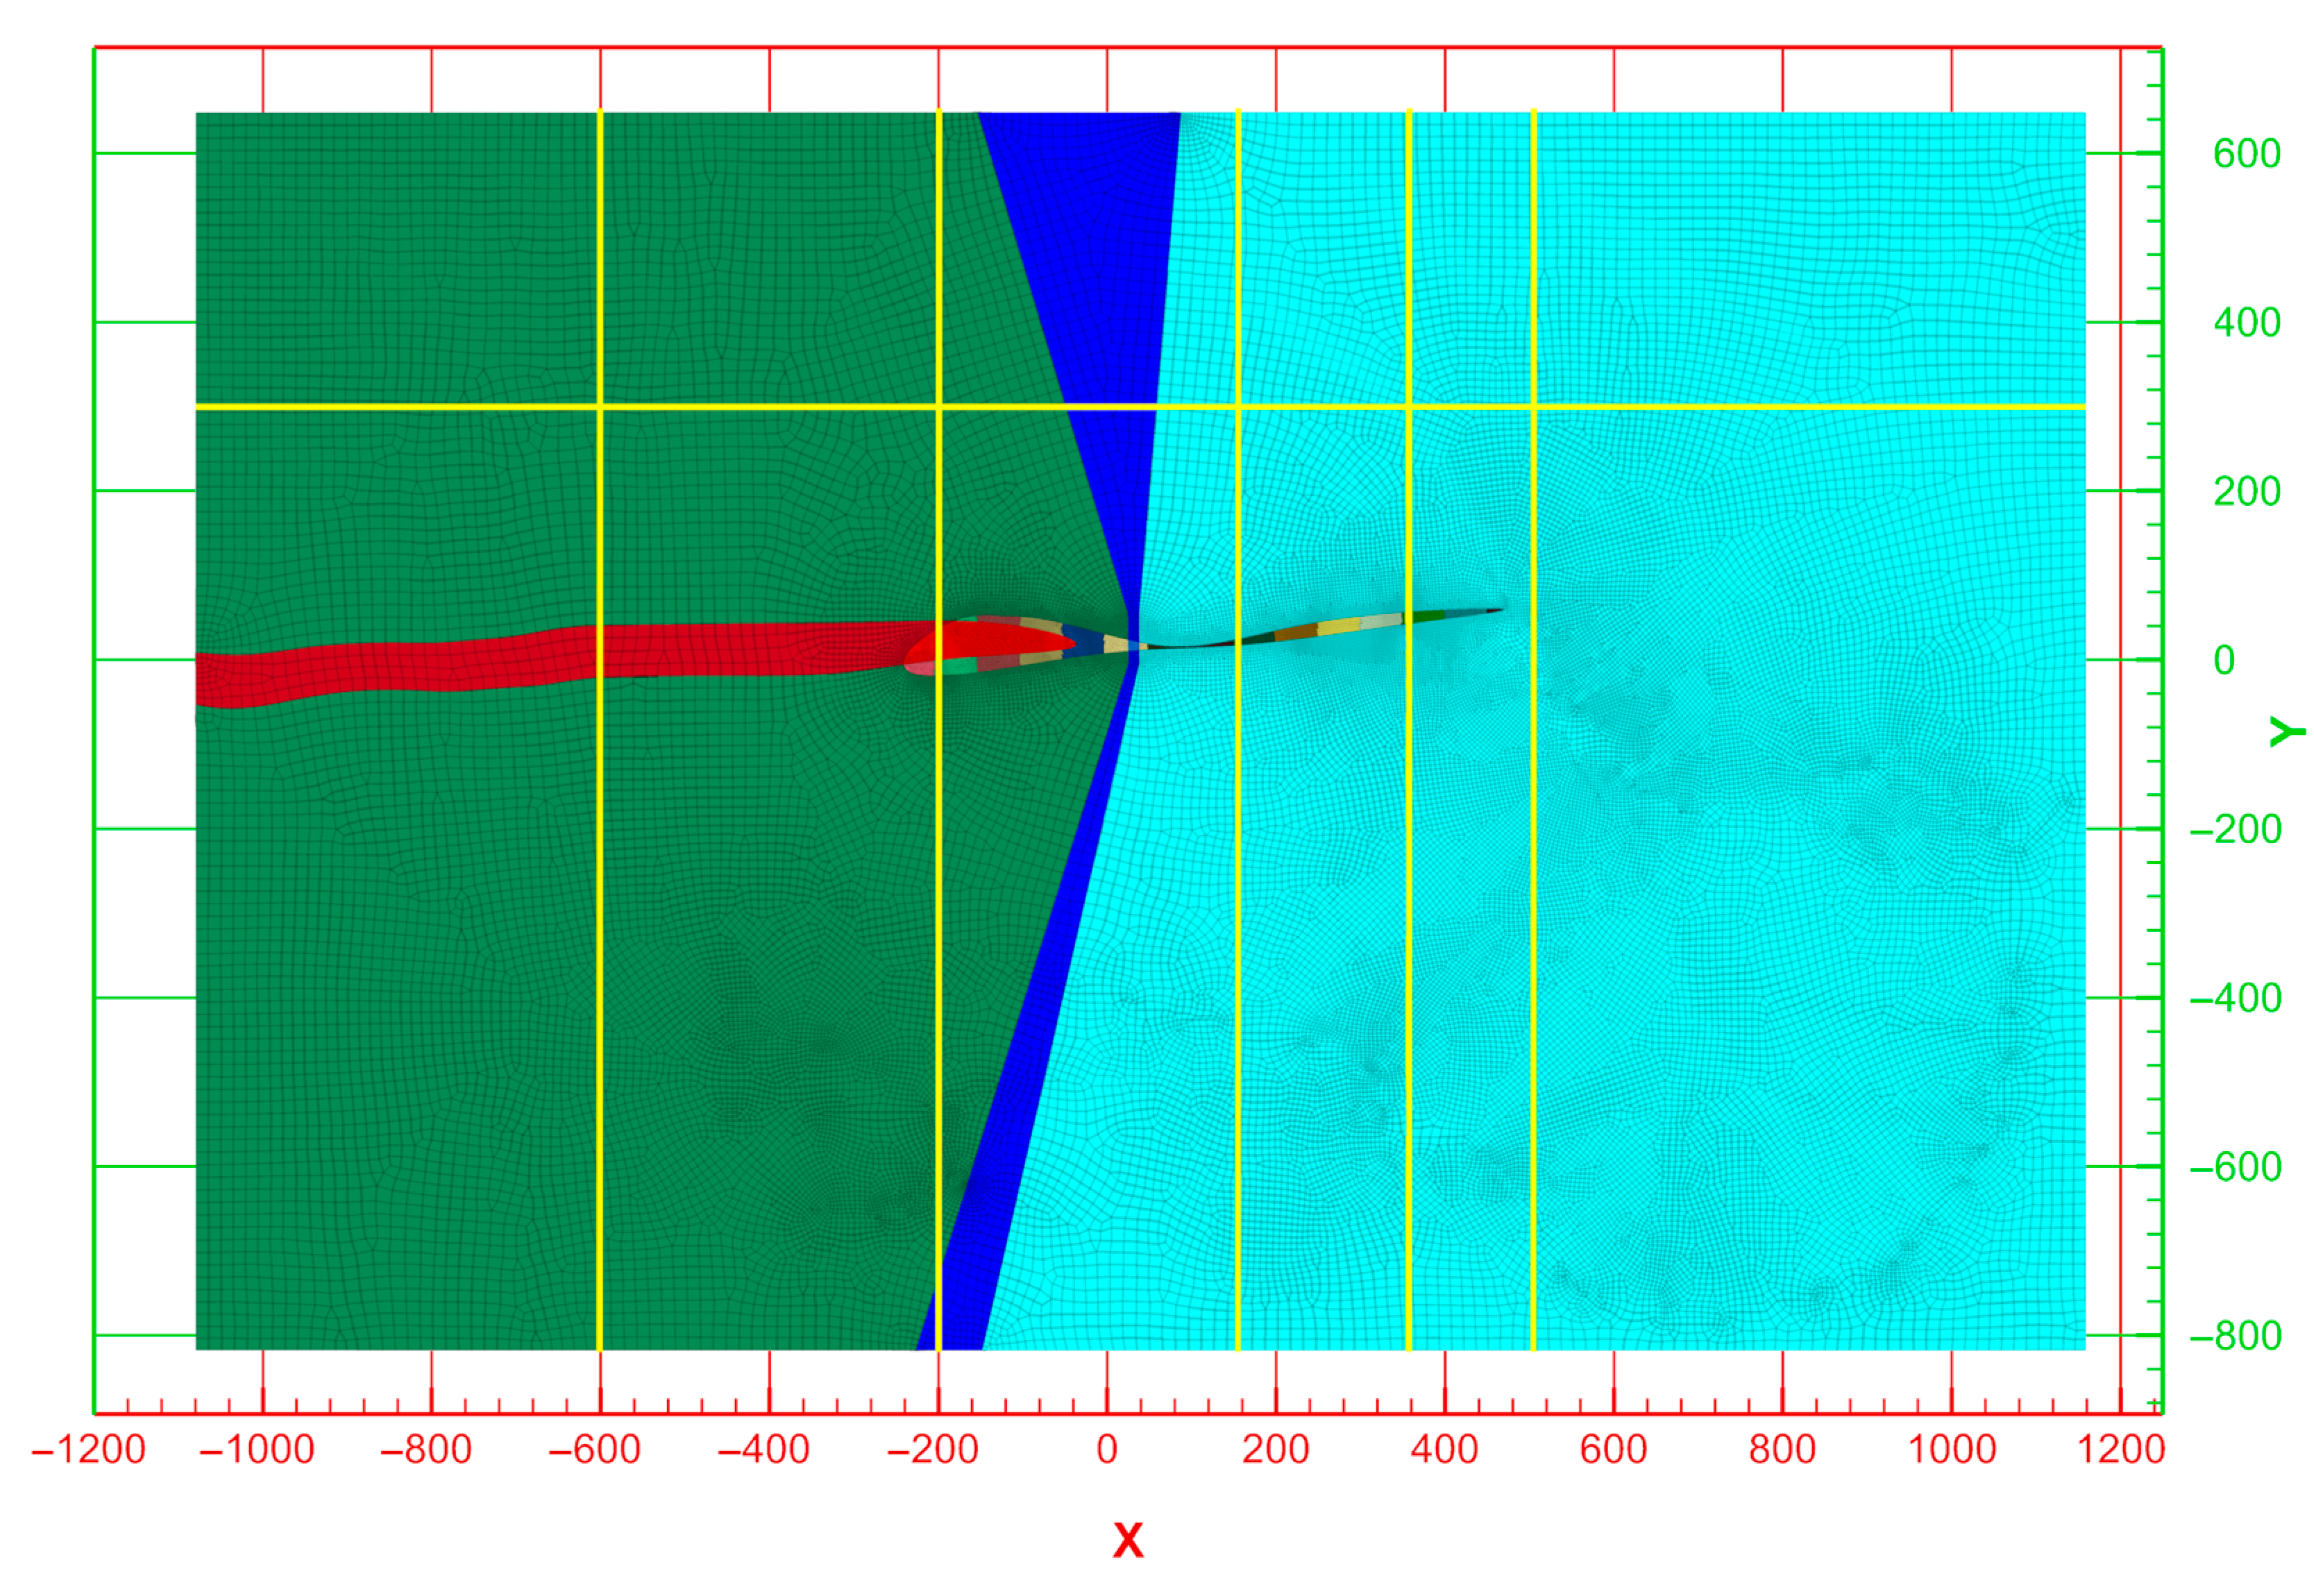
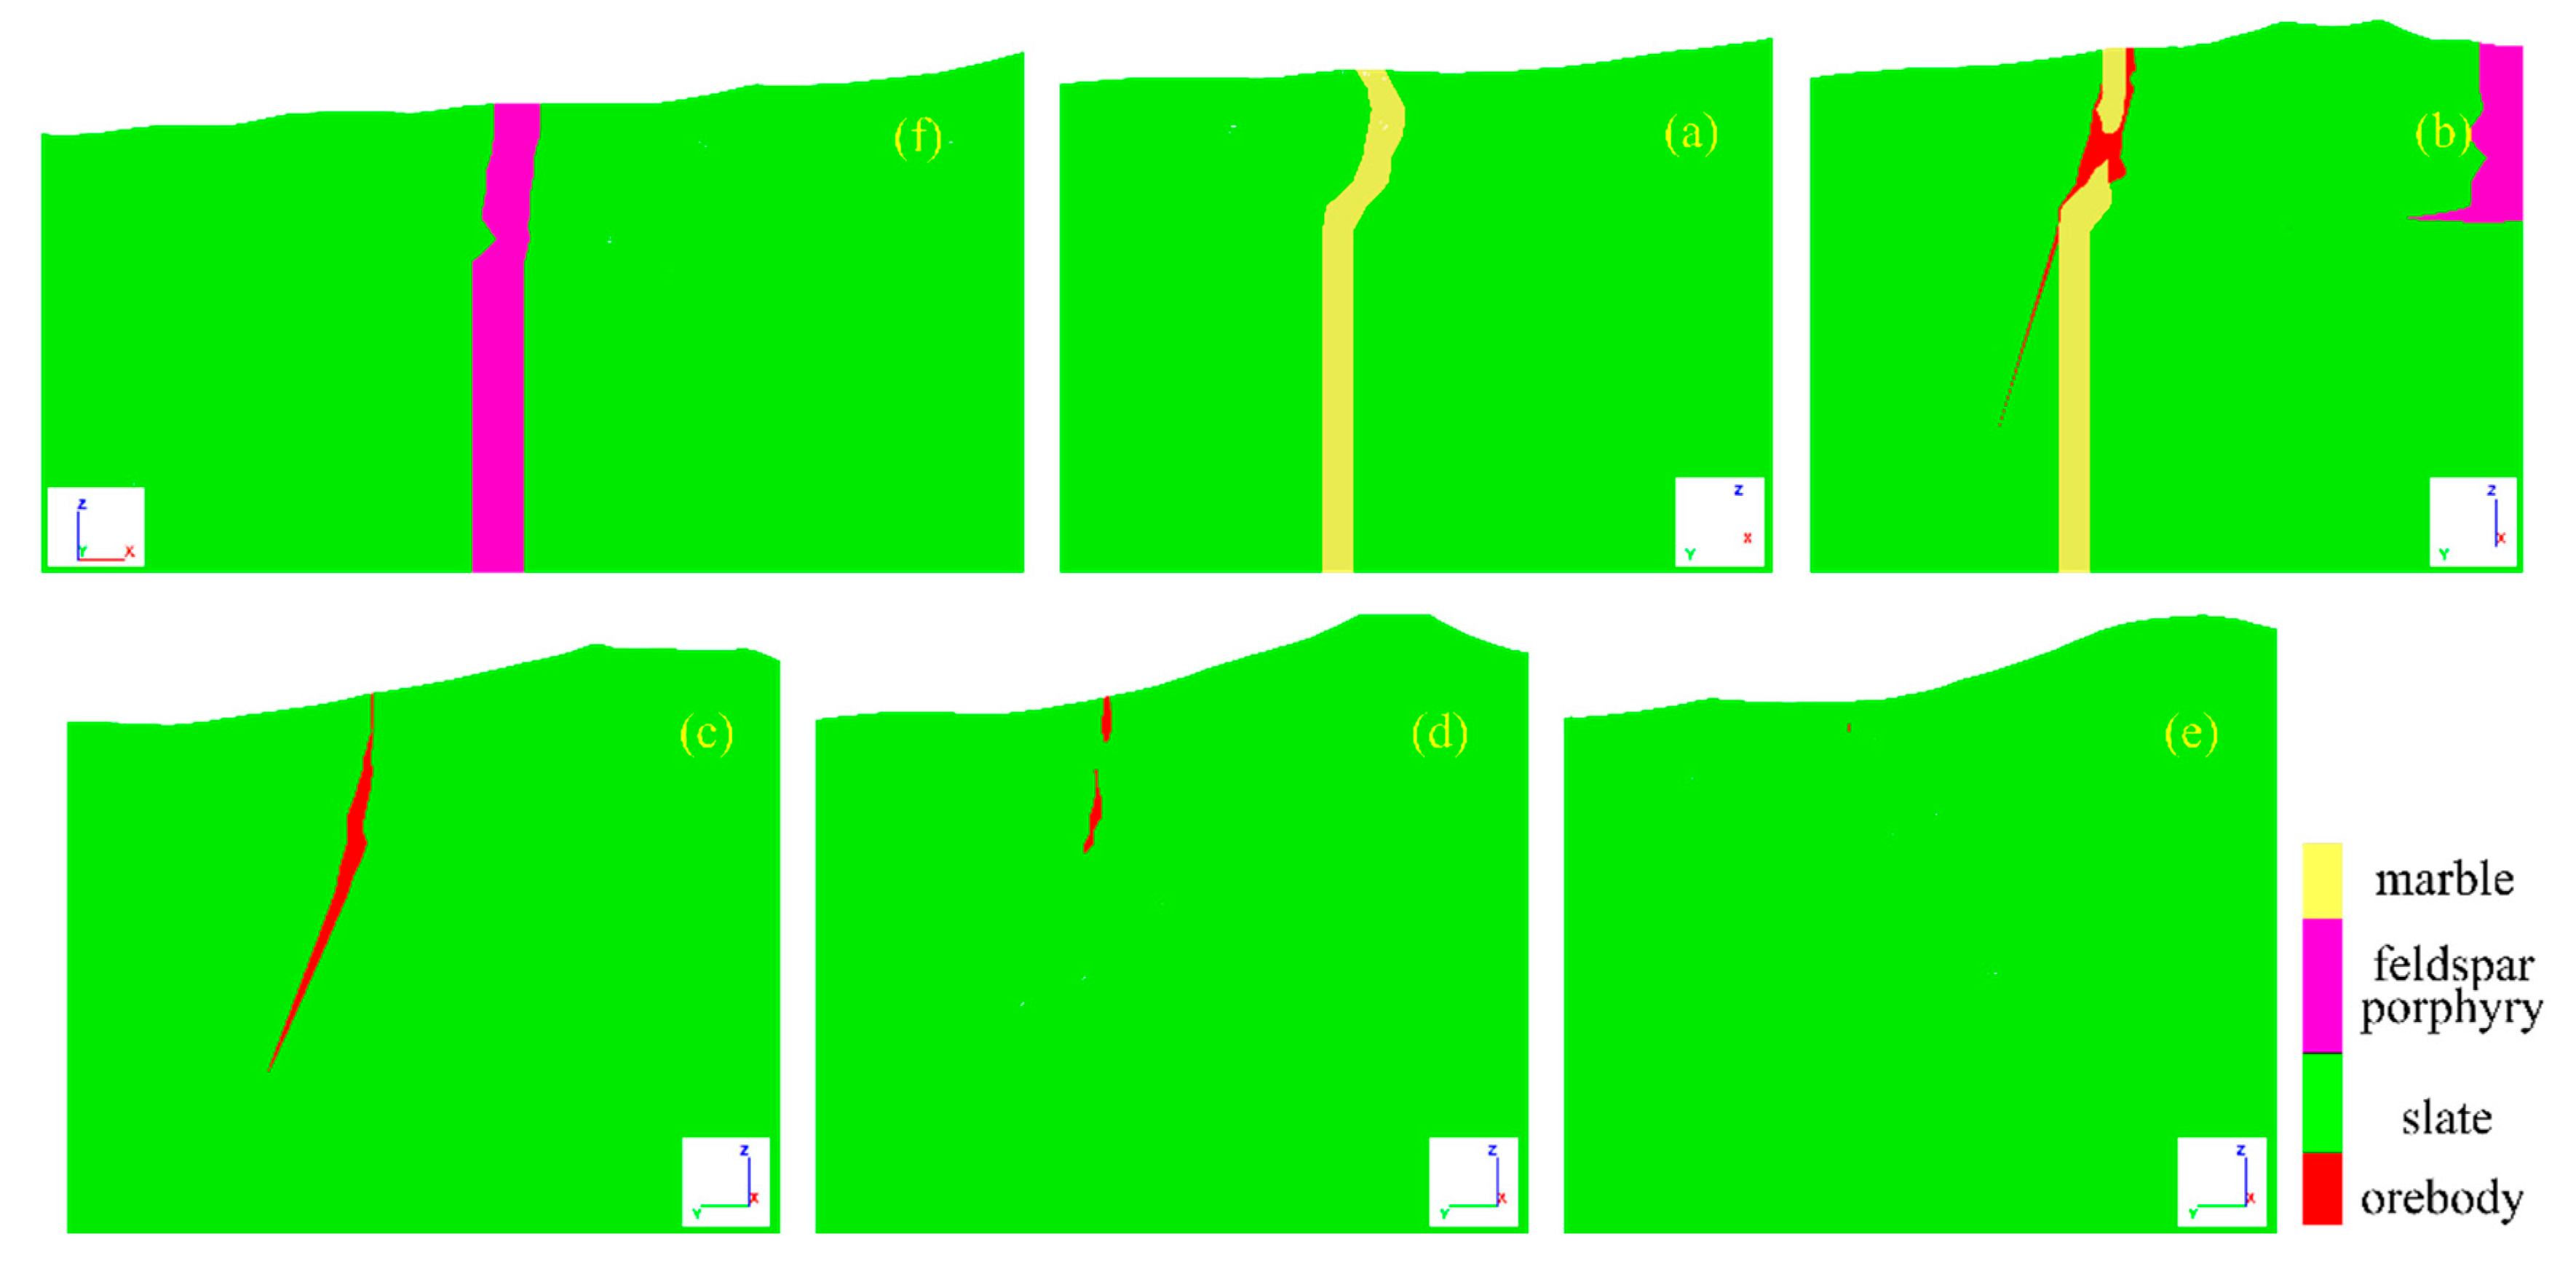
In order to better understand the size and position relationship of different rock masses, 6 sections were made for the model (Figure 14). The orebody was cut off by feldspar porphyry. The orebodies are roughly distributed between sections b and e (Figure 15). Section b shows that the marble near the surface is supported by orebodies. The main rock mass is slate.
6.2. In-Situ Stresses and Boundary Restrains
According to in-situ stress testing results by the acoustic emission method, the maximum horizontal principal stress, the minimum horizontal principal stress, and the vertical stress varied almost linearly with the depth. The in-situ stress was described by the following equations [33]:
where σhmax is the maximum horizontal principal stress, σhmin is the minimum horizontal principal stress, σz is the vertical stress, and h is the depth from the surface.
The in-situ stress field of the model was calculated by Equations (1)–(3). The results of fieldwork showed that the direction of maximum principal stress (σ1 = σhmax) ranged from 5° to 22°, and the direction of minimum principal stress (σ3 = σhmin) ranged from 185° and 202°. The intermediate principal stress (σ2 = σz) was in an almost vertical direction. The boundary restraints are shown in Table 2.
6.3. Parameters and Failure Criterion for Calculation
In 1980, Hoek and Brown proposed the original Hoek-Brown criterion considering the strength and integrity of rock mass [34]. The generalized Hoek-Brown criterion for the estimation of rock mass strength was introduced with some improved parameters in 1992 [35]. In 2002, the introduction of disturbance factor D improved the comprehensive and specific application of the Hoek-Brown criterion to the nonlinear failure of various rock masses [31]. In 2006, Hoek et al. revised the calculation of elastic modulus, as shown in Equation (4) [36].
The basic parameters input in FLAC3D were composed of the physical and mechanical properties of rock mass. The value of mi was determined according to the reference of Hoek et al.’s paper in 2000 [37]. The parameters of rock mass were calculated by the Hoek-Brown criterion from its corresponding laboratory test and field results, as shown in Table 3.
In the numerical simulation of rock engineering, the Mohr-Coulomb model’s safety factor is a little larger than the practical result. The introduction of the strain-softening Mohr-Coulomb model results in larger deformation of surrounding rock and deeper plastic zone and unstable zone. The strain-softening Mohr-Coulomb model can more reasonably reflect the stable state and rock mass’s deformation tendency [38]. The strain-softening Mohr-Coulomb model in FLAC3D is based on the Mohr-Coulomb model. The difference is that the cohesion, friction, dilation, and tensile strength will soften after the onset of plastic yield. In the Mohr-Coulomb model, those properties are assumed to remain constant.
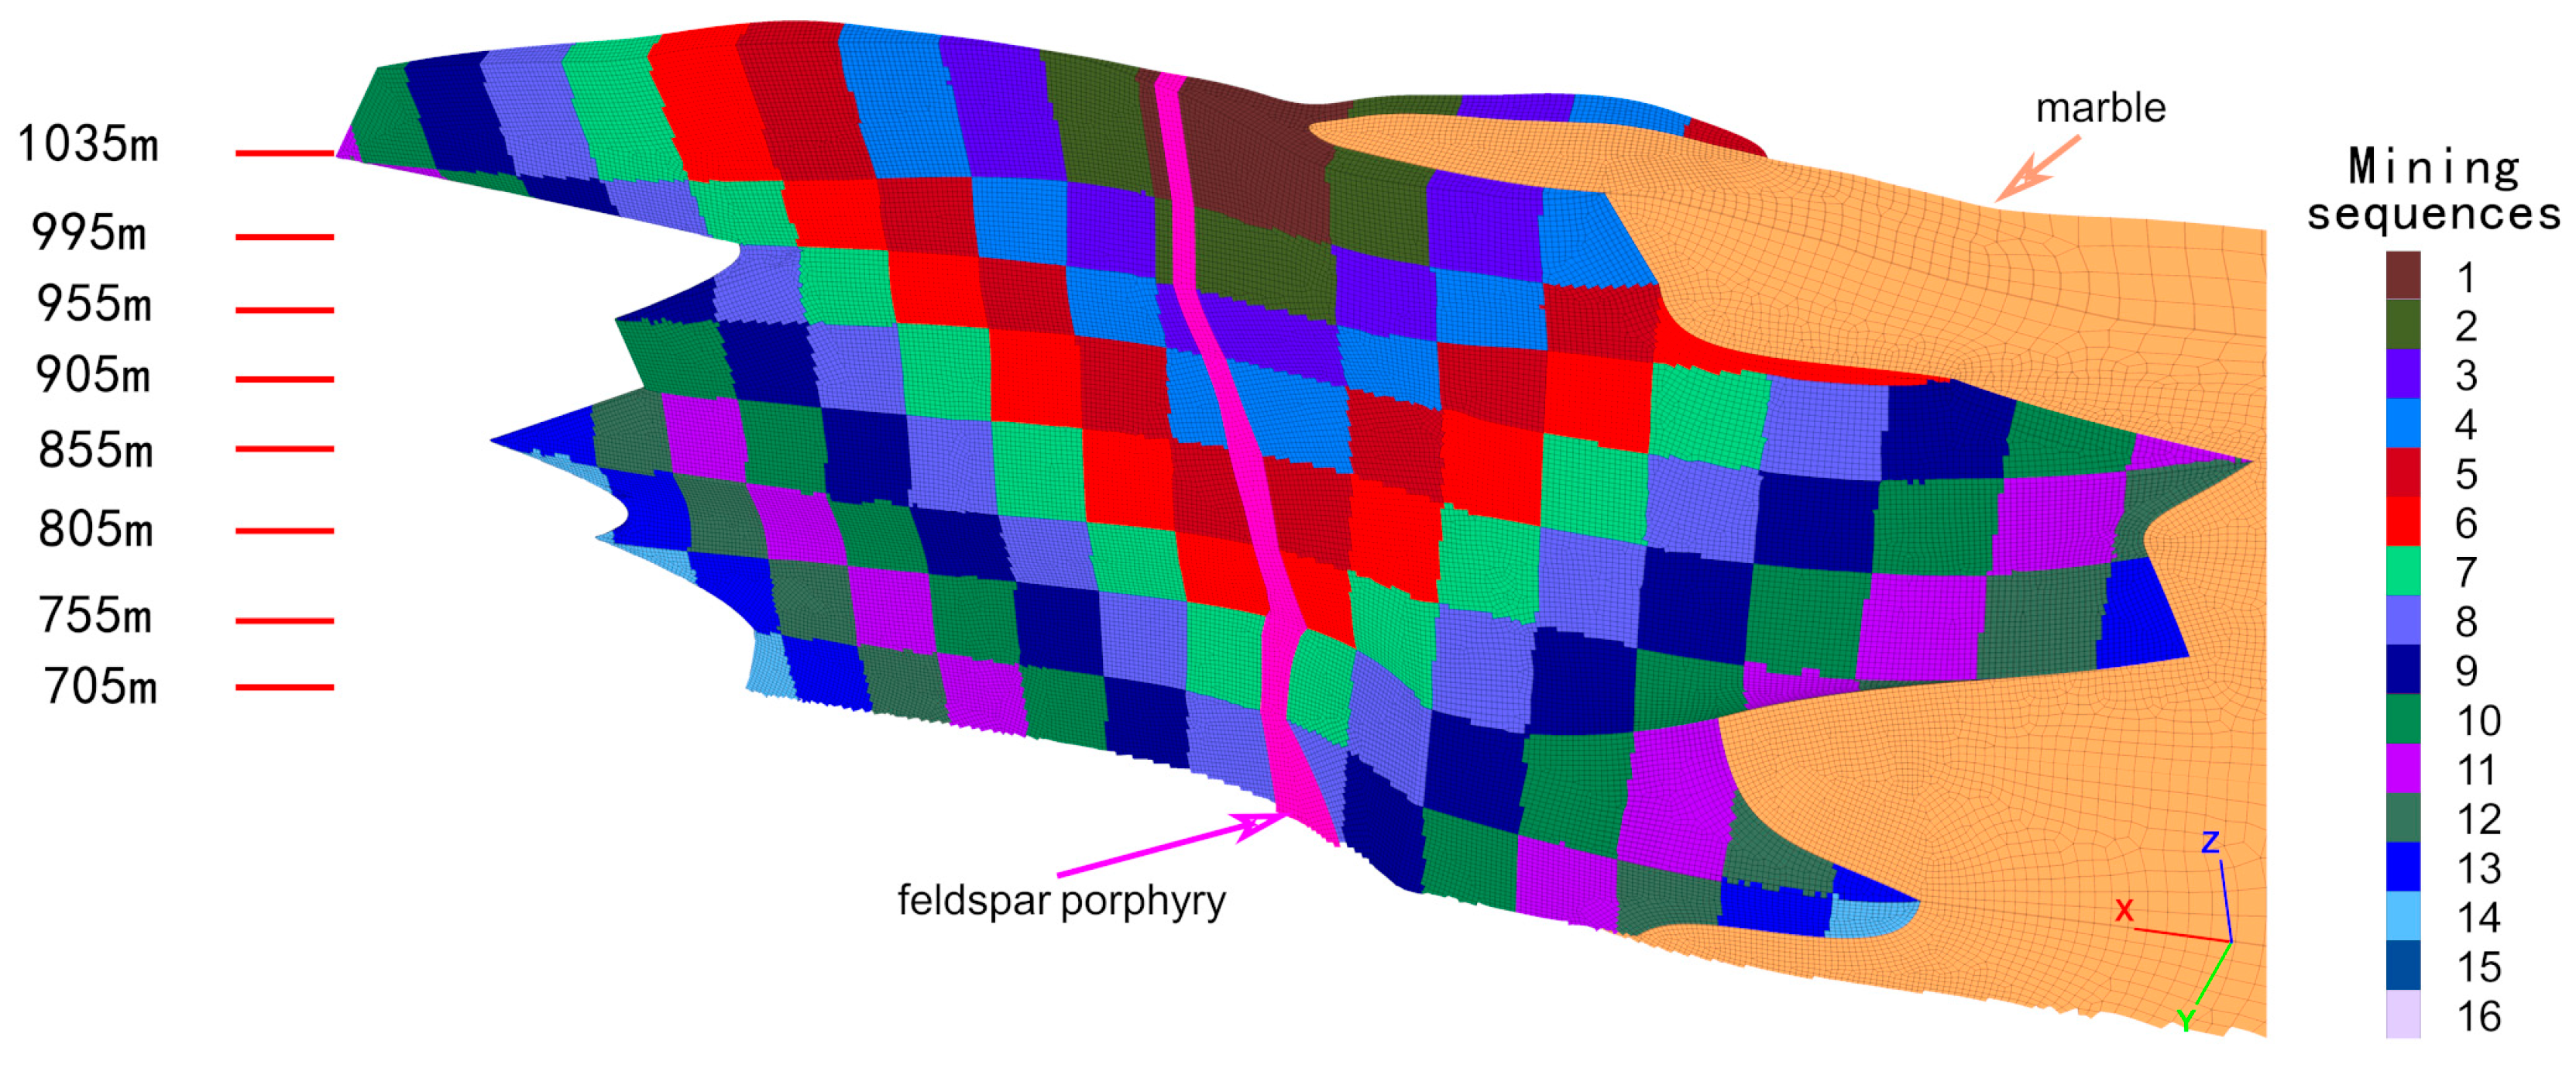
6.4. Mining Sequences
The mining sequence of the mine is downward from the center of the ore body to the two wings. The upper level is ahead of one stope in the neighbour mining level, as shown in Figure 16. The simulation steps are determined according to the progress of the mine. The same color area is shown in Figure 16 for each excavation. The displacement, damage and surface collapse as the mining process are analyzed by FLAC3D.
6.5. Results of Numerical Simulation
There were two kinds of fractures in the subsidence area of Hongling Lead-Zinc Mine, namely tensile fracture and collapse-induced fracture. Tensile fractures were caused by tensile stress exceeding the tensile strength of surface soil or rock mass, with characteristics of small width and depth, same strike with orebody and development ahead of mining faces. Collapse-induced fractures were caused by collapses of mine-out areas, surrounding rock and surface, with characteristics of longitudinal subsidence, large depth and development later than mining faces [39]. The results of numerical simulation illustrated the evolution of stress field, displacements and plastic zones with the mining process. The displacement and failure of surrounding rocks (feldspar porphyry, marble and slate) were analyzed from the perspectives of displacement, plastic zone, maximum principal stress and minimum principal stress.
6.5.1. Analysis of Feldspar Porphyry
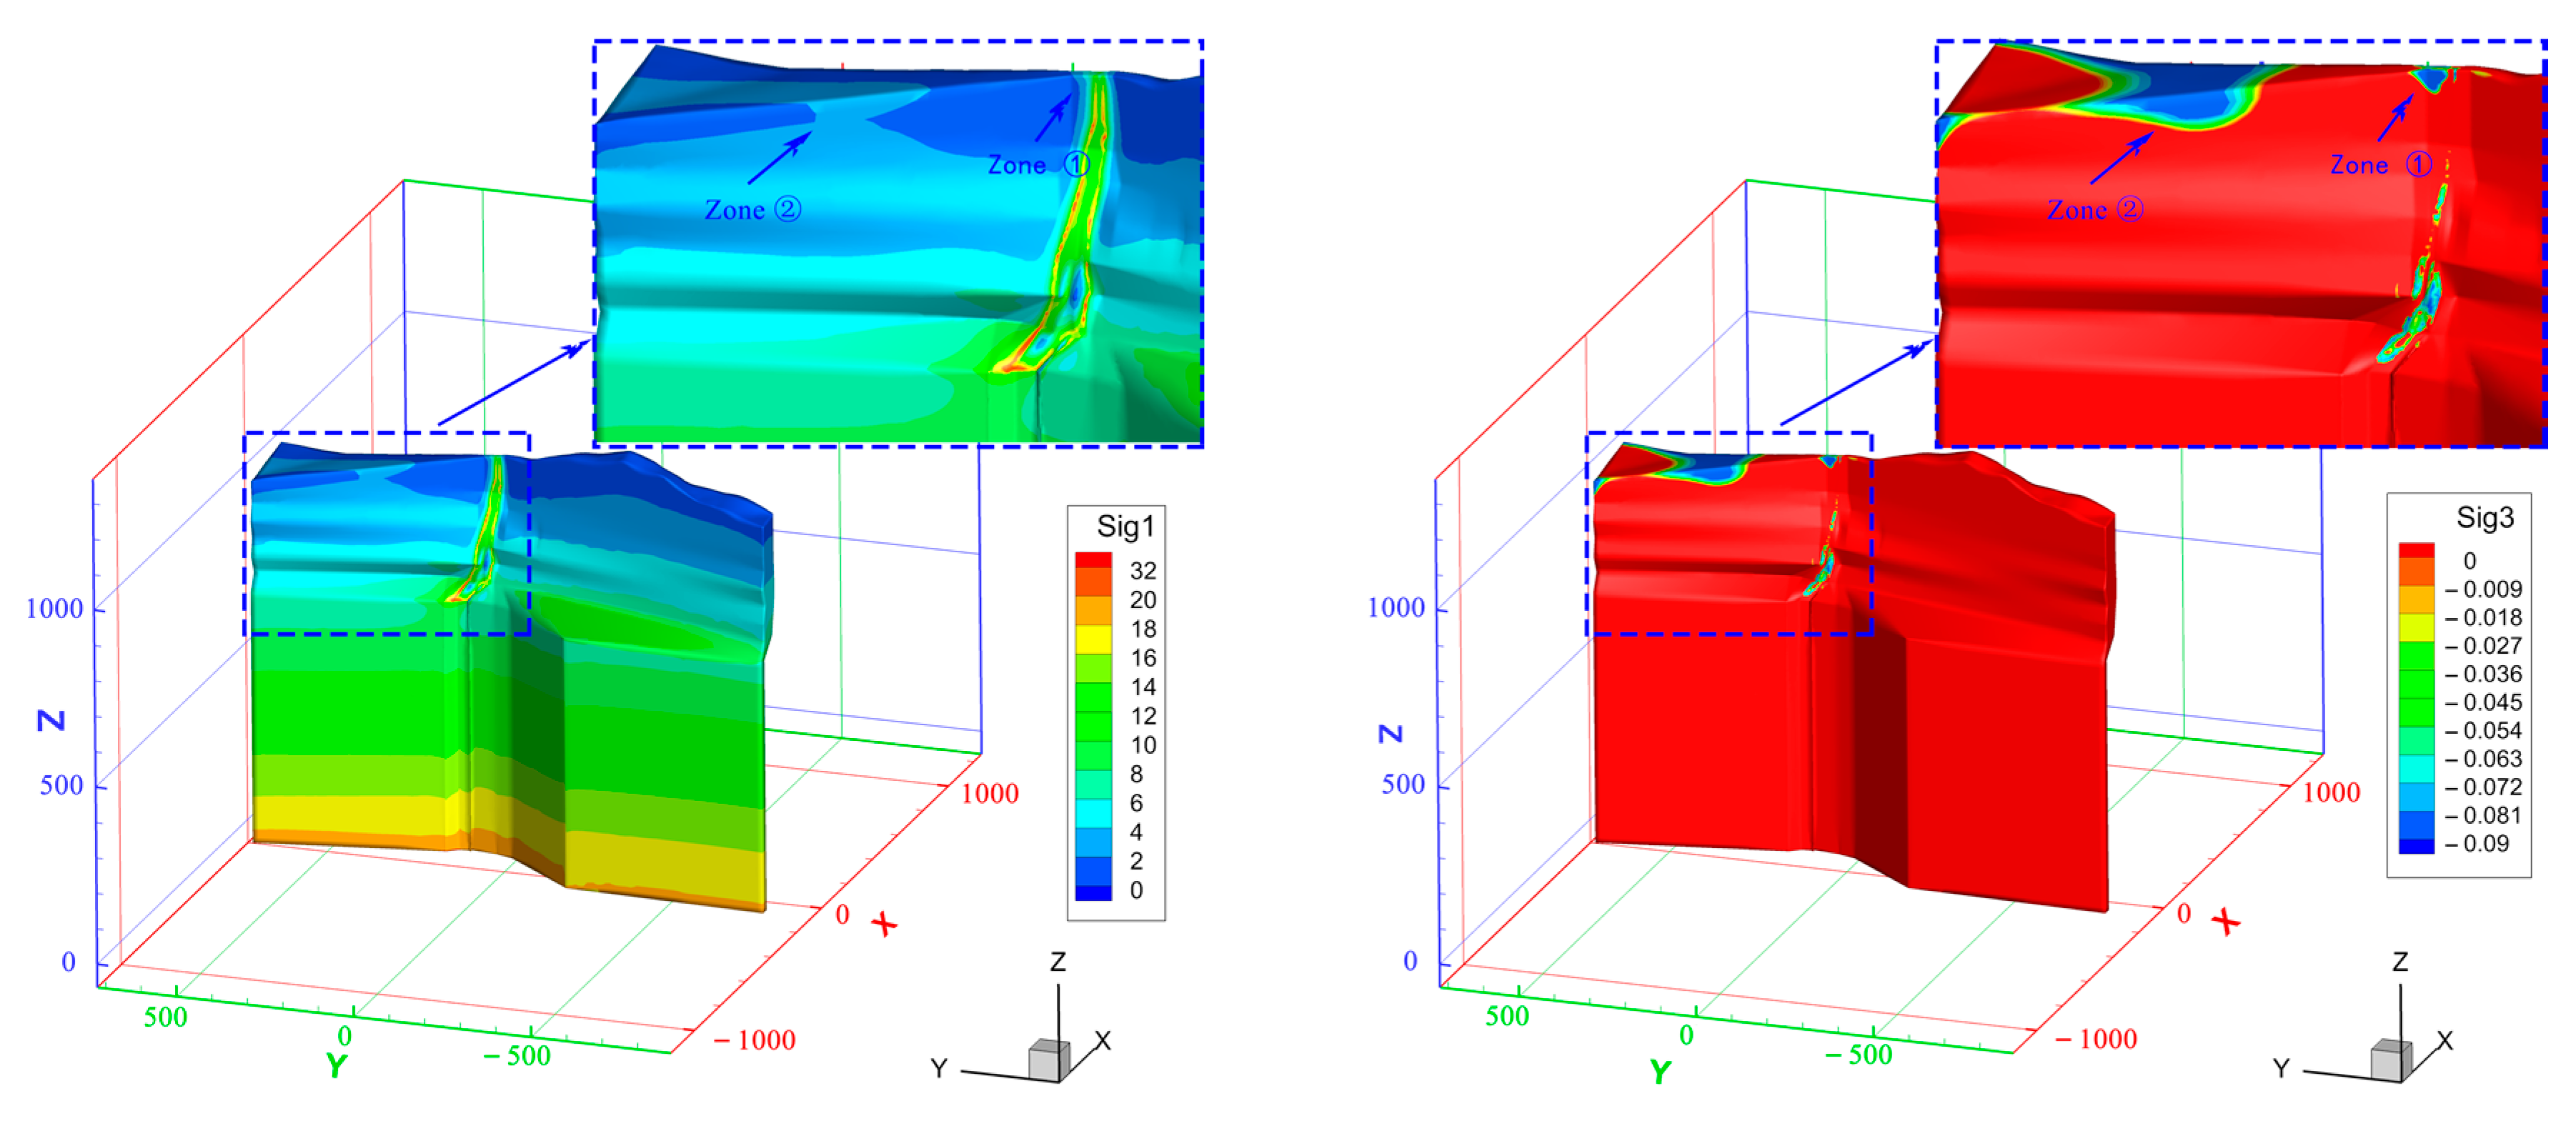
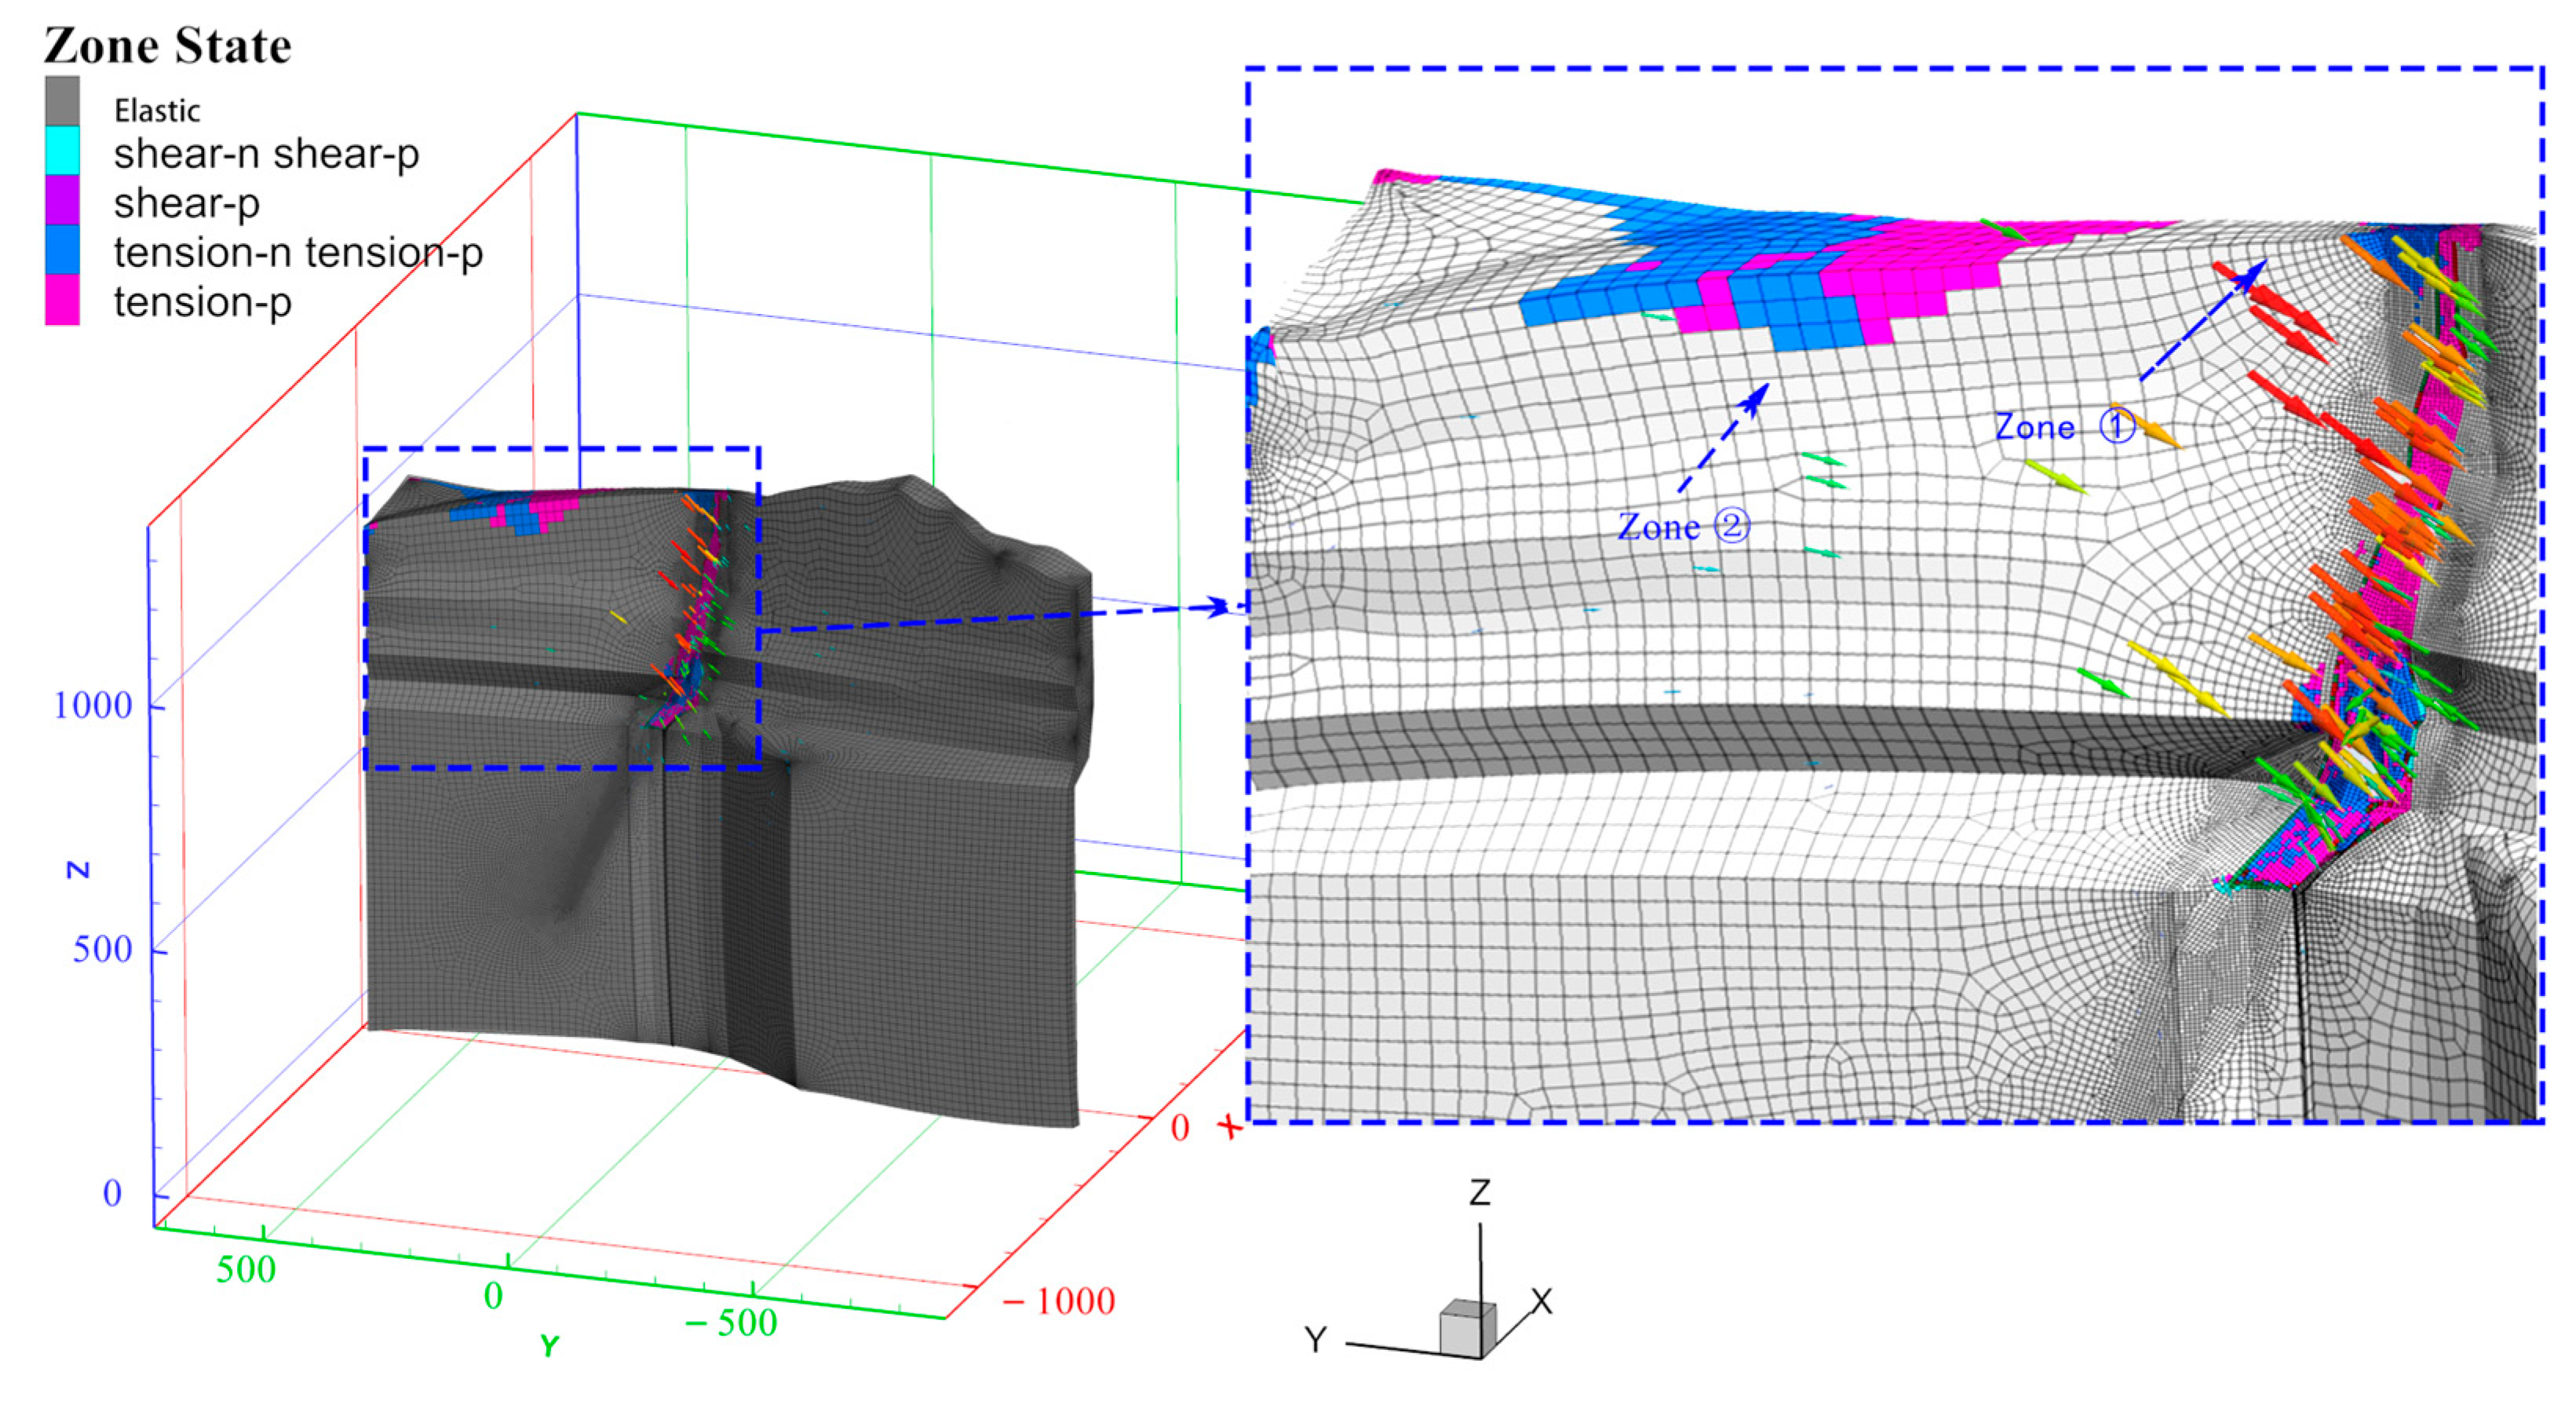
As shown in Figure 17, there was a significant increase of maximum principal stress and obvious stress concentration at the intersection with the orebody, with the stress value of 32 MPa. There were two zones where the hanging wall feldspar porphyry was in tension state and even in tensile failure: ① Adjacent to the hanging wall of the orebody, the length in the dip direction is about 30 m, almost in tensile plastic (as shown in Figure 18); ② It is located in 225–447 m away from hanging wall of the orebody and about 202 m in dip direction, The tensile plastic zone is located 341–447 m away from the hanging wall of the ore body. The feldspar porphyry at the intersection of orebodies was in plastic state with a small part in tensile plastic and the majority in shear yielding. The comprehensive analysis revealed that: the intersection of the feldspar porphyry was fully plastic, and the hanging wall of 30 m range of non-feldspar porphyry was also fully plastic; there was an overall collapse in this area, with strike toward the orebody and a largely wide fracture on the surface; in zone ②, there would be tensile fractures distributed in the hanging wall of ore body about 341–447 m.
6.5.2. Analysis of Marble
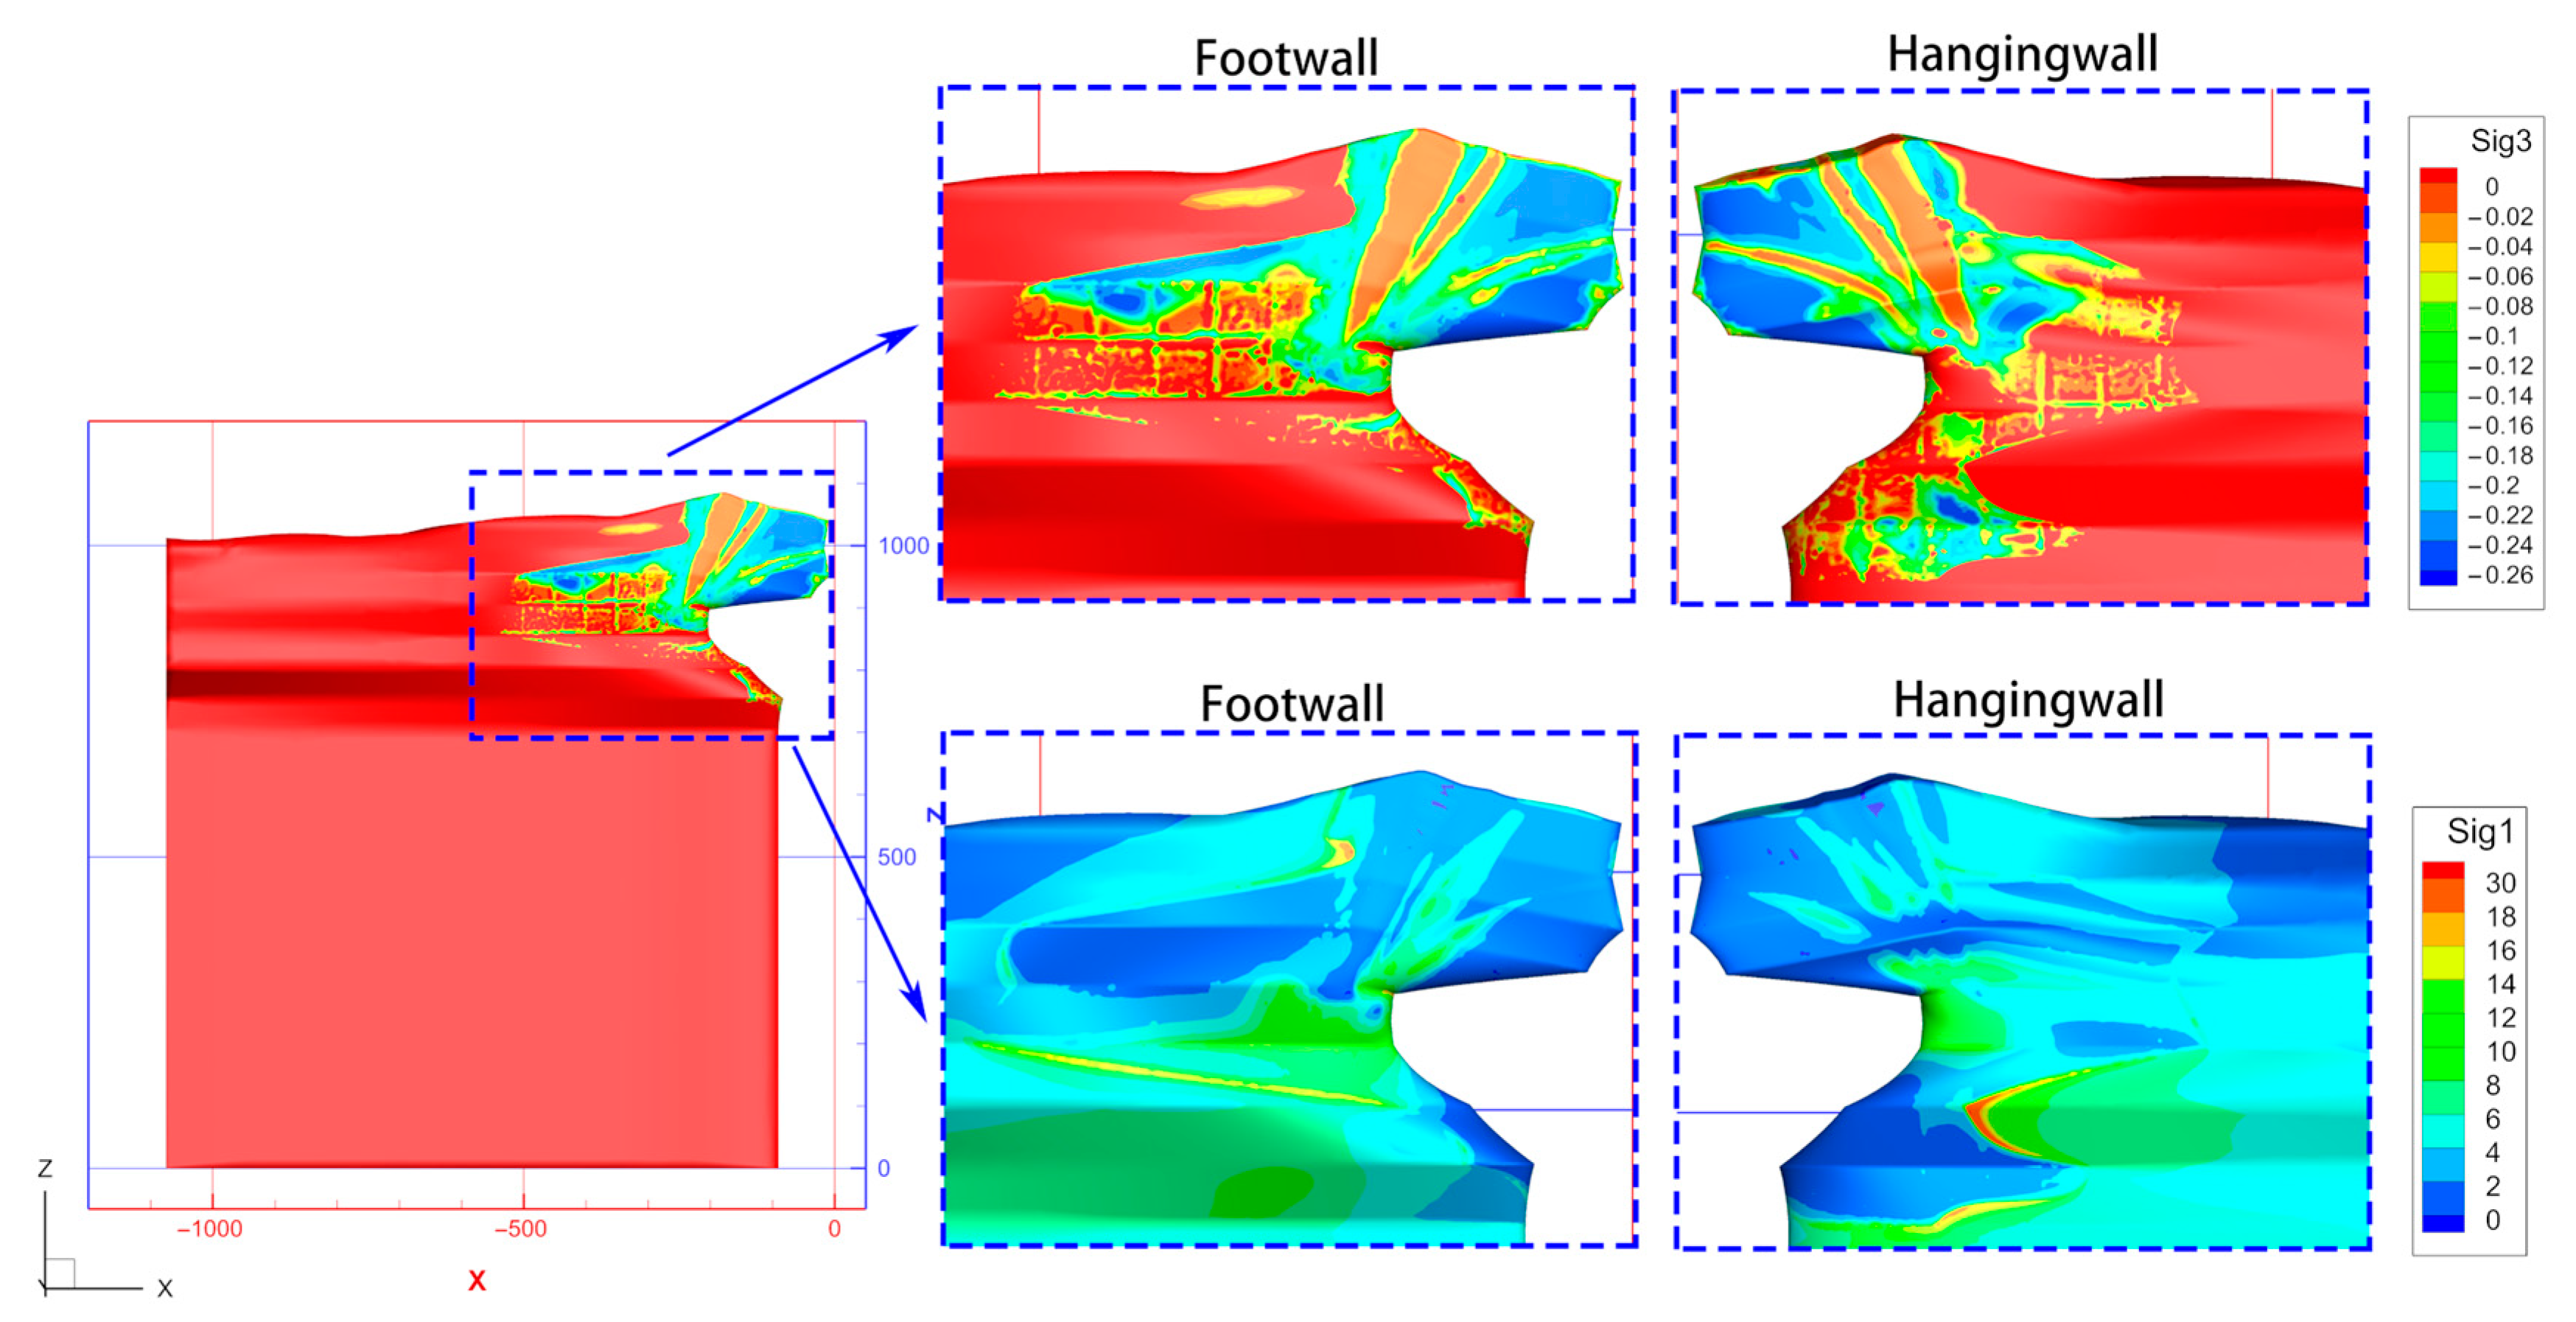
As shown in Figure 19, there was obvious stress concentration at x = −240, z = 800 m (hangingwall) and x = −240, 1020 m (footwall) with the maximum principal stress of 30 MPa. The tensile stress concentration of the marble suspended part was clear, with the stress value close to the tensile strength of rock mass.
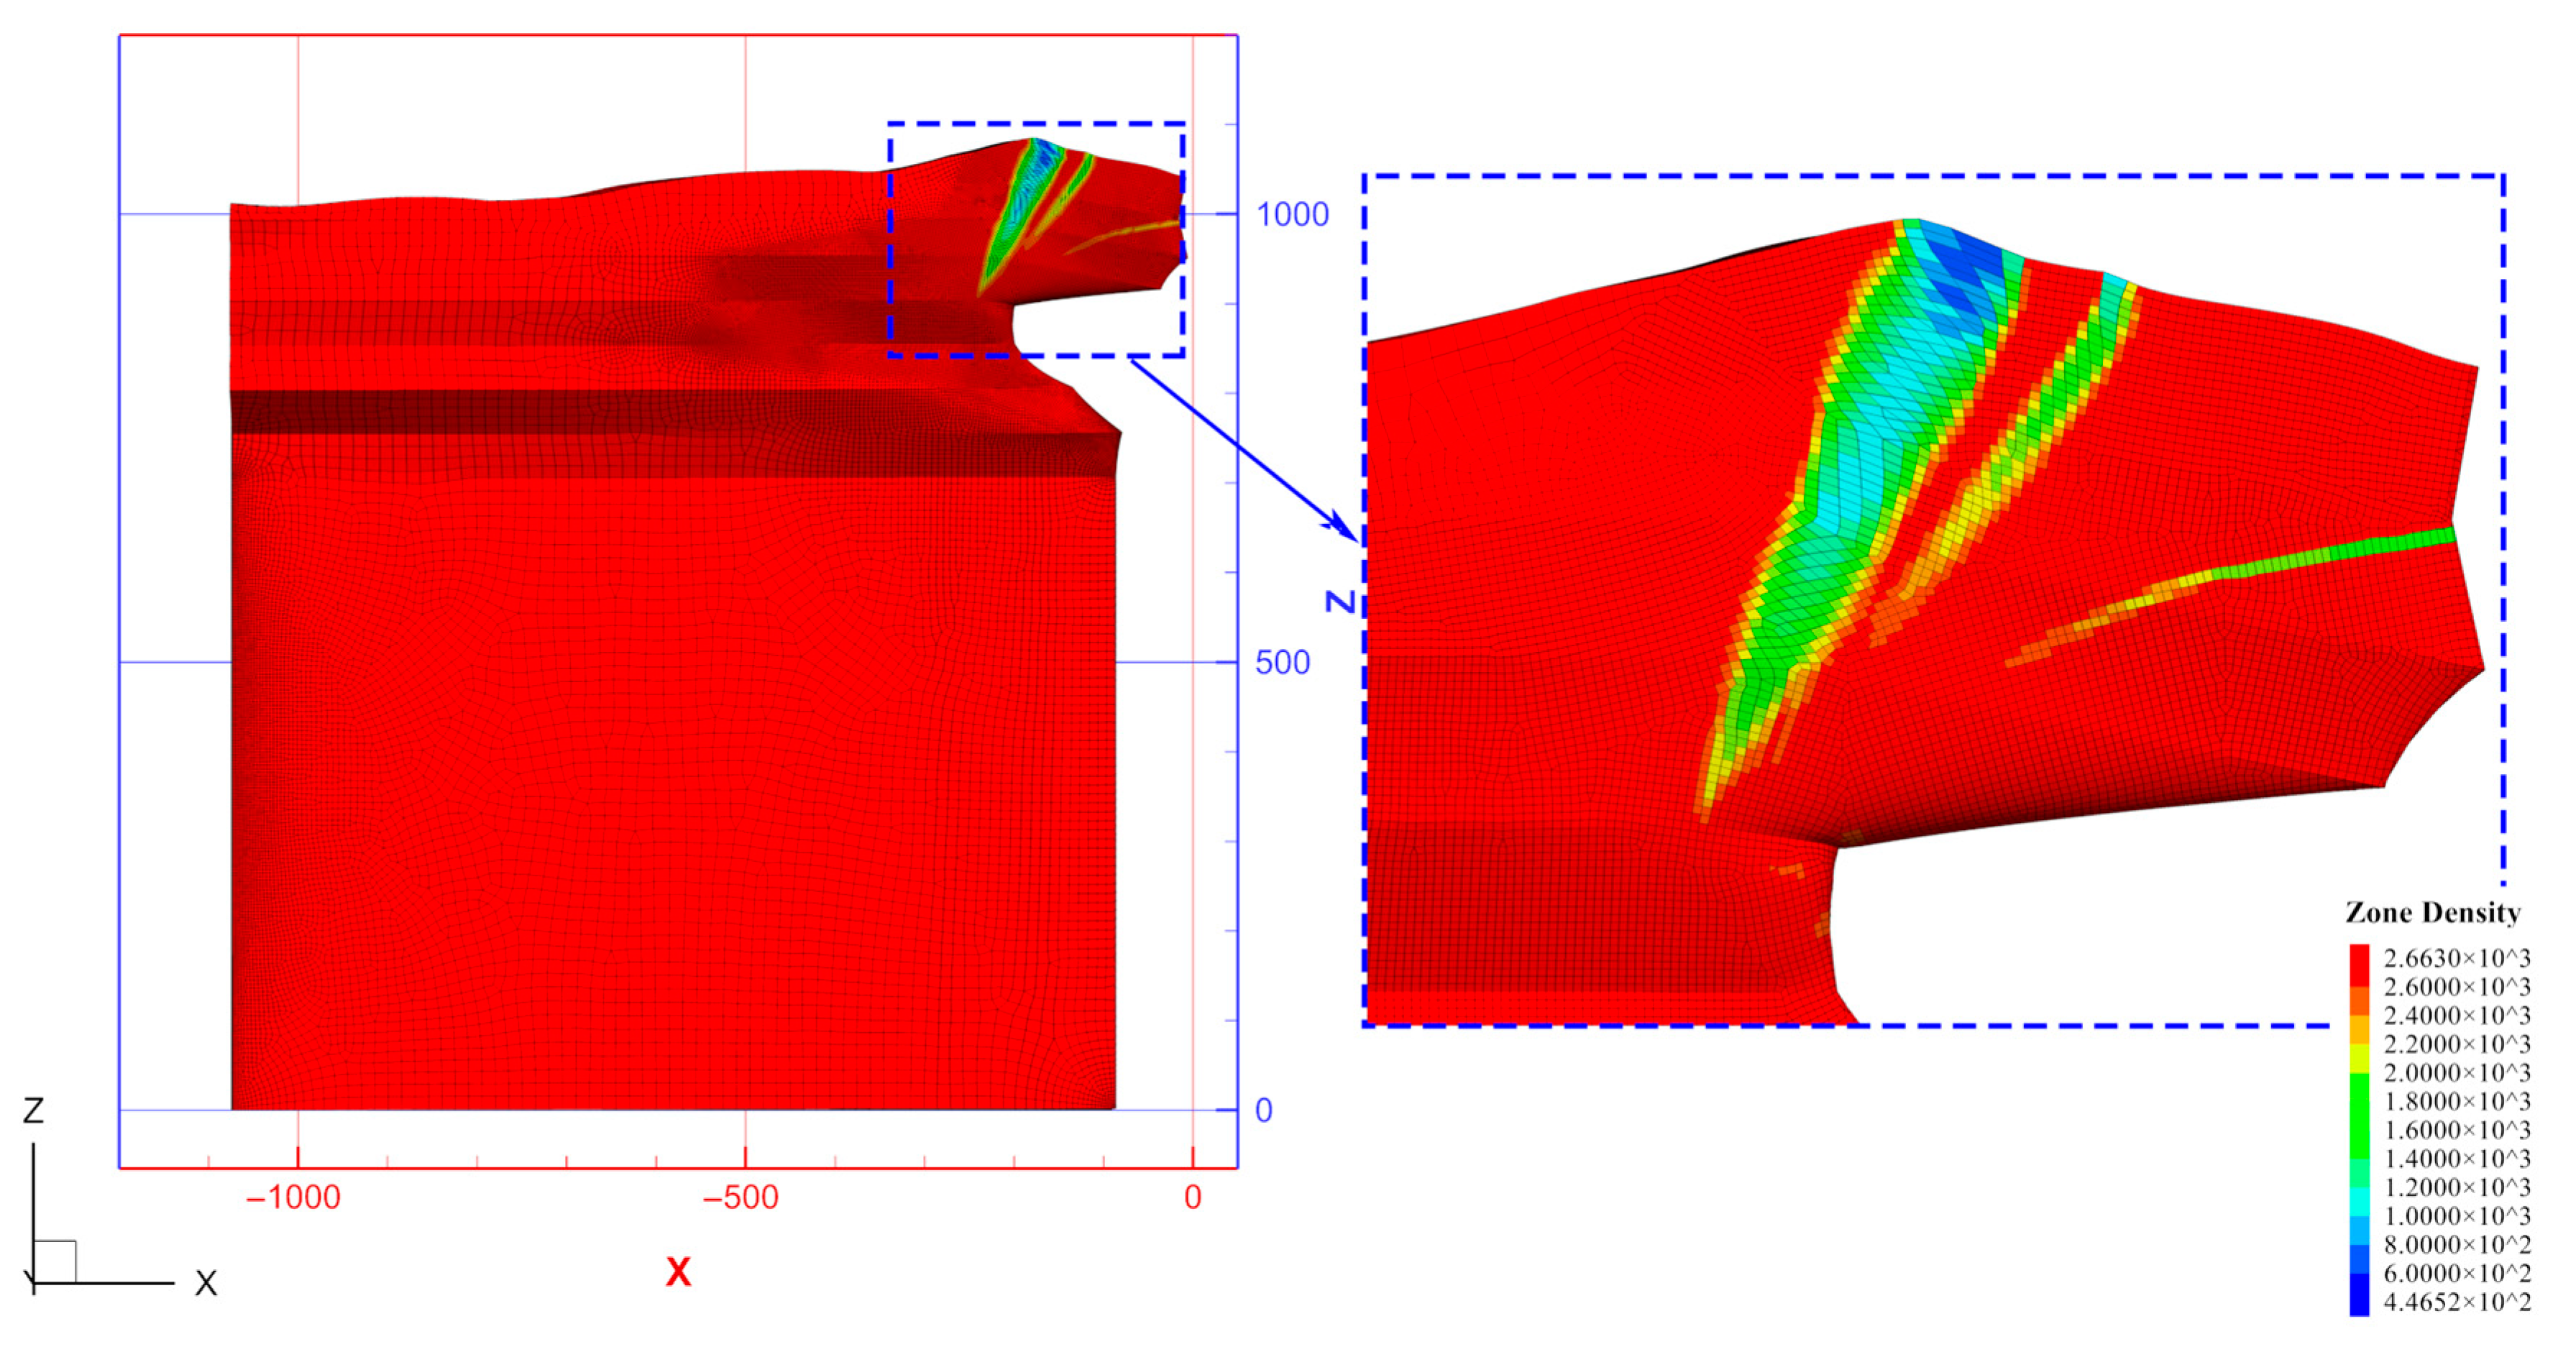
The nephogram of the plastic zone in Figure 20 showed that this part was mainly tensile plastic zone, and there were three-strip areas with the minimum principal stress close to 0 in the suspended part. Combined with Figure 21, the strip areas were due to non-uniform deformation, significant local tensile deformation, volume increase, and reduction of density during displacement. There was apparent maximum principal stress concentration in the non-suspended part of marble with a mixed plastic zone of shear and tensile plastic (Figure 19 and Figure 20). According to the displacement vector diagram in Figure 22, the displacement form of the suspended part was mainly subsidence with torsion, and the maximum displacement reached 49 m. Marble was located in the middle of the orebody, and both the hanging and foot walls were orebody. After mining the orebody, the hanging and foot walls and the lower part had no supporting, and the upper outcrops were free. The marble (z = 900–1100 m) in the southwest wing of the orebody was suspended in the rock mass, to support unmined orebody, whose contact near the surface was bearing the weight of the whole marble mass, and the stress state was similar to the cantilever beam and in a very dangerous situation. At this time, the whole marble mass was in a tension stress field under the loading of its self-weight, and the tensile stress value was quite large, resulting in a seriously tensile stress concentration point at the contact of the surface and the surface subsidence at the southwest wing of the surface characterized by large range and depth.
6.5.3. Analysis of Slate
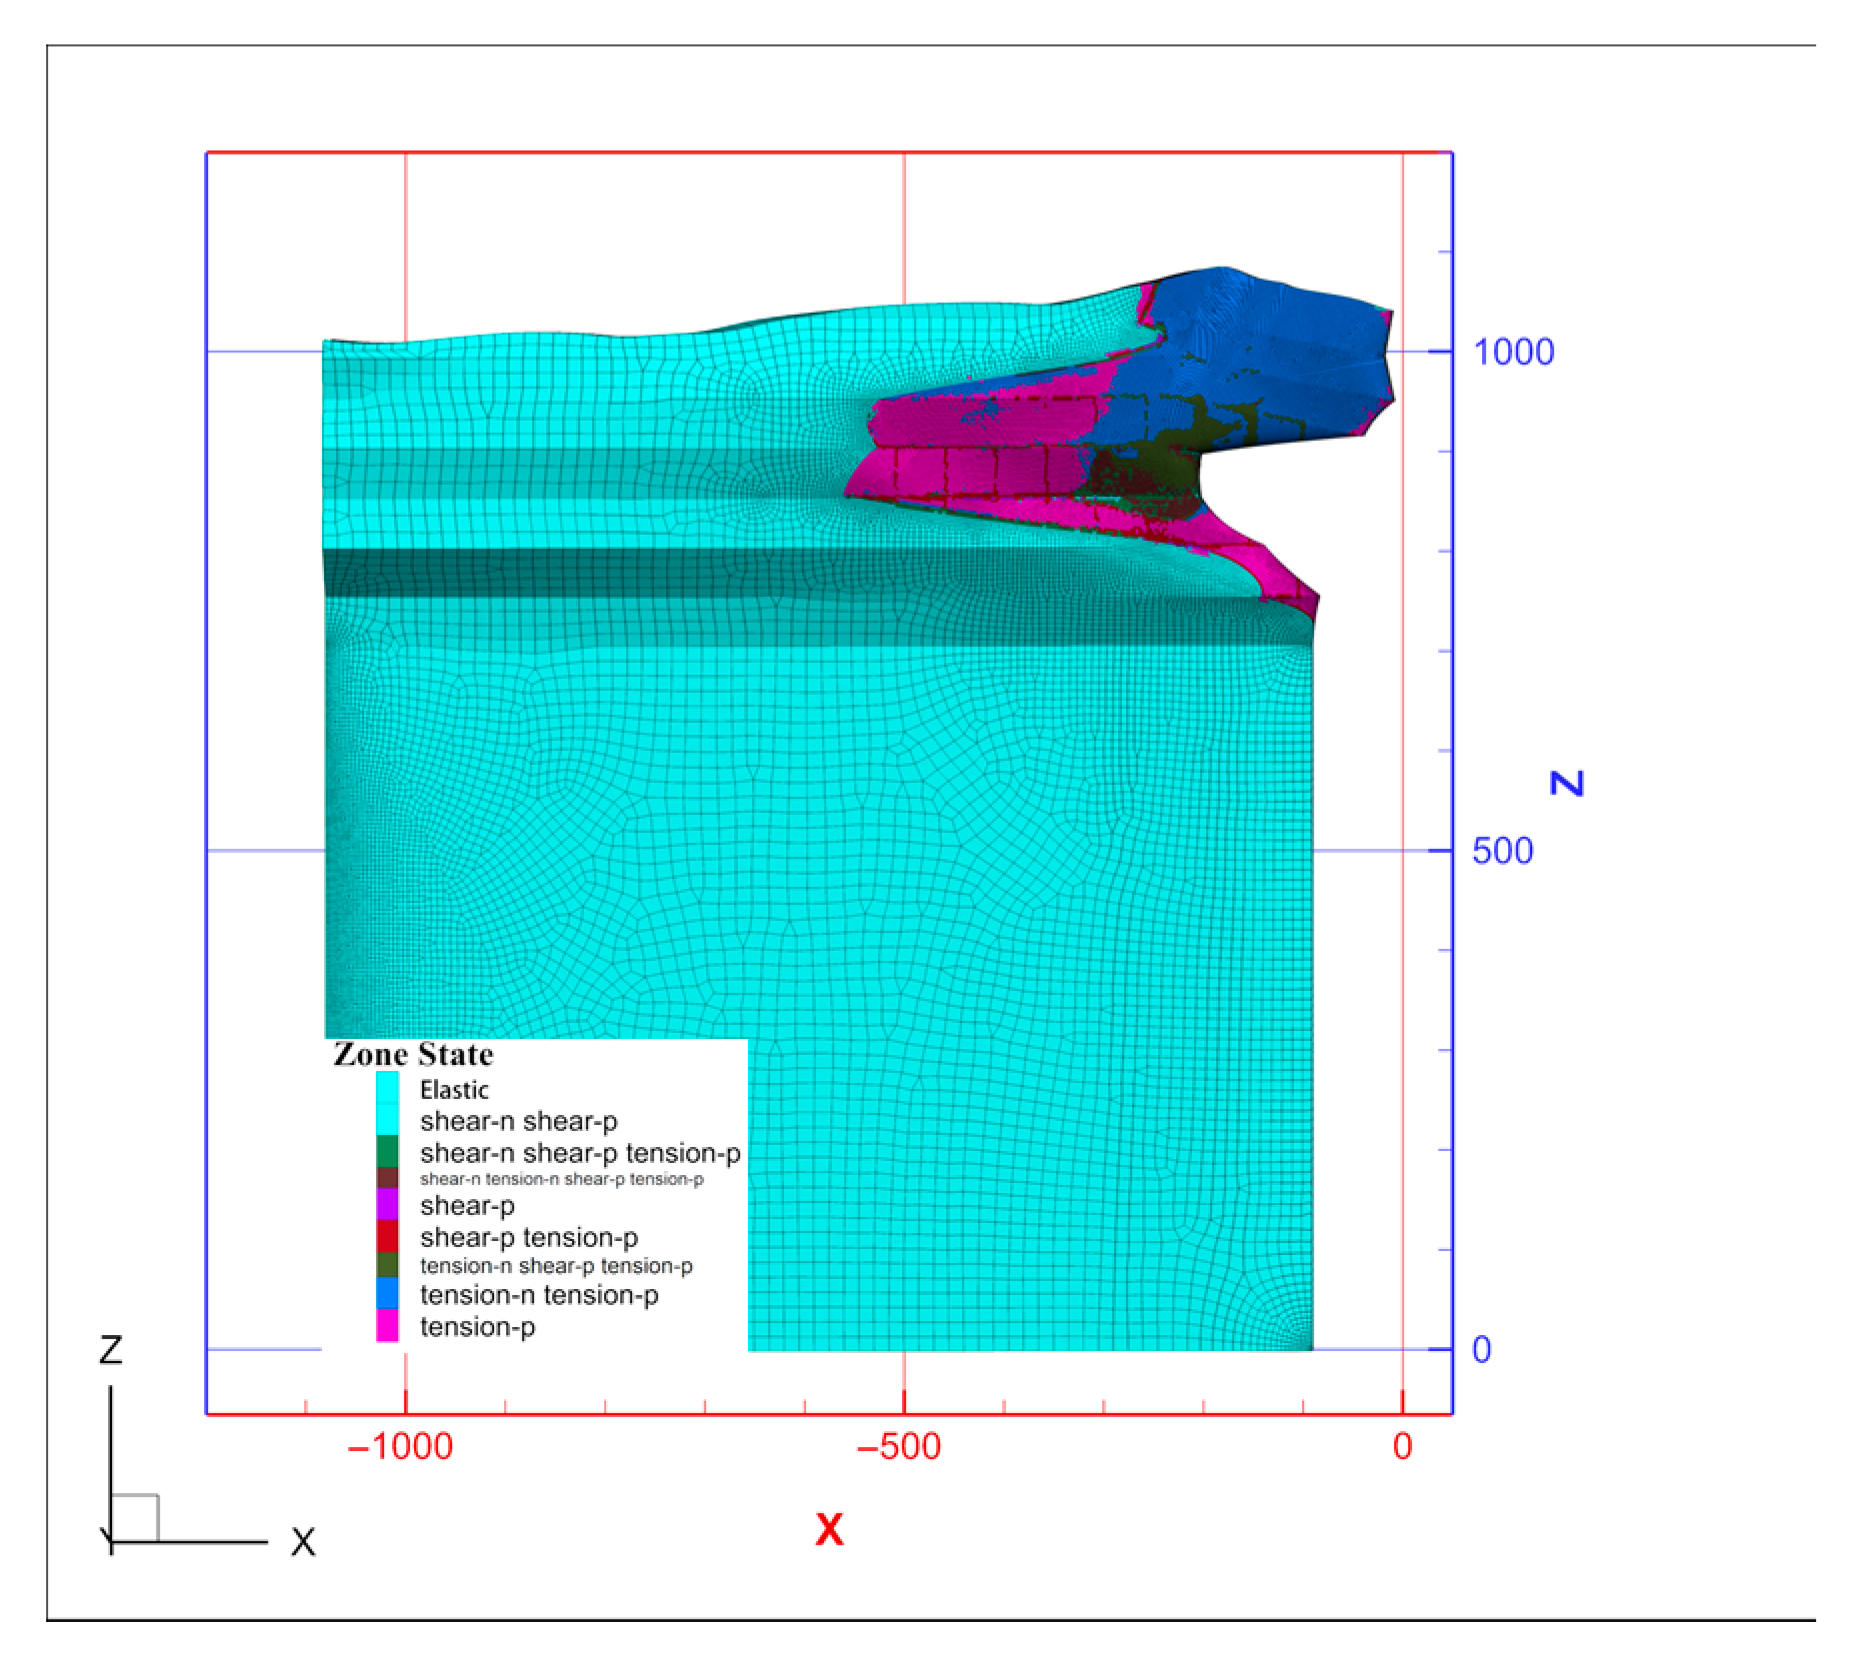
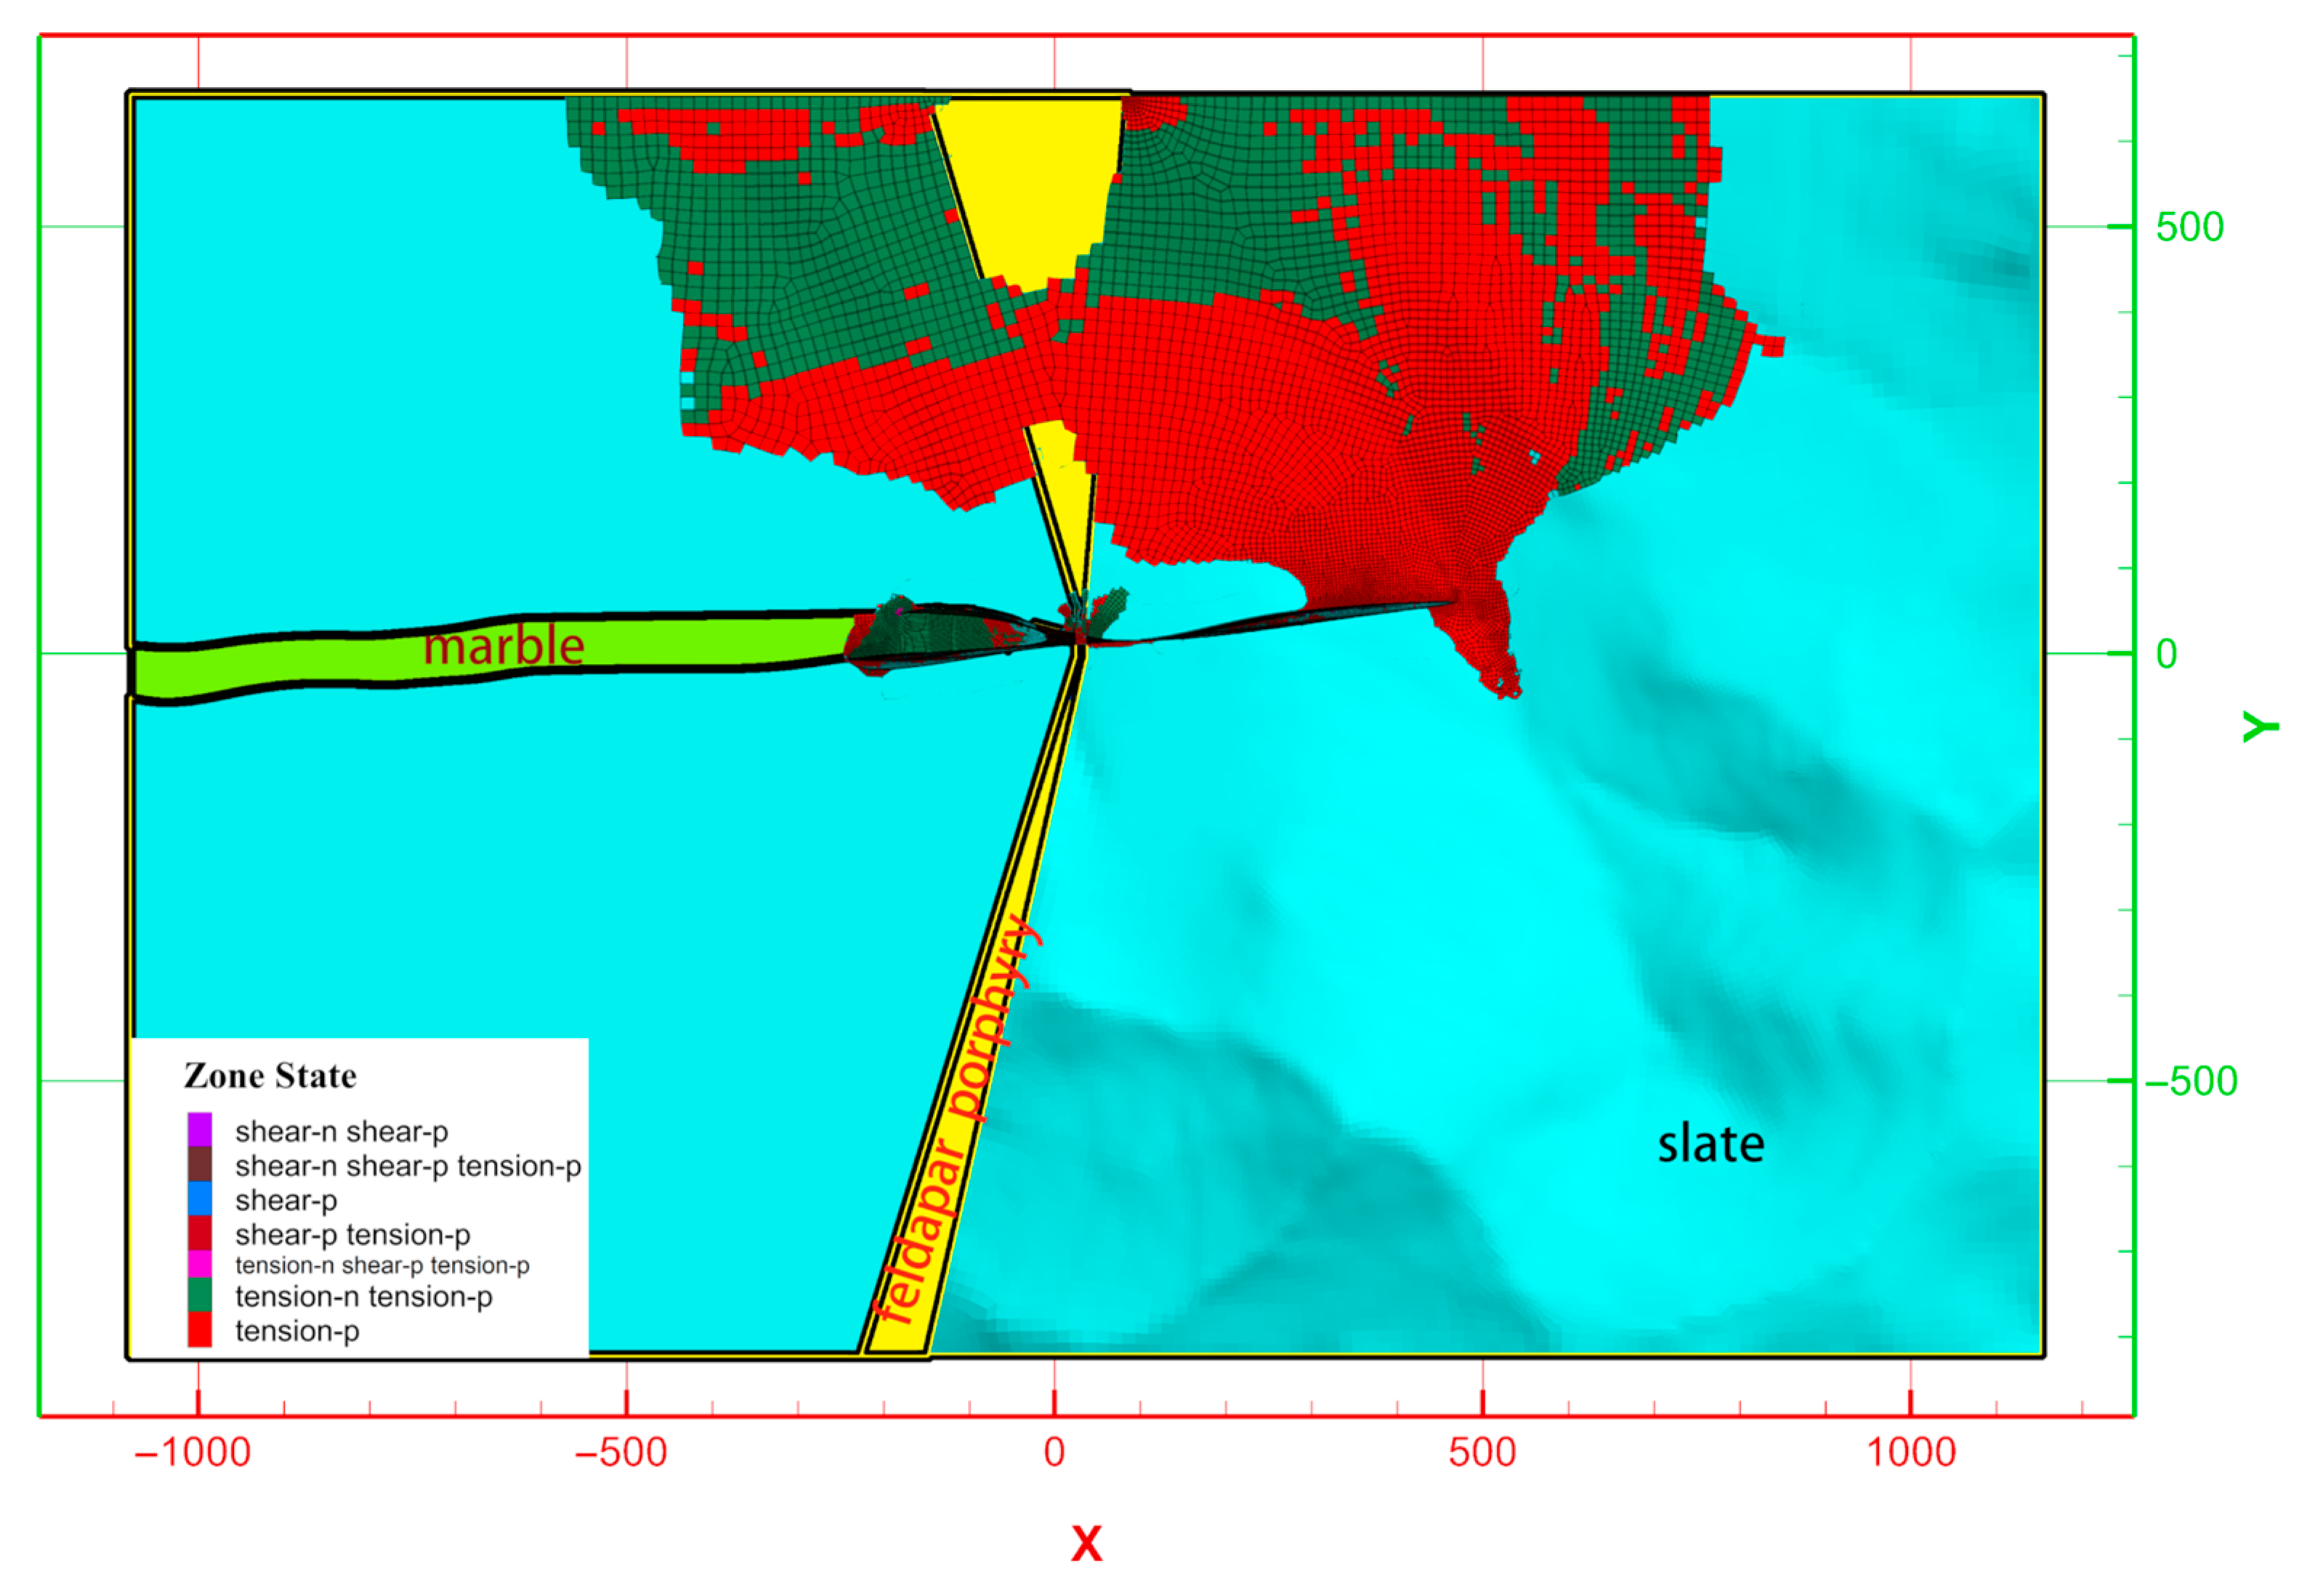
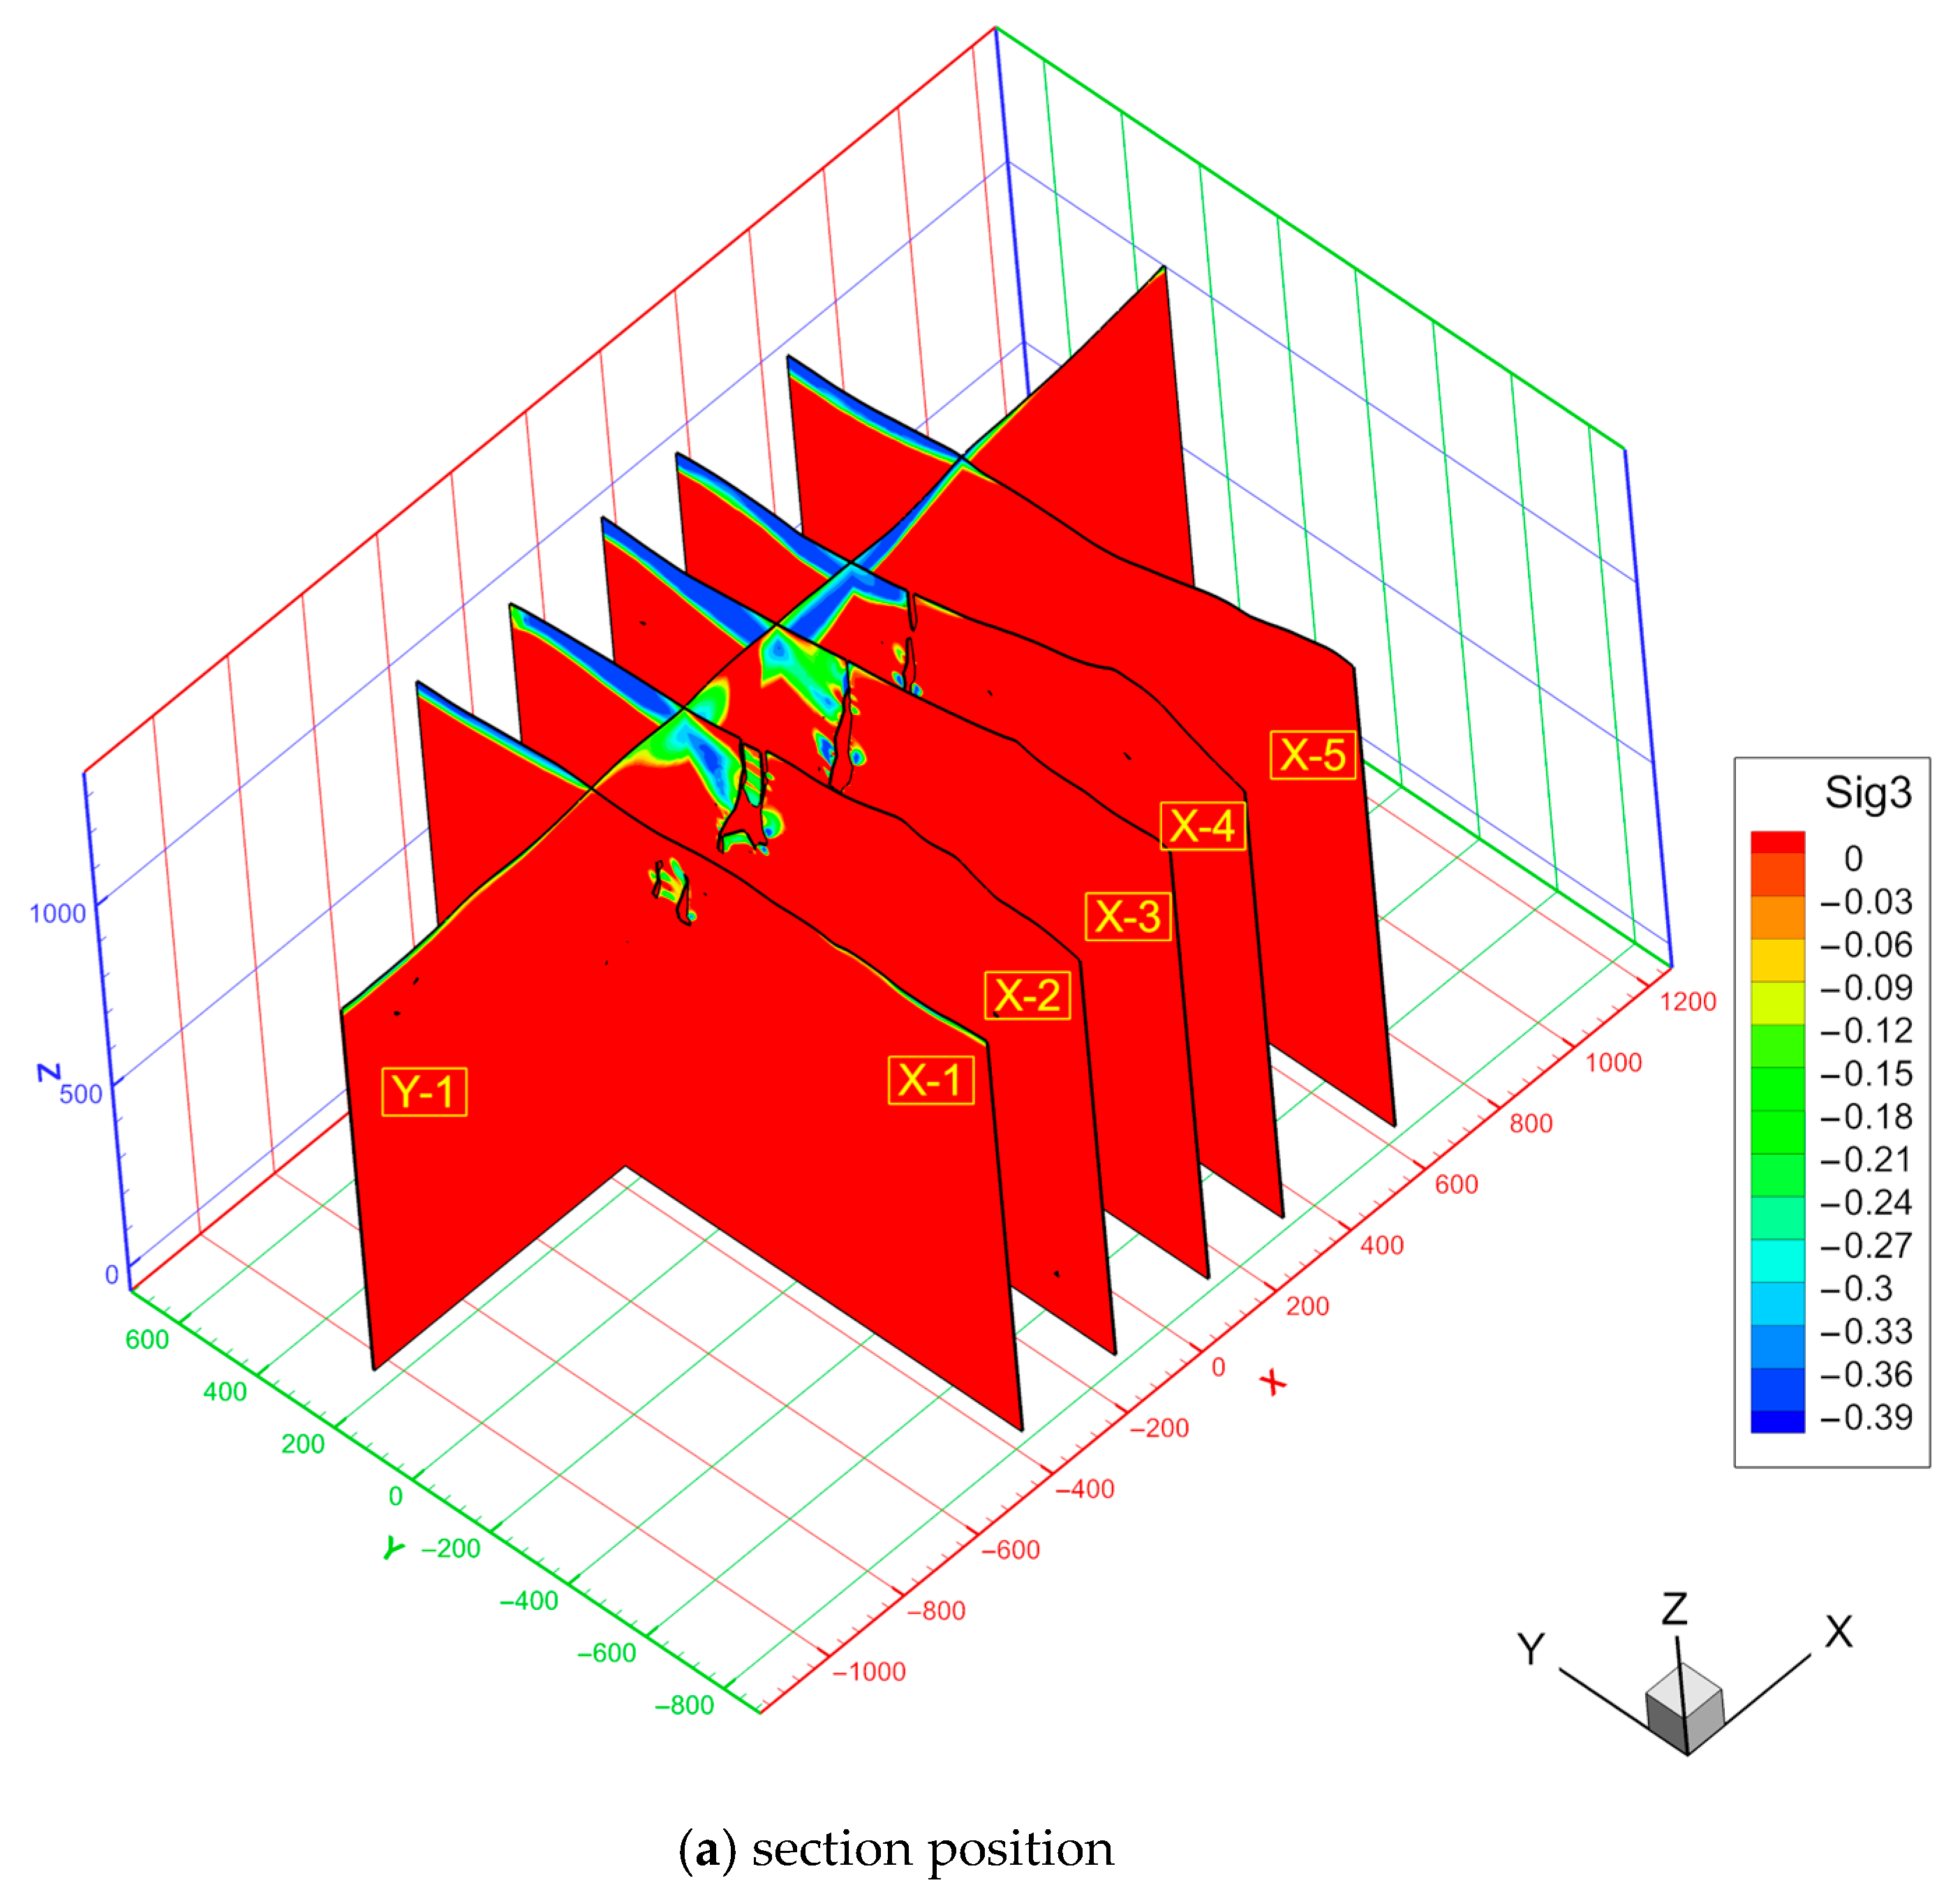
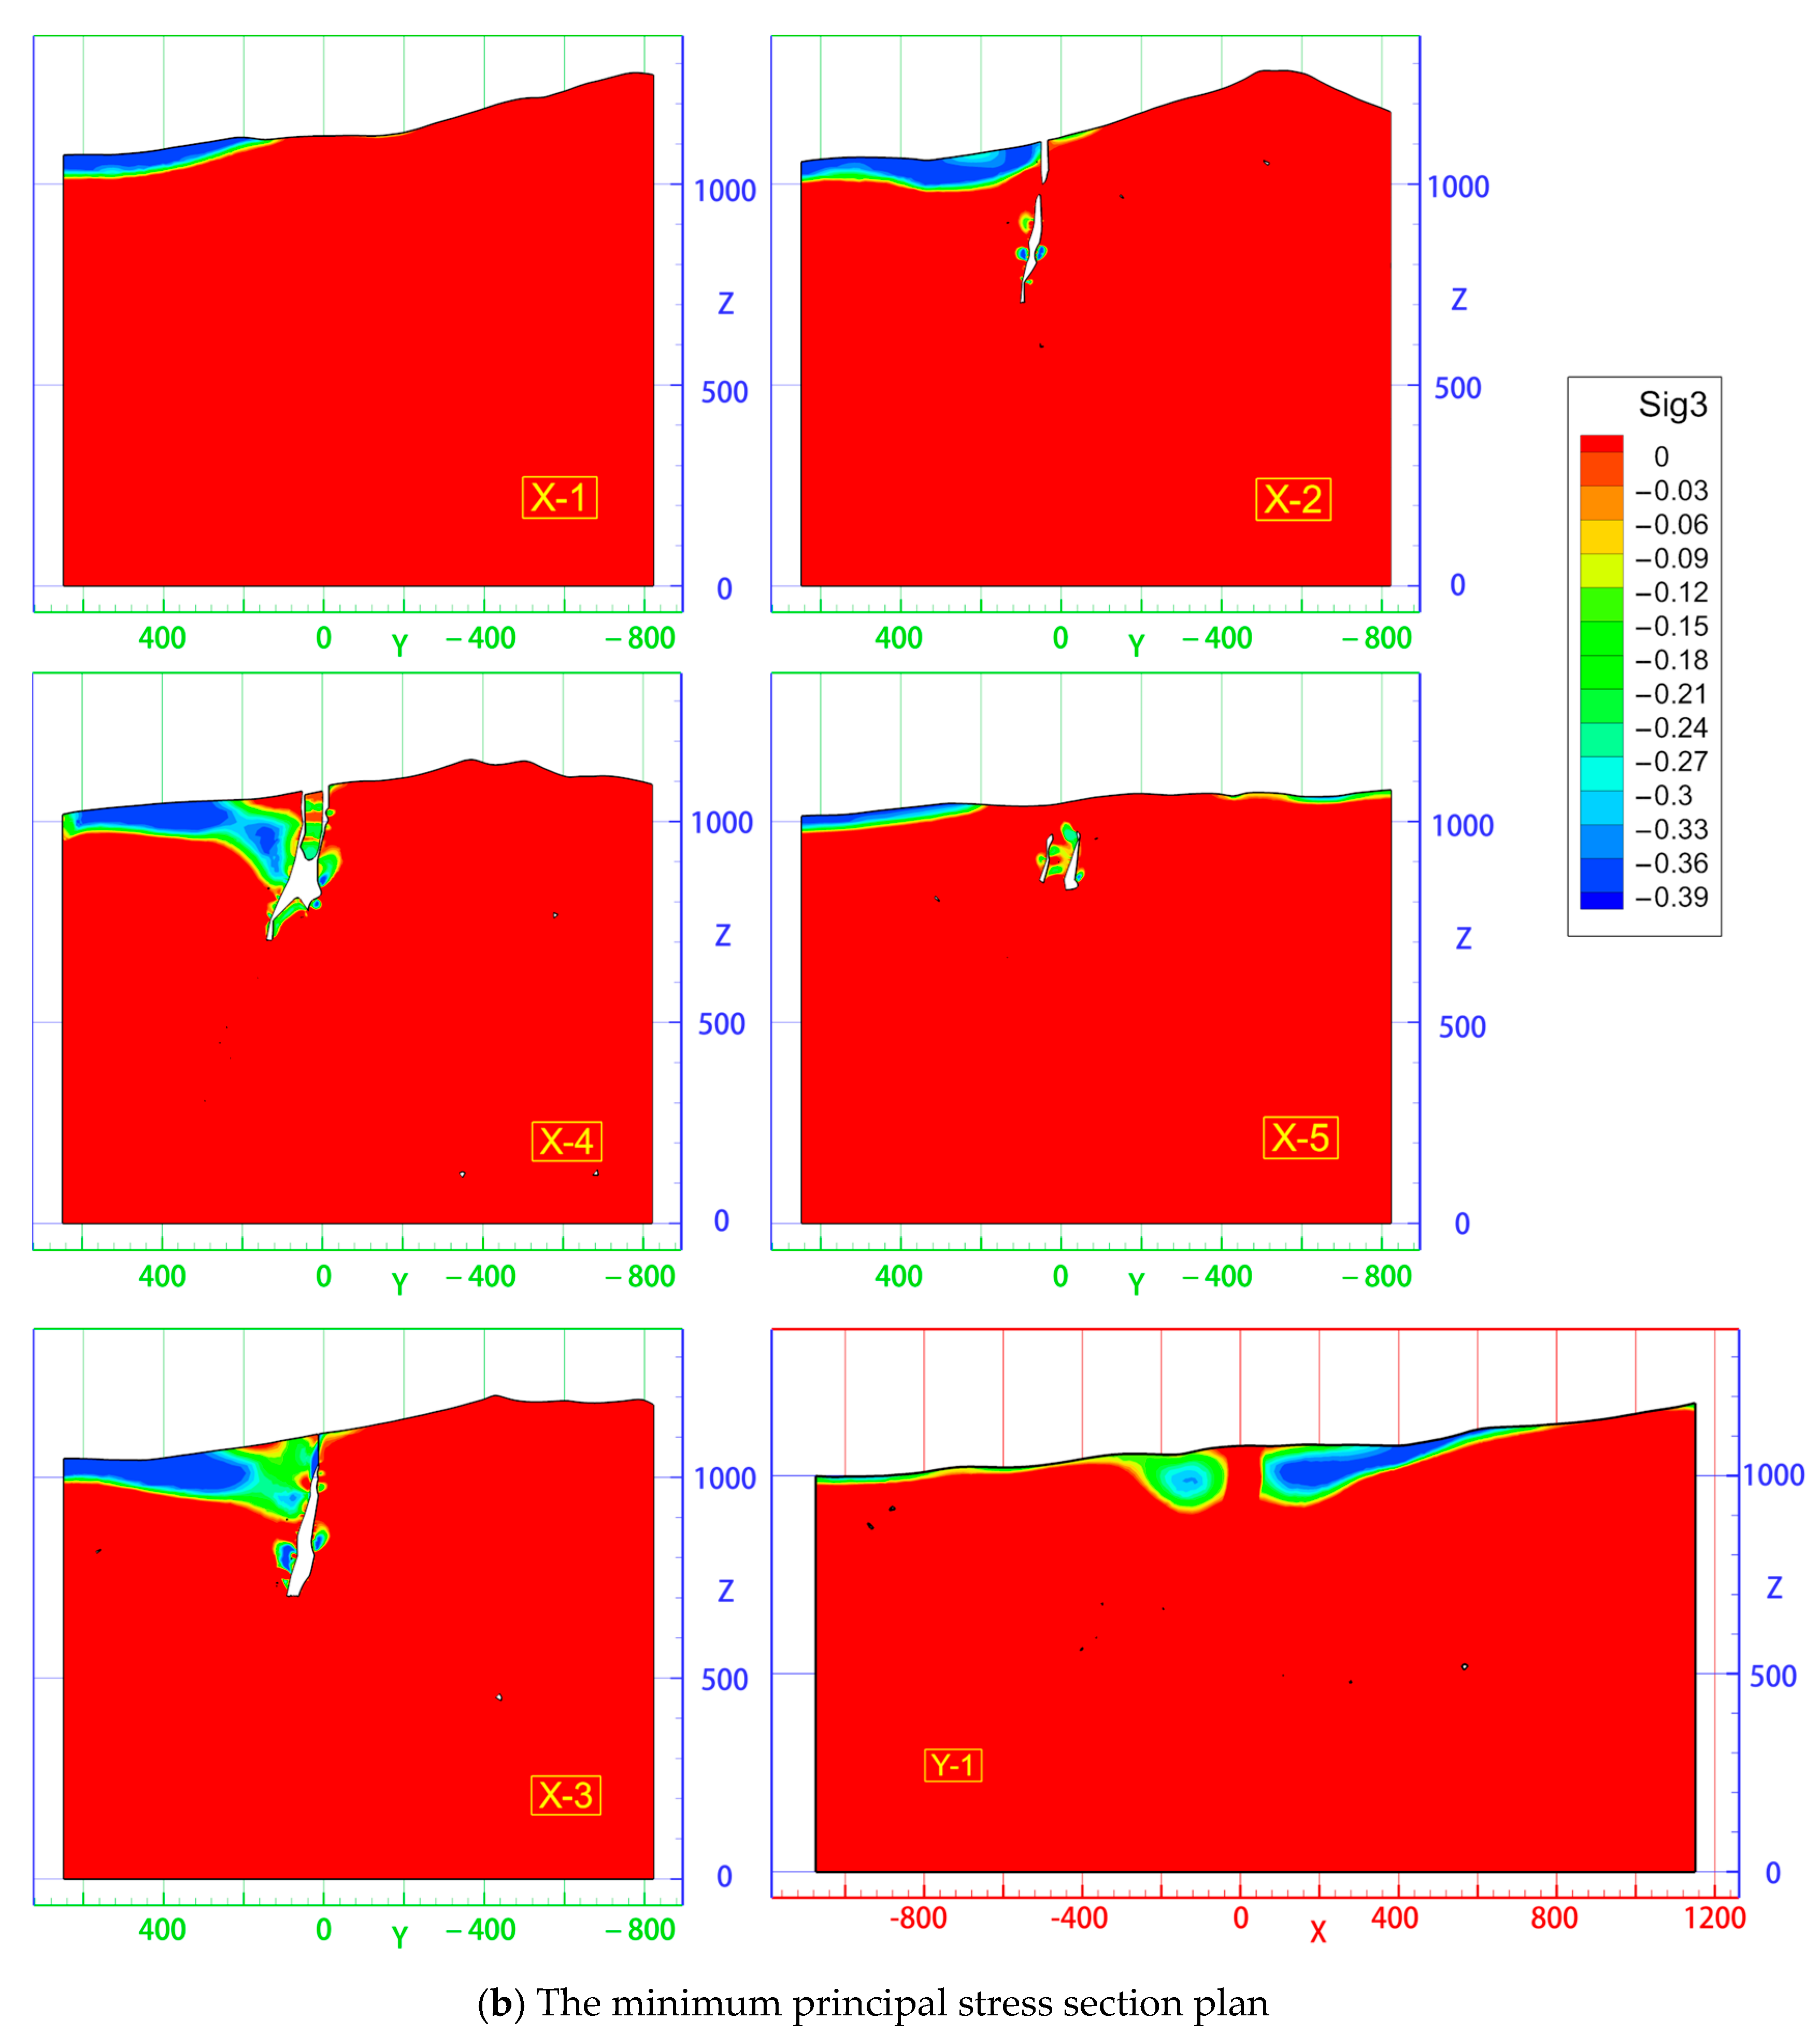
As shown in Figure 23, there was a large tensile plastic zone of slate mass on the surface connected with the plastic zone of feldspar porphyry as a whole. In FLAC3D, tension-n and tension-p are generally recognised as tensile plasticity and tensile damage with plasticity. There would be a huge area of tensile fractures of the tensile plastic zone of hanging wall on the surface with a small range of coalescence to the plastic zone at the hanging wall of marble, which was presented as a collapse of rock mass and was consistent with the field observation. The depth and range of the tensile damage zone of the slate were illustrated in Figure 24. The feldspar porphyry occurred between the X-2 and X-3 sections, and its retention played a good role in supporting the surrounding rock of hanging and foot walls, with a relatively smaller tensile damage zone. There was a tensile damage coalescence from the hanging wall to surface around X-2 and X-3 sections with the greater stress value around the X-2 section close to the tensile strength of rock mass. At the X-2 section, there were two orebodies, which were in the direction of the hanging wall and footwall of marble. The collapse of the marble suspended part, and the mining of orebody directly led to the growing of mine-out areas, the increase of exposure face of hanging wall, the connection of tensile damage area of slate, and the risk of overall sliding and subsidence of surface.
7. The Evolution of Surface Subsidence
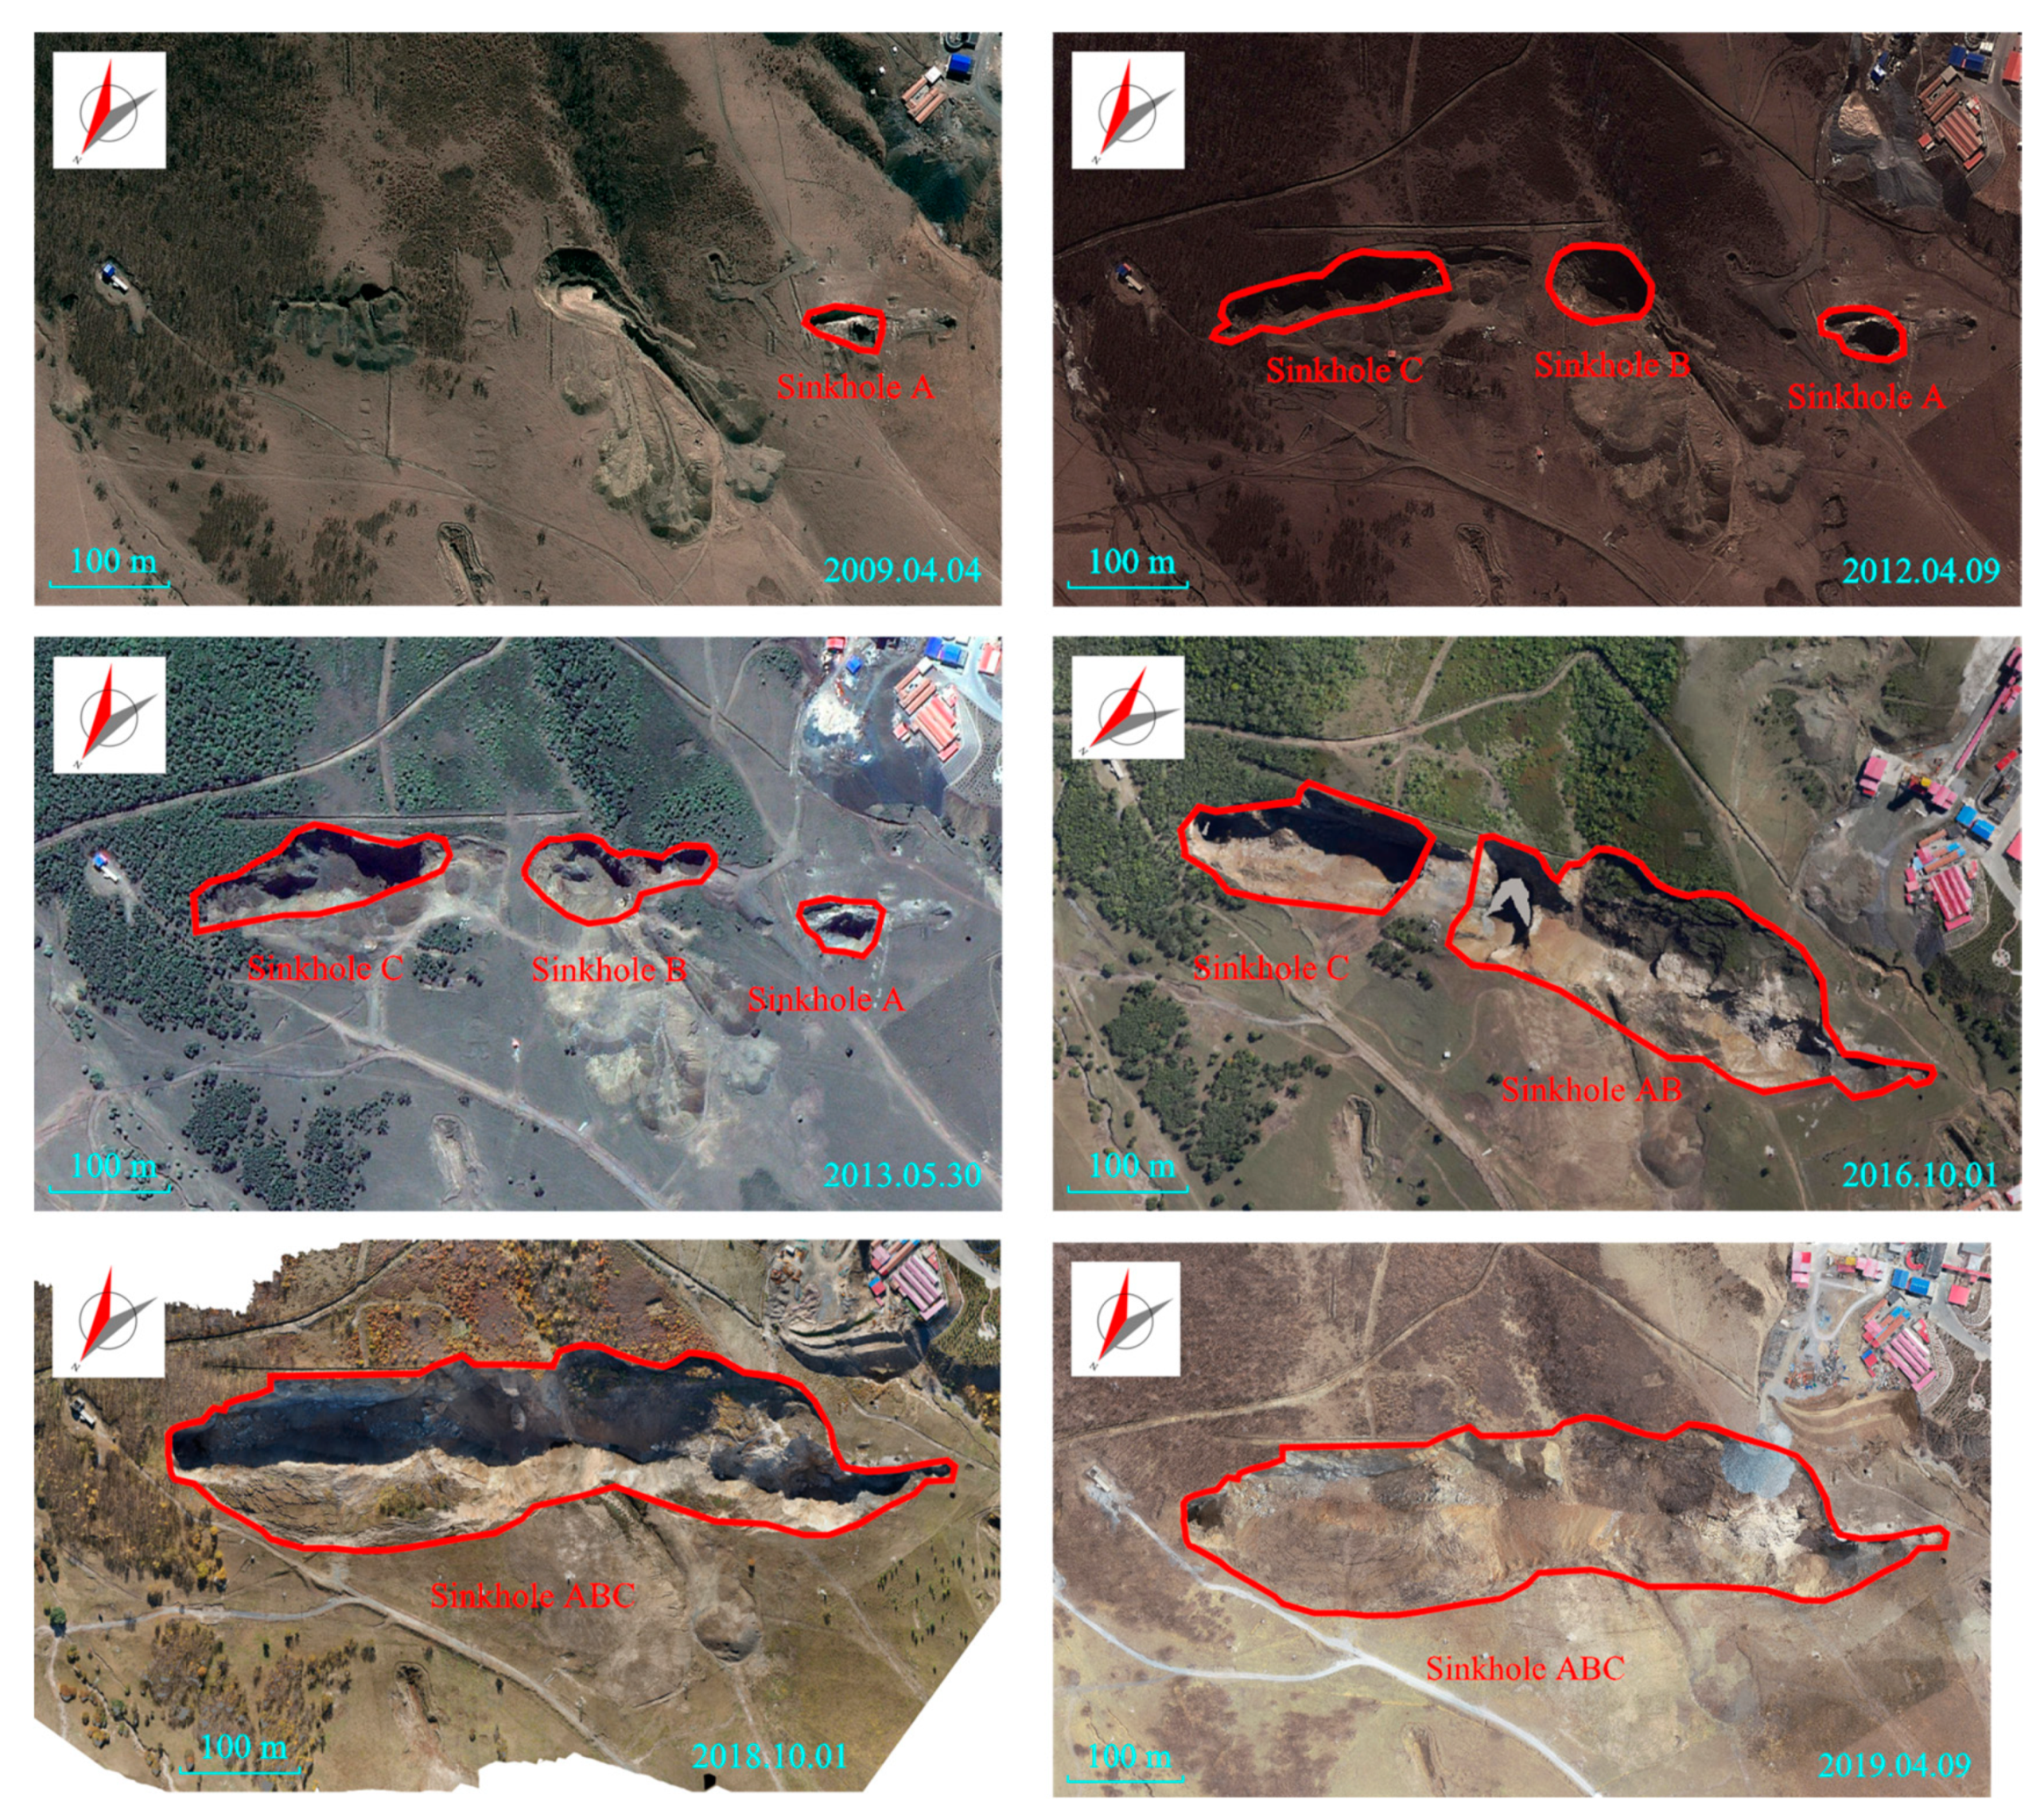
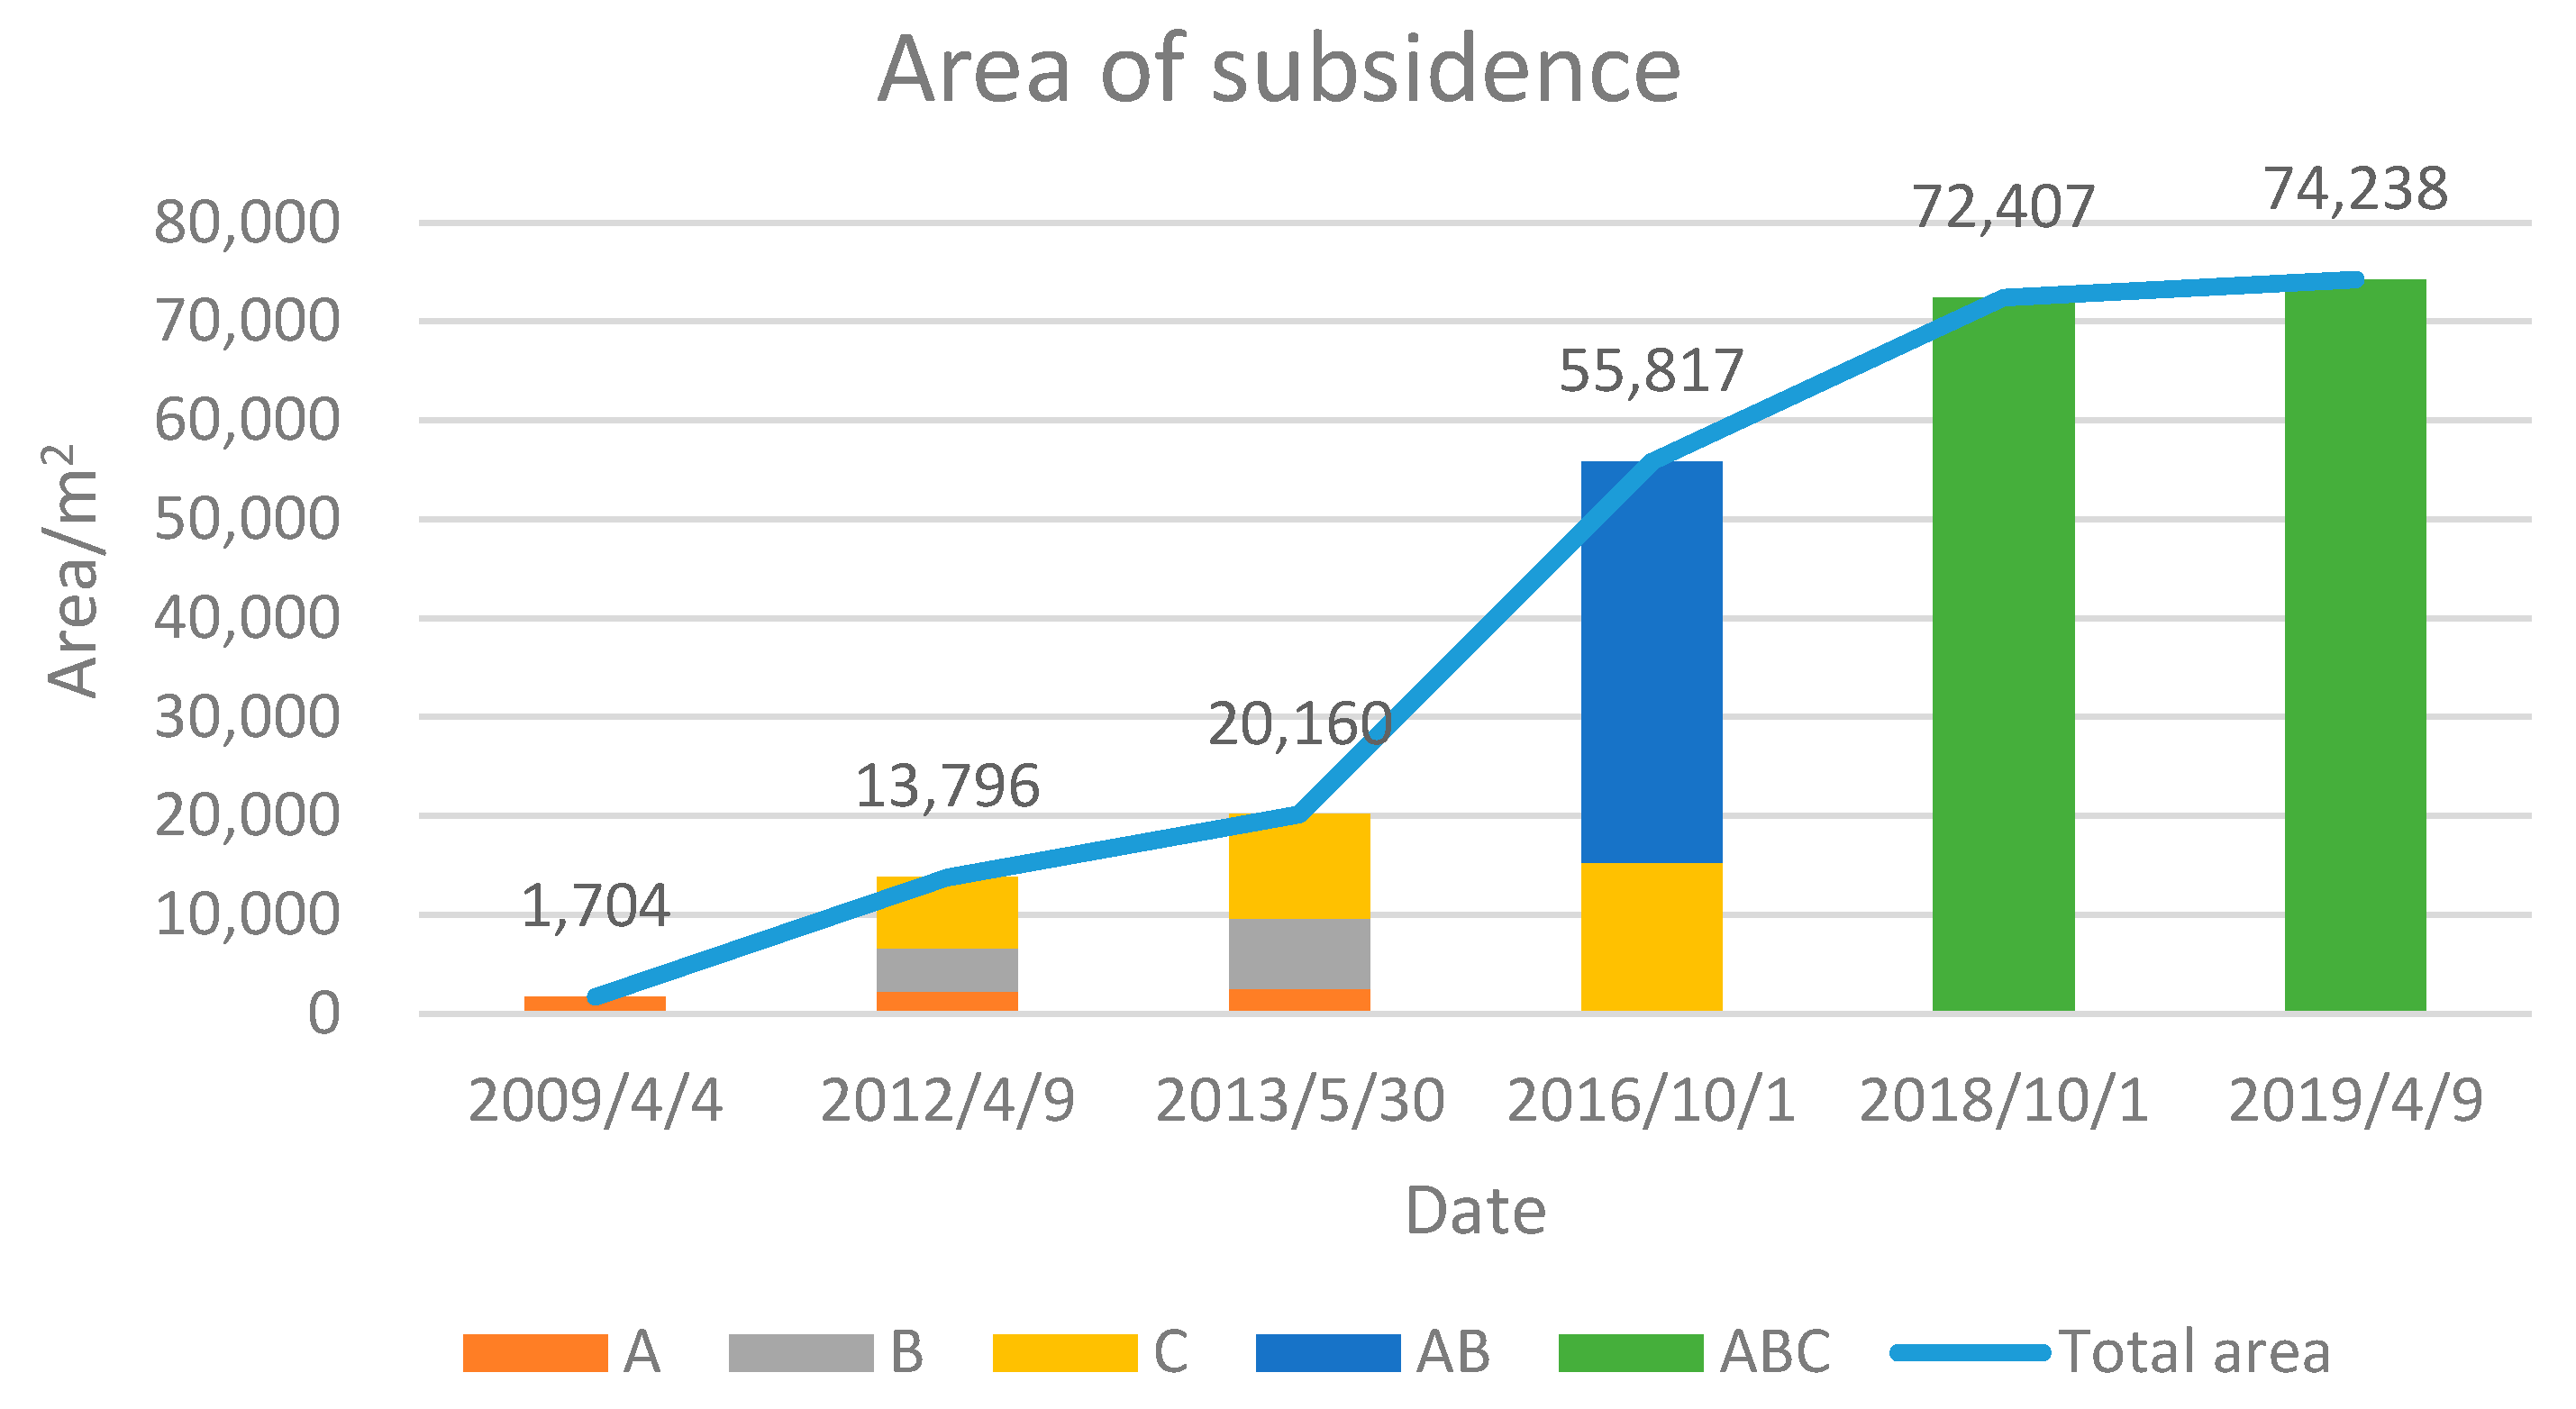
The data collected by satellites (from 2009 to 2013) and unmanned aerial vehicles (from 2016 to 2019) are shown in Figure 25, Table 4 and Figure 26, respectively. Initially, there was a small subsidence area (A) in 2009, and with the regular excavation another two areas (B and C) were observed in 2012. Due to the collapse of marble mass caused by the extraction of ore rocks close to the marble mass, areas A and B were grown into a larger uniform area (AB) in 2016. In 2018, the development of the mine-out area increased the requirement of feldspar porphyry mass, which was located between area AB and area C to support the surrounding rock and eventually resulted in the subsidence connection of AB and C into ABC. There was a clear growth tendency in the total area of subsidence. The development of the subsidence area from 2009 to 2019 was in good agreement with the numerical simulation results.
8. Deformation Observation
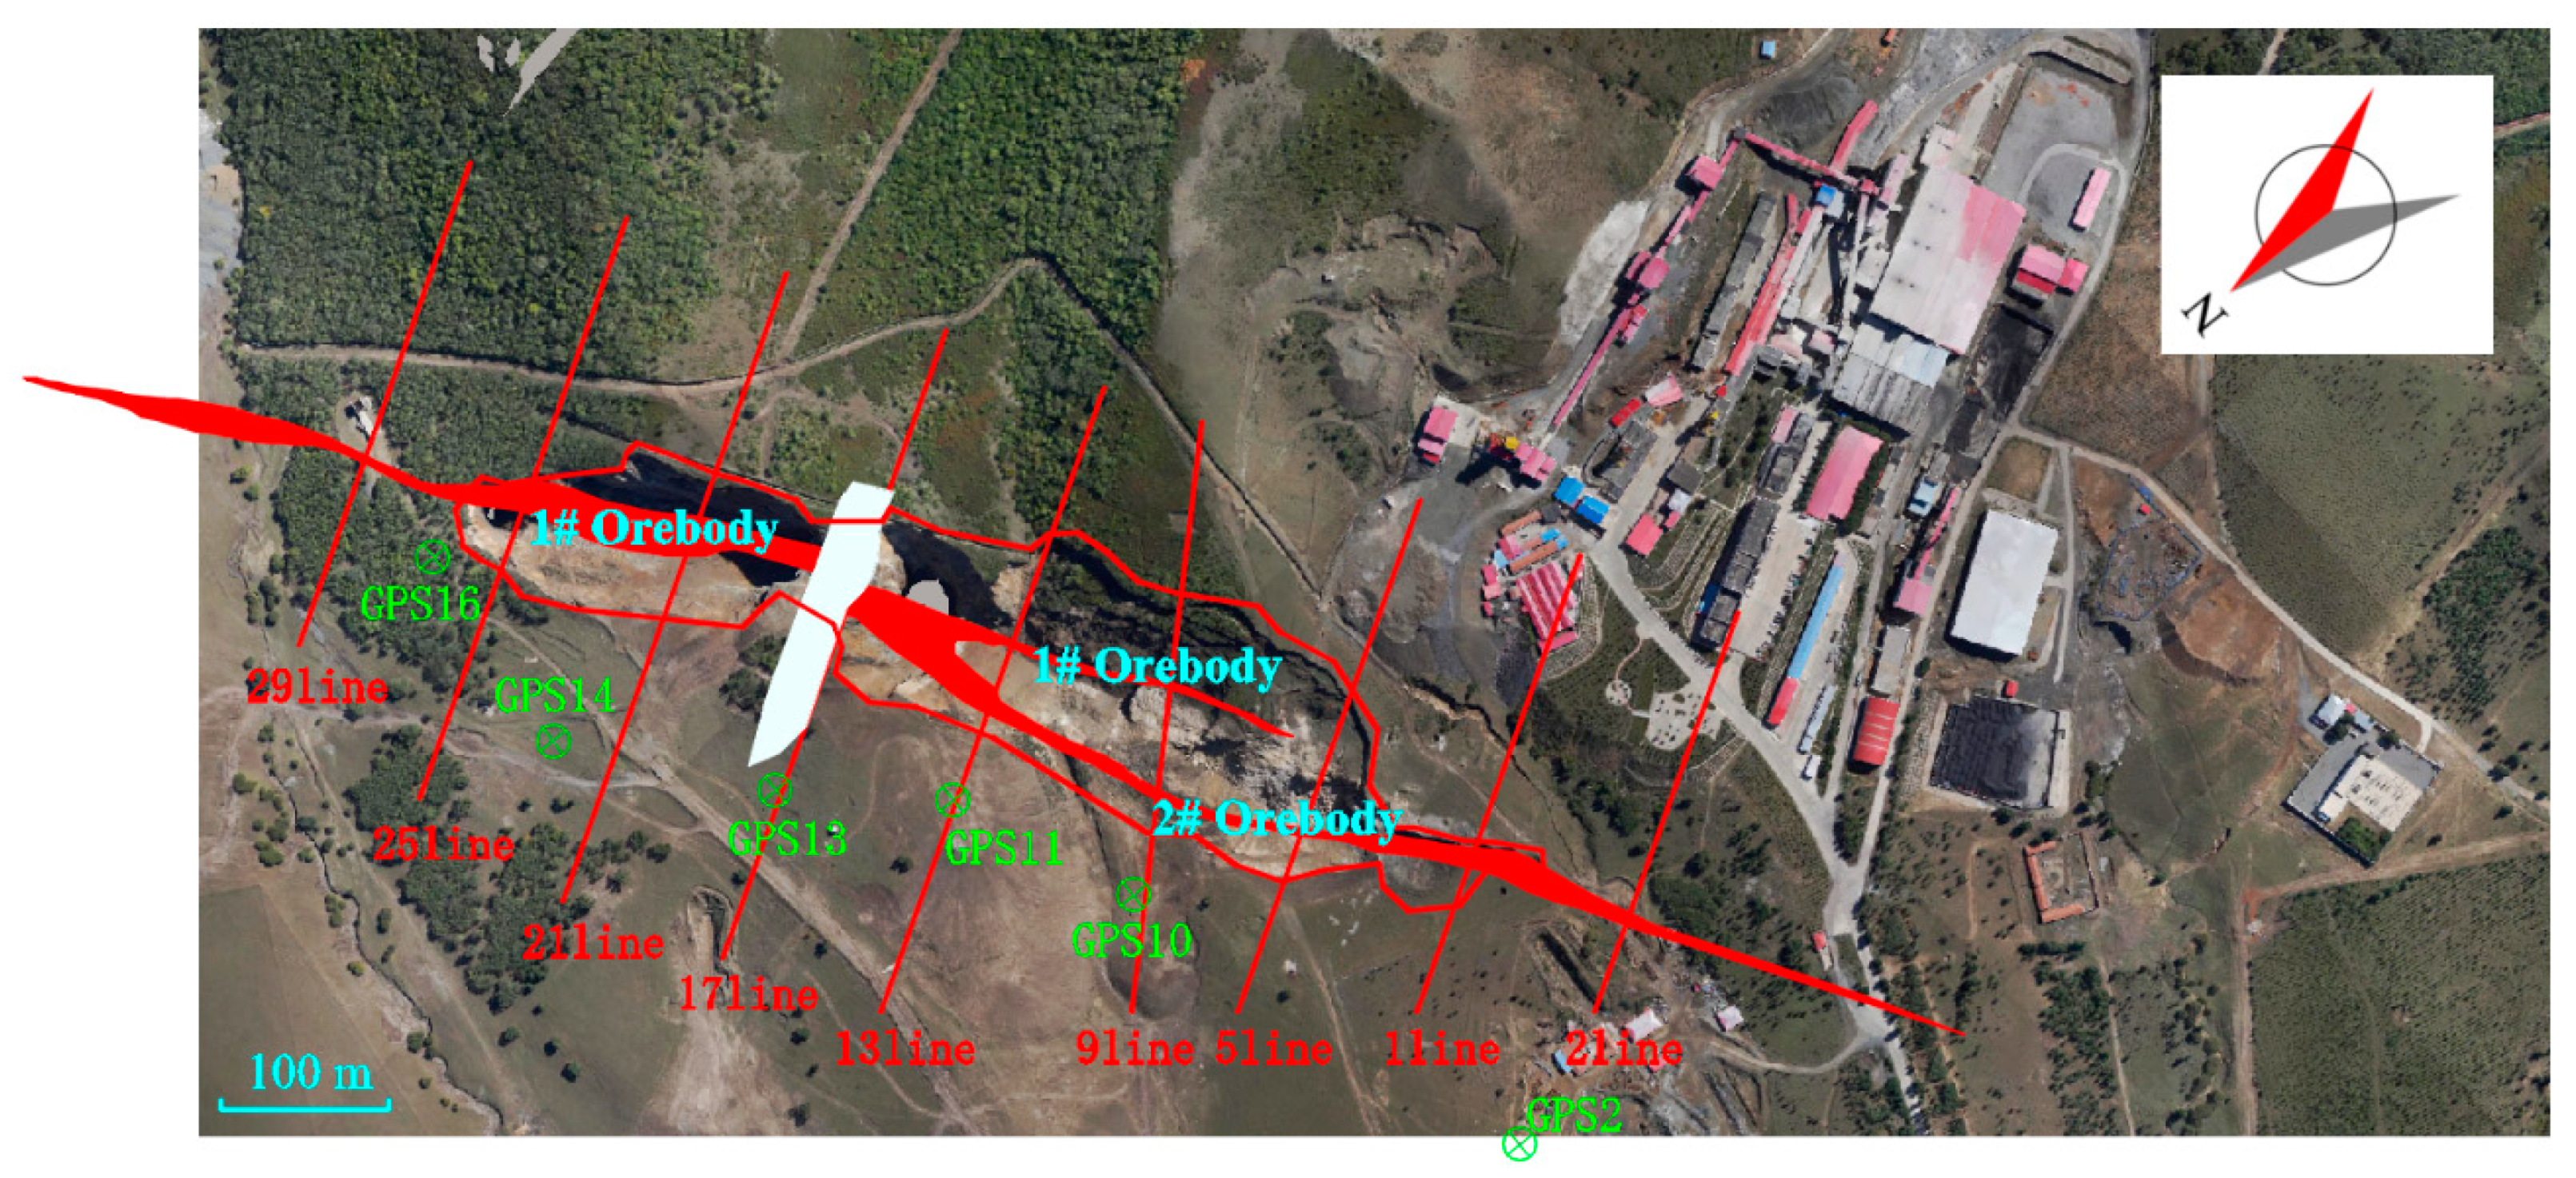
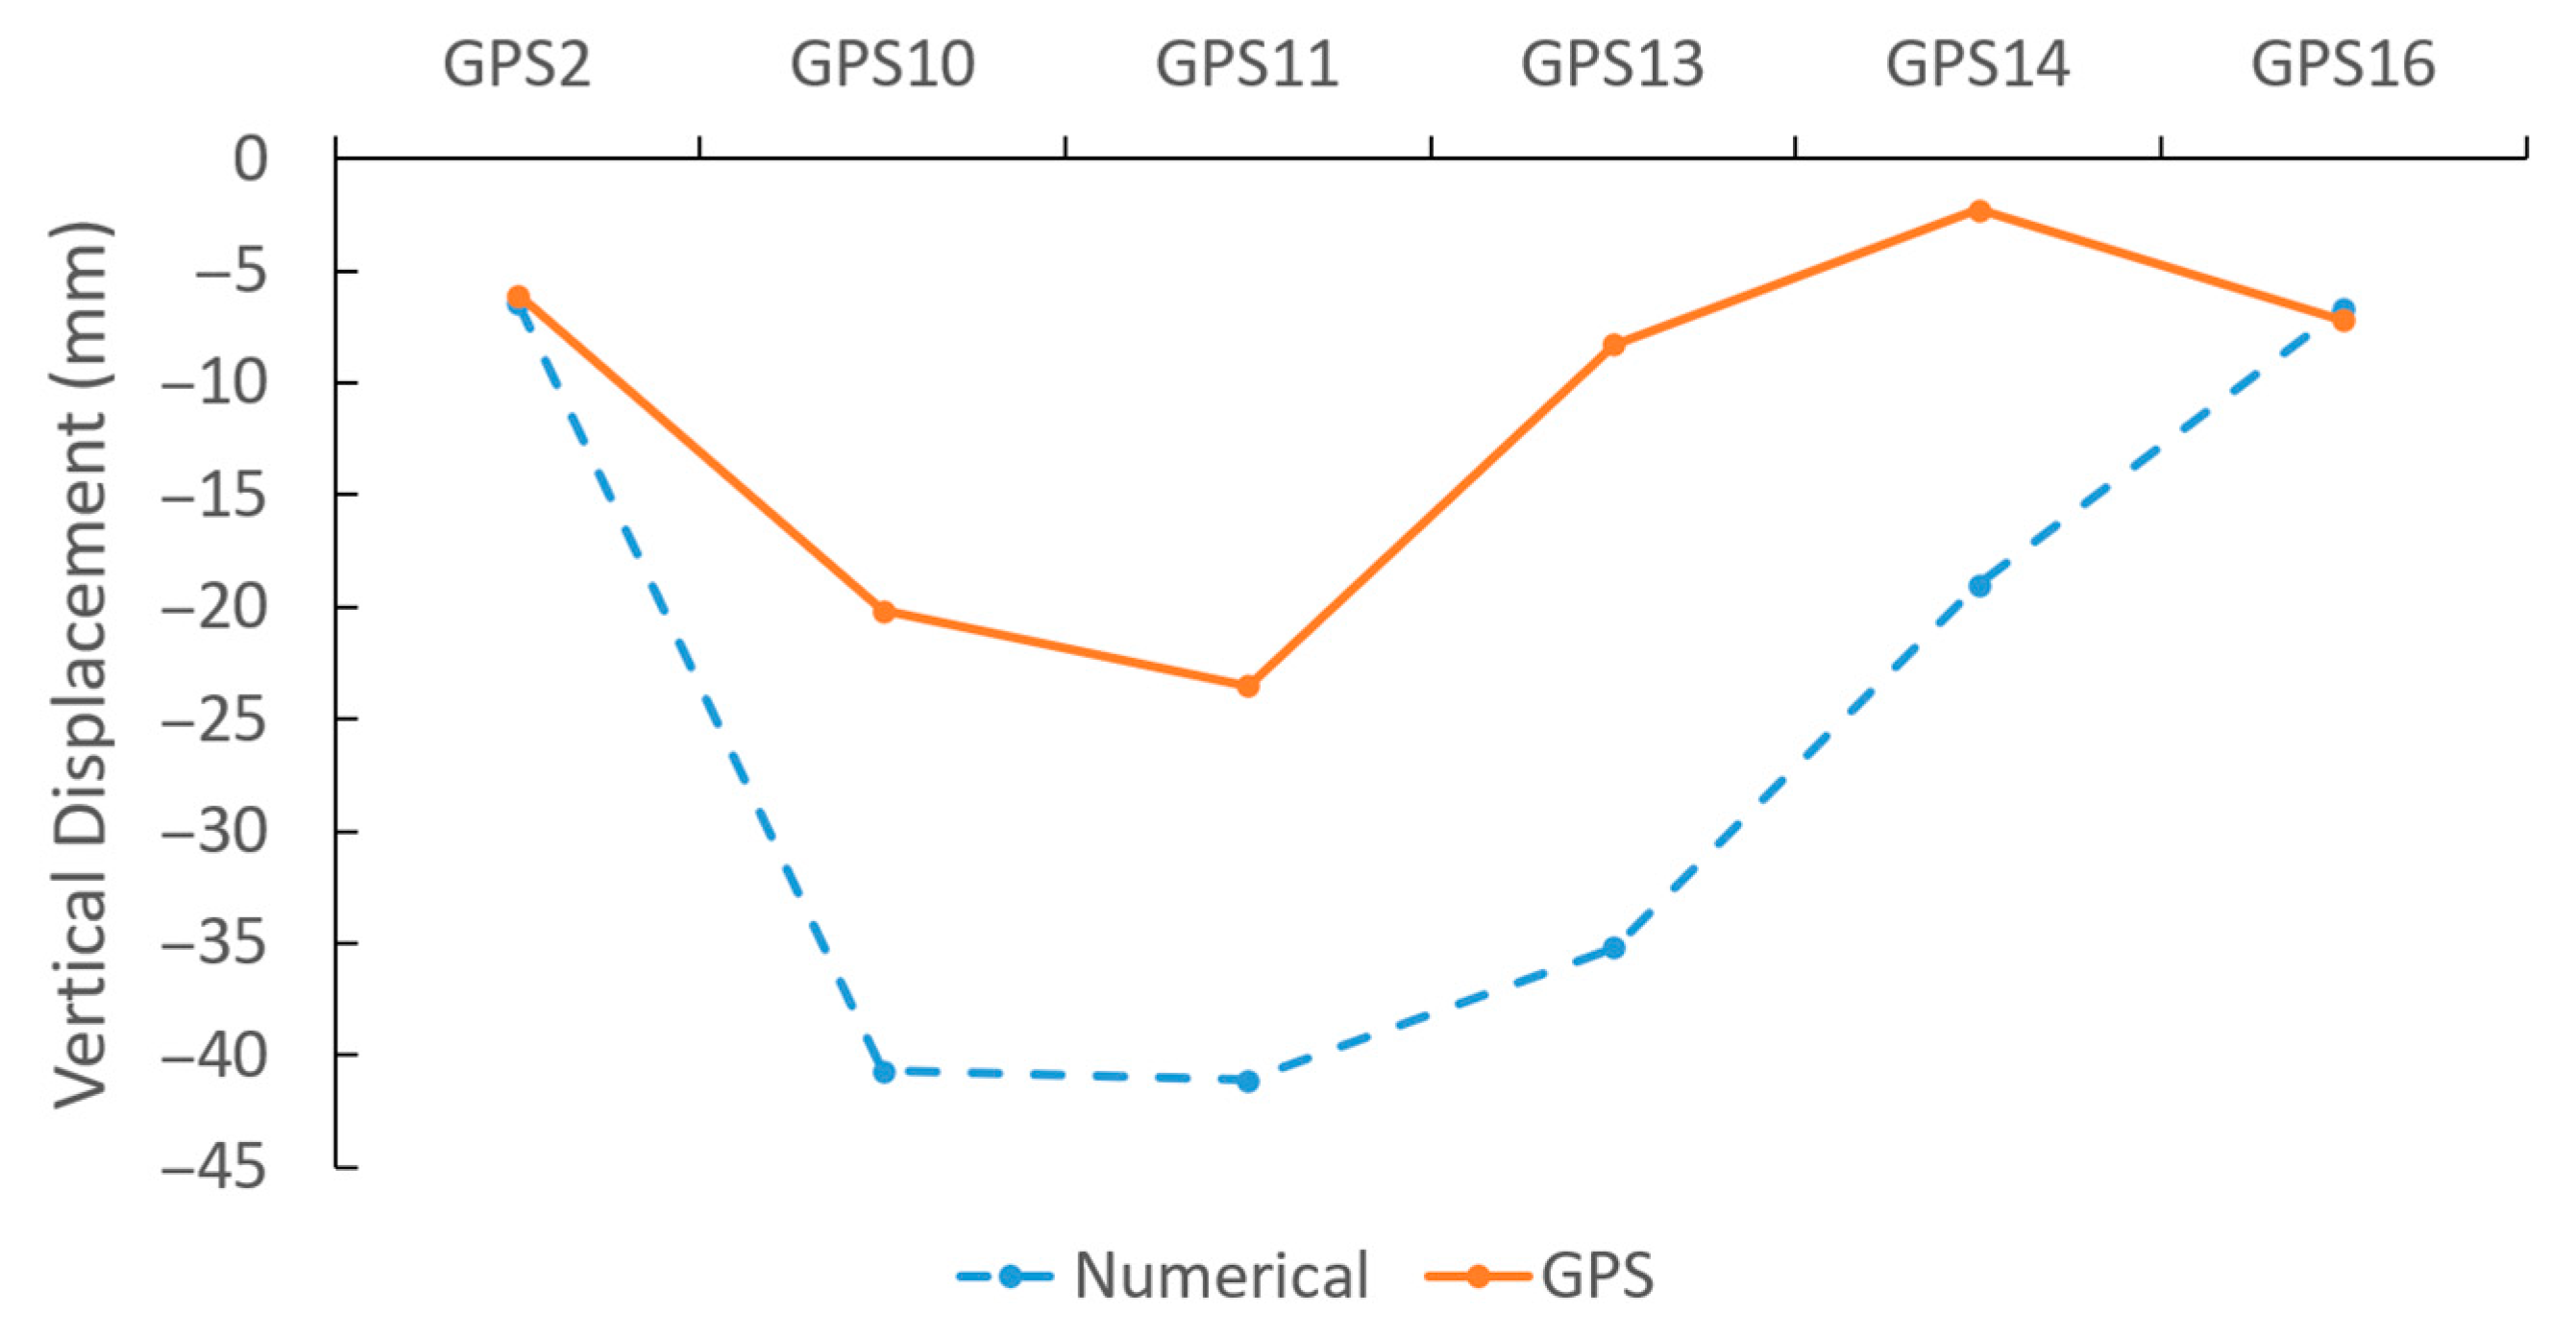
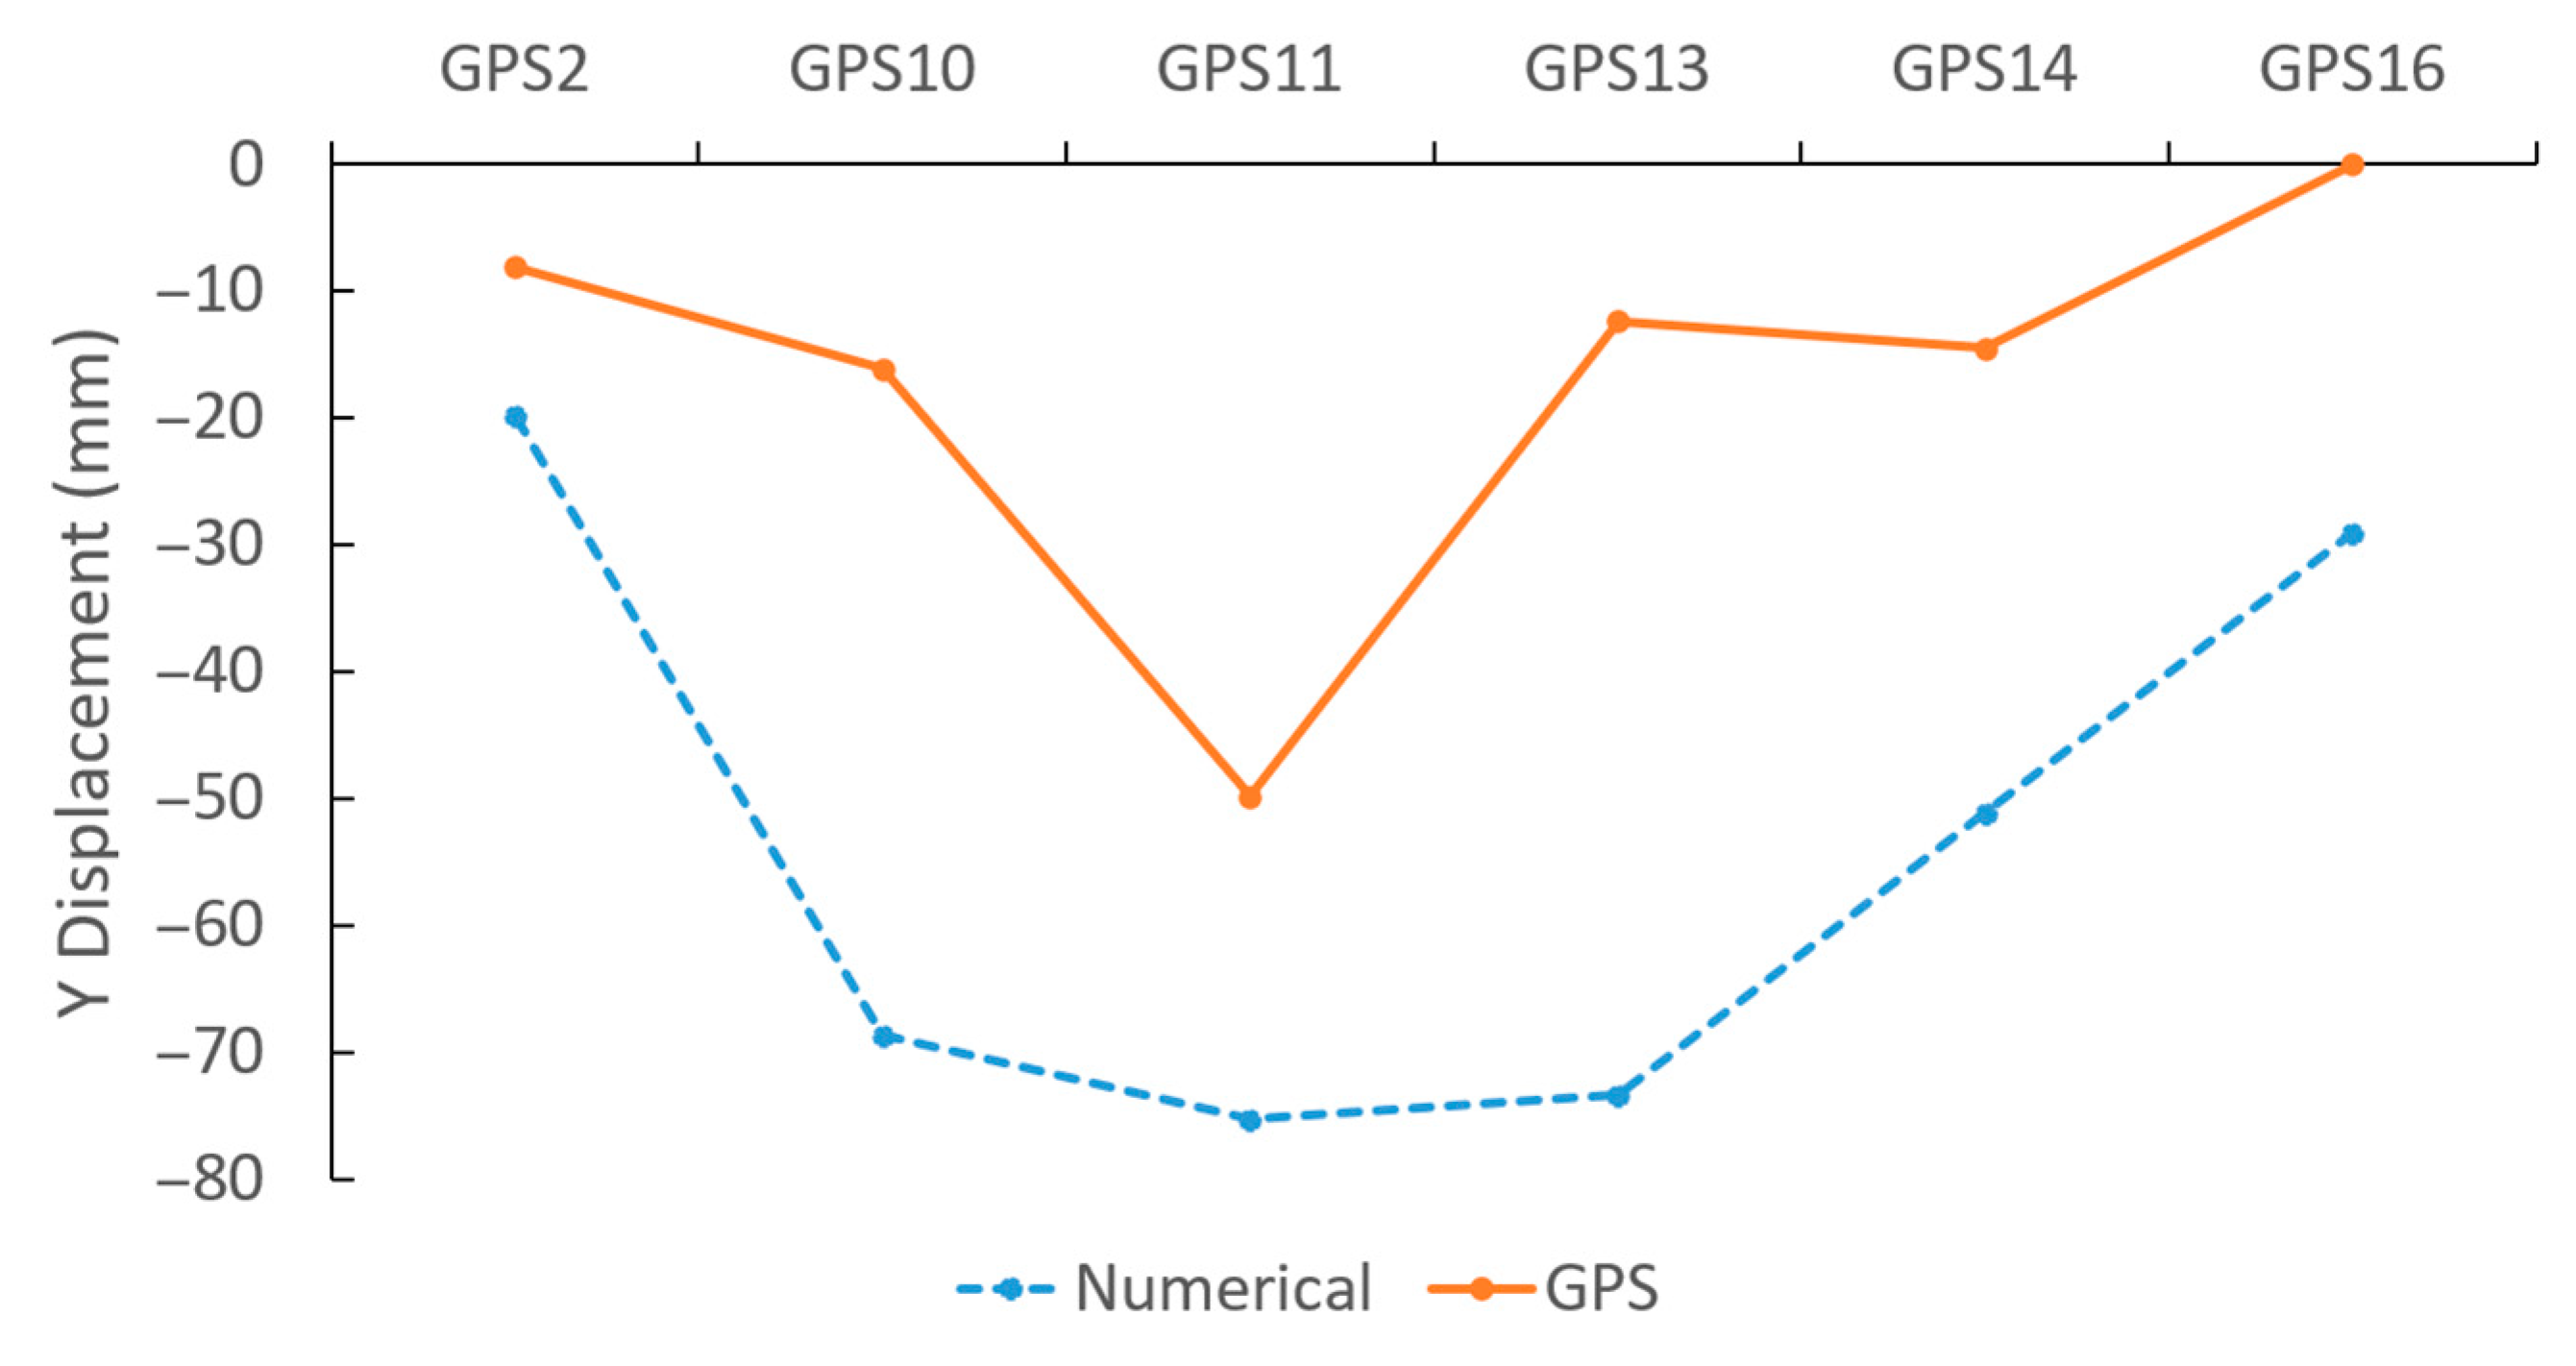
December 2019, Twenty GPS deformation observation stations were installed, distributed around the collapse pit, which has been steadily monitored for more than 400 days. GPS2, GPS10, GPS11, GPS13, GPS14 and GPS16 are located on the hangingwall of the orebody (Figure 27). By comparing the numerical simulation results with the field monitoring results (Figure 28 and Figure 29), it can be observed that the numerical simulation results are consistent with the field monitoring results, and this numerical simulation model can be used to simulate the real field situation. The numerical simulation calculates the displacement generated in the whole life cycle of the mine, and the monitoring data are the displacement of less than 500 days, so the monitored displacement is less than the result of the numerical simulation. The numerical simulation results and monitoring data show the same displacement distribution law and trend.
9. Conclusions
This paper analysed the mechanism of rock mass displacement and surface subsidence induced by the excavation of near-surface steeply-inclined thick lead-zinc deposit by an integrated underground method of stoping and caving in Hongling Lead-Zinc Mine. A numerical model consisting of the orebody and surrounding rock, which were mainly combined by feldspar porphyry, marble and slate, was built from geological data by 3Dmine, MidasGTSNX and FLAC3D. The authenticity of modeling is strictly required when using this method for analysis, which can answer a lot of questions that cannot be explained by simplified models. UAV (Unmanned Aerial Vehicle) aerial survey was used to obtain the highly accurate surface topography, and combined with geological data such as mine borehole data, a real three-dimensional numerical calculation model of the mine was established. 2019 Li X using PFC2D surface subsidence for the red hill lead-zinc mine carried out some research [40], but because will be simplified into plane strain problem, it is not appropriate, cannot reveal the different parts in the form of the interaction in the process of rock mass in the mining and its damage, analysis of different rock mass destruction separately, have some limitations. The real three-dimensional numerical calculation model established in this manuscript can fully reflect the stress distribution, displacement change and failure of different rock masses in the process of mining during the simulation.
Relevant mechanical parameters were determined by laboratory tests or derivated by the Hoek-Brown criterion. Combined with the measured in-situ stress data, mining historical data and mining sequence, the development of collapses and subsidence caused was analyzed by numerical simulation. The results with high showed: (1) feldspar porphyry played an important role in supporting surrounding rock and surface of the orebody; due to continual stoping, the intersection of feldspar porphyry and orebody was completely plastic with a reduced support for the hanging wall; (2) the suspended marble caused by mine-out of hanging wall, footwall and its lower part had similar stress field with cantilever beam with the displacement of subsidence and torsion; the collapse of marble caused the horizontal and vertical extension of surface subsidence, the increase of exposed area of slate mass at hanging wall, and the collapse of the slate rock close to the hanging wall of ore body, which was consistent with the aerial image; (3) A large plastic zone ranging from the slate mass at hanging wall to the surface, connecting to the plastic zone of feldspar porphyry, brought the great potential to the appearance of large area of tension cracks on surface, which was uniform with the field observation. The simulation results had good correspondence with the evolution of the subsidence from 2009 to 2019. The current mining method integrating stoping and caving damaged the stability and safety of rock mass and surface, and the enlarging subsidence area put pressure on land acquisition, husbandry subsidy, water and soil conservation and mine reclamation. There was a risk to economic and safe operation of the mine and permanent destruction to the local ecological environment. It is suggested that the ground pressure control of the mine-out area and the management of surface subsidence should be carried out to achieve an ecological and economic all-win goal. Due to personal ability limitation, the cost of soil and water conservation and ecological reclamation is not calculated.
Author Contributions
Data curation, W.Y.; Funding acquisition, X.Z.; Writing—original draft, Y.Z.; Writing—review & editing, J.D. All authors have read and agreed to the published version of the manuscript.
Funding
This work was supported by the NSFC-Shandong Joint Fund (U1806208), State Key Laboratory of Nickel & Cobalt Resources Comprehensive Utilization, the Fundamental Research Funds for the Central Universities (N2001033).
Institutional Review Board Statement
Not applicable.
Informed Consent Statement
Not applicable.
Data Availability Statement
Data sharing not applicable.
Conflicts of Interest
The authors declare no conflict of interest.
References
- Zhao, W.; Meng, Q. Researchon History and Development Trend of Domestic and Foreign Mining Subsidence. J. Beijing Polytech. Coll. 2010, 9, 12–15. [Google Scholar] [CrossRef]
- Liu, B.; Liao, G. Basic Law of Surface Movement in Coal Mine; China Industrial Press: Beijing, China, 1965. [Google Scholar]
- Jia, X.; Zhang, B.; Yang, N. Study on Classification of Destruction Degree of Mining Subsidence Land. Coal Eng. 2009, 3, 81–84. [Google Scholar] [CrossRef]
- Yu, X.; Zhang, E. Mining Damage Theory, 2nd ed.; China Coal Industry Publishing House: Beijing, China, 2010. [Google Scholar]
- He, G.; Yang, L.; Ling, G. Mining Subsidence Theory; China University of Mining & Technology Publisher: Xuzhou, China, 1991. [Google Scholar]
- Ji, W. Introduction to Collapse; China City Press: Beijing, China, 1994. [Google Scholar]
- Asaoka, A. Observational Procedure of Settlement Prediction. Soils Found. 1978, 18, 87–101. [Google Scholar] [CrossRef] [Green Version]
- Whittaker, B.N. Surface subsidence aspects of room and pillar mining. Nottm. Univ. Min. Dep. Mag. 1985, 1, 59–67. [Google Scholar]
- Bell, F.G.; Culshaw, M.G.; Cripps, J.C. Engineering Geology of Underground Movement; The Geological Society: London, UK, 1998. [Google Scholar]
- Waltham, A.C. Ground Subsidence; Chapman and Hall: New York, NY, USA, 1989. [Google Scholar]
- Zhang, Y. Prediction and control of surface subsidence in coal mine—Review and prospect of the turn of the century. In Proceedings of the 5th Youth Science and Technology Seminar of China Coal Society and the 3rd Youth Academic Annual Meeting of China Association for Science and Technology Satellite Conference, Taian, China, 5 November 1998; pp. 1–7. [Google Scholar]
- Авершин, С.Г. Сдвижение Гoрных Пoрoд При Пoдземных Разрабoтках; Coal Industry Press: Beijing, China, 1959. [Google Scholar]
- Litwiniszyn, J. Fundamental principles of the mechanics stochastic medium. In Proceedings of the 3rd Conference Theoretical and Applied Mechanics, Bongalore, India, 24–27 December 1957. [Google Scholar]
- Li, B.; Zhang, J.; Li, G. Application of Stochastic Medium Theory in Mineral Engineering; Hunan Science and Technology Press: Changsha, China, 2004. [Google Scholar]
- Smolarski, A. A Contribution to the Mechanics of a Horizontal-Homogeneous Stochastic Medium with Inclined Layers; Bulletin de l’Academie Polonaise des Sciences cl: Warsaw, Poland, 1957; pp. 89–126. [Google Scholar]
- Salamon, M.D.G. Elastic analysis of displacements and stresses induced by the mining of seam or reef deposits. J. South. Afr. Inst. Min. Metall. 1964, 64, 197–218. [Google Scholar]
- Salamon, M.D.G. Rock Mechanics of Underground Engineering; Metallurgical Industry Press: Beijing, China, 1982. [Google Scholar]
- Berry, D. An elastic treatment of ground movement due to mining—I. Isotropic ground. J. Mech. Phys. Solids 1960, 8, 280–292. [Google Scholar] [CrossRef]
- Berry, D.; Sales, T. An elastic treatment of ground movement due to mining—II. Transversely isotropic ground. J. Mech. Phys. Solids 1961, 9, 52–62. [Google Scholar] [CrossRef]
- Berry, D.; Sales, T. An elastic treatment of ground movement due to mining—III three dimensional problem, transversely isotropic ground. J. Mech. Phys. Solids 1962, 10, 73–83. [Google Scholar] [CrossRef]
- Berry, D. An elastic treatment of ground movement due to mining—Corrigendum. J. Mech. Phys. Solids 1963, 11, 373–375. [Google Scholar] [CrossRef]
- Siriwardane, H.J. A numerical procedure for prediction of subsidence caused by longwall mining. In International Conference on Numerical Methods in Geomechanics; August Aimé Balkema: Rotterdam, The Netherlands; Boston, MA, USA, 1985; pp. 1595–1602. [Google Scholar]
- Alejano, L.R.; Ramírez-Oyanguren, P.; Taboada, J. FDM predictive methodology for subsidence due to flat and inclined coal seam mining. Int. J. Rock Mech. Min. 1999, 36, 475–491. [Google Scholar] [CrossRef]
- Ambrožič, T.; Turk, G. Prediction of subsidence due to underground mining by artificial neural networks. Comput. Geosci. 2003, 29, 627–637. [Google Scholar] [CrossRef] [Green Version]
- Xie, H.; Zhou, H.; Wang, J.; Li, L.; Kwasniew, S. Application and comparative analysis of FLAC in prediction of coal mining subsidence. Chin. J. Rock Mech. Eng. 1999, 18, 3–5. [Google Scholar] [CrossRef]
- Huang, Y.; Fu, J.; Guo, Y. Research on Surface Strata Displacement Law for Mining the Steeply Inclined Thin Vein in the Ultra-deep well. Min. Res. Dev. 2015, 35, 59–62. [Google Scholar] [CrossRef]
- Li, X.; Li, D.; Liu, Z.; Zhao, G.; Wang, W. Determination of the minimum thickness of crown pillar for safe exploitation of a subsea gold mine based on numerical modelling. Int. J. Rock Mech. Min. Sci. 2013, 57, 42–56. [Google Scholar] [CrossRef]
- Zhou, K.; Du, X. Study on Stability of Residual Ore Recovery Based on Coupling of 3DMINE-MIDAS /GTS-FLAC3D. China Saf. Sci. J. 2011, 21, 17–22. [Google Scholar] [CrossRef]
- Li, H.; Wang, W.; Xiao, Y.; Liu, H.; Liu, T. Stability analysis of actual goaf group based on Faro-3DMine and Midas-FLAC3D coupling technology. Nonferrous Met. (Min. Sect.) 2019, 71, 14–18. [Google Scholar] [CrossRef]
- Bertuzzi, R.; Douglas, K.; Mostyn, G. Comparison of quantified and chart GSI for four rock masses. Eng. Geol. 2016, 202, 24–35. [Google Scholar] [CrossRef]
- Hoek, E.; Carranza-Torres, C.; Corkum, B. Hoek-Brown failure criterion-2002 edition. Proc. NARMS-Tac 2002, 1, 267–273. [Google Scholar]
- China, T.M.O.W. GB50218-94 Standard for Engineering Classification of Rockmasses; China Planning Press: Beijing, China, 2014. [Google Scholar]
- Hao, X. Stability Analysis and Support Research on Rock Mass of +805 Level in Hongling Lead-Zinc Mine. Master’s Thesis, Northeastern University, Shenyang, China, 2015. [Google Scholar]
- Hoek, E.; Brown, E.T. Empirical strength criteria for rock masses. J. Geotech. Eng. Div. Am. Soc. Civ. Eng. 1980, 106, GT9. [Google Scholar]
- Hoek, E.; Wood, D.; Shah, S. In A modified Hoek-Brown failure criterion for jointed rock masses. ISRM Symp. Eurock 1992, 1, 209–214. [Google Scholar] [CrossRef]
- Hoek, E.; Diederichs, M. Empirical estimation of rock mass modulus. Int. J. Rock Mech. Min. Sci. 2006, 43, 203–215. [Google Scholar] [CrossRef]
- Hoek, E.; Karzulovic, A. Rock mass properties for surface mines. In Slope Stability in Surface Mining; Hustrulid, W.A., McCarter, M.K., van Zyl, D.J.A., Eds.; Society for Mining, Metallurgical and Exploration (SME): Littleton, CO, USA, 2000; pp. 59–70. [Google Scholar]
- Wang, K.; Diao, X.; Lai, J.; Huang, G. Engineering application comparison of strain softening model and Mohr-Columb model in FLAC3D. China Sci. 2015, 10, 55–59. [Google Scholar] [CrossRef]
- Liu, H.; He, C.; Deng, K.; Bianca, Z.; Fan, H.; Lei, S.; Zhang, A. Analysis of forming mechanism of collapsing ground fissure caused by mining. J. Min. Saf. Eng. 2013, 30, 380–384. [Google Scholar]
- Li, X.; Wang, D.; Li, C.; Liu, Z. Numerical Simulation of Surface Subsidence and Backfill Material Movement Induced by Underground Mining. Adv. Civ. Eng. 2019, 2019, 2724370. [Google Scholar] [CrossRef] [Green Version]
Figure 1.
The location of Hongling lead-zinc Mine.

Figure 2.
The aerial view of Hongling Lead-Zinc Mine (taken in 2016).

Figure 3.
The cross-section of 17# exploring line.

Figure 4.
The gravity anomaly map. 1—Loess sandy soil, 2—Acid lava, acid lithic crystalline tuff, tuffaceous glutenite, etc. 3—Metamorphic acid tuff, tuffaceous conglomerate, glutenite, etc. 4—argillaceous slate intercalated with silty slate, marble, metamorphic sandstone, siltstone, etc. 5—Biotite granite, 6—Geological boundary, 7—Gravity contour, 8—Mine site.

Figure 5.
The blasting sequence of extracting the pillar. 1—haulage drift; 2—ore pass; 3—loading drift for rooms; 4—goaf; 5—loading drift for pillars; 6—undercutting level; 7—orebody; 8—broken ore; 9—crown pillar; 10—longhole; 11—slot raise; 12—service and ventilation raise; 13—ramp; 14—drilling drift; 15—cutting slot; 16—drilling chamber; 17—access.

Figure 6.
The aerial view of surface collapse.

Figure 7.
Partial rock specimens.

Figure 8.
Processing rock samples.

Figure 9.
Equipment and failure modes of uniaxial compression test.

Figure 10.
Equipment and failure modes of Brazilian splitting test.

Figure 11.
Equipment and failure modes of direct shear test.

Figure 14.
Top view of the numerical model.

Figure 15.
Sectional view of the numerical model.

Figure 16.
The diagram of mining sequences.

Figure 17.
The stress field of feldspar porphyry.

Figure 18.
The plastic zone and the displacement of feldspar porphyry.

Figure 19.
The stress field of marble (MPa).

Figure 20.
The plastic zone of marble.

Figure 21.
The density field of marble (kg/m3).

Figure 22.
The displacement field and vectors of marble.

Figure 23.
The plastic zone of mine surface.

Figure 24.
The minimum principal stress field of sections of slate.


Figure 25.
The evolution of surface subsidence.

Figure 26.
The area of surface subsidence.

Figure 27.
Position of GPS deformation observation stations.

Figure 28.
Comparison of the vertical displacement by GPS monitoring with the numerical results at the corresponding stations.
Figure 28.
Comparison of the vertical displacement by GPS monitoring with the numerical results at the corresponding stations.

Figure 29.
Comparison of the Y displacement by GPS monitoring with the numerical results at the corresponding stations.
Figure 29.
Comparison of the Y displacement by GPS monitoring with the numerical results at the corresponding stations.


Table 1.
Physical and mechanical parameters of intact rock.
| Rock Type | ρ (kg/m3) | σc (MPa) | μ | E (GPa) | σt (MPa) | c (MPa) | φ (°) |
|---|---|---|---|---|---|---|---|
| Marble | 2663 | 58.51 | 0.21 | 35.64 | 3.98 | 6.52 | 36.50 |
| Slate | 2770 | 116.00 | 0.27 | 75.60 | 12.15 | 9.75 | 48.68 |
| Ore | 3565 | 142.68 | 0.18 | 55.16 | 7.86 | 6.31 | 58.24 |
| Skarn | 3086 | 87.05 | 0.30 | 36.10 | 5.64 | 5.31 | 50.15 |
| Feldspar Porphyry | 2730 | 65.32 | 0.24 | 18.30 | 7.26 | 5.85 | 42.76 |
Table 2.
The boundary restrains of model.
| Restrain X | Left and Right Boundaries |
| Restrain Y | Front and Back Boundaries |
| Restrain XYZ | Bottom Boundary |
| Free | Top Boundary |
Table 3.
The rock masses mechanical parameters of model.
| Rock Type | D | GSI | mi | σcm (MPa) | σtm (MPa) | Em (GPa) | cm(MPa) | φm (°) | μ | ρ (kg/m3) |
|---|---|---|---|---|---|---|---|---|---|---|
| Marble | 0.8 | 65 | 9 | 4.08 | −0.26 | 8.11 | 3.04 | 25.41 | 0.21 | 2663 |
| Slate | 0.8 | 62 | 9 | 6.43 | −0.39 | 14.54 | 3.81 | 28.95 | 0.27 | 2770 |
| Ore | 0.8 | 65 | 24 | 9.96 | −0.24 | 12.56 | 6.01 | 40.07 | 0.18 | 3565 |
| Skarn | 0.8 | 70 | 24 | 8.91 | −0.23 | 10.57 | 5.56 | 38.66 | 0.30 | 3086 |
| Feldspar Porphyry | 0.8 | 65 | 30 | 4.56 | −0.09 | 4.17 | 4.74 | 35.89 | 0.24 | 2730 |
Table 4.
The area of surface subsidence.
| Date | 2009.04.04 | 2012.04.09 | 2013.05.30 | 2016.10.01 | 2018.10.01 | 2019.04.09 | |
|---|---|---|---|---|---|---|---|
| Sinkhole | |||||||
| A | 1704 | 2219 | 2488 | ||||
| B | 4370 | 7107 | |||||
| C | 7207 | 10,565 | 15,277 | ||||
| AB | 40,540 | ||||||
| ABC | 72,407 | 74,238 | |||||
Publisher’s Note: MDPI stays neutral with regard to jurisdictional claims in published maps and institutional affiliations. |
© 2021 by the authors. Licensee MDPI, Basel, Switzerland. This article is an open access article distributed under the terms and conditions of the Creative Commons Attribution (CC BY) license (https://creativecommons.org/licenses/by/4.0/).
Share and Cite
MDPI and ACS Style
Zhao, Y.; Zhao, X.; Dai, J.; Yu, W. Analysis of the Surface Subsidence Induced by Mining Near-Surface Thick Lead-Zinc Deposit Based on Numerical Simulation. Processes 2021, 9, 717. https://0-doi-org.brum.beds.ac.uk/10.3390/pr9040717
AMA Style
Zhao Y, Zhao X, Dai J, Yu W. Analysis of the Surface Subsidence Induced by Mining Near-Surface Thick Lead-Zinc Deposit Based on Numerical Simulation. Processes. 2021; 9(4):717. https://0-doi-org.brum.beds.ac.uk/10.3390/pr9040717
Chicago/Turabian StyleZhao, Yifan, Xingdong Zhao, Jiajia Dai, and Wenlong Yu. 2021. "Analysis of the Surface Subsidence Induced by Mining Near-Surface Thick Lead-Zinc Deposit Based on Numerical Simulation" Processes 9, no. 4: 717. https://0-doi-org.brum.beds.ac.uk/10.3390/pr9040717
Note that from the first issue of 2016, this journal uses article numbers instead of page numbers. See further details here.