Article

A Study of the Adsorption and Removal of Sb(III) from Aqueous Solution by Fe(III) Modified Proteus cibarius with Mechanistic Insights Using Response Surface Methodology

1
School of Civil Engineering, Hunan University of Science and Technology, Xiangtan 411201, China
2
School of Computing, Engineering & Physical Sciences, University of the West of Scotland, Paisley PA1 2BE, UK
*
Author to whom correspondence should be addressed.
Submission received: 31 March 2021 / Revised: 29 April 2021 / Accepted: 29 April 2021 / Published: 26 May 2021
(This article belongs to the Special Issue Novel Adsorbent for Environmental Remediation)

Abstract

:
Environmental pollution caused by excessive Sb(III) in the water environment is a global issue. We investigated the effect of processing parameters, their interaction and mechanistic details for the removal of Sb(III) using an iron salt-modified biosorbent (Fe(III)-modified Proteus cibarius (FMPAs)). Our study evaluated the optimisation of the adsorption time, adsorbent dose, pH, temperature and the initial concentration of Sb(III). We use response surface methodology to optimize this process, determining optimal processing conditions and the adsorption mechanism evaluated based on isotherm model and adsorption kinetics. The results showed that—(1) the optimal conditions for the adsorption of Sb(III) by FMPAs were an adsorption time of 2.2 h, adsorbent dose of 3430 mg/L, at pH 6.0 and temperature 44.0 °C. For the optimum initial concentration of Sb(III) 27.70 mg/L, the removal efficiency of Sb(III) reached 97.60%. (2) The adsorption process for Sb(III) removal by FMPAs conforms to the Langmuir adsorption isotherm model, and its maximum adsorption capacity (qmax) is as high as 30.612 mg/g. A pseudo-first-order kinetic model provided the best fit to the adsorption process, classified as single layer adsorption and chemisorption mechanism. (3) The adsorption of Sb(III) takes place via the hydroxyl group in Fe–O–OH and EPS–Polyose–O–Fe(OH)2, which forms a new complex Fe–O–Sb and X≡Fe–OH. The study showed that FMPAs have higher adsorption capacity for Sb(III) than other previously studied sorbents and with low environmental impact, it has a great potential as a green adsorbent for Sb(III) in water.

1. Introduction

Antimony (Sb) and its compounds have chronic toxicity, carcinogenicity and global impact [1] and excessive long-term exposure to it can cause serious harm to human health [2,3]. It is recognised as a priority pollutant by the World Health Organization (WHO), the United States Environmental Protection Agency (US EPA) and the European Union [2,3]. Antimony is found in nature in the form of elemental antimony, oxides (Sb2O3, Sb2S2O) and sulfides (Sb2S3) [4]. In the water environment, two oxidation states dominate (Sb(III) and Sb(V)) with the toxicity of Sb(III) being about ten times that of Sb(V) [5]. Situations where the water environment is contaminated (mining sites, urban systems) urgently require effective technologies for Sb(III) removal.
Biosorption of Sb has the advantages of being relatively low cost [6,7,8], produces limited secondary pollution, and is relatively easy to recycle [9,10]. A series of studies on discrete biological approaches have emerged successively, such as Planktonic Bacteria [11], Sulfate-reducing Bacteria [12,13], Aerobic Granular Sludge [7,14], Bacillus [15], Cyanobacteria [16]. The adsorption capacity of these biological adsorbents is low, but the modification of the biological systems with iron salts can significantly improve their adsorption capacity [17]. There are few studies on the removal of Sb by ferric-modified bacilli [17]. Biosorption of Sb(III) is affected by pH, temperature and reaction time [3,18]. In order to obtain a stable and efficient process to remove Sb(III) from water, we need to optimise the process parameters [19]. However, the interaction between these parameters makes the traditional single factor approach to optimization difficult to achieve the best effect. The response surface method is an effective method for the optimization of process parameters enabling a reduction in the number of tests carried out and provides an effective approach to evaluating the interaction of various influencing factors [20]. Based on this, an Fe(III)-modified Proteus carinii adsorbent (FMPA) was studied using a Box Behnken response surface method to optimise the adsorption of Sb(III) by FMPAs. The adsorption time, dosage, pH, temperature and initial concentration of Sb(III) as influencing factors, and the removal efficiency of Sb(III) as a response value were used to build the quadratic polynomial model linking removal efficiency and other factors. Subsequently, the best conditions for the adsorption of Sb(III) were used to fit to the adsorption isotherm and kinetics models. Using data from Scanning Electron Microscope-Energy Density Spectrum (SEM-EDS), Fourier Transform Infrared Spectroscopy (FTIR), X-Ray Diffraction (XRD), X-Ray Photoelectron Spectroscopy (XPS), the mechanistic details of the adsorption mechanism were analysed.

2. Material and Methods

2.1. Preparation of FMPAs

Proteus cibarius DSHN0704 (GenBank accession number is MH613348) was obtained from the soil containing high Sb during earlier studies. A 5 g aliquot of dry bacteria powder of Proteus carinii was added into 1000 mL solution of FeCl3 (Tianjin Damao Chemical Reagent Factory, AR, Tianjin, China) with a concentration of 0.1 mol/L, and oscillated at 35 °C and pH 3.0 for 24 h [9,19]. A High-Speed Freezing Centrifuge (TGL16M, Hunan Kaida Scientific Instrument Co., Ltd., Changsha, China) was used to centrifuge it at 8000 r/min for 8 min, and the product was repeatedly washed with deionised water until no Fe3+ ions are detected in the solution. Finally, it was dried at 80 °C to get FMPAs.

2.2. Experimental Design of Response Surface Optimisation

According to the principle of the Box–Behnken response surface optimisation [21], the experimental study was established to remove Sb(III) by FMPAs in low (−1), middle (0), high (1) levels, respectively. Adsorption time, dosing quantity, pH, temperature, and Sb(III) initial concentration were used as independent variables, with Sb(III) removal efficiency as the response value to look at the independent variable response and define the values for the main factors and their interaction. The horizontal coding and test values of independent variables were shown in Table 1. There are forty-six groups of optimization tests (Table 2), among which six groups of central point tests were designed to be repeated, and each group of tests were repeated three times.

2.3. Sequential Batch Adsorption Test

The adsorption tests in this study were all carried out in a sequencing batch reactor. During the trial, the determination of the Sb(III) concentration at different times was input to calculate removal efficiency ( R = ( C 0 C e ) × 100 % / C 0 ) (%), C0 and Ce are concentration (mg/L) before and after adsorption of Sb(III), respectively.
Isothermal adsorption experiment—a series of 100 mL solutions of different concentrations (10–100 mg/L) of Sb(III) were used to carry out the isotherm adsorption test under optimal conditions, with the concentration of Sb(III) measured in the solution after reaching adsorption equilibrium, and the adsorption equilibrium (qe) was determined. Langmuir [22], Freundlich [22] and Dubinin–Radushkevich (D–R) [23] isotherm adsorption models [Equations (1)–(4)] were used to fit test results.
C e q e = 1 q max K L + C e q max
ln q e = ln K F + ln C e n
ln q e = ln q max K D R ε 2
ε = R T ln ( 1 + 1 C e )
In which Ce is Sb(III) concentration after reaching adsorption equilibrium, mg/L, qe and qmax are equilibrium adsorption capacity and maximum adsorption capacity, mg/g, respectively. KL is the adsorption constant of the Langmuir isothermal adsorption model, L/mg. KF is the adsorption constant of Freundlich isothermal adsorption model, L/g. n is the adsorption constant of Freundlich isothermal model, dimensionless. ε is Polenyi potential, J/mol. KDR is a dimensionless constant related to adsorption energy. R is the gas constant, taking a value of 8.314 J/(mol·K). T is the adsorption temperature, K.
Adsorption kinetics experiment—a series of 100 mL of Sb(III) solutions at a concentration of 100 mg/L were used under the optimized conditions to carry out the dynamic adsorption test. The Sb(III) concentration in the solution was determined with time, and the Sb(III) removal efficiency calculated. Four adsorption kinetics models [Equations (5)–(8)], including quasi-first-order kinetics, quasi-second-order kinetics, Elovich and the Intra-particle diffusion model [23], were used to fit experimental results to analyse rate control and adsorption mechanism of the adsorption reaction.
q t = q e ( 1 e k 1 t )
q t = q e q e / ( k 2 q e t + 1 )
q t = ln ( α β ) / β + ( 1 / β ) ln t
q t = α i + k D R t 0.5
In which qt and qe are, respectively, the adsorption capacity at t (min) and adsorption equilibrium, mg/g. k1, k2, α are the adsorption rate constants of the corresponding model, and units are min−1, g/(mg·min), mg/min, respectively. β is the constant related to the surface area of the adsorbent and the chemical activation energy, g/mg. αi (mg/g), kDR (mg/(g·min0.5)) are the diffusion model constants and adsorption rate constants in a certain stage of the adsorption process, respectively.

2.4. Characterization Methods of Sorbent before and after Adsorption

SEM (JEOL7800F, JEOL, Tokyo, Japan) was used to characterize the morphology of FMPAs before modification, FMPAs and FMPAs after adsorption of Sb(III), and EDS (EDX, Oxford, JEOL, Tokyo, Japan) was used to determine the elemental composition of FMPAs before modification, and FMPAs after adsorption of Sb(III). FTIR (Nicolet 6700, Thermo Fisher, Waltham, MA, USA) was used to analyse the functional groups and chemical bond composition of FMPAs before modification and FMPAs after adsorption of Sb(III), XRD (D8ADVANCE Da Vinci, Bruker, Berlin, Germany) was used to characterize the crystal structure of FMPAs before modification, and FMPAs after adsorption of Sb(III), in which the scanning range was 5°–90°, and the scanning speed was 6°/min. XPS (Thermo SCIENTIFIC ESCALAB 250Xi, Thermo Scientific, Waltham, MA, USA) was used to analyse the valence states of Fe, O, Sb and other elements before and after the adsorption of Sb(III) by FMPAs. Finally, we combined the characterization results to analyse the mechanism of FMPA adsorption of Sb(III).

2.5. Reagents and Detection Methods

A standard stock solution of Sb(III) with concentration of 1000 mg/L was prepared from antimony potassium tartrate (Tianjin Fengchuan Chemical Reagent Technology Co., Ltd. AR, Tianjin, China) and diluted as required. The reagents used were all analytically pure and prepared with deionized water. An atomic absorption spectrophotometer (AA7002A, Beijing Sanxiong Technology Co, Ltd., Beijing, China) was used to determine the concentration of Sb(III) in the solution [23], and tests were completed within 24 h after experimental reactions, with a deionized water blank. The lowest detection concentration of this method was 1 μg/L, the recovery of Sb was above 93%, and the analytical error was less than 1% [24]. The Box–Behnken response surface was optimized by Design-Expert. V8.0.6.1 software.

3. Results and Discussion

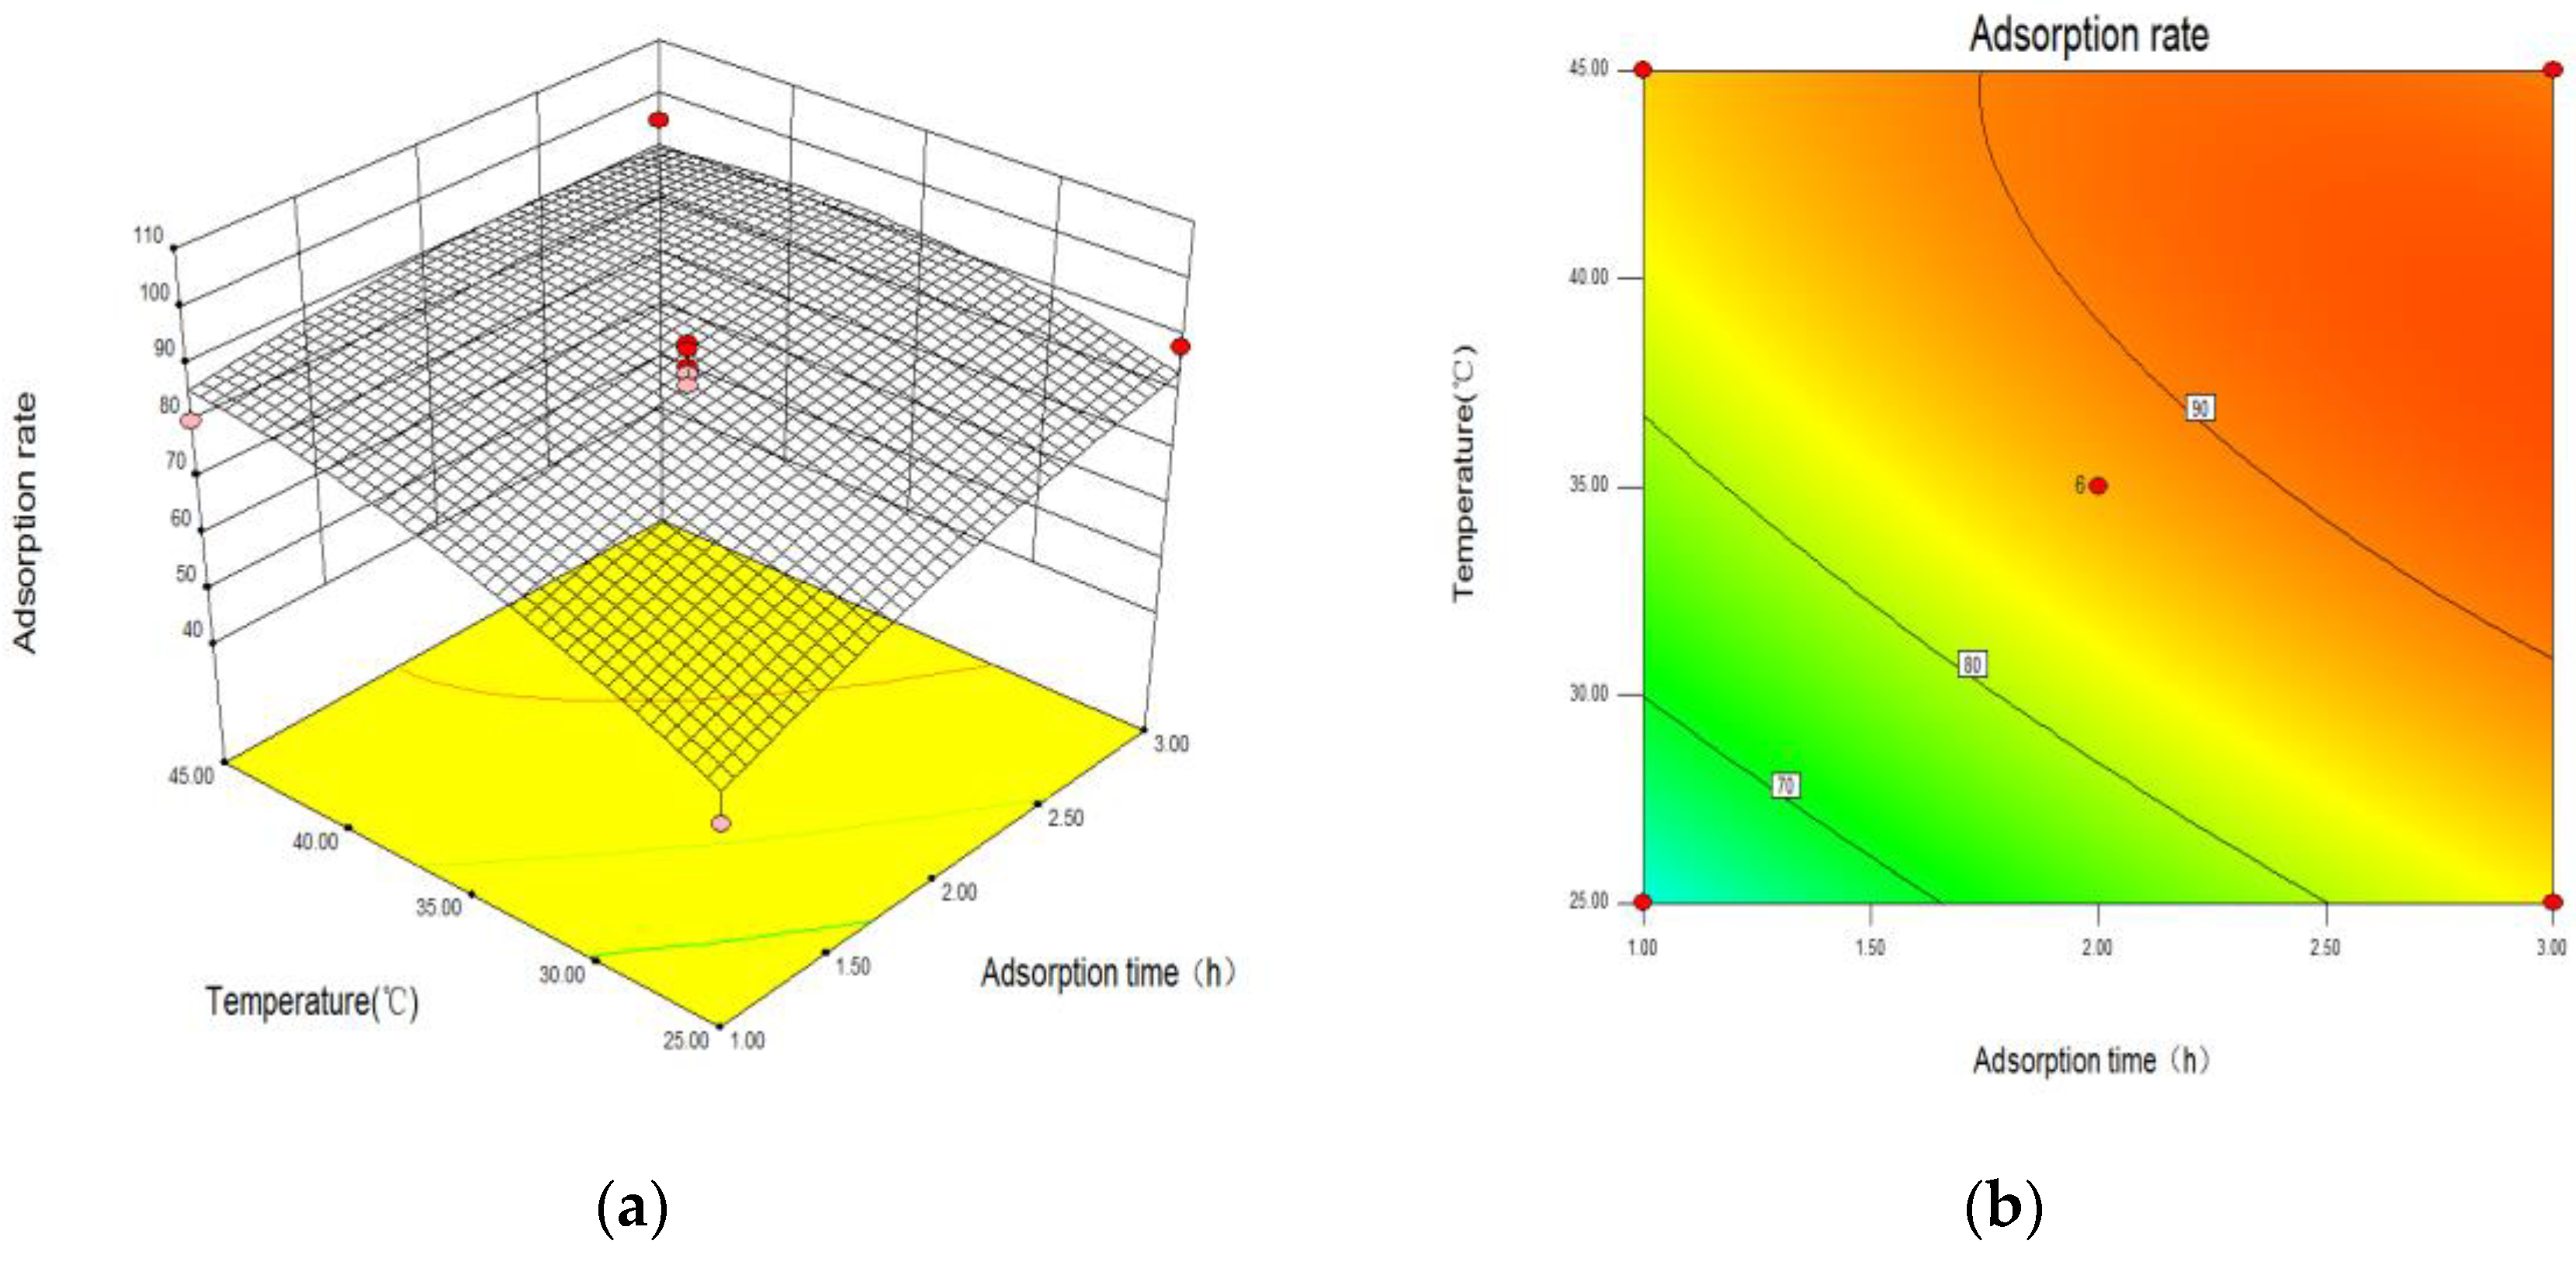
3.1. Response Surface Optimization of Adsorption Conditions

Taking adsorption time, dosing quantity, pH, temperature, and Sb(III) initial concentration as independent variables, with Sb(III) removal efficiency as the response value, the Box–Behnken response surface quadratic polynomial model is shown in Equation (9), with the results and analysis of variance shown in Table 2 and Table 3, respectively.
Y = 60.188 + 30.039 A + 0.043 B 6.410 C + 5.267 D 4.403 E 1.625 × 10 4 A B + 0.114 A C 0.506 A D + 0.252 A E + 1.006 × 10 3 B C 5.925 × 10 4 B D + 8.795 × 10 4 B E + 0.132 C D 0.102 C E + 0.050 D E 2.574 A 2 6.026 × 10 6 B 2 + 0.135 C 2 0.050 D 2 0.012 E 2
In which Y is the response value, %, A, B, C, D, E represent the adsorption time (h), FMPA dosing amount (mg/L), pH, temperature (°C), Sb(III) initial concentration (mg/L), and other independent variables corresponding to the actual value.
It can be seen from Table 3 that the F value of the model was 20.43, p < 0.0001, indicating that the nonlinear equation relationship between the respective variables described by the regression equation and the response value was significant. The model determination coefficient was R2 = 0.9423, indicating that only 5.77% could not be explained by the regression equation. RAdj2 (corrected complex correlation coefficient) and RPred2 (predicted complex correlation coefficient) was 0.1101 (<0.2). The coefficient of variation CV was 5.03% (<10%) and SNR was 17.662 (>4), indicating that the reliability and accuracy of the prediction by the model was high [21,25]. Also, Table 3 shows that the adsorption time, FMPA dosing quantity, temperature, and Sb(III) initial concentration have a significant effect on the adsorption of Sb(III) (p < 0.05), while the effect of pH was small, consistent with results elsewhere [26]. For the interactive variables, adsorption time and temperature, dosing quantity and temperature, dosing quantity and Sb(III) initial concentration, temperature and Sb(III) initial concentration have a significant impact on the adsorption of Sb(III). In the quadratic term, the dosing quantity and temperature of Sb(III) removal have the most significant effects on the adsorption. For all other interactions, P values were greater than 0.05 with no significant impact on the removal efficiency of Sb(III).
From Figure 1, the removal efficiency of Sb(III) is proportional to the FMPA dosing quantity and temperature—the reason being that the total number of adsorption sites would increase in the system with the increase of FMPA dosage, promoting the adsorption reaction. The increase of temperature can improve the diffusion coefficient of adsorbate in the pores and promote the adsorption reaction [21]. The rate of Sb(III) adsorption and initial concentration is inversely proportional. There is no significant correlation with the pH of the solution. This suggests that higher temperature, increasing adsorbent dosing quantity and corresponding lower Sb(III) initial concentration in the solution will help improve adsorption of Sb(III) by FMPAs.
By taking the first derivative of Equation (1) to get the best reaction condition determining an adsorption time of 2.2 h, an FMPA dose of 3430 mg/L, pH = 6.00, the temperature of 44.0 °C were used for an initial Sb(III)concentration of 27.70 mg/L. In optimal conditions, the FMPA removal efficiency for Sb(III) and the maximum adsorption capacity(qmax) were 97.60% and 30.612 mg/g. This is close to the predicted value of 99.07% obtained by the regression equation simulation, and the prediction accuracy is as high as 98.50%, indicating that the predicted value and the actual value have a high degree of fit.

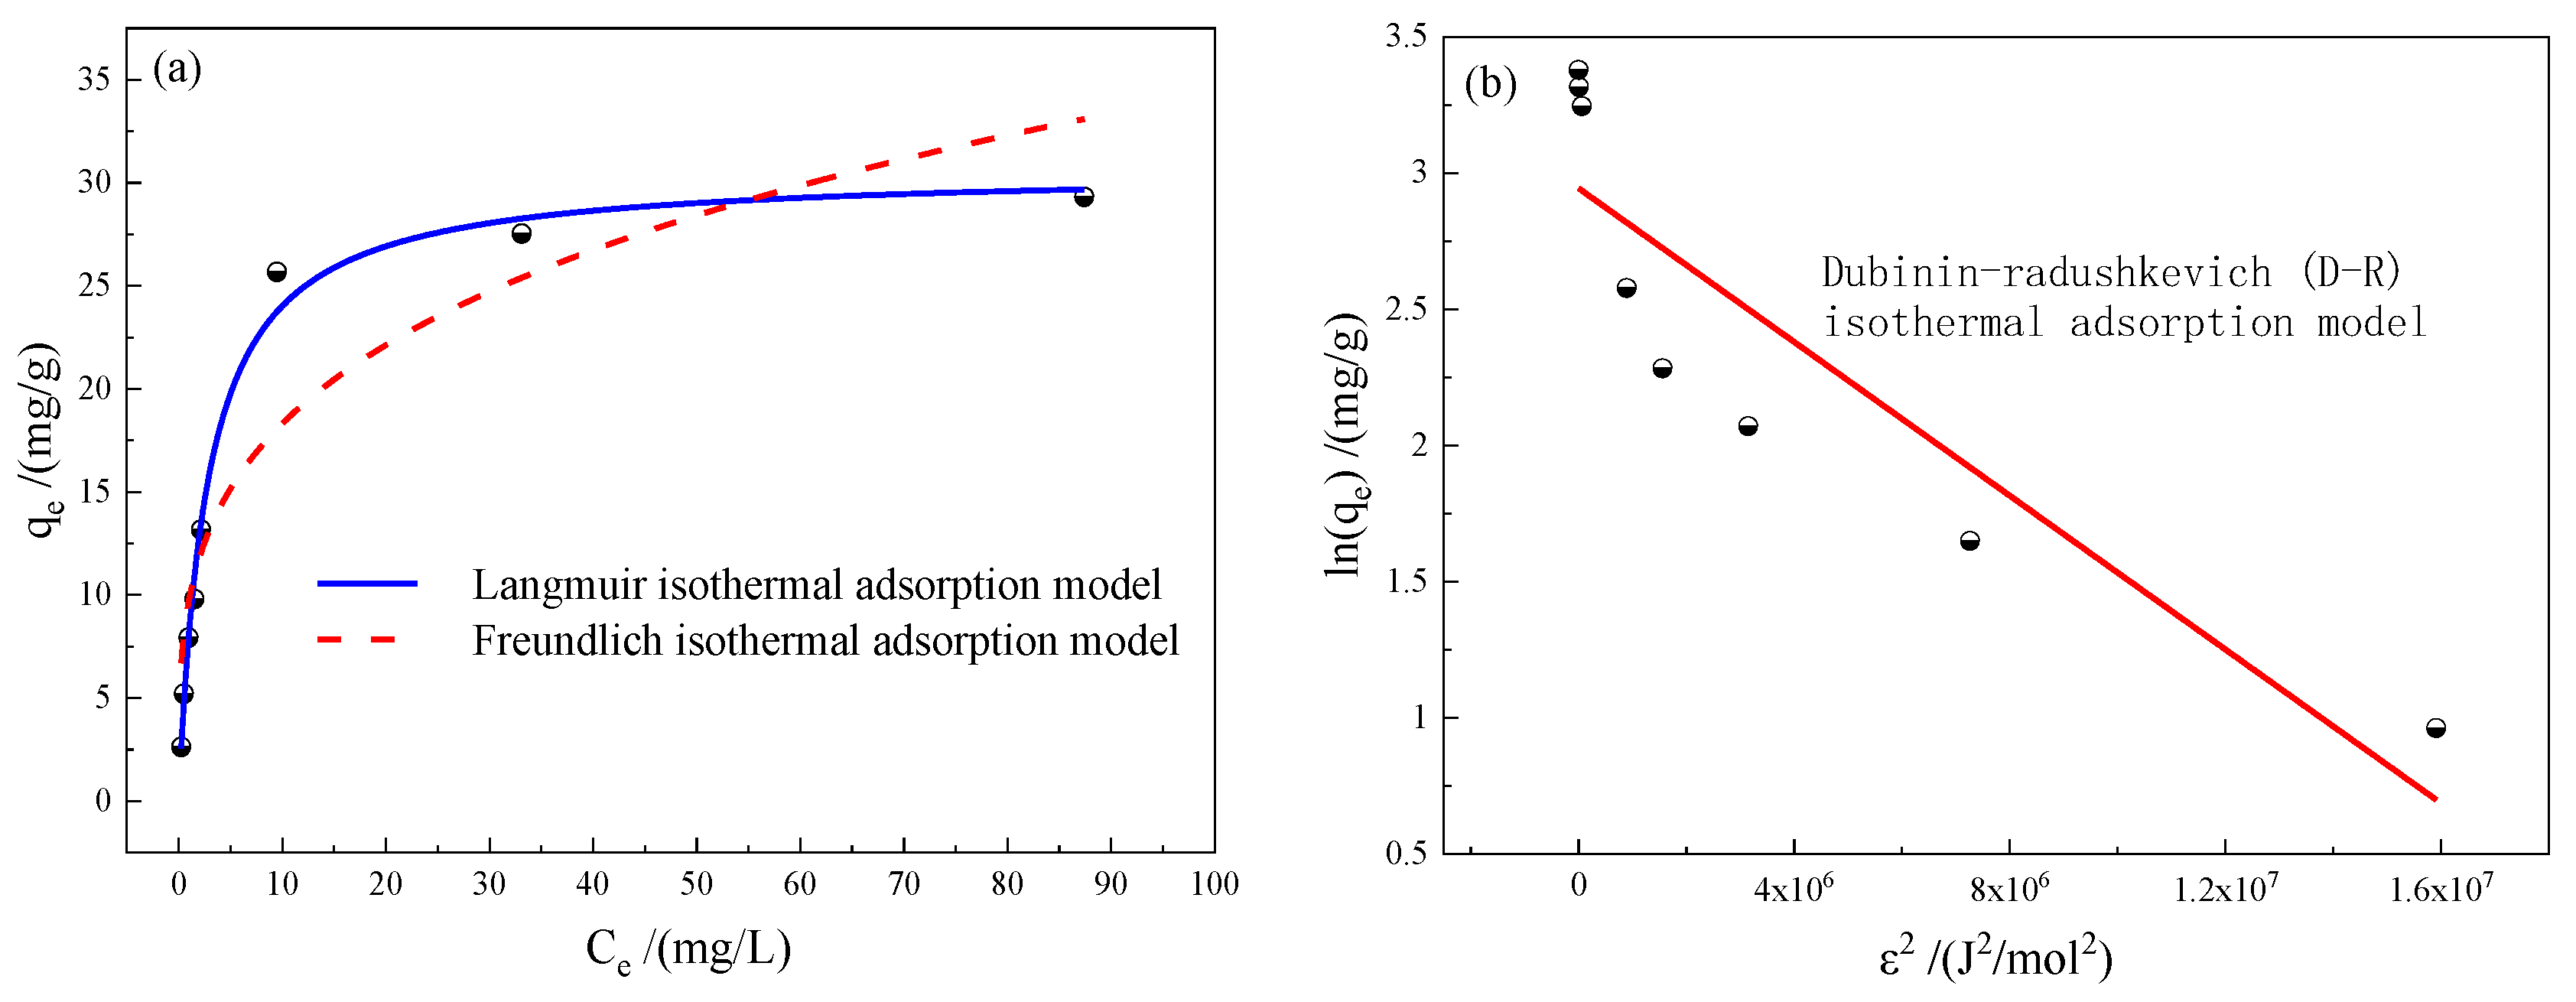
3.2. Adsorption Isotherm Model

The fitting results for Langmuir and Freundlich adsorption isotherm models of the adsorption of Sb(III) by FMPAs are shown in Figure 2a. The results for the D-R adsorption isotherm model are shown in Figure 2b, and the values of each model parameter are shown in Table 4. In Figure 2, the three types of adsorption isotherm models have a regression coefficient R2 of 0.993, 0.866 and 0.810, indicating that the Langmuir isotherm adsorption model provides the best fit for Sb(III) removal by FMPAs. The maximum adsorption capacity qmax is 30.612 mg/g. Langmuir isotherm adsorption model assumes that all solute adsorption sites in adsorption substrate surface have equal affinity, and the adjacent adsorption processes do not influence each other [27,28,29], so we speculate that the process of adsorption of Sb(III) by FMPAs is a single layer adsorption and chemical adsorption step.
A comparison of the performance of adsorption-driven removal of antimony by previously studied materials and the work reported here is shown in Table 5. Our Fe(III)-modified antimony-resistant bio-adsorbent has a higher adsorption capacity compared with Fe(III)-modified humus sludge [27], cyanobacteria [29], and microcystis [16]. The optimum pH for removal by FMPAs is 6.00, and in general, Sb-polluted water bodies are weakly acidic and close to neutral. Many other sorbents perform best under strongly acidic conditions which makes our system of great potential value in the treatment of grossly polluted environments.

3.3. Kinetic Model of Adsorption

The results of the fit for the dynamic model-related parameters to the adsorption Sb(III) by FMPAs are given in Table 6. From Table 6, a first order kinetics model is the best fit for the test data (R2 = 0.997), and the model fits the theoretical value of qe (qe = 5.071 mg/g), which was close to the test values (qe = 5.199 mg/g), implying that the process of adsorption Sb(III) by FMPAs follows a first order kinetics model. In addition, a quasi-two-stage kinetic model was also a good fit (R2 = 0.990), indicating that the adsorption reaction was mainly chemical adsorption [4]. According to the parameters of the intra-particle diffusion model, the adsorption process can be divided into two stages—a fast adsorption and slow adsorption, and the latter is dominant. The different slopes for the best fit lines for the two stages indicates that the adsorption process has an initial gradation and the adsorption process is controlled by the boundary layer thickness. The intercepts (α1, α2) of the best fit equation are the theoretical boundary layer thickness. There is a significant difference between α1 (0.232 mg/g) and α2 (4.656 mg/g), which indicates that the pore diffusion rate is not the only factor controlling the adsorption process. Therefore, the kinetics of adsorption Sb(III) by FMPAs is determined by the boundary layer and external mass transfer effects [23,30].

3.4. Characterization and Adsorption Mechanism of FMPAs

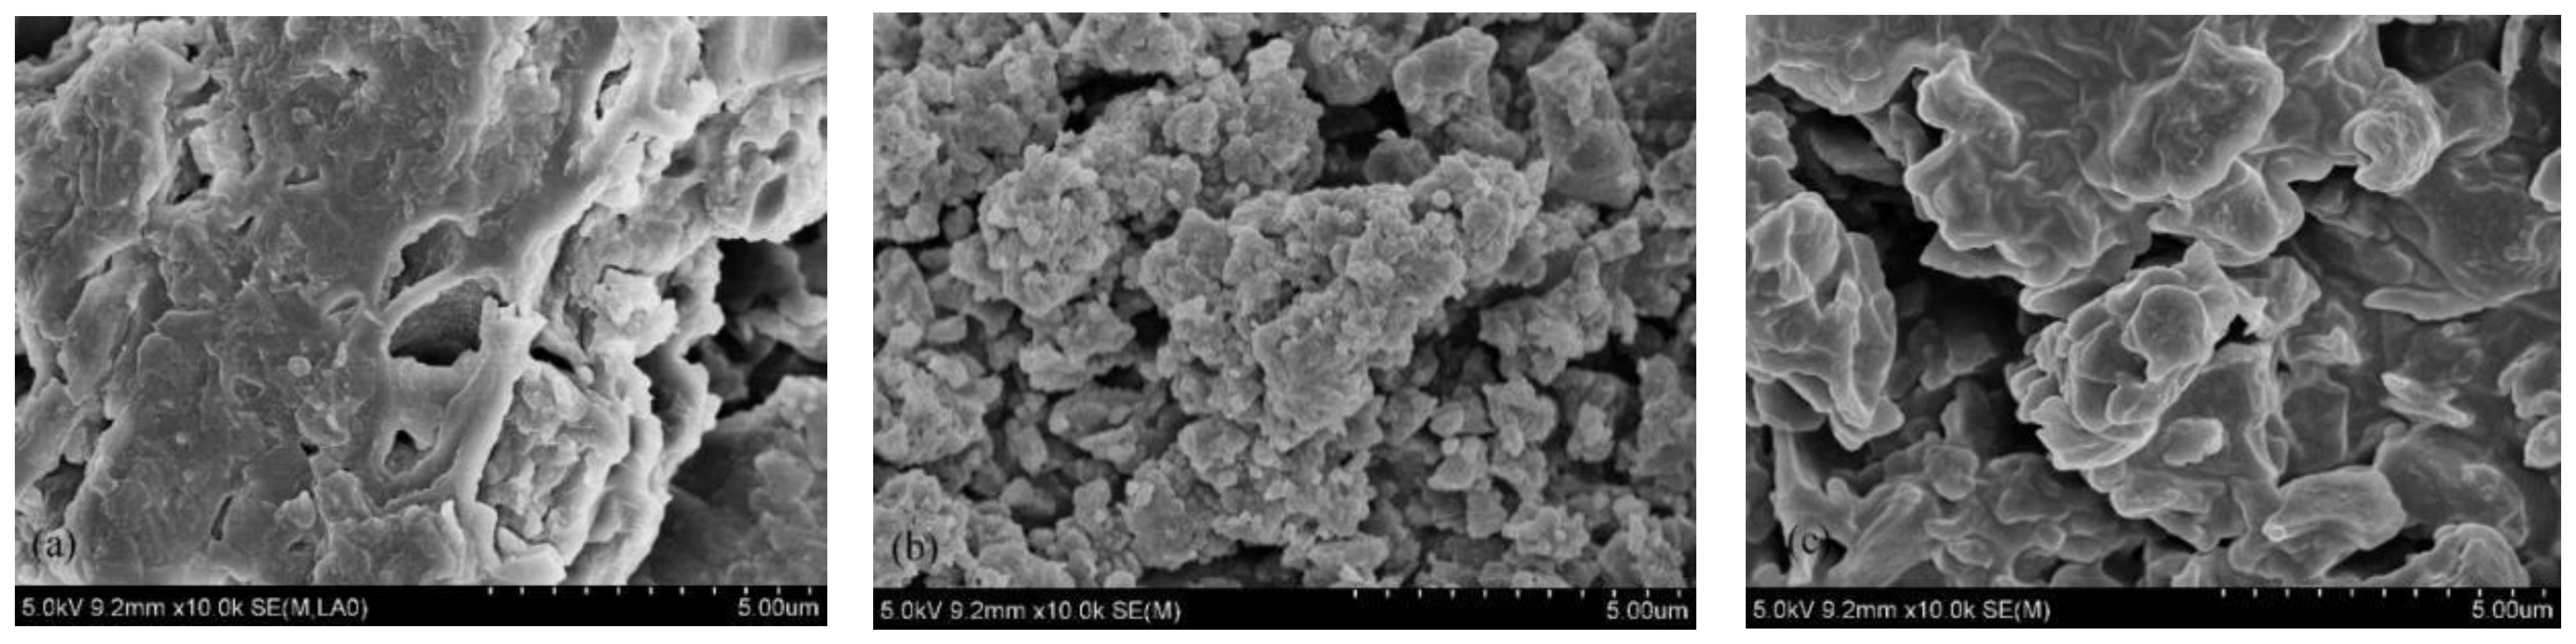
3.4.1. SEM-EDS Analysis

In Figure 3, the scanning electron microscopy of the topography of FMPAs before and after adsorption of Sb(III) is shown. It is clear in Figure 3a that the surface of FMPAs before modification was smooth and the voids are much less apparent. After the modification by Fe(III), the surface of the FMPAs has become uneven, and bonding processes provide more adsorption sites, with the structure of cracks, pores and holes increasing significantly in Figure 3b, providing more contact area for adsorption [27]. After adsorption of Sb(III), the voids decrease significantly, surface edges are blurred, as shown in Figure 3c. We used EDS to perform energy spectrum analysis on FMPAs. The composition of FMPAs before modification and FMPAs after modification and after the adsorption of Sb(III) are shown in Table 7. After modification by Fe(III), the contents of Na, K, S and other elements in FMPAs are lower, while the content of Fe increased to 10.8%, suggesting that the ion exchange reaction between Na, K, S and Fe(III) occurred during the modification process [27], while Fe had been loaded onto the surface of the adsorbent. After the adsorption of Sb(III), the Fe element content decreased on the surface of the FMPAs, and the Sb content increased from 0% to 0.81%, and Sb(III) is adsorbed to the FMPAs, which is consistent with studies elsewhere [28].

3.4.2. Infrared Spectral Analysis

It can be seen from Figure 4 that the surface of FMPAs is rich in a variety of organic functional groups. The wave number 3395 cm−1 before adsorption in the figure represents the overlapping area of O-H and N-H functional groups [31]. The absorption peak of FMPAs after adsorption of Sb(III) has shifted significantly from 3395 to 3338 cm−1. The absorption peak of hydroxyl (–OH) shifted from 1043 to 1046 cm−1 after adsorption, which indicates that the O-H and N-H of the polysaccharide component contained in EPS in FMPAs played a greater role in the adsorption of Sb(III). This may be mainly through complexation [31,32], as the wave number before adsorption 1401 cm−1 represents the C=O stretching vibration and the skeleton vibration of the C-C bond [22,33], the vibration peak after adsorption of Sb(III) was 1401 cm−1, and the small range shift to 1407 cm−1 indicated that the adsorption process of the C=O bond and C-C single bond to Sb(III) was less likely. The absorption vibration peak of the C=C double bond was represented by the wave number of 1634 cm−1 [33], and after the adsorption of Sb(III), the vibration peak shifted to 1652 cm−1, indicating that the C=C double bond played a greater role in the adsorption of Sb(III) by FMPAs. The wavenumber 592 cm−1 represents the low-frequency FeIII–O vibration peak [33]. After FMPAs adsorbed Sb(III), the vibration peaks were shifted to 570 cm−1. The reason for the deviation may be the increase of cation vacancies in the sample molecule, as Sb(III) occupies the position which originally belonged to Fe(III), and new valence bonds are formed with surrounding atoms. In addition, P=O, S=O, P–O, Si–O and other groups have strong absorption peaks at 1400–800 cm−1, which can provide information about phosphoric acid groups and sulphur-containing groups [34]. Combined with the element content before modification (Table 6), it can be seen that there were P=O and S=O groups in the adsorbent before modification, and the P, S, and O element contents after modification and adsorption were all reduced. The P=O and S=O groups have ion exchanged with Fe3+, and may have played a role in the adsorption of Sb [14].

3.4.3. XPS Analysis of FMPAs before and after Adsorption

In Figure 5a, the scan spectra of XPS before and after adsorption by FMPAs are shown. It can be seen from Figure 5a that the main components in FMPAs were O, Fe and Cl, which were consistent with the EDS analysis (Table 6). Research [23] showed that Fe exists in the form of FeOOH and Fe2O3 near the binding energies of 711 and 724 eV, respectively. However, FMPAs have obvious diffraction peaks at the binding energies of 711.50 and 724.78 eV (Figure 5b). After modification by Fe(III), Fe in FMPAs mainly exists in the form of FeOOH and Fe2O3 [4], and FeOOH and Fe2O3 have a good effect on adsorption Sb(III) [18], so FMPA modification by Fe(III) can promote its effect on the adsorption of Sb(III). After FMPAs adsorbed Sb(III), the binding energies corresponding to the Fe diffraction peaks became 711.56 and 724.73 eV, respectively (Figure 5b). This implies that Sb(III) replaced the –OH in FMPAs and combined with –O–Fe became an Fe–O–Sb coordination compound [22,23], facilitating Sb(III) adsorption. In addition, after adsorption of Sb(III), there were peaks at binding energies of 531.5 and 530.05 eV. These two peaks correspond to Sb(V) and Sb(III), and it showed that Sb(III) was partially oxidized to Sb(V) during the adsorption process. Because Fe3O4 iron may exist in FMPAs, it was speculated that there was a process of Fe(III) reduction to Fe2+ during the oxidation process of Sb(III). At the same time, XRD was used to analyse the powders which belong to FMPAS after adsorption of Sb(III). There were no obvious characteristic peaks before and after adsorption of Sb(III). The conclusion that there is an extremely weak diffraction peak was consistent with other work [35]. The reason may be that there are few crystalline substances produced during the Fe(III) modification process, but the biomass background of the adsorbent will interfere with the signals of these crystalline substances, and substances also affect the crystallinity of crystalline substances.

3.4.4. The Mechanism of FMPAs Adsorbing Sb(III) in Water

In summary, the main mechanism of FMPA adsorption and removal of Sb(III) is as follows:
(a) The oxidizing properties of FMPAs can promote the adsorption and removal of Sb(III). The Proteus carinii has the ability to oxidise Sb(III)—as confirmed by the XPS characterization, it can partially oxidize Sb(III) to Sb(V). The EPS in FMPAs contains a lot of polysaccharides, and polysaccharides contain a lot of –OH, Fe(OH)3 formed by hydrolysis of Fe(III), which also contains a lot of –OH. During the modification process, Fe(III) is hydrolysed to form an iron hydroxyl group [Equation (10)], where Fe(III) undergoes an ion exchange reaction with Na+ and K+ in polysaccharides [Equations (11) and (12)] to produce Polyose-Fe [9,19], the complexation of amorphous amorphous iron with polysaccharide hydroxyl [Equation (13)], producing Polyose–O–Fe(OH)2 [14] and other compounds that are beneficial to the adsorption and removal of Sb(V).
Fe3+ + H2O → Fe(OH)3(s) + H+
(EPS–Polyose–Na)3 + Fe3+ → Polyose–Fe + 3Na+
(EPS–Polyose–K)3 + Fe3+ → Polyose–Fe + 3K+
EPS–Polyose–OH + Fe(OH)3 → Polyose–O–Fe(OH)2 + H2O
When the pH is between 2.7 and 12, Sb(V) mainly exists in the form of Sb(OH)6. According to the Fayangs rule [31], the surface of Fe(OH)3 colloid is positively charged. At the same time, as the pH value decreases, the protonation of the iron hydroxyl group increases the positive charge on the surface of FMPAs [31]. This is seen in the complexation reaction of Equation (14), thereby promoting the adsorption and removal of Sb(OH)6. Polyose–Fe, Polyose–O–Fe(OH)2 can react with Sb(OH)6 (Equations (15) and (16)), so that Sb(OH)6 can be removed by adsorption. Fe(III) is reduced to free Fe2+ which attached to FMPAs [Equations (17) and (18)], which increases the positive charge of the adsorbent [8], and promotes the removal of Sb(V).
H+ + Fe–O–OH + Sb(OH)6 → Fe–O–Sb(OH)6 + H2O
H+ + Polyose–Fe + Sb(OH)6 → Polyose–Fe–Sb(OH)5 + H2O
H+ + EPS–Polyose–O–Fe(OH)2 + Sb(OH)6 → EPS–Polyose–O–Fe–OH–Sb(OH)6 + H2O
Sb(III) + SFe(III) → SFe(III)–Sb(V) + Fe2+
2Sb(OH)3 + O2 + 4H2O → 2Sb(OH)6 + 2H+
(b) The iron-containing compounds in FMPAs form coordination compounds with Sb(III), so that Sb(III) can be adsorbed. When pH = 2–7, Sb(III) mainly exists in the form of Sb(OH)3 [36], Sb(OH)3 easily forms X≡Fe–Sb(OH)2 with Fe3O4 [26], but this is due to FMPAs. The iron in the iron is mostly in the form of Fe(OH)3, so only a small amount of Fe3O4 may exist. In addition, Sb(III) can exist in the form of HSbO2, but this form of Sb(III) is less, and Fe–O–OH and Polyose–O–Fe(OH)2 can react with HSbO2 [Equations (19) and (20)], and Sb(III) can react with iron-coordinated anions [Equations (21) and (22)], [26].
Fe–O–OH + HSbO2 → Fe–O–SbO2 + H2O
EPS–Polyose–O–Fe(OH)2 + HSbO2 → EPS–Polyose–O–Fe–OH–SbO2 + H2O
X≡Fe–OH + HSbO2 → X≡Fe–SbO2 + H2O
X≡Fe–OH + Sb(OH)3 → X≡Fe–Sb(OH)2 + H2O

4. Conclusions

(a)
Adsorption time, dosage, temperature, Sb(III) initial concentration and other factors have a significant influence on the adsorption of Sb(III) by FMPAs, but pH has no significant effect on it. The optimal adsorption condition is the adsorption time of 2.2 h, FMPA dosage is 3430 mg/L, pH = 6.0, temperature is 44.0 °C, initial concentration of Sb(III) is 27.70 mg/L, and the average removal efficiency is as high as 97.60%;
(b)
The Langmuir isotherm model can fit the process of FMPA adsorption of Sb(III) well (R2 = 0.993), the maximum adsorption capacity is 30.612 mg/g, and the adsorption is a single layer adsorption, the quasi-first order kinetic model can better fit the adsorption kinetic process, the adsorption process is mainly chemical adsorption, and it is determined by the boundary layer effect and the external mass transfer effect; and
(c)
FMPAs can oxidize part of Sb(III) to Sb(Ⅴ), which reflects a certain degree of oxidation. FMPAs contain Fe–O–OH, EPS–Polyose–O–Fe(OH)2 and X≡Fe–OH and other forms of hydroxyl, which is the main reason for their excellent antimony removal performance. Sb(III) and Sb(Ⅴ) can replace the hydroxyl group by coordination to form Fe–O–Sb and X≡Fe–Sb complexes, thereby removing Sb(III) from the aqueous solution. Therefore, FMPAs have potential application value.

Author Contributions

X.L. preformed laboratory experiments. X.L. and Z.T. provided significant input on experimental design. R.D. conceived of the idea of this study and provided financial means. S.Z. and X.Z. interpreted the data of response surface. X.L. and J.W. analyzed the data and prepared the manuscript. A.H. assessed data, study impact and manuscript preparation. All authors have read and agreed to the published version of the manuscript.

Funding

This study was financially supported by the National Natural Science Foundation of China (No. 41672350) and the scientific research project of the Hunan Provincial Education Department (No. 18A184 and No. 17B097).

Institutional Review Board Statement

Not applicable.

Informed Consent Statement

Not applicable.

Data Availability Statement

All data generated or analyzed during this study are included in the manuscript.

Conflicts of Interest

The authors declare no conflict of interest.

References

  1. Wen, B.; Zhou, J.; Zhou, A.; Liu, C.; Li, L. A review of antimony (Sb) isotopes analytical methods and application in environmental systems. Int. Biodeterior. Biodegrad. 2018, 128, 109–116. [Google Scholar] [CrossRef]
  2. Li, J.; Zheng, B.; He, Y.; Zhou, Y.; Chen, X.; Ruan, S.; Yang, Y.; Dai, C.; Tang, L. Antimony contamination, consequences and removal techniques: A review. Ecotoxicol. Environ. Saf. 2018, 156, 125–134. [Google Scholar] [CrossRef]
  3. Ungureanu, G.; Santos, S.; Boaventura, R.; Botelho, C. Arsenic and antimony in water and wastewater: Overview of removal techniques with special reference to latest advances in adsorption. J. Environ. Manag. 2015, 151, 326–342. [Google Scholar] [CrossRef]
  4. Ke, S.Y.; Shi, H.L.; Liu, D.L. Antimony pollution and its toxic effects and bioavailability. Chem. World 2005, 46, 382–384. [Google Scholar]
  5. He, M.C.; Wan, H.Y. The distribution, existence, toxicity and bioavailability of antimony in the environment. Prog. Chem. 2004, 131–135. [Google Scholar]
  6. Sun, W.; Xiao, E.; Kalin, M.; Krumins, V.; Dong, Y.; Ning, Z.; Liu, T.; Sun, M.; Zhao, Y.; Wu, S.; et al. Remediation of antimony-rich mine waters: Assessment of antimony removal and shifts in the microbial community of an onsite field-scale bioreactor. Environ. Pollut. 2016, 215, 213–222. [Google Scholar] [CrossRef]
  7. Wan, C.; Wang, L.; Lee, D.-J.; Zhang, Q.; Li, J.; Liu, X. Fungi aerobic granules and use of Fe (III)-treated granules for biosorption of antimony(V). J. Taiwan Inst. Chem. Eng. 2014, 45, 2610–2614. [Google Scholar] [CrossRef]
  8. Zhao, J.J.; Qi, J.; Ji, Q.H.; Lan, H.C.; Liu, H.J.; Qu, J.H. Adsorption properties of iron-manganese modified Microcystis aeruginosa to antimony. Chin. J. Environ. Eng. 2019, 13, 1573–1583. [Google Scholar]
  9. Li, C.Y.; Zhuang, Z.C.; Jin, X.Y.; Chen, Z.L. Co-adsorption behavior of methylene blue and copper ions on graphene oxide. Acta Sci. Circumstantiae 2015, 35, 3163–3169. [Google Scholar]
  10. Deng, R.J.; Jin, C.S.; Hou, B.L.; Tang, Z.E.; Ren, B.Z. Research progress in the treatment of antimony-containing heavy metal wastewater by microorganisms. Environ. Pollut. Control 2018, 40, 104–111. [Google Scholar]
  11. Li, Y.; Wu, J.; Hu, W.; Ren, B.; Hursthouse, A.S. A mechanistic analysis of the influence of iron, xidizing bacteria on antimony (V) removal from water by microscale zero alent iron. J. Chem. Technol. Biotechnol. 2018, 93, 2527–2534(8). [Google Scholar] [CrossRef]
  12. Zhang, G.; Ouyang, X.; Li, H.; Fu, Z.; Chen, J. Bioremoval of antimony from contaminated waters by a mixed batch culture of sulfate-reducing bacteria. Int. Biodeterior. Biodegrad. 2016, 115, 148–155. [Google Scholar] [CrossRef]
  13. Wang, H.; Chen, F.; Mu, S.; Zhang, D.; Pan, X.; Lee, D.-J.; Chang, J.-S. Removal of antimony (Sb(V)) from Sb mine drainage: Biological sulfate reduction and sulfide oxidation-precipitation. Bioresour. Technol. 2013, 146, 799–802. [Google Scholar] [CrossRef]
  14. Wang, L.; Wan, C.; Lee, D.J.; Liu, X.; Zhang, Y.; Chen, X.F.; Tay, J.H. Biosorption of antimony(V) onto Fe (III)-treated aerobic granules. Bioresour. Technol. 2014, 158, 351–354. [Google Scholar] [CrossRef]
  15. Li, X.J.; Cheng, Y.X.; Gong, D.X.; Xiang, R.J.; Wang, Q.Q. Bacillus sp. Treatment of antimony-containing wastewater. Environ. Sci. Technol. 2012, 158, 162–166. [Google Scholar]
  16. Wu, F.; Sun, F.; Wu, S.; Yan, Y.; Xing, B. Removal of antimony (III) from aqueous solution by freshwater cyanobacteria Microcystis biomass. Chem. Eng. J. 2012, 183, 172–179. [Google Scholar] [CrossRef]
  17. Deng, R.-J.; Jin, C.-S.; Ren, B.-Z.; Hou, B.-L.; Hursthouse, A.S. The potential for the treatment of antimony-containing wastewater by iron-based adsorbents. Water 2017, 9, 794. [Google Scholar] [CrossRef] [Green Version]
  18. He, M.; Wang, N.; Long, X.; Zhang, C.; Ma, C.; Zhong, Q.; Wang, A.; Wang, Y.; Pervaiz, A.; Shan, J. Antimony speciation in the environment: Recent advances in un-derstanding the biogeochemical processes and ecological effects. J. Environ. Sci. 2019, 75, 14–39. [Google Scholar] [CrossRef]
  19. Wang, Y.J.; Wang, X.J. Response surface methodology to optimize the adsorption of modified banana peel on pb2+. Biotechnol. Bull. 2019, 35, 188–194. [Google Scholar]
  20. van den Hoop, M.A.; van Leeuwen, H.P.; Pinheiro, J.; Mota, A.M.; Goncalves, M.D.L.S. Voltammetric analysis of the competition between calcium and heavy metals for complexation by humic material. Colloids Surf. A Physicochem. Eng. Asp. 1995, 95, 305–313. [Google Scholar] [CrossRef]
  21. Wang, Y.H.; Zou, X.G.; Shu, R.J.; Huang, J.L.; Lv, W.Y.; Yao, K. Response surface optimization and mechanism of humin for Pb2+ adsorption. China Environ. Sci. 2017, 37, 1814–1822. [Google Scholar]
  22. Qi, Z.; Joshi, T.P.; Liu, R.; Liu, H.; Qu, J. Synthesis of Ce (III)-doped Fe3O4 magnetic particles for efficient removal of antimony from aqueous solution. J. Hazard. Mater. 2017, 329, 193–204. [Google Scholar] [CrossRef]
  23. Wang, L.; Wang, J.; Wang, Z.; Feng, J.; Li, S.; Yan, W. Synthesis of Ce-doped magnetic biochar for effective Sb(V) removal: Per-formance and mechanism. Powder Technol. 2019, 345, 501–508. [Google Scholar] [CrossRef]
  24. Long, X.; Wang, X.; Guo, X.; He, M. A review of removal technology for antimony in aqueous solution. J. Environ. Sci. 2020, 90, 192–207. [Google Scholar] [CrossRef]
  25. Jaafari, J.; Yaghmaeian, K. Optimization of heavy metal biosorption onto freshwater algae (Chlorella coloniales) using response surface methodology (RSM). Chemosphere 2018, 217, 447–455. [Google Scholar] [CrossRef] [PubMed]
  26. Farquhar, M.L.; Charnock, J.M.; Livens, F.R.; Vaughan, D.J. Mechanisms of arsenic uptake from aqueous solution by interaction with goethite, lepidocrocite, mackinawite, and pyrite: An X-ray absorption spectroscopy study. Environ. Sci. Technol. 2002, 36, 1757–1762. [Google Scholar] [CrossRef]
  27. Deng, R.-J.; Shao, R.; Ren, B.-Z.; Hou, B.; Tang, Z.-E.; Hursthouse, A. Adsorption of antimony (III) onto Fe (III)-treated humus sludge adsorbent: Behavior and mechanism insights. Pol. J. Environ. Stud. 2018, 28, 577–586. [Google Scholar] [CrossRef]
  28. Zhang, J.; Deng, R.-J.; Ren, B.-Z.; Hou, B.; Hursthouse, A. Preparation of a novel Fe3O4/HCO composite adsorbent and the mechanism for the removal of antimony (III) from aqueous solution. Sci. Rep. 2019, 9, 1–11. [Google Scholar] [CrossRef] [PubMed]
  29. Wu, S.; Sun, F.H.; Yan, Y.B.; Chang, M.; Wu, F. Biosorption of Sb(V) by cyanobacteria in Taihu Lake. Environ. Sci. Res. 2012, 25, 764–769. [Google Scholar]
  30. Li, Z.P.; Yang, J.J.; Sun, C.Q.; Bai, R.B. Research progress on antimony pollution treatment methods in water. Ind. Water Treat. 2018, 38, 12–16. [Google Scholar]
  31. Fan, H.; Sun, W.; Jiang, B.; Wang, Q.; Li, D.; Huang, C.; Wang, K.J.; Zhang, Z.G.; Li, W.X. Adsorption of antimony (III) from aqueous solution by mercap-to-functionalized silica-supported organic–inorganic hybrid sorbent: Mechanism insights. Chem. Eng. J. 2016, 286, 128–138. [Google Scholar] [CrossRef]
  32. Zheng, H.; Wang, Y.; Zheng, Y.; Zhang, H.; Liang, S.; Long, M. Equilibrium, kinetic and thermodynamic studies on the sorption of 4-hydroxyphenol on Cr-bentonite. Chem. Eng. J. 2008, 143, 117–123. [Google Scholar] [CrossRef]
  33. Wang, L. Study on the Adsorption of Heavy Metals in Antimony-Containing Wastewater by Iron-Modified Aerobic Granular Sludge. Ph.D. Thesis, Fudan University, Shanghai, China, 2014. [Google Scholar]
  34. Huang, F. Study on the Adsorption Characteristics and Mechanism of Cadmium in Water by Bacillus Cereus. Ph.D. Thesis, South China University of Technology, Guangzhou, China, 2013. [Google Scholar]
  35. Qiu, G.; Wu, S.G.; Chen, S.J. Dry body of water floating lotus adsorbs and removes antimony in water (III). Chin. J. Environ. Eng. 2012, 6, 2683–2688. [Google Scholar]
  36. Qi, Z.; Joshi, T.P.; Liu, R.; Li, Y.; Liu, H.; Qu, J. Adsorption combined with superconducting high gradient magnetic separation technique used for removal of arsenic and antimony. J. Hazard. Mater. 2018, 343, 36–48. [Google Scholar] [CrossRef] [PubMed]
Figure 1. The 3D surface and contour. (a,b): Sb(III) Temperature, Adsorption time and Adsorption rate, (c,d): Sb(III) Initial concentration, Dosage of FMPAs and Adsorption rate, (e,f): Sb(III) Initial concentration, Temperature and Adsorption rate, (g,h): Sb(III) Temperature, Dosage of FMPAs and adsorption rate.
Processes 09 00933 g001aProcesses 09 00933 g001b
Figure 2. The isotherm plots for the equilibrium adsorption of Sb (III) by FMPAs. [(a): Langmuir isotherms and Freundlich isotherms of Sb(III), (b): D-R isotherms of Sb(III)].
Processes 09 00933 g002
Figure 3. Scanning topography of SEM (a): before modification, (b): FMPAs, (c): FMPAs after adsorption of Sb(III).
Processes 09 00933 g003
Figure 4. The infrared spectrum of FMPAs before modification, and FMPAs after adsorption Sb(III).
Processes 09 00933 g004
Figure 5. The XPS scan spectra of before and after adsorption by FMPAs. ((a) The XPS full scan, (b) XPS spectra of Fe2p, (c) XPS spectra of Sb3d).
Processes 09 00933 g005
Table 1. Influencing factors and levels selected for the Box–Behnken experimental design.
FactorCodeUnitHorizontal Coding Values of Each Factor
−101
Adsorption timeAh123
Dosage of FMPAsBmg/L150025003500
pHC 246
TemperatureD°C253545
Sb(III) initial concentrationEmg/L102030
Table 2. Experimental design of Box–Behnken and the removal efficiency for Sb(III).
Standard OrderTest SequenceInfluencing Factor Coding LevelAdsorption Rate (%)Standard OrderTest SequenceInfluencing Factor Coding LevelAdsorption Rate (%)
ABCDEActualPredictionABCDEActualPrediction
141−1−100060.3659.1524250110094.8098.39
2301−100069.3273.72256001−1053.9260.68
321−1100088.0686.32267−100−1088.6485.05
4431100096.3798.2427151001080.8686.84
5400−1−1076.0678.632812−1001095.3490.96
62001−1072.8773.3329341000−194.1894.15
71600−11086.7489.39303300−10−194.5898.21
8140011094.1494.6431400010180.8181.47
9260−100−187.1484.99323500−10173.0277.36
10360100−193.5594.2433310010−189.7288.46
11370−100147.9950.633439−1000−192.2097.67
12220100189.5895.0735421000171.3266.66
1328−10−10076.0779.543646−1000183.8785.94
143210−10091.8193.333781−10−1045.8750.07
1517−1010079.2879.06385010−1090.9188.76
16441010095.9393.7639130−101073.1177.95
173000−1−187.8187.6240110101094.4592.95
18100001−194.6193.6641190000091.7788.46
191000−1161.1560.8642200000087.6088.46
2090001187.7786.8943240000090.7088.46
21230−1−10076.6971.5844270000086.5788.46
224501−10092.9194.3945290000084.488.46
23180−110070.5367.5246380000084.3388.46
Table 3. AVOVA analyses are for variance of the model.
ParameterSum of Squares Degree of Freedom Mean SquareF-MeasureP-Measure
Model7057.5420352.8820.43<0.0001
A810.681810.6846.93<0.0001
B2746.2812746.28158.99<0.0001
C9.0 × 10−419.0 × 10−45.21 × 10−50.9943
D1052.8411052.8460.95<0.0001
E1195.0811195.0869.19<0.0001
AB0.1110.116.12 × 10−30.9383
AC0.2110.210.0120.9137
AD102.411102.415.930.0224
AE25.35125.351.470.237
BC16.2116.20.940.3421
BD140.421140.428.130.0086
BE309.411309.4117.910.0003
CD28.04128.041.620.2144
CE16.77116.770.970.3339
DE98.21198.215.690.025
A257.81157.813.350.0793
B2316.941316.9418.350.0002
C22.5312.530.150.705
D2216.041216.0412.510.0016
E213.02113.020.750.3936
Residual431.832517.27----
Lossofquasi-value382.842019.141.950.2359
Neterror48.9859.8----
Thetotaldeviation7489.3745------
Table 4. The parameters of the isotherm model for Sb(III) adsorption by FMPAs.
ModelLangmuirFreundlichDubinin-Radushkevich(D-R)
The reference valuesqmax = 30.612 mg/g
KL = 0.3084 L/mg
R2 = 0.993
KF = 9.7658 L/g
n = 3.6626
R2 = 0.866
qmax = 19.016 mg/g
KDR = 1.411 × 10⁻⁷
ε = 1882.49 J/mol
R2 = 0.930
Table 5. Comparison of Sb removal of adsorbent materials.
Name of AdsorbentAntimony Valence StateOptimal pHDosing Amount (g/L)Initial Concentration of Antimony (mg/L)Removal Efficiency (%)Adsorption Capacity (mg/g)References
Fe(III) modified humus sludgeSb(III)24.82593.29.433[30]
cyanobacteriaSb(III)4501081.64.88[29]
microcystis Sb(III)4251082.95.67[16]
FMPAsSb(III)6.03.4327.7497.6060.51This study
Table 6. The parameters for the adsorption kinetics of the Sb(III) sorption by FMPAs.
ModelPseudo-First-OrderPseudo-Second-OrderElovichIntraparticle Diffusion
Sb(III)qe = 5.071 mg/g
k1 = 0.054 min−1
R2 = 0.997
qe = 5.444 mg/g
k2 = 0.016 g/(mg·min)
R2 = 0.990
α = 7.675 mg/min
β = 1.528 g/mg
R2 = 0.930
α1 = 0.232 mg/g
k1 = 0.640 mg/(g·min0.5)
R12 = 0.972
α2 = 4.656 mg/g
k2 = 0.027 mg/(g·min0.5)
R22 = 0.863
Table 7. The elemental composition (w/w%) of FMPAs before modification, and FMPAs after adsorption with Sb(III).
ElementC-KN-KO-KNa-KP-KS-KCl-KK-KFe-KSb-LTotal Element
FMPAs before modification39.4516.2636.761.063.60.231.581.0600100
FMPAs45.429.3230.6801.430.062.29010.800100
FMPAs + Sb(III)46.1810.1532.130. 011.590.142.210.186.900.81100
Publisher’s Note: MDPI stays neutral with regard to jurisdictional claims in published maps and institutional affiliations.

