
Weather Conditions Influence on Hyssop Essential Oil Quality

 , , ,
, , ,  ,
,
Abstract
:1. Introduction
2. Materials and Methods
2.1. Plant Material
2.2. Weather Conditions during Growing Years
2.3. Soil Characteristics
2.4. Isolation Essential Oils and GC-FID GC-MS Analysis
2.5. QSRR Analysis
2.6. Artificial Neural Network (ANN)
2.7. Global Sensitivity Analysis
2.8. Cluster Analysis
2.9. Linear Regression Model
2.10. Correlation Analysis
2.11. Statistical Analyses
3. Results and Discussion
3.1. GC-MS Analysis of the Hyssop Essential Oil
3.2. Climatic Factors and Their Influence on Hyssop Essential Oil Chemical Composition
3.3. Unrooted Cluster Tree Analysis
3.4. Correlation Analysis
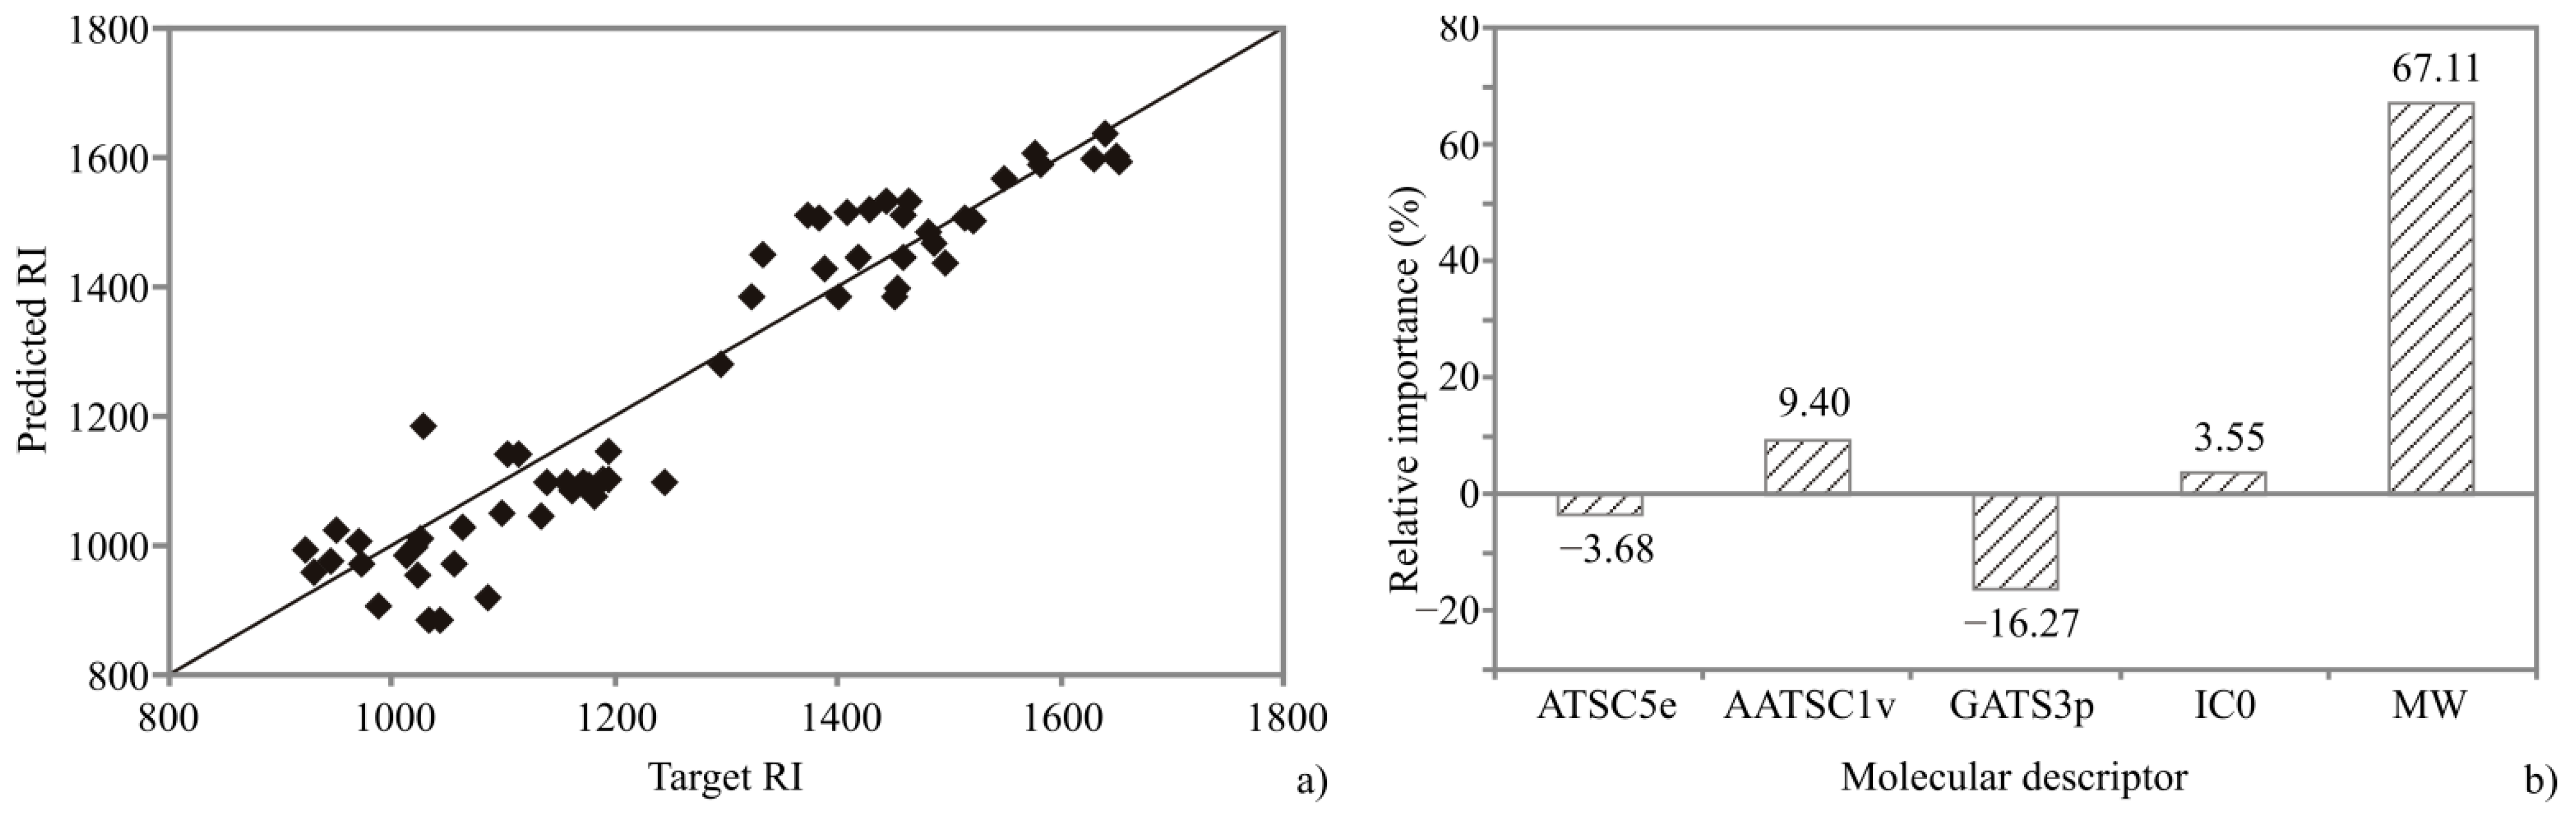
3.5. QSRR Analysis
4. Conclusions
Author Contributions
Funding
Institutional Review Board Statement
Informed Consent Statement
Data Availability Statement
Conflicts of Interest
References
- Zawislak, G. Hyssop herb yield and quality depending on harvest term and plant spacing. Acta Sci. Pol. Hortorum Cultus 2011, 10, 331–342. [Google Scholar]
- Aćimović, M.; Varga, A.; Cvetković, M.; Pezo, L.; Lončar, B.; Ignjatov, M.; Zeremski, T. Chemical composition of hyssop cv. “Domaći ljubičasti” essential oil and its antimicrobial activity. Ratarstvo Povrtarstvo 2021, 58, 23–30. [Google Scholar] [CrossRef]
- Fathiazad, F.; Hamedeyazdan, S. A review on Hyssopus officinalis L.: Composition and biological activities. Afr. J. Pharm. Pharmacol. 2011, 5, 1959–1966. [Google Scholar] [CrossRef]
- Moghtader, M. Comparative evaluation of the essential oil composition from the leaves and flowers of Hyssopus officinalis L. J. Hortic. For. 2014, 6, 1–5. [Google Scholar] [CrossRef] [Green Version]
- Ahmadi, H.; Babalar, M.; Sarcheshmeh, M.A.A.; Morshedloo, M.R.; Shokrpour, M. Effects of exogenous application of citrulline on prolonged water stress damages in hyssop (Hyssopus officinalis L.): Antioxidant activity, biochemical indices, and essential oils profile. Food Chem. 2020, 333, 127433. [Google Scholar] [CrossRef] [PubMed]
- Josifović, M. Flora SR Srbije; Srpska Akademija Nauke i Umetnosti: Beograd, Serbia, 1975; Volume 6. [Google Scholar]
- Venditti, A.; Bianco, A.; Frezza, C.; Conti, F.; Bini, L.M.; Giuliani, C.; Bramucci, M.; Quassinti, L.; Damiano, S.; Lupidi, G.; et al. Essential oil composition, polar compounds, glandular trichomes and biological activity of Hyssopus officinalis subsp. aristatus (Godr.) Nyman from central Italy. Ind. Crops Prod. 2015, 77, 353–363. [Google Scholar] [CrossRef]
- ISO 9841. Oil of Hyssopus officinalis L. ssp. officinalis; International Organisation for Standardization: Geneva, Switzerland, 2007. [Google Scholar]
- Mazzanti, G.; Battinelli, L.; Salvatore, G. Antimicrobial properties of the linalol-rich essential oil of Hyssopus officinalis L. var decumbens (Lamiaceae). Flavour Fragr. J. 1998, 13, 289–294. [Google Scholar] [CrossRef]
- Renzini, G.; Scazzocchio, F.; Lu, M.; Mazzanti, G.; Salvatore, G. Antibacterial and cytotoxic activity of Hyssopus officinalis L. oils. J. Essent. Oil Res. 1999, 11, 649–654. [Google Scholar] [CrossRef]
- Kizil, S.; Hasimi, N.; Tolan, V.; Kilinc, E.; Karatas, H. Chemical composition, antimicrobial and antioxidant activities of hyssop (Hyssopus officinalis L.) essential oil. Not. Bot. Horti Agrobot. Cluj Napoca 2010, 38, 99–103. [Google Scholar]
- Wolfender, J.L.; Martia, G.; Thomas, A.; Bertranda, S. Current approaches and challenges for the metabolite profiling of complex natural extracts. J. Chromatogr. A 2015, 1382, 136–164. [Google Scholar] [CrossRef]
- Marrero-Ponce, Y.; Barigye, S.J.; Jorge-Rodriguez, M.E.; Tran-Thi-Thu, T. QSRR prediction of gas chromatography retention indices of essential oil components. Chem. Pap. 2017, 72, 57–69. [Google Scholar] [CrossRef]
- Wu, L.; Gong, P.; Wu, Y.; Liao, K.; Shen, H.; Qi, Q.; Liu, H.; Wang, G.; Hao, H. An integral strategy toward the rapid identification of analogous nontarget compounds from complex mixtures. J. Chromatogr. A 2013, 1303, 39–47. [Google Scholar] [CrossRef] [PubMed]
- Héberger, K. Quantitative structure–(chromatographic) retention relationships. J. Chromatogr. A 2007, 1158, 273–305. [Google Scholar] [CrossRef] [PubMed] [Green Version]
- Kaliszan, R. QSRR: Quantitative Structure—(Chromatographic) Retention Relationships. Chem. Rev. 2007, 107, 3212–3246. [Google Scholar] [CrossRef] [PubMed]
- Khezeli, T.; Daneshfar, A.; Sahraei, R. A green ultrasonic-assisted liquid–liquid microextraction based on deep eutectic solvent for the HPLC-UV determination of ferulic, caffeic and cinnamic acid from olive, almond, sesame and cinnamon oil. Talanta 2016, 150, 577–585. [Google Scholar] [CrossRef]
- Tropsha, A.; Golbraikh, A. Predictive QSAR Modeling Workflow, Model Applicability Domains, and Virtual Screening. Curr. Pharm. Des. 2001, 3, 3494–3504. [Google Scholar] [CrossRef] [PubMed]
- Zisi, C.; Sampsonidis, I.; Fasoula, S.; Papachristos, K.; Witting, M.; Gika, H.G.; Nikitas, P.; Pappa-Louisi, A. QSRR modeling for metabolite standards analyzed by two different chromatographic columns using multiple linear regression. Metabolites 2017, 7, 7. [Google Scholar] [CrossRef] [Green Version]
- ISO 10390:1994. Soil Quality—Determination of pH; International Organization for Standardization: Geneva, Switzerland, 1994. [Google Scholar]
- ISO 10693:1995. Soil Quality—Determination of Carbonate Content—Volumetric Method; International Organization for Standardization: Geneva, Switzerland, 1995. [Google Scholar]
- Berner, D.L.; Brown, J. Protein Nitrogen Combustion Method Collaborative Study I. Comparison with Smalley Total Kjeldahl Nitrogen and Combustion Results. J. Am. Oil Chem. Soc. 1994, 71, 1291–1293. [Google Scholar] [CrossRef]
- Egner, H.; Riehm, H.; Domingo, W.R. Untersuchungenüber die chemische Boden analyse als Grundlage für die Beurteilung des Nahrstoff zustandes der Boden, II: Chemische Extractions metoden zu Phosphorund Kaliumbestimmung. K. Lantbr. Annaler. 1960, 26, 199–215. [Google Scholar]
- Stanković, J.; Novaković, M.; Tešević, V.; Ćirić, A.; Soković, M.; Zdunić, G.; Dajić-Stevanović, Z.; Gođevac, D. HPTLC Bioautography-guided isolation of isogeranic acid as the main antibacterial constituent of Artemisia santonicum essential oil. J. Serb.Chem. Soc. 2019, 84, 1355–1365. [Google Scholar] [CrossRef]
- Dong, J.; Cao, D.S.; Miao, H.Y.; Liu, S.; Deng, B.C.; Yun, Y.H.; Wang, N.N.; Lu, A.P.; Zeng, W.B.; Chen, A.F. ChemDes: An integrated web-based platform for molecular descriptor and fingerprint computation. J. Cheminform. 2015. [Google Scholar] [CrossRef] [PubMed] [Green Version]
- Yap, C.W. PaDEL-descriptor: An open source software to calculate molecular descriptors and fingerprints. J. Comput. Chem. 2011, 32, 1446–1474. [Google Scholar] [CrossRef]
- Goldberg, D.E. Genetic Algorithms in Search, Optimisation and Machine Learning; Addison-Wesley: Boston, MA, USA, 1989. [Google Scholar]
- Tropsha, A. Best practices for QSAR model development, validation, and exploitation. Mol. Inform. 2010, 29, 476–488. [Google Scholar] [CrossRef] [PubMed]
- Aalizadeh, R.; Thomaidis, N.S.; Bletsou, A.A.; Gago-Ferrero, P. Quantitative structure–Retention relationship models to support nontarget high-resolution mass spectrometric screening of emerging contaminants in environmental samples. J. Chem. Inf. Model. 2016, 56, 1384–1398. [Google Scholar] [CrossRef] [PubMed]
- Xu, Q.; Wei, C.; Liu, R.; Gu, S.; Xu, J. Quantitative structure–Property relationship study of β-cyclodextrin complexation free energies of organic compounds. Chemom. Intell. Lab. Syst. 2015, 146, 313–321. [Google Scholar] [CrossRef]
- Kojic, P.; Omorjan, R. Predicting hydrodynamic parameters and volumetric gas–liquid mass transfer coefficient in an external-loop airlift reactor by support vector regression. Chem. Eng. Res. Des. 2018, 125, 398–407. [Google Scholar] [CrossRef]
- Statistica 10 Software (StatSoft, Inc. STATISTICA, ver. 10, Data Analysis Software System). Available online: https://www.statsoft.de/en/home (accessed on 15 December 2018).
- Yoon, Y.; Swales, G.; Margavio, T.M. A comparison of discriminant analysis versus Artificial Neural Networks. J. Oper Res. Soc. 2017, 44, 51–60. [Google Scholar] [CrossRef]
- Acimovic, M.; Todosijević, M.; Varga, A.; Kiprovski, B.; Teševic, V.; Cabarkapa, I.; Sikora, V. Bioactivity of essential oils from cultivated winter savory, sage and hyssop. LekoviteSirovine 2019, 3, 11–17. [Google Scholar] [CrossRef] [Green Version]
- Acimovic, M.; Stankovic, J.; Cvetkovic, M.; Kiprovski, B.; Marjanovic-Jeromela, A.; Rat, M.; Malencic, D. Essential oil analysis of different hyssop genotypes from IFVCNS medicinal plant collection garden. LetopisNaučnihRadova 2019, 43, 38–45. [Google Scholar]
- Salvatore, G.; D’Andrea, A.; Nicoletti, M. A pinocamphone poor oil of Hyssopus officinalis L. var. decumbens from France (Banon). J. Essent. Oil. Res. 1998, 10, 563–567. [Google Scholar] [CrossRef]
- Mutu, A.; Clapco, S.; Martea, R.; Port, A.; Gille, E.; Duca, M. Intraspecific genetic variability of Hyssopus officinalis L. J. Exp. Mol. Biol. 2014, 15, 1–8. [Google Scholar]
- Saeedi, M.; Morteza-Semnani, K. Chemical composition and antimicrobial activity of essential oil of Hyssopus angustifolius M.B. J. Essent. Oil Bear. Plants 2009, 12, 111–119. [Google Scholar] [CrossRef]
- Riabova, P.A.; Micic, D.; Bozovic, R.B.; Jovanovic, D.V.; Tomic, A.; Sovljanski, O.; Filip, S.; Tosti, T.; Ostojic, S.; Blagojevic, S.; et al. The chemical, biological and thermal characteristics and gastronomical perspectives of Laurus nobilis essential oil from different geographical origin. Ind. Crops Prod. 2020, 151, 112498. [Google Scholar] [CrossRef]
- Nemeth-Zambori, E.; Rajhart, P.; Inotai, K. Effect of genotype and age on essential oil and total phenolics in hyssop (Hyssopus officinalis L.). J. Appl. Bot. Food Qual. 2017, 90, 25–30. [Google Scholar]
- Kerrola, K.; Galambosi, B.; Kallio, H. Volatile components and odor intensity of four phenotypes of hyssop (Hyssopus officinalis L.). J. Agric. Food Chem. 1994, 42, 776–781. [Google Scholar] [CrossRef]
- Kotyuk, L.A. Hyssop composition depending on age and plants development phases. Biotechnol. Acta 2015, 8, 55–63. [Google Scholar] [CrossRef]
- Zawislak, G. Morphological characters of Hyssopus officinalis L. and chemical composition of its essential oil. Mod. Phytomorphol. 2013, 4, 93–95. [Google Scholar]
- Karp, F.; Croteau, R. Hydroxylation of (-)-β-pinene and (-)-α-pinene by a cytochrome P-450 system from hyssop (Hyssopus officinalis). In Secondary-Metabolite Biosynthesis and Metabolism; Petrovski, R.J., McCormick, S.P., Eds.; Plenum Press: New York, NY, USA, 1992. [Google Scholar]
- Galambosi, B.; Svoboda, K.; Deans, S.; Hethelyi, E. Agronomical and phytochemical investigation of Hyssopus officinalis. Agric. Food Sci. 1993, 2, 293–302. [Google Scholar] [CrossRef]
- Tavakoli, M.; Aghajani, Z. The effects of draught stress on the components of the essential oil of Hyssopus officinalis L. and determining the antioxidative properties of its water extracts. J. Appl. Environ. Biol. Sci. 2016, 6, 31–36. [Google Scholar]
- Moro, A.; Zalacain, A.; de Mendoza, J.H.; Carmona, M. Effects of agronomic practices on volatile composition of Hyssopus officinalis L. essential oils. Molecules 2011, 16, 4131–4139. [Google Scholar] [CrossRef] [Green Version]
- Hamida, N.B.; Martinez-Diaz, R.A.; Hela, M.; Msaada, K.; Ouerghi, Z.; Andres, M.F.; Gonzalez-Coloma, A. Effect of salinity on the antiparasitic activity of hyssop essential oil. J. Essent. Oil Res. 2020, 32, 69–78. [Google Scholar] [CrossRef]
- Ogunwande, I.A.; Flamini, G.; Alese, O.O.; Cioni, P.L.; Ogundajo, A.L.; Setzer, W. A new chemical form of essential oil of Hyssopus officinalis L. (Lamiaceae) from Nigeria. Int. J. Biol Chem Sci. 2011, 5, 46–55. [Google Scholar] [CrossRef] [Green Version]
- Glamočlija, J.M.; Soković, M.D.; Vukojević, J.B.; Milenković, I.M.; Brkić, D.D.; van Griensven, L.J.L.D. Antifungal activity of essential oil Hyssopus officinalis L. against mycopathogen Mycogone perniciosa (Mang). Proc. Nat. Sci. Matica Srpska Novi. Sad. 2005, 109, 123–128. [Google Scholar] [CrossRef]
- Hristova, Y.; Wanner, J.; Jirovetz, L.; Stappen, I.; Iliev, I.; Gochev, V. Chemical composition and antifungal activity of essential oil of Hyssopus officinalis L. from Bulgaria against clinical isolates of Candida species. Biotechnol. Biotechnol. Equip. 2015, 29, 592–601. [Google Scholar] [CrossRef] [Green Version]
- Baj, T.; Korona-Glowniak, I.; Kowalski, R.; Malm, A. Chemical composition and microbiological evaluation of essential oil from Hyssopus officinalis L. with white and pink flowers. Open Chem. 2018, 16, 317–323. [Google Scholar] [CrossRef] [Green Version]
- Dzamic, A.; Soković, M.; Novakovic, M.; Jadranin, M.; Ristic, M.; Tesevic, V.; Marin, P. Composition, antifungal and antioxidant properties of Hyssopus officinalis L. subsp. pilifer (Pant.) Murb. Essential oil and deodorized extracts. Ind. Crops Prod. 2013, 51, 401–407. [Google Scholar] [CrossRef]
- Gonceariuc, M.; Balmus, Z. Diversity of the essential oil content and chemical composition of Hyssopus officinalis L. genotype. Muzel Olteniei Craiova 2013, 29, 71–77. [Google Scholar]
- Dehghanzadeh, N.; Ketabchi, S.; Alizsdeh, A. Essential oil composition and antibacterial activity of Hyssopus officinalis L. grown in Iran. Asian J. Exp. Boil. Sci. 2012, 3, 767–771. [Google Scholar]
- Mitic, V.; Dordevic, S. Essential oil composition of Hyssopus officinalis L. cultivated in Serbia. Facta Univ. 2000, 2, 105–108. [Google Scholar]
- Said-Al Ahl, H.A.H.; Abbas, Z.K.; Sabra, A.S.; Tkachenko, K.G. Essential oil composition of Hyssopus officinalis L. cultivated in Egypt. Int. J. Plant. Sci. Ecol. 2015, 1, 49–53. [Google Scholar]
- Zagorcheva, T.; Rusanov, K.; Rusanova, M.; Aneva, I.; Stancheva, I.; Atanassov, I. Genetic and flower volatile diversity in two natural populations of Hyssopus officinalis L. in Bulgaria. Biotechnol. Biotechnol. Equip. 2020, 34, 1265–1272. [Google Scholar] [CrossRef]
- Li, H.T.; Zhao, N.N.; Yang, K.; Liu, Z.L.; Wang, Q. Chemical composition and toxicities of the essential oil derived from Hyssopus cuspidatus flowering aerial parts against Sitophilus zeamais and Heteroderaavenae. J. Med. Plants Res. 2013, 7, 343–348. [Google Scholar]
- Sharopov, F.S.; Kukaniev, M.A.; Thompson, R.M.; Satyal, P.; Setzer, W.N. Composition and antimicrobial activity of the essential oil of Hyssopus seravschanicus growing wild in Tajikistan. Der Pharma Chem. 2012, 4, 961–966. [Google Scholar]
- Fathiazad, F.; Mazandarani, M.; Hamedeyazdan, S. Phytochemical analysis and antioxidant activity of Hyssopus officinalis L. from Iran. Adv. Pharm. Bull. 2011, 1, 63–67. [Google Scholar]
- Kurkcuoglu, M.; Eser, S.A.; Baser, K.H.C. Composition of the essential oil of the Hyssopus officinalis L. susp. angustifolius (Bieb.) Arcangeli. Nat. Volatiles Essent. Oils 2016, 3, 15–19. [Google Scholar]
- Bernotienė, G.; Butkienė, R. Essential oils of Hyssopus officinalis L. cultivated in East Lithuania. Chemija 2010, 21, 135–138. [Google Scholar]
- Schulz, G.; Stahl-Biskup, E. Essential oil and glycosidic bound volatiles from leaves, stems, flowers and roots of Hyssopus officinalis L. (Lamiaceae). Flav. Fragr. J. 1991, 6, 69–73. [Google Scholar] [CrossRef]
- Chalchat, J.C.; Adamovic, D.; Gorunovic, M.S. Composition of oils of three cultivated forms of Hyssopus officinalis endemic in Yugoslavia: F. albus Alef., f. cyaneus Alef. and f. ruber Mill. J. Essent. Oil Res. 2001, 13, 419–421. [Google Scholar] [CrossRef]
- Garg, S.N.; Naqvi, A.A.; Singh, A.; Ram, G.; Kumar, S. Composition of essential oil from an annual crop of Hyssopus officinalis grown in Indian plains. Flav. Fragr. J. 1999, 14, 170–172. [Google Scholar] [CrossRef]
- Ozer, H.; Sahin, F.; Kilic, H.; Gulluce, M. Essential oil composition of Hyssopus officinalis L. subsp. angustifolius (Bieb.) Arcangeli from Turkey. Flav. Frag. J. 2005, 20, 42–44. [Google Scholar]
- Mohan, M.; Seth, R.; Singh, P.; Lohani, H.; Gupta, S. Composition of the volatiles of Hyssopus officinalis (L.) and Thymus serpyllum (L.) from Uttarakhand Himalaya. Natl. Acad. Sci. Lett. 2012. [Google Scholar] [CrossRef]
- Fraternale, D.; Ricci, D.; Epifano, F.; Curini, M. Composition and antifungal activity of two essential oils of Hyssop (Hyssopus officinalis L.). J. Essent. Oil Res. 2004, 16, 617–622. [Google Scholar] [CrossRef]
- Piccaglia, R.; Pace, L.; Tammaro, F. Characterization of essential oils from three Italian ecotypes of hyssop [Hyssopus officinalis L. subsp. aristatus (Godron) Briq]. J. Essent. Oil Bear. Plants 1999, 11, 693–699. [Google Scholar] [CrossRef]
- Kizil, S.; Toncer, O.; Ipek, A.; Arslan, N.; Saglam, S.; Khawar, K.M. Blooming stages of Turkish hyssop (Hyssopus officinalis L.) affect essential oil composition. Acta Agric. Scand. B Soil Plant Sci. 2008, 58, 273–279. [Google Scholar]
- Gorunovic, M.S.; Bogavac, P.M.; Chalchat, J.C.; Chabard, J.L. Essential oil of Hyssopus officinalis L., Lamiaceae of Montenegro origin. J. Essent. Oil Res. 1995, 7, 39–43. [Google Scholar] [CrossRef]
- Hatipoglu, G.; Sokmen, M.; Bektas, E.; Daferera, D.; Sokmen, A.; Demir, E.; Sahin, H. Automated and standard extraction of antioxidant phenolic compounds of Hyssopus officinalis L. ssp. angustifolius. Ind. Crops Prod. 2013, 43, 427–433. [Google Scholar] [CrossRef]
- Jahantigh, O.; Najafi, F.; Badi, H.N.; Khavari-Najed, A.; Sanjarian, F. Essential oil composition of hyssop (Hyssopus officinalis L.) under salt stress at flowering stage. J. Essent. Oil Res. 2016, 28, 458–464. [Google Scholar] [CrossRef]
- Genova, E.; Petrova, S.; Dobos, A.; Mathe, I. Content and composition of essential oil of the Bulgarian populations of Hyssopus officinalis ssp. aristatus (Godr.) Briq. Med. Plant. Rep. Novi Sad 2000, 7, 10–15. [Google Scholar]
- Pirbalouti, A.G.; Bajalan, I.; Malekpoor, F. Chemical composition and antioxidant activity of essential oils from inflorescens of two landraces of hyssop [Hyssopus officinalis L. subsp. angustifolius (Bieb.)] cultivated in Southwestern, Iran. J. Essent. Oil Bear Plants 2019, 22, 1074–1081. [Google Scholar] [CrossRef]
- Stappen, I.; Wanner, J.; Tabanaca, N.; Wedge, D.; Ali, A.; Kaul, V.; Lal, B.; Gochev, V.; Schmidt, E.; Jirovetz, L. Chemical composition and biological activity of essential oils of Dracocephalum heterophyllum and Hyssopus officinalis from Western Himalaya. Nat. Prod. Commun. 2015, 10, 133–138. [Google Scholar] [CrossRef] [Green Version]
- Mahboubi, M.; Haghi, G.; Kazempour, N. Antimicrobial activity and chemical composition of Hyssopus officinalis L. essential oil. J. Biol. Act. Prod. Nat. 2011, 1, 132–137. [Google Scholar]
- Zawislak, G. Essential oil composition of Hyssopus officinalis L. grown in Poland. J. Essent. Oil Bear Plants 2016, 19, 699–705. [Google Scholar] [CrossRef]
- Mohammadhosseini, M. Novel PSO-MLR Algorithm to Predict the Chromatographic Retention Behaviors of Natural Compounds. Anal. Chem. Lett. 2013, 3, 226–248. [Google Scholar] [CrossRef]
- Nekoei, M.; Mohammadhosseini, M.; Pourbasheer, E. QSAR study of VEGFR-2 inhibitors by using genetic algorithm-multiple linear regressions (GA-MLR) and genetic algorithm-support vector machine (GA-SVM): A comparative approach. Med. Chem. Res. 2015, 24, 3037–3046. [Google Scholar] [CrossRef]
- Todeschini, R.; Consonni, V. Handbook of Molecular Descriptors, Methods and Principles in Medicinal Chemistry; Wiley-VCH Verlag GmbH: Weinheim, Germany, 2000. [Google Scholar]
- Arsenović, M.; Pezo, L.; Stanković, S.; Radojević, Z. Factor space differentiation of brick clays according to mineral content: Prediction of final brick product quality. Appl. Clay Sci. 2015, 115, 108–114. [Google Scholar] [CrossRef]


| pH | CaCO3 (%) | Humus (%) | Total Nitrogen (%) | AL-P2O5 (mg/100 g) | AL-K2O (mg/100 g) | |
|---|---|---|---|---|---|---|
| In 1M KCl | In H2O | |||||
| 7.33 | 7.77 | 4.92 | 2.57 | 0.13 | 75.0 | 37.74 |
| No | Compound | RIpred | RI | Compound Content (%) | Regression Coefficients | ||||
|---|---|---|---|---|---|---|---|---|---|
| 1st Year [34] | 2nd Year [35] | 3rd Year [2] | Average ± SD | Temp. Coeff. | Prec. Coeff. | ||||
| 1 | α-Thujene (MT) | 992.07 | 925 | 0.3 | 0.1 | 0.1 | 0.2 ± 0.1 | 0.198 | −0.022 |
| 2 | α-Pinene (MT) | 956.96 | 932 | 0.7 | 0.3 | 0.3 | 0.4 ± 0.2 | 0.394 | −0.044 |
| 3 | Camphene (MT) | 976.15 | 947 | 0.1 | 0.1 | 0.1 | 0.1 ± 0.0 | 0.000 | 0.000 |
| 4 | Thuja−2,4(10)-diene (MT) | 1022.53 | 952 | tr | - | - | tr | 0.000 | 0.000 |
| 5 | Sabinene (MT) | 1006.67 | 972 | 1.7 | 1.1 | 0.9 | 1.2 ± 0.4 | 1.724 | −0.130 |
| 6 | β-Pinene (MT) | 971.80 | 975 | 12.0 | 6.6 | 6.3 | 8.3 ± 3.2 | 7.006 | −0.693 |
| 7 | Myrcene (MT) | 904.58 | 990 | 1.5 | 1.6 | 1.0 | 1.4 ± 0.3 | 3.312 | −0.179 |
| 8 | NI | 992 | - | - | 0.1 | tr | |||
| 9 | α-Terpinene (MT) | 982.03 | 1016 | 0.1 | 0.2 | 0.1 | 0.1 ± 0.1 | 0.469 | −0.021 |
| 10 | p-Cymene (MT) | 995.14 | 1023 | 0.1 | 0.1 | 0.2 | 0.1 ± 0.1 | −0.570 | 0.032 |
| 11 | Limonene (MT) | 953.43 | 1026 | - | - | 3.5 | 1.2 ± 2.0 | −19.944 | 1.114 |
| 12 | β-Phellandrene (MT) | 1009.23 | 1028 | 4.1 | 5.9 | 0.3 | 3.4 ± 2.9 | 30.050 | −1.578 |
| 13 | 1,8-Cineole (OMT) | 1183.38 | 1030 | 0.3 | - | - | 0.1 ± 0.2 | 0.296 | −0.033 |
| 14 | cis-β-Ocimene (MT) | 882.25 | 1036 | tr | 0.2 | 0.1 | 0.1 ± 0.1 | 0.370 | −0.010 |
| 15 | trans-β-Ocimene (MT) | 882.25 | 1046 | 0.1 | 0.6 | 0.5 | 0.4 ± 0.3 | 0.074 | 0.024 |
| 16 | γ-Terpinene (MT) | 971.35 | 1057 | 0.2 | 0.4 | 0.3 | 0.3 ± 0.1 | 0.371 | −0.010 |
| 17 | cis-Sabinene hydrate (MT) | 1025.19 | 1066 | 0.1 | 0.4 | 0.4 | 0.3 ± 0.2 | −0.298 | 0.033 |
| 18 | Terpinolene (MT) | 918.64 | 1088 | - | 0.1 | 0.1 | 0.1 ± 0.1 | −0.099 | 0.011 |
| 19 | Linalool (OMT) | 1047.20 | 1100 | 0.4 | 0.5 | 0.6 | 0.5 ± 0.1 | −0.669 | 0.043 |
| 20 | cis-Thujone (OMT) | 1138.15 | 1106 | 0.1 | 0.2 | 0.2 | 0.2 ± 0.1 | −0.096 | 0.011 |
| 21 | trans-Thujone (OMT) | 1138.15 | 1116 | 0.1 | 0.2 | 0.1 | 0.1 ± 0.1 | 0.469 | −0.021 |
| 22 | NI | 1121 | - | 0.1 | 0.1 | 0.1 ± 0.1 | |||
| 23 | Nopinone (O) | 1044.29 | 1136 | 0.1 | Tr | 0.1 | 0.1 ± 0.0 | −0.470 | 0.021 |
| 24 | trans-Pinocarveol (OMT) | 1094.78 | 1140 | 0.1 | 0.3 | 0.5 | 0.3 ± 0.2 | −1.340 | 0.086 |
| 25 | NI | 1157 | 1.8 | 1.0 | 1.1 | 1.3 ± 0.44 | |||
| 26 | Pinocamphone (OMT) | 1095.79 | 1158 | 20.5 | 22.3 | 18.3 | 20.4 ± 2.0 | 20.860 | −1.065 |
| 27 | Pinocarvone (OMT) | 1083.90 | 1162 | 2.8 | 0.7 | 6.1 | 3.2 ± 2.7 | −28.715 | 1.486 |
| 28 | Borneol (OMT) | 1082.91 | 1164 | - | Tr | - | tr | 0.000 | 0.000 |
| 29 | Isopinocamphone (OMT) | 1095.79 | 1174 | 41.1 | 38.8 | 43.8 | 41.2 ± 2.5 | −26.218 | 1.336 |
| 30 | Terpinen-4-ol (OMT) | 1091.37 | 1179 | 0.7 | 0.9 | - | 0.5 ± 0.5 | 4.899 | −0.263 |
| 31 | Cryptone (O) | 1075.55 | 1184 | - | Tr | - | tr | 0.000 | 0.000 |
| 32 | NI | 1185 | - | - | 0.1 | tr | |||
| 33 | α-Terpineol (OMT) | 1100.45 | 1190 | 0.2 | 0.2 | 0.2 | 0.2 ± 0.0 | 0.000 | 0.000 |
| 34 | Myrtenol (OMT) | 1099.28 | 1195 | 1.1 | 2.0 | 2.0 | 1.7 ± 0.5 | −0.894 | 0.100 |
| 35 | Methyl chavicol (PP) | 1146.03 | 1197 | - | - | 0.3 | 0.1 ± 0.2 | −1.712 | 0.096 |
| 36 | trans-2-hydroxy-Pinocamphone (OMT) | 1095.79 | 1246 | 0.1 | - | 0.1 | 0.1 ± 0.1 | −0.470 | 0.021 |
| 37 | Methyl myrtenate (OMT) | 1280.48 | 1296 | 0.1 | 0.1 | 0.2 | 0.1 ± 0.1 | −0.570 | 0.032 |
| 38 | Myrtenyl acetate (OMT) | 1385.53 | 1325 | 0.1 | - | 0.2 | 0.1 ± 0.1 | −1.041 | 0.053 |
| 39 | α-Copaene (ST) | 1510.08 | 1375 | tr | Tr | - | tr | 0.000 | 0.000 |
| 40 | δ-elemene (ST) | 1450.99 | 1334 | - | 0.1 | 0.6 | 0.2 ± 0.3 | −2.954 | 0.171 |
| 41 | β-Bourbonene (ST) | 1503.87 | 1384 | 0.6 | 0.9 | 0.5 | 0.7 ± 0.2 | 1.970 | −0.093 |
| 42 | β-Elemene (ST) | 1428.91 | 1389 | - | tr | 0.1 | tr | −0.570 | 0.032 |
| 43 | Methyl eugenol (PP) | 1385.60 | 1405 | - | 0.1 | 0.2 | 0.1 ± 0.1 | −0.670 | 0.043 |
| 44 | α-Gurjunene (ST) | 1513.34 | 1409 | 0.2 | 0.4 | 0.2 | 0.3 ± 0.1 | 0.936 | −0.041 |
| 45 | β-Caryophyllene (ST) | 1444.73 | 1419 | 1.5 | 1.4 | 1.1 | 1.3 ± 0.2 | 1.797 | −0.106 |
| 46 | β-Copaene (ST) | 1516.98 | 1429 | tr | 0.1 | 0.1 | 0.1 ± 0.0 | −0.099 | 0.011 |
| 47 | 6,9-Guaiadiene (ST) | 1532.04 | 1444 | tr | 0.1 | 0.1 | 0.1 ± 0.0 | −0.099 | 0.011 |
| 48 | α-Humulene (ST) | 1384.87 | 1453 | 0.2 | 0.2 | 0.2 | 0.2 ± 0.0 | 0.000 | 0.000 |
| 49 | trans-β-Farnesene (ST) | 1397.11 | 1456 | - | - | 0.1 | tr | −0.570 | 0.032 |
| 50 | allo-Aromadendrene (ST) | 1509.53 | 1459 | - | 1.4 | - | 0.5 ± 0.8 | 6.550 | −0.288 |
| 51 | 9-epi-β-Caryophyllene (ST) | 1444.73 | 1461 | 0.7 | - | 0.7 | 0.5 ± 0.4 | −3.299 | 0.145 |
| 52 | cis-Muurola-4(14),5-diene (ST) | 1531.12 | 1466 | tr | - | - | tr | 0.000 | 0.000 |
| 53 | Germacrene (DST) | 1483.09 | 1482 | 1.7 | 3.0 | 2.0 | 2.2 ± 0.6 | 4.381 | −0.172 |
| 54 | β-Selinene (ST) | 1468.06 | 1487 | - | 0.1 | - | tr | 0.469 | −0.021 |
| 55 | NI | 1489 | tr | - | 0.1 | tr | |||
| 56 | Bicyclogermacrene (ST) | 1434.42 | 1497 | 1.3 | 2.5 | 0.9 | 1.6 ± 0.8 | 7.877 | −0.373 |
| 57 | γ-Cadinene (ST) | 1506.17 | 1515 | tr | 0.1 | - | tr | 0.469 | −0.021 |
| 58 | NI | 1521 | - | - | 0.1 | tr | |||
| 59 | δ-Cadinene (ST) | 1500.65 | 1523 | 0.2 | 0.1 | 0.1 | 0.1 ± 0.1 | 0.099 | −0.011 |
| 60 | Elemol (OST) | 1566.08 | 1550 | 1.0 | 1.7 | 2.5 | 1.7 ± 0.8 | −5.262 | 0.333 |
| 61 | Spathulenol (OST) | 1603.77 | 1577 | 0.4 | 0.6 | 0.7 | 0.6 ± 0.2 | −0.769 | 0.054 |
| 62 | Caryophyllene oxide (OST) | 1587.07 | 1583 | 0.2 | 0.4 | 0.5 | 0.4 ± 0.2 | −0.769 | 0.054 |
| 63 | NI | 1600 | - | 0.2 | 0.2 | 0.1 ± 0.1 | |||
| 64 | Veridiflorol (OST) | 1600.87 | 1601 | 0.1 | - | - | tr | 0.099 | −0.011 |
| 65 | 10-epi-γ-Eudesmol (OST) | 1620.23 | 1619 | tr | - | - | tr | 0.000 | 0.000 |
| 66 | γ-Eudesmol (OST) | 1598.78 | 1632 | 0.2 | 0.3 | 0.1 | 0.2 ± 0.1 | 1.034 | −0.052 |
| 67 | NI | 1636 | - | 0.1 | 0.1 | 0.1 ± 0.1 | |||
| 68 | epi-α-Cadinol ( = τ-cadinol) (OST) | 1635.68 | 1641 | 0.1 | 0.1 | - | 0.1 ± 0.1 | 0.567 | −0.032 |
| 69 | NI | 1639 | - | - | 0.1 | tr | |||
| 70 | β-Eudesmol (OST) | 1599.400 | 1650 | 0.2 | 0.2 | 0.1 | 0.2 ± 0.1 | 0.567 | −0.032 |
| 71 | α-Eudesmol (OST) | 1592.25 | 1654 | 0.2 | 0.3 | 0.2 | 0.2 ± 0.1 | 0.469 | −0.021 |
| 72 | NI | 1662 | tr | 0.1 | - | tr | |||
| 73 | NI | 1669 | tr | 0.1 | - | tr | |||
| 74 | NI | 1845 | - | - | 0.1 | tr | |||
| MT: Monoterpene hydrocarbons | 21.0 | 17.7 | 14.2 | ||||||
| OMT: Oxygenated monoterpenes | 67.7 | 66.2 | 72.3 | ||||||
| ST: Sesquiterpene hydrocarbons | 6.4 | 10.4 | 6.7 | ||||||
| OST: Oxygenated sesquiterpenes | 2.4 | 3.6 | 4.1 | ||||||
| PP: Phenylpropanoids | - | 0.1 | 0.5 | ||||||
| O: Other | 0.1 | - | 0.1 | ||||||
| NI: Not Identified | 1.8 | 1.6 | 2.1 | ||||||
| Total identified | 99.4 | 99.6 | 100.0 | ||||||
| Component | This Study | ISO 9841 Standard | |||
|---|---|---|---|---|---|
| 1st Year [34] | 2nd Year [35] | 3rd Year [2] | Min | Max | |
| α-Pinene | 0.7 | 0.3 | 0.3 | 0.4 | 1.5 |
| β-Pinene | 12.0 | 6.6 | 6.3 | 7.0 | 20.0 |
| Sabinene | 1.7 | 1.1 | 0.9 | 1.0 | 3.5 |
| Limonene | 0.0 | 0.0 | 3.5 | 0.6 | 4.0 |
| Myrtenyl methyl ether | 0.0 | 0.0 | 0.0 | 0.9 | 3.0 |
| Pinocamphone * | 20.5 | 22.3 | 18.3 | 8.0 | 25.0 |
| Isopinocamphone * | 41.1 | 38.8 | 43.8 | 25.0 | 45.0 |
| β-Bourbonene | 0.6 | 0.9 | 0.5 | 0.8 | 2.6 |
| β-Caryophyllene * | 1.5 | 1.4 | 1.1 | 1.0 | 3.0 |
| allo-aromadendrene | 0.0 | 1.4 | 0.0 | 1.0 | 3.0 |
| Germacrene D * | 1.7 | 3.0 | 2.0 | 1.2 | 4.5 |
| Elemol * | 1.0 | 1.7 | 2.5 | 0.2 | 2.5 |
| Spathulenol * | 0.4 | 0.6 | 0.7 | 0.1 | 1.5 |
| No | References | 1,8-Cineole (Eucalyptol) | Bicyclogermacrene | Camphor | Cis-Pinocamphone (isopinocamphone) | Cis-β-Ocimene | Elemol | Germacrene D | Hedycaryol | Limonene | Linalool | Menthyl Acetate | Methyl Eugenol | Myrcene | Myrtenol | Myrtenyl methyl ether | Pinocarvone | sabinene | Spathulenol | Thymol | Trans-Pinocamphone | α-Pinene | β-Bourbonene | β-Caryophyllene | β-Phellandrene | β-Pinene | Total |
|---|---|---|---|---|---|---|---|---|---|---|---|---|---|---|---|---|---|---|---|---|---|---|---|---|---|---|---|
| 1 | [49] | 0.2 | 0.1 | 0.0 | tr | tr | 0.0 | tr | 0.0 | 2.7 | 0.2 | 0.0 | 0.0 | 0.3 | 0.0 | 0.0 | 0.2 | 0.0 | 0.5 | 0.0 | tr | 70.9 | 0.0 | 2.7 | 0.0 | 10.9 | 88.7 |
| 2 | [50] | 0.5 | 0.0 | 0.0 | 43.3 | 0.0 | 0.0 | 0.9 | 0.0 | 1.6 | 0.0 | 0.0 | 0.0 | 0.5 | 0.0 | 0.0 | 0.0 | 0.0 | 0.0 | 0.0 | 16.8 | 1.0 | 1.2 | 1.0 | 0.0 | 16.3 | 83.1 |
| 3 | [51] | 0.2 | 1.8 | 0.0 | 49.9 | 0.1 | 0.0 | 1.9 | 0.0 | 1.5 | 0.5 | 0.2 | 0.1 | 1.9 | 1.5 | 1.6 | 0.2 | 1.6 | 0.4 | 0.0 | 5.9 | 0.9 | 1.3 | 1.0 | 4.8 | 13.5 | 90.8 |
| 4 | [52] | 7.6 | 2.0 | 0.0 | 1.9 | 0.0 | 0.0 | 0.0 | 0.0 | 1.4 | 0.1 | 0.0 | 0.0 | 3.9 | 0.6 | 0.0 | 0.0 | 3.0 | 0.3 | 0.0 | 51.0 | 1.0 | 0.2 | 1.0 | 0.0 | 12.4 | 86.4 |
| 5 | [52] | 1.9 | 3.3 | 0.0 | 21.9 | 0.0 | 5.4 | 0.1 | 0.0 | 1.0 | 0.8 | 0.0 | 0.4 | 1.7 | 4.7 | 0.0 | 0.0 | 2.2 | 1.0 | 0.0 | 28.8 | 0.7 | 0.8 | 0.9 | 0.0 | 9.8 | 85.4 |
| 6 | [11] | 0.3 | 0.0 | 0.0 | 57.3 | 0.0 | 0.6 | 0.0 | 0.0 | 0.6 | 0.8 | 1.0 | 0.0 | 0.5 | 0.0 | 0.0 | 6.5 | 0.9 | 0.6 | 0.6 | 2.6 | 0.3 | 0.0 | 0.4 | 0.0 | 7.2 | 80.0 |
| 7 | [53] | 36.4 | 0.8 | 0.0 | 15.3 | 0.0 | 0.0 | 1.7 | 0.0 | 0.0 | 0.3 | 0.0 | 0.0 | 2.0 | 0.0 | 0.0 | 0.0 | 2.9 | 0.4 | 0.0 | 6.4 | 2.6 | 0.6 | 1.1 | 0.0 | 19.6 | 89.9 |
| 8 | [54] | 0.2 | 3.4 | 0.0 | 58.5 | 0.6 | 0.0 | 2.6 | 0.0 | 0.0 | 0.0 | 0.0 | 0.0 | 0.0 | 0.0 | 2.3 | 0.0 | 1.3 | 0.0 | 0.0 | 0.0 | 0.4 | 0.7 | 0.8 | 4.8 | 8.5 | 84.1 |
| 9 | [54] | 0.3 | 2.2 | 0.0 | 66.9 | 0.2 | 0.0 | 2.9 | 0.0 | 0.0 | 0.0 | 0.0 | 0.0 | 0.0 | 0.8 | 3.2 | 0.0 | 1.0 | 0.0 | 0.0 | 0.0 | 0.2 | 0.5 | 0.7 | 3.6 | 4.2 | 86.5 |
| 10 | [54] | 0.2 | 0.6 | 0.0 | 63.3 | 0.0 | 0.0 | 1.8 | 0.0 | 0.0 | 0.0 | 0.0 | 0.0 | 0.0 | 0.3 | 2.6 | 0.0 | 1.5 | 0.0 | 0.0 | 0.0 | 0.3 | 0.6 | 0.8 | 6.8 | 7.4 | 86.2 |
| 11 | [40] | 0.0 | 0.7 | 0.0 | 53.9 | 0.0 | 0.5 | 0.8 | 0.0 | 0.0 | 0.0 | 0.0 | 0.0 | 1.2 | 1.4 | 0.0 | 7.9 | 1.8 | 0.0 | 0.0 | 3.2 | 0.0 | 0.0 | 0.0 | 1.8 | 17.6 | 90.5 |
| 12 | [40] | 0.0 | 1.6 | 0.0 | 69.6 | 0.0 | 1.2 | 0.9 | 0.0 | 0.0 | 0.0 | 0.0 | 0.0 | 0.6 | 0.6 | 0.0 | 0.4 | 0.5 | 0.0 | 0.0 | 8.4 | 0.0 | 0.0 | 0.0 | 4.8 | 8.4 | 96.7 |
| 13 | [40] | 0.0 | 2.5 | 0.0 | 53.5 | 0.0 | 1.4 | 1.6 | 0.0 | 0.0 | 0.0 | 0.0 | 0.0 | 1.2 | 0.7 | 0.0 | 4.3 | 1.2 | 0.0 | 0.0 | 6.4 | 0.0 | 0.0 | 0.0 | 2.8 | 8.1 | 83.5 |
| 14 | [40] | 0.0 | 1.4 | 0.0 | 61.3 | 0.0 | 0.8 | 0.6 | 0.0 | 0.0 | 0.0 | 0.0 | 0.0 | 1.1 | 1.7 | 0.0 | 3.7 | 0.1 | 0.0 | 0.0 | 1.4 | 0.0 | 0.0 | 0.0 | 4.6 | 8.8 | 85.3 |
| 15 | [40] | 0.0 | 0.9 | 0.0 | 33.2 | 0.0 | 0.7 | 0.7 | 0.0 | 0.0 | 0.0 | 0.0 | 0.0 | 1.5 | 2.4 | 0.0 | 4.1 | 1.5 | 0.0 | 0.0 | 31.1 | 0.0 | 0.0 | 0.0 | 4.2 | 13.0 | 93.0 |
| 16 | [55] | 1.2 | 0.6 | 3.5 | 0.0 | 0.0 | 0.0 | 1.3 | 0.0 | 3.0 | 1.0 | 0.0 | 0.0 | 0.0 | 0.0 | 0.0 | 0.0 | 0.0 | 3.0 | 19.0 | 0.0 | 0.3 | 0.4 | 1.6 | 0.0 | 0.0 | 34.8 |
| 17 | [56] | 0.0 | 0.0 | 0.0 | 44.7 | 0.0 | 5.6 | 1.6 | 0.0 | 0.0 | 1.1 | 0.0 | 0.4 | 0.8 | 2.8 | 0.0 | 0.0 | 5.2 | 2.8 | 0.0 | 14.1 | 0.0 | 0.0 | 1.3 | 2.4 | 0.0 | 82.8 |
| 18 | [57] | 0.0 | 1.8 | 0.0 | 26.9 | 0.0 | 8.0 | 1.7 | 0.0 | 1.6 | 1.1 | 0.0 | 0.9 | 0.0 | 1.7 | 0.0 | 0.0 | 0.0 | 0.3 | 0.0 | 16.0 | 0.0 | 0.0 | 2.3 | 2.4 | 20.4 | 85.0 |
| 19 | [58] | 38.6 | 0.0 | 0.0 | 7.0 | 11.6 | 0.0 | 1.4 | 0.0 | 0.0 | 0.0 | 0.0 | 0.0 | 0.9 | 0.0 | 0.0 | 0.7 | 2.3 | 0.0 | 0.0 | 0.1 | 2.3 | 0.3 | 0.9 | 0.0 | 9.2 | 75.2 |
| 20 | [58] | 35.9 | 0.0 | 0.0 | 7.8 | 14.4 | 0.0 | 1.3 | 0.0 | 0.0 | 0.0 | 0.0 | 0.0 | 1.0 | 0.0 | 0.0 | 0.6 | 2.4 | 0.0 | 0.0 | tr | 2.0 | 0.2 | 1.0 | 0.0 | 7.9 | 74.6 |
| 21 | [59] | 4.2 | 1.6 | 0.0 | 0.0 | 0.0 | 0.5 | 3.5 | 0.0 | 0.0 | 0.8 | 0.0 | 0.5 | 0.0 | 1.9 | 0.0 | 0.0 | 0.0 | 0.4 | 19.7 | 15.3 | 1.4 | 0.6 | 4.3 | 0.0 | 6.6 | 61.2 |
| 22 | [4] | 1.1 | 0.0 | 0.5 | 39.4 | 1.1 | 0.7 | 0.6 | 0.0 | 0.4 | 0.6 | 0.0 | 0.3 | 0.3 | 1.7 | 0.0 | 6.1 | 0.6 | 0.1 | 0.7 | 14.1 | 1.2 | 1.5 | 0.4 | 0.0 | 1.7 | 73.0 |
| 23 | [60] | 2.1 | 0.0 | 1.5 | 72.8 | 0.3 | 0.0 | 0.0 | 0.0 | 0.0 | 0.7 | 0.0 | 0.0 | 1.0 | 0.0 | 0.0 | 0.9 | 0.8 | 1.7 | 0.0 | 0.7 | 0.3 | 0.0 | 0.0 | 1.3 | 3.7 | 87.8 |
| 24 | [47] | 0.0 | 0.5 | 0.0 | 21.7 | 0.0 | 1.1 | 3.8 | 0.0 | 1.8 | 1.2 | 0.0 | 0.5 | 0.0 | 1.4 | 3.1 | 0.0 | 2.7 | 0.3 | 0.0 | 17.9 | 1.7 | 4.0 | 3.7 | 3.1 | 18.9 | 87.4 |
| 25 | [61] | 0.3 | 0.0 | 6.8 | 0.0 | 0.0 | 0.5 | 3.4 | 0.0 | 0.0 | 0.6 | 74.1 | 0.0 | 0.0 | 0.0 | 0.0 | 0.0 | 0.0 | 2.1 | 0.0 | 0.0 | 0.0 | 1.5 | 2.1 | 0.0 | 0.0 | 91.2 |
| 26 | [43] | 0.0 | 1.8 | 0.0 | 39.2 | tr | 4.3 | 4.4 | 0.0 | 0.0 | 0.6 | 0.0 | 0.0 | 1.6 | 2.5 | 0.0 | 0.7 | 1.3 | 0.5 | tr | 28.3 | 0.2 | 0.6 | 1.7 | 2.9 | 7.2 | 97.6 |
| 27 | [62] | 6.3 | 0.1 | 0.0 | 13.6 | 1.2 | 0.0 | 0.3 | 0.0 | 1.0 | 0.1 | 0.0 | 0.0 | 4.2 | 0.5 | 4.1 | 27.1 | 2.1 | 0.1 | 0.0 | 13.6 | 1.0 | 0.0 | 0.5 | 0.0 | 19.0 | 94.8 |
| 28 | [9] | 12.3 | 0.0 | 0.0 | 1.4 | 0.0 | 0.0 | 0.0 | 0.0 | 5.1 | 51.7 | 0.0 | 0.0 | 1.3 | 0.0 | 0.0 | 0.0 | 0.8 | 0.0 | 0.0 | 1.0 | 2.2 | 1.0 | 2.4 | 0.0 | 3.0 | 82.2 |
| 29 | [9] | 0.0 | 0.0 | 0.0 | 43.3 | 0.0 | 1.7 | 0.0 | 0.0 | 12.2 | 0.0 | 0.0 | 4.0 | 2.1 | 0.0 | 0.0 | 0.0 | 1.5 | 0.0 | 0.0 | 4.4 | 0.6 | 1.4 | 1.5 | 0.0 | 11.1 | 83.8 |
| 30 | [63] | 0.0 | 2.1 | 0.0 | 15.5 | 0.0 | 0.0 | 3.8 | 4.2 | 0.8 | 2.5 | 0.0 | 0.0 | 2.0 | 2.6 | 0.0 | 28.1 | 2.5 | 2.2 | 0.0 | tr | 0.8 | 1.1 | 2.9 | 3.6 | 8.7 | 83.4 |
| 31 | [63] | 0.0 | 2.5 | 0.0 | 15.9 | 0.0 | 0.0 | 3.7 | 4.3 | 1.0 | 2.5 | 0.0 | 0.0 | 1.9 | 2.8 | 0.0 | 26.9 | 2.1 | 2.3 | 0.0 | 0.1 | 0.5 | 1.1 | 2.3 | 3.1 | 7.0 | 80.0 |
| 32 | [63] | 0.0 | 2.4 | 0.0 | 14.2 | tr | 0.0 | 4.1 | 4.1 | 1.1 | 2.3 | 0.0 | 0.0 | 1.8 | 3.0 | 0.0 | 24.5 | 1.0 | 2.0 | 0.0 | 0.1 | 0.5 | 1.5 | 3.1 | 3.4 | 10.2 | 79.3 |
| 33 | [63] | 0.0 | 2.4 | 0.0 | 11.5 | 0.0 | 0.0 | 5.5 | 4.8 | 0.5 | 1.3 | 0.0 | 0.0 | 1.0 | 2.7 | 0.0 | 21.1 | 0.9 | 3.0 | 0.0 | 0.0 | 0.5 | 1.2 | 2.2 | 2.5 | 11.4 | 72.5 |
| 34 | [63] | 0.0 | 2.4 | 0.0 | 33.6 | 1.2 | 0.0 | 0.0 | 4.0 | 0.5 | 0.9 | 0.0 | 0.0 | 1.2 | 2.5 | 0.0 | 9.0 | 0.9 | 2.2 | 0.0 | 0.3 | 0.5 | 1.2 | 1.1 | 1.7 | 7.2 | 70.4 |
| 35 | [63] | 0.0 | 3.3 | 0.0 | 16.8 | 0.3 | 0.0 | 0.0 | 9.1 | 0.7 | 1.0 | 0.0 | 0.0 | 1.0 | 2.4 | 0.0 | 13.6 | 0.8 | 2.1 | 0.0 | 0.2 | 0.4 | 1.5 | 4.0 | 1.5 | 8.6 | 67.3 |
| 36 | [64] | 0.0 | 0.0 | 13.1 | 1.2 | 0.1 | 0.0 | 3.1 | 8.1 | 0.7 | 0.0 | 0.0 | 0.0 | 0.0 | 2.3 | 1.3 | 0.0 | 1.0 | 1.1 | 0.0 | 34.7 | 1.2 | 0.0 | 3.3 | 3.3 | 7.3 | 82.0 |
| 37 | [65] | 0.0 | 1.8 | 0.0 | 38.8 | tr | 3.6 | 2.2 | 0.0 | 0.7 | 0.7 | 0.0 | 0.2 | 0.7 | 1.8 | 2.5 | 0.6 | 0.8 | 1.6 | 0.0 | 27.8 | 0.1 | 0.0 | 1.1 | 1.9 | 3.2 | 90.1 |
| 38 | [65] | 0.0 | 0.9 | 0.0 | 25.5 | 0.1 | 1.3 | 2.0 | 0.0 | 0.8 | 0.9 | 0.0 | 0.2 | 1.0 | 2.3 | 1.9 | 0.8 | 1.3 | 1.2 | 0.0 | 43.1 | 0.3 | 0.0 | 0.7 | 1.1 | 5.7 | 90.7 |
| 39 | [65] | 0.0 | 2.3 | 0.0 | 33.7 | 0.1 | 3.2 | 3.4 | 0.0 | 0.9 | 1.4 | 0.0 | 0.3 | 1.4 | 1.7 | 3.5 | 9.2 | 1.3 | 1.3 | 0.0 | 16.9 | 0.3 | 0.0 | 1.4 | 3.3 | 7.2 | 92.5 |
| 40 | [35] | 0.0 | 2.2 | 0.0 | 45.1 | 0.0 | 1.9 | 2.8 | 0.0 | 0.0 | 0.9 | 0.0 | 0.1 | 1.5 | 1.5 | 0.0 | 2.7 | 1.1 | 0.5 | 0.0 | 16.4 | 0.3 | 0.7 | 1.6 | 5.6 | 6.4 | 91.3 |
| 41 | [35] | 0.3 | 1.0 | 0.0 | 16.1 | 0.2 | 0.0 | 1.6 | 0.6 | 0.0 | 0.3 | 0.0 | tr | 0.8 | 2.5 | 0.0 | 0.5 | 1.1 | 0.4 | 0.0 | 58.3 | 0.4 | 1.1 | 0.8 | 0.0 | 8.4 | 94.4 |
| 42 | [35] | 0.0 | 2.5 | 0.0 | 38.8 | 0.2 | 1.7 | 3.0 | 0.0 | 0.0 | 0.5 | 0.0 | 0.1 | 1.6 | 2.0 | 0.0 | 0.7 | 1.1 | 0.6 | 0.0 | 22.3 | 0.3 | 0.9 | 1.4 | 5.9 | 6.6 | 90.2 |
| 43 | [34] | 0.3 | 1.3 | 0.0 | 41.1 | tr | 1.0 | 1.7 | 0.0 | 0.0 | 0.4 | 0.0 | 0.0 | 1.5 | 1.1 | 0.0 | 2.8 | 1.7 | 0.4 | 0.0 | 20.5 | 0.7 | 0.6 | 1.5 | 4.1 | 12.0 | 92.7 |
| 44 | [66] | 0.0 | 0.0 | 0.0 | 9.7 | 0.1 | 0.0 | 0.7 | 0.0 | 5.6 | 0.0 | 0.0 | 0.2 | 0.0 | 0.7 | 0.0 | 0.0 | 1.3 | 0.0 | 0.0 | 49.1 | 1.8 | 0.0 | 0.3 | 4.2 | 18.4 | 91.9 |
| 45 | [67] | 7.2 | 0.6 | 0.2 | 5.3 | 0.0 | 0.0 | 1.0 | 0.0 | 0.5 | 0.1 | 0.0 | 0.0 | 2.5 | 0.0 | 0.0 | 36.3 | 1.0 | 0.9 | 0.0 | 19.6 | 0.8 | 0.1 | 0.4 | 0.0 | 10.6 | 87.1 |
| 46 | [41] | 0.0 | 4.5 | 0.0 | 30.4 | 0.7 | 0.0 | 8.6 | 4.8 | 0.5 | 0.1 | 0.0 | 0.0 | 1.0 | 1.8 | 1.2 | 5.5 | 0.9 | 1.1 | 0.0 | 19.1 | 0.4 | 0.0 | 2.4 | 2.6 | 6.0 | 91.7 |
| 47 | [41] | 0.0 | 5.8 | 16.7 | 0.1 | 0.0 | 11.9 | 3.0 | 0.5 | 0.3 | 0.0 | 0.0 | 1.1 | 2.2 | 0.9 | 25.7 | 1.1 | 1.2 | 0.0 | 1.9 | 0.6 | 0.0 | 2.5 | 3.3 | 12.9 | 91.9 | |
| 48 | [41] | 0.0 | 5.0 | 0.0 | 1.5 | 1.3 | 0.0 | 9.5 | 5.8 | 0.4 | 0.6 | 0.0 | 0.0 | 0.7 | 2.4 | 0.4 | 1.7 | 0.9 | 1.2 | 0.0 | 47.0 | 0.3 | 0.0 | 2.4 | 0.5 | 8.3 | 89.8 |
| 49 | [46] | 0.0 | 3.0 | 0.0 | 35.9 | 0.0 | 7.2 | 1.8 | 0.0 | 0.1 | 0.6 | 0.0 | 0.0 | 1.1 | 2.4 | 0.0 | 0.0 | 1.1 | 0.3 | 0.0 | 22.1 | 0.4 | 0.7 | 1.4 | 1.5 | 9.3 | 88.7 |
| 50 | [68] | 6.4 | 0.0 | 0.0 | 30.7 | 0.0 | 0.0 | 0.2 | 0.0 | 0.0 | 0.3 | 0.0 | 0.0 | 1.0 | 2.6 | 0.0 | 32.1 | 2.2 | 0.1 | 0.0 | 0.0 | 0.7 | 0.0 | 0.0 | 2.5 | 15.3 | 94.0 |
| 51 | [69] | 0.0 | 1.6 | 0.3 | 3.2 | 0.0 | 0.0 | 5.1 | 0.0 | 0.0 | 0.2 | 0.0 | 0.0 | 3.5 | 0.0 | 0.0 | 0.0 | 0.4 | 2.3 | 0.0 | 34.0 | 2.1 | 0.0 | 5.6 | 0.0 | 10.5 | 68.8 |
| 52 | [69] | 0.0 | 1.4 | 5.3 | 29.0 | 0.0 | 0.0 | 3.3 | 0.0 | 0.0 | 7.9 | 0.0 | 0.0 | 1.6 | 0.0 | 0.0 | 0.0 | 0.4 | 1.4 | 0.0 | 18.5 | 2.1 | 0.0 | 2.4 | 0.0 | 10.8 | 84.1 |
| 53 | [70] | 12.1 | 0.0 | 0.0 | tr | 5.9 | 0.0 | 3.2 | 0.0 | 15.9 | 0.3 | 0.0 | 43.9 | 1.3 | 0.7 | 0.2 | 0.0 | 0.5 | 0.3 | 0.0 | tr | 0.7 | 2.2 | tr | 0.0 | 8.4 | 95.6 |
| 54 | [70] | 1.1 | 0.0 | 0.0 | 10.0 | 2.9 | 0.0 | 2.3 | 0.0 | 3.6 | 2.7 | 0.0 | tr | 1.9 | 32.6 | 2.5 | 0.0 | 2.9 | 0.7 | 0.0 | tr | 1.8 | 1.3 | tr | 0.0 | 19.3 | 85.6 |
| 55 | [70] | 23.1 | 0.0 | 0.0 | 0.9 | 5.2 | 0.0 | 4.4 | 0.0 | 7.1 | 5.0 | 0.0 | 12.2 | 1.6 | 4.0 | 2.4 | 0.0 | 1.7 | tr | 0.0 | tr | 1.5 | 1.5 | 0.6 | 0.0 | 24.7 | 95.9 |
| 56 | [71] | 0.8 | 0.0 | 0.0 | 48.2 | 0.0 | 0.8 | 0.2 | 0.0 | 0.0 | 0.7 | 0.0 | 0.0 | 1.1 | 1.6 | 0.0 | 4.6 | 0.7 | 0.0 | 0.8 | 0.0 | 0.7 | 0.0 | 0.1 | 0.9 | 12.9 | 74.1 |
| 57 | [72] | 1.1 | 0.3 | 0.0 | 1.3 | 0.0 | 0.0 | 0.8 | 0.0 | 37.4 | 0.1 | 0.0 | 38.3 | 0.6 | 0.2 | 0.1 | 0.7 | 0.4 | 0.7 | 0.0 | 0.1 | 0.8 | 0.0 | 0.1 | tr | 9.6 | 92.6 |
| 58 | [73] | 8.5 | 1.2 | 0.0 | 28.1 | 5.3 | 0.0 | 0.1 | 0.0 | 0.0 | 0.1 | 0.0 | 0.0 | 7.3 | 1.5 | 0.0 | 20.3 | 0.6 | 0.9 | 0.6 | 0.6 | 0.8 | 0.0 | 0.7 | 0.0 | 15.1 | 91.7 |
| 59 | [2] | 0.0 | 0.9 | 0.0 | 43.8 | 0.1 | 2.5 | 2.0 | 0.0 | 3.5 | 0.6 | 0.0 | 0.2 | 1.0 | 2.0 | 0.0 | 6.1 | 0.9 | 0.7 | 0.0 | 18.3 | 0.3 | 0.5 | 1.1 | 0.3 | 6.3 | 91.1 |
| 60 | [74] | 0.0 | 1.7 | 0.0 | 35.5 | 0.7 | 2.8 | 1.8 | 0.0 | 0.0 | 2.1 | 0.0 | 0.2 | 2.9 | 3.0 | 0.0 | 5.2 | 0.0 | 1.6 | 0.0 | 0.0 | 1.2 | 0.4 | 1.4 | 8.6 | 20.5 | 89.7 |
| 61 | [75] | 13.8 | 0.0 | 0.0 | 37.9 | 0.0 | 0.0 | 0.0 | 0.0 | 6.3 | 0.5 | 0.0 | 7.7 | 0.0 | 0.2 | 0.0 | 2.5 | 1.0 | 0.6 | 0.0 | 1.6 | 0.0 | 0.8 | 0.2 | 0.0 | 11.7 | 84.8 |
| 62 | [75] | 38.4 | 0.0 | 0.0 | 28.2 | 0.0 | 0.0 | 0.0 | 0.0 | 0.0 | 0.6 | 0.0 | 0.1 | 0.0 | 0.9 | 0.0 | 0.9 | 0.8 | 0.7 | 0.0 | 0.9 | 0.0 | 0.6 | 0.0 | 0.0 | 6.5 | 78.6 |
| 63 | [75] | 39.9 | 0.0 | 0.0 | 29.2 | 0.0 | 0.0 | 0.3 | 0.0 | 0.0 | 0.5 | 0.0 | 0.0 | 0.0 | 1.5 | 0.0 | 0.7 | 1.8 | 0.7 | 0.0 | 0.7 | 0.0 | 0.6 | 0.3 | 0.0 | 8.9 | 85.0 |
| 64 | [7] | 1.5 | 0.4 | 0.0 | 0.0 | 5.5 | 0.0 | 2.9 | 0.0 | 4.1 | 41.8 | 0.0 | 19.7 | 1.0 | 0.1 | 0.0 | 0.2 | 0.2 | 0.4 | 0.0 | 0.0 | 1.1 | 1.0 | 0.0 | 0.0 | 1.8 | 81.2 |
| 65 | [76] | 0.3 | 1.3 | 31.9 | 30.1 | 0.0 | 0.0 | 1.6 | 0.0 | 0.0 | 0.6 | 0.0 | 0.0 | 0.9 | 2.6 | 0.0 | 0.0 | 1.6 | 0.3 | 0.0 | 6.1 | 0.8 | 0.4 | 0.7 | 0.0 | 12.3 | 91.4 |
| 66 | [76] | 0.0 | 1.5 | 0.6 | 55.1 | 0.0 | 0.0 | 1.7 | 0.0 | 0.0 | 0.7 | 0.0 | 0.0 | 1.6 | 3.5 | 0.0 | 0.0 | 3.2 | 0.0 | 0.0 | 3.4 | 1.1 | 0.6 | 0.8 | 0.0 | 17.1 | 90.8 |
| 67 | [77] | 5.9 | 0.0 | 0.0 | 20.3 | 0.0 | 0.0 | 0.0 | 0.0 | 1.1 | 0.5 | 0.0 | 0.0 | 1.3 | 2.7 | 2.1 | 23.4 | 2.5 | 1.0 | 0.0 | 5.0 | 1.1 | 0.1 | 0.0 | 1.7 | 17.8 | 86.5 |
| 68 | [78] | 0.2 | 0.0 | 0.0 | 39.3 | 0.0 | 1.7 | 0.2 | 0.0 | 0.2 | 0.7 | 0.0 | 0.4 | 0.0 | 0.0 | 0.0 | 0.0 | 0.8 | 2.8 | 0.2 | 22.1 | 0.2 | 1.7 | 0.0 | 0.0 | 2.9 | 73.4 |
| 69 | [79] | 0.0 | 3.2 | 0.0 | 24.9 | 0.0 | 6.4 | 5.1 | 0.0 | 0.9 | 0.7 | 0.0 | 0.3 | 1.4 | 2.2 | 0.0 | 0.0 | 2.3 | 0.7 | 0.0 | 16.3 | 1.6 | 0.6 | 2.4 | 4.0 | 8.9 | 82.0 |
| 70 | [42] | 0.0 | 1.0 | 1.9 | 24.5 | 0.2 | 0.3 | 2.3 | 0.0 | 0.2 | 0.4 | 0.0 | 0.7 | 0.3 | 7.3 | 0.0 | 0.0 | 0.1 | 1.1 | 0.0 | 44.6 | 0.0 | 0.4 | 0.4 | 0.4 | 0.5 | 86.6 |
| AVERAGE | 4.4 | 1.3 | 1.0 | 28.5 | 0.9 | 1.0 | 2.1 | 0.8 | 1.8 | 2.1 | 1.1 | 1.9 | 1.2 | 2.0 | 0.5 | 5.3 | 1.3 | 0.8 | 0.6 | 13.4 | 1.7 | 0.6 | 1.3 | 1.8 | 9.9 | ||
| AATSC1v | GATS3p | IC0 | MW | |
|---|---|---|---|---|
| ATSC5e | 0.213 | 0.205 | −0.062 | −0.102 |
| p = 0.102 | p = 0.115 | p = 0.639 | p = 0.436 | |
| AATSC1v | 0.068 | 0.002 | 0.221 | |
| p = 0.608 | p = 0.989 | p = 0.089 | ||
| GATS3p | 0.009 | −0.224 | ||
| p = 0.947 | p = 0.086 | |||
| IC0 | −0.074 | |||
| p = 0.574 |
| χ2 | RMSE | MBE | MPE | SSE | AARD | r2 | |
|---|---|---|---|---|---|---|---|
| RI | 5853.304 | 75.867 | 16.527 | 5.212 | 328956.214 | 4367.929 | 0.910 |
Publisher’s Note: MDPI stays neutral with regard to jurisdictional claims in published maps and institutional affiliations. |
© 2021 by the authors. Licensee MDPI, Basel, Switzerland. This article is an open access article distributed under the terms and conditions of the Creative Commons Attribution (CC BY) license (https://creativecommons.org/licenses/by/4.0/).
Share and Cite
Aćimović, M.; Pezo, L.; Zeremski, T.; Lončar, B.; Marjanović Jeromela, A.; Stanković Jeremic, J.; Cvetković, M.; Sikora, V.; Ignjatov, M. Weather Conditions Influence on Hyssop Essential Oil Quality. Processes 2021, 9, 1152. https://0-doi-org.brum.beds.ac.uk/10.3390/pr9071152
Aćimović M, Pezo L, Zeremski T, Lončar B, Marjanović Jeromela A, Stanković Jeremic J, Cvetković M, Sikora V, Ignjatov M. Weather Conditions Influence on Hyssop Essential Oil Quality. Processes. 2021; 9(7):1152. https://0-doi-org.brum.beds.ac.uk/10.3390/pr9071152
Chicago/Turabian StyleAćimović, Milica, Lato Pezo, Tijana Zeremski, Biljana Lončar, Ana Marjanović Jeromela, Jovana Stanković Jeremic, Mirjana Cvetković, Vladimir Sikora, and Maja Ignjatov. 2021. "Weather Conditions Influence on Hyssop Essential Oil Quality" Processes 9, no. 7: 1152. https://0-doi-org.brum.beds.ac.uk/10.3390/pr9071152