Article

Hydrogen for Maritime Application—Quality of Hydrogen Generated Onboard Ship by Electrolysis of Purified Seawater

1
National Physical Laboratory, Hampton Road, Teddington, Middlesex TW11 0LW, UK
2
Toyota Motor Europe, R&D, Fuel Cell Division, 1930 Zaventem, Belgium
3
SINTEF Industry, 7010 Trondheim, Norway
4
STP, DEHT, CEA, Univ Grenoble Alpes, 38000 Grenoble, France
5
SLCE Watermakers, 149, Rue Salvador DALI—ZA de Kergouaran, 56607 Lanester, France
*
Author to whom correspondence should be addressed.
Submission received: 31 May 2021 / Revised: 6 July 2021 / Accepted: 9 July 2021 / Published: 20 July 2021
(This article belongs to the Section Energy Systems)

Abstract

:
Maritime transport is investigating several options to reduce its greenhouse gases and air pollutant emissions. An experimental ship, Energy Observer, is using excess renewable energy to generate onboard hydrogen by electrolysis of purified seawater. As a promising option for storing energy, it can provide on-demand energy to the ship through a hydrogen fuel cell (FC). As hydrogen FCs lifetime and performance are correlated to hydrogen quality, the hydrogen produced onboard needs to be monitored. This study assesses the probability of contaminants presence for this electrolyser, using purified seawater and supports the results with a hydrogen fuel quality analysis from the Energy Observer ship. It demonstrates that an electrolyser using onboard purified seawater can generate hydrogen of a quality compliant with ISO 14687:2019. Additional contaminants (i.e., ions, heavy metal) were also measured. The study highlights the potential contaminants to be monitored and future research on new contaminants from seawater to further develop hydrogen fuel for maritime applications.

1. Introduction

The decarbonisation of the transport sector has accelerated in recent years, especially for land transportation (through battery electrical vehicles and fuel cell electrical vehicles) [1,2]. However, approximately 90% of world trade is transported by ship. In a business-as-usual scenario, total shipping emissions could account for about 18% of worldwide greenhouse gas emissions by 2050 [3]. The shipping industry is responsible for emitting around 1 Gt of CO2 equivalent every year [4]. The decarbonisation of maritime transport is critical to achieve Europe’s targets of zero emissions by 2050 [5] and for the 21st Conference of the Parties’ (COP21) targets. Shipping is one of the lowest emitting freight transport options (10–15 g per tonne-kilometre (g/tkm)); it is lower than rail (19–41 g/tkm), trucking (51–91 g/tkm) and aviation (673–867 g/tkm) [6]. Maritime shipping is, however, responsible for significant emissions of air pollutant and greenhouse gases (18 to 30% of NOx, 9% of SOx, and 3.5 to 4% of CO2 emissions worldwide [7]). The Danish Centre for Energy, Environment and Health (CEEH) found that European ship emissions were responsible for around 50,000 premature deaths every year [8]. The development of alternative energy applications for maritime transport would support a better global environment and improved health locally (along shipping routes).
In 2018, the International Maritime Organization (IMO) agreed to reduce GHG emissions by at least 50% by 2050 compared with a 2008 baseline [9]. Several technological pathways are emerging involving multiple technologies for propulsion and power (i.e., advanced biofuels, hydrogen, ammonia, fuel cells, wind, solar or nuclear) [10]. One of the key factors for maritime transport is the gravimetric energy density and fuel storage. Electric propulsion is considered one of the most energy efficient technology pathways and does not significantly release air pollutants. Despite this fact, battery electric has one disadvantage related to the potential cargo space lost by accommodating the batteries that could negate some of the energy-saving gains, particularly for larger ships on long journeys. This may lead to additional ships being needed to make up for the lost cargo space in order to maintain transport supply [11].
Among the possible alternatives, hydrogen fuel cells are considered as one of the most promising future technologies for maritime transport [12,13]. This perspective has motivated several studies to assess the potential and applicability of such systems in the maritime environment with a number of demonstrator systems [12]. Moreover, fuel cell hydrogen technology could support reducing the lost cargo space due to the higher gravimetric power density of hydrogen than battery and the ability to generate hydrogen onboard through renewable energy (i.e., a wind turbine or solar panel). A combination of hydrogen fuel cell, battery and renewable electricity generation would allow more sustainable maritime transport and reduce the cargo space lost, as the energy can be generated during the journey. The Energy Observer ship [14] is currently exploring this combination in a real-life situation.
The use of excess renewable energy to generate onboard hydrogen by the electrolysis of water is a promising option for storing energy and then providing energy back to the vessel using the hydrogen in a fuel cell. As water and electricity are available to the ship, hydrogen can be generated and stored onboard for use in a proton exchange membrane fuel cell (PEMFC) to generate power onboard the vessel.
PEMFC technology is maturing and is used in a large spectrum of transport vehicles such as cars, trucks, trains and forklifts [2] with tens of thousands of units currently in use worldwide. One of the key influences on PEMFC durability is impurities in the hydrogen with compounds such as sulphur species and carbon monoxide [15,16] reducing the lifetime. Hydrogen quality is monitored carefully for road vehicles through international standard (ISO 14687 [17], ISO 19880-8 [18]) and is related to the production process. In a proton exchange membrane water electrolyser (PEMWE) system, the water feedstock is a critical parameter in the process and could be one of the main sources of contaminants in the hydrogen generated [19].
However, there is currently no study or evidence of the hydrogen quality from a system onboard a ship such as Energy Observer using purified seawater as feedstock for the PEMWE. Understanding the likelihood of contaminant presence in hydrogen produced onboard the vessel is critical to ensure the durability of the system in a maritime environment and for the further development of these technologies. This study focuses on evaluating the probability of contaminant presence in the hydrogen produced by an onboard electrolyser using desalinated and purified seawater and renewable energy.
The probability of contaminant presence follows the guidance of the international standard ISO 19880-8 [18]. Two types of contaminants were considered: 1—contaminants known to impact PEMFC performance (contaminants mentioned in the international standard ISO 14687:2019 [17]) and 2—contaminants emerging from seawater. A measurement of the hydrogen produced onboard a prototype is presented as evidence. This study demonstrates that the proposed concept generates hydrogen of a quality compatible for the long-term operation of a PEMFC and will highlight further research areas.

2. Materials and Methods

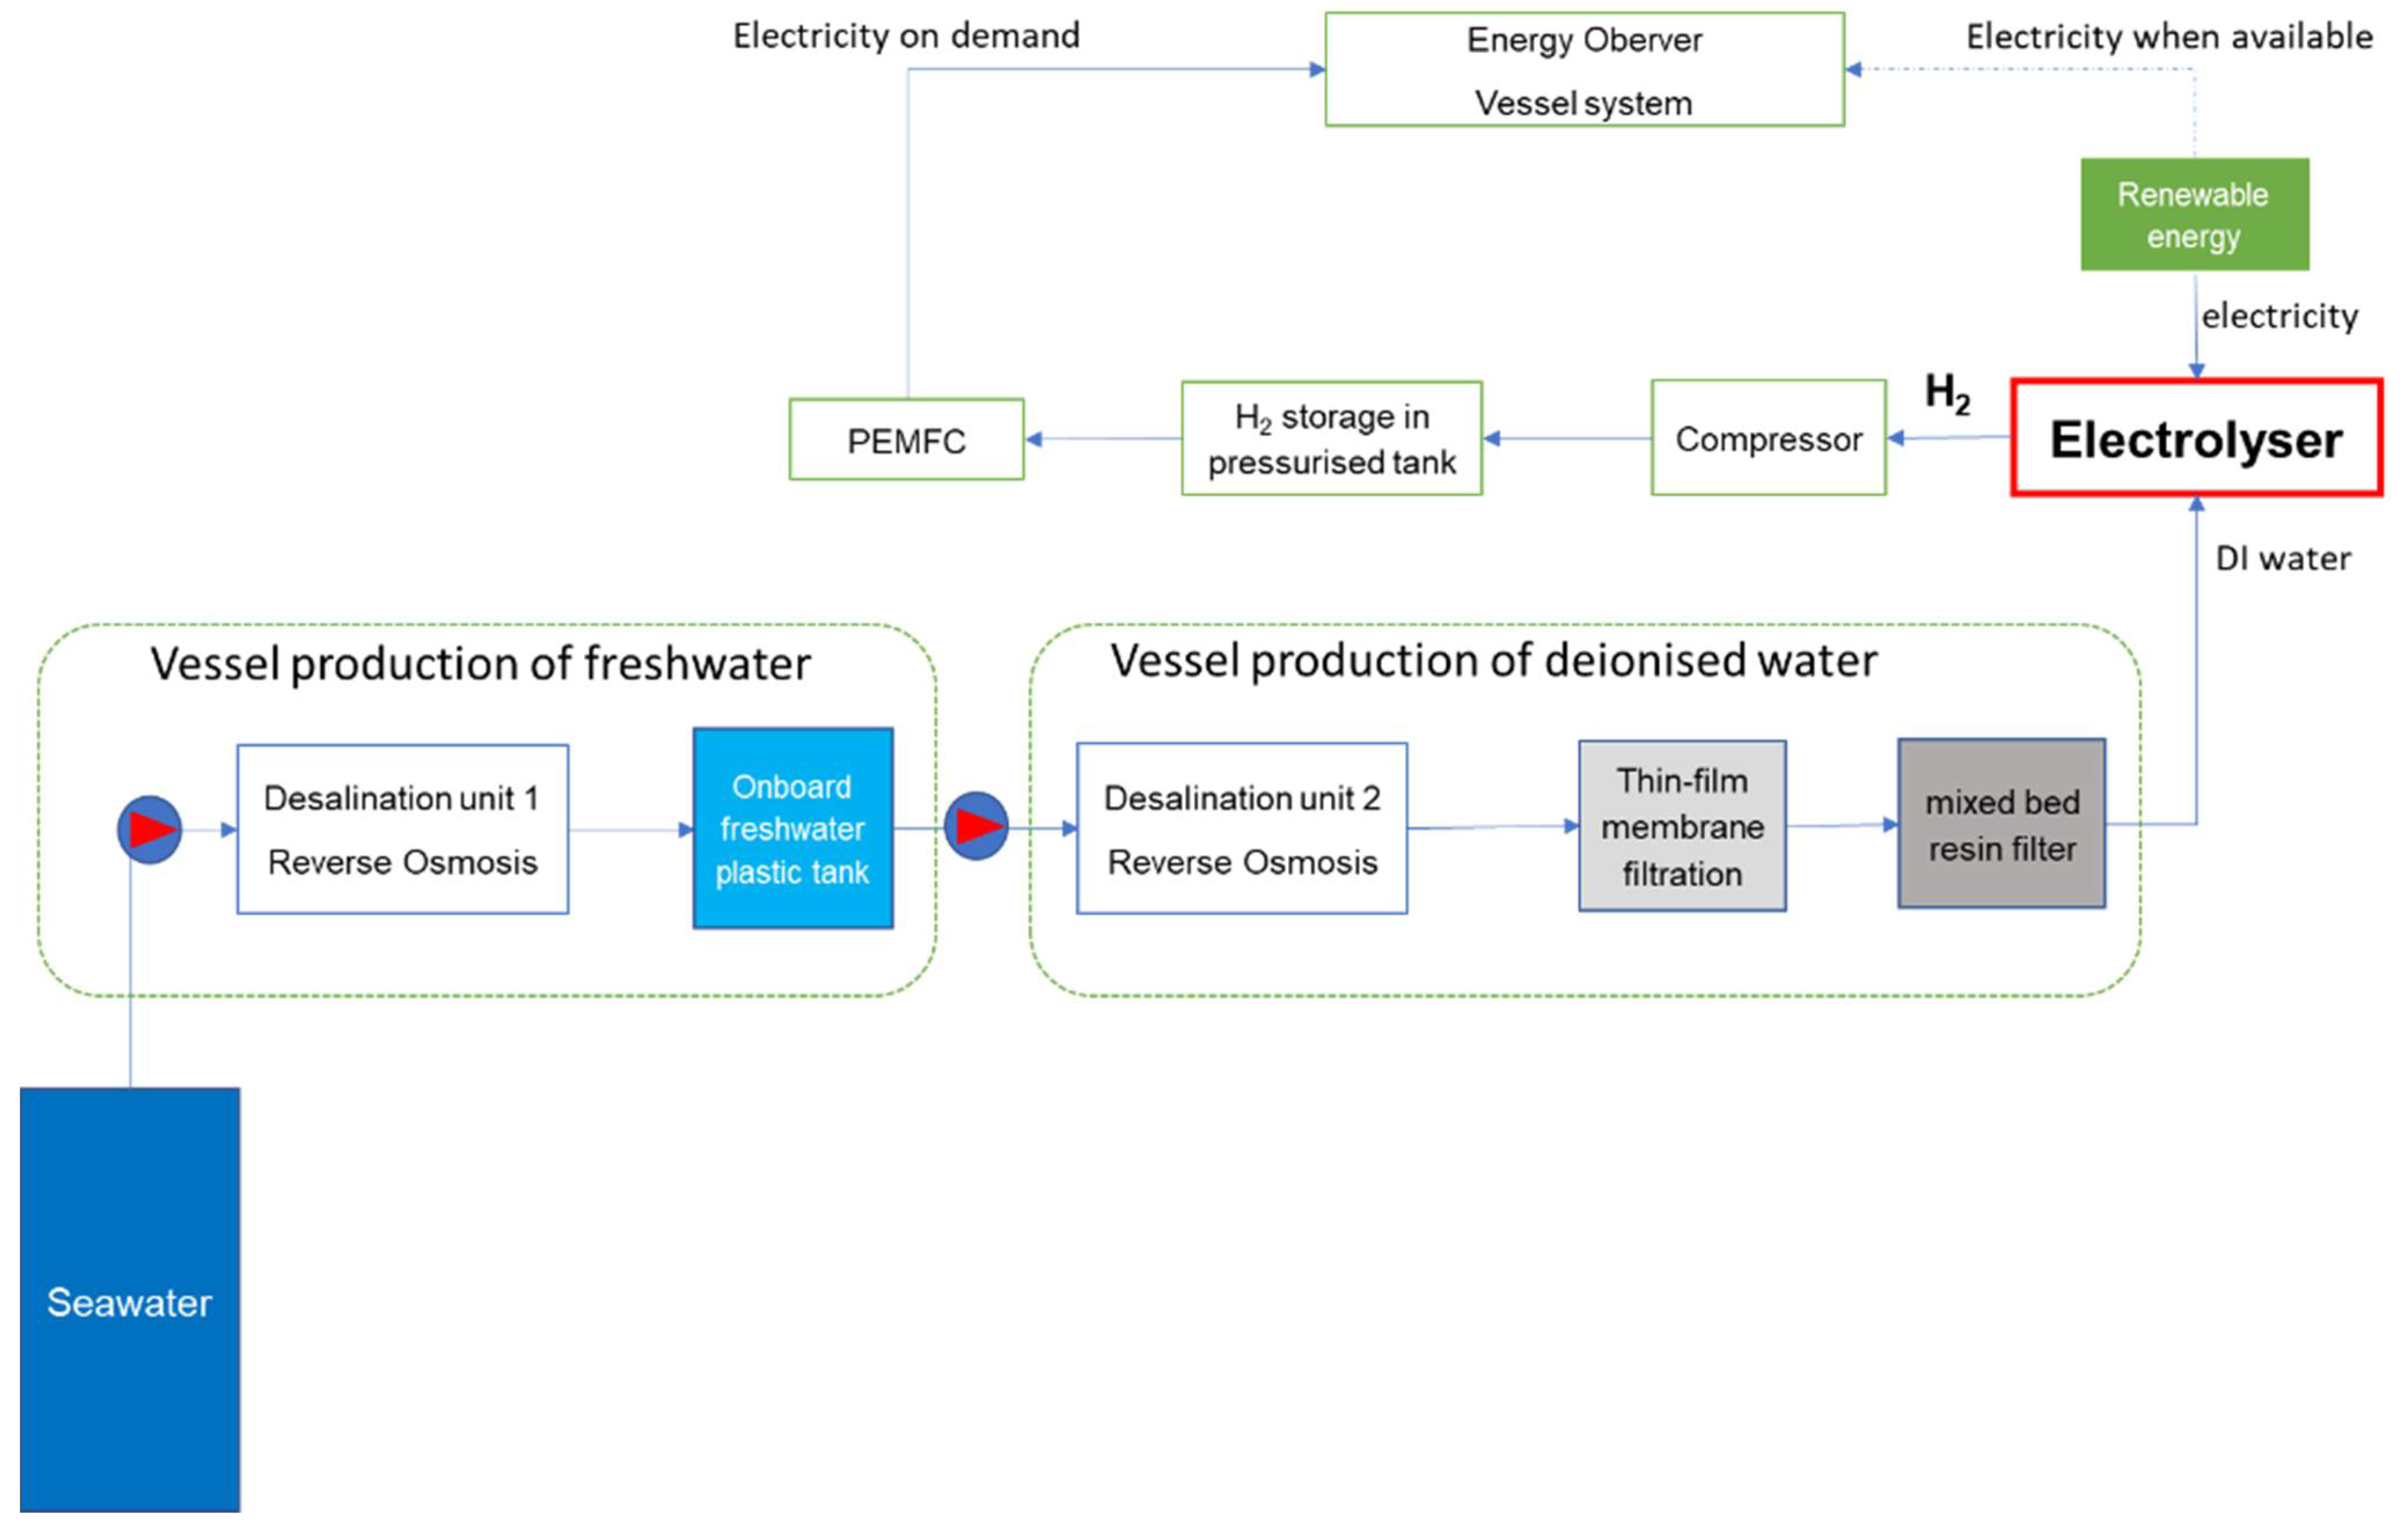
2.1. Ship with Hydrogen Generation Onboard System

The system proposed in the study is the Energy Observer ship system. It uses an onboard PEM water electrolyser (PEMWE) fed by renewable energy generated via solar panel, wind turbine and seawater purified onboard to generate hydrogen. The hydrogen is then compressed and stored onboard. The hydrogen is used to generate power to the ship through a Toyota fuel cell stack from the first generation of Mirai [20].
The electrolyser is situated onboard the boat, with seawater being taken directly from the sea, and purified on board. Due to the boat being constantly in motion and taking seawater from many places/sources it is important that marine environment contaminants (i.e., oil spillage, antifouling paint, heavy metals [21,22]) be considered as well as the composition of seawater itself [23]. A schematic of the system is presented in Figure 1.

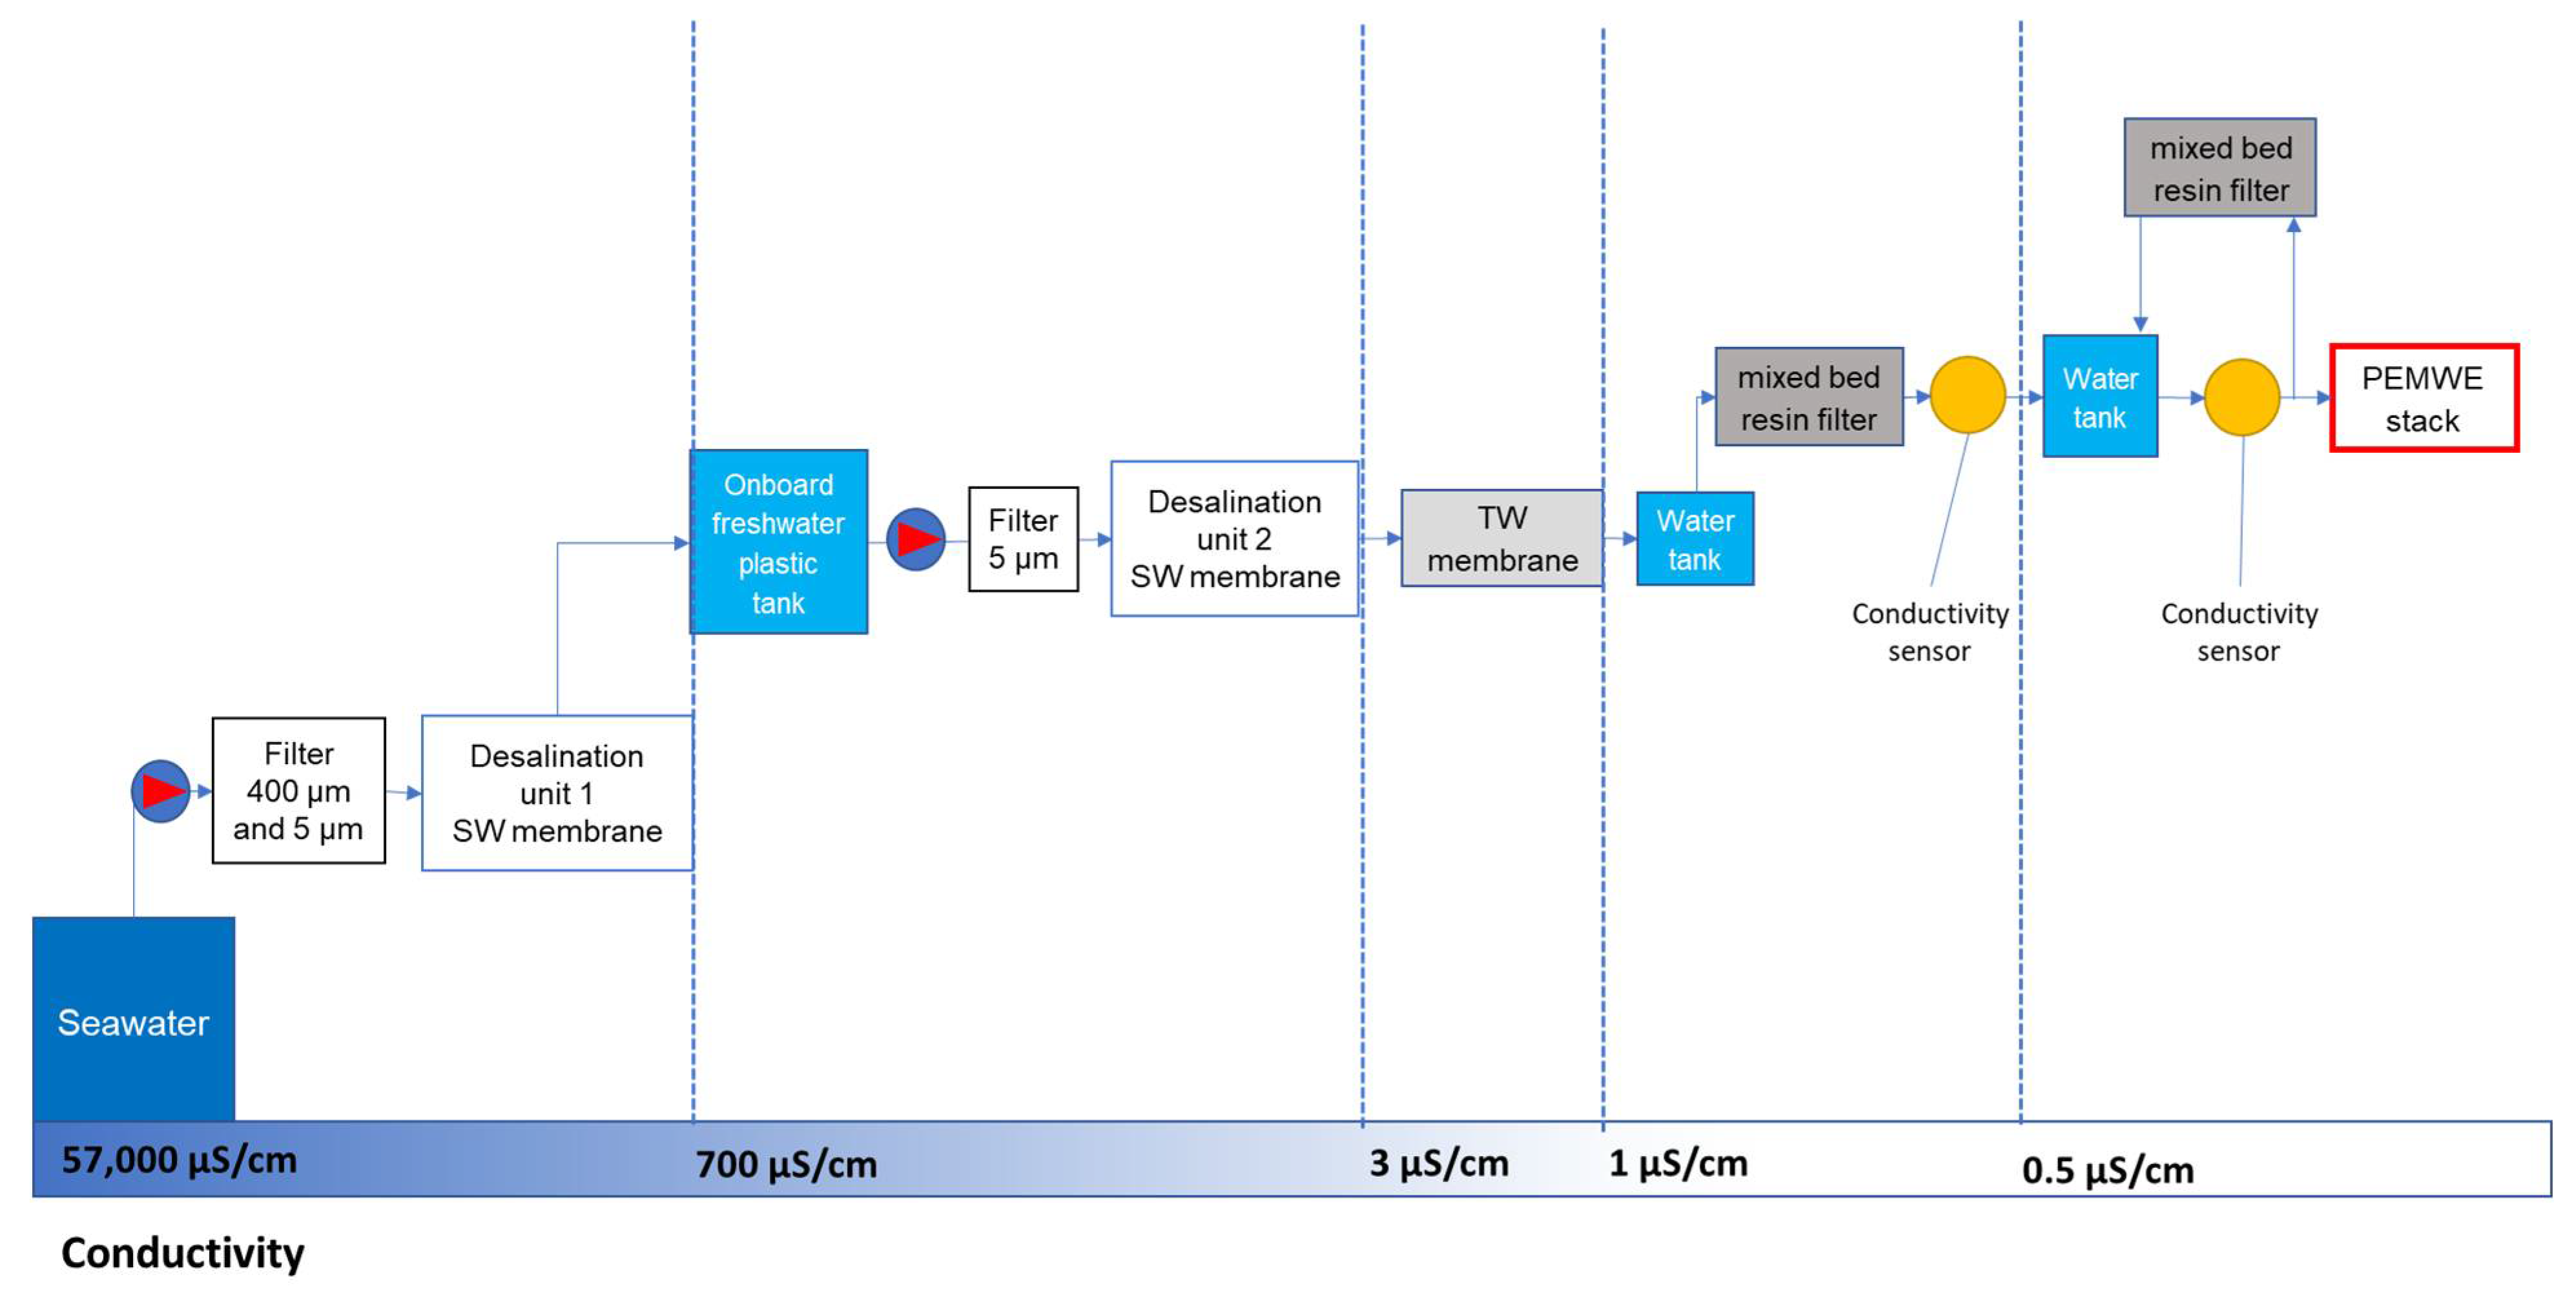
2.1.1. Seawater Purification System

The seawater is directly taken locally along the ship’s journey. The first step involves a prefiltration (down to 5 µm) to remove very large particulates and in order to avoid any damage to the membrane. Then, desalination of the seawater is carried out using two separate desalination units; both units remove impurities by reverse osmosis (RO) to remove ions. The reverse osmosis semipermeable membrane (SW30, Dow Filtec membrane) acts as a barrier to all dissolved salts and inorganic molecules as well as organic molecules with a molecular mass greater than approximately 100 Daltons (Figure 2). The RO units effectively achieve a high salt rejection of 99.2 to 99.5%. After the two steps of reverse osmosis, the conductivity of the water is approximately 3 µs/cm.
After desalination, there are additional steps to further remove impurities, this includes thin-film composite membrane filtration. The polyamide thin-film composite membrane (TW30 membrane, Dow Filmtec membranes) are semipermeable membranes that can achieve a high salt rejection of 98%. After this step, the conductivity of the water is approximately 1 µs/cm (Figure 2). The final purification is done by mixed bed resins to remove ions dissolved in the water.
This purification system is designed to reach a water conductivity of approximately 0.5 µS/cm. The conductivity of the water is measured at the end of the process to monitor the process performance (requirement: 0.5 µS/cm equivalent to 2 MΩ cm).

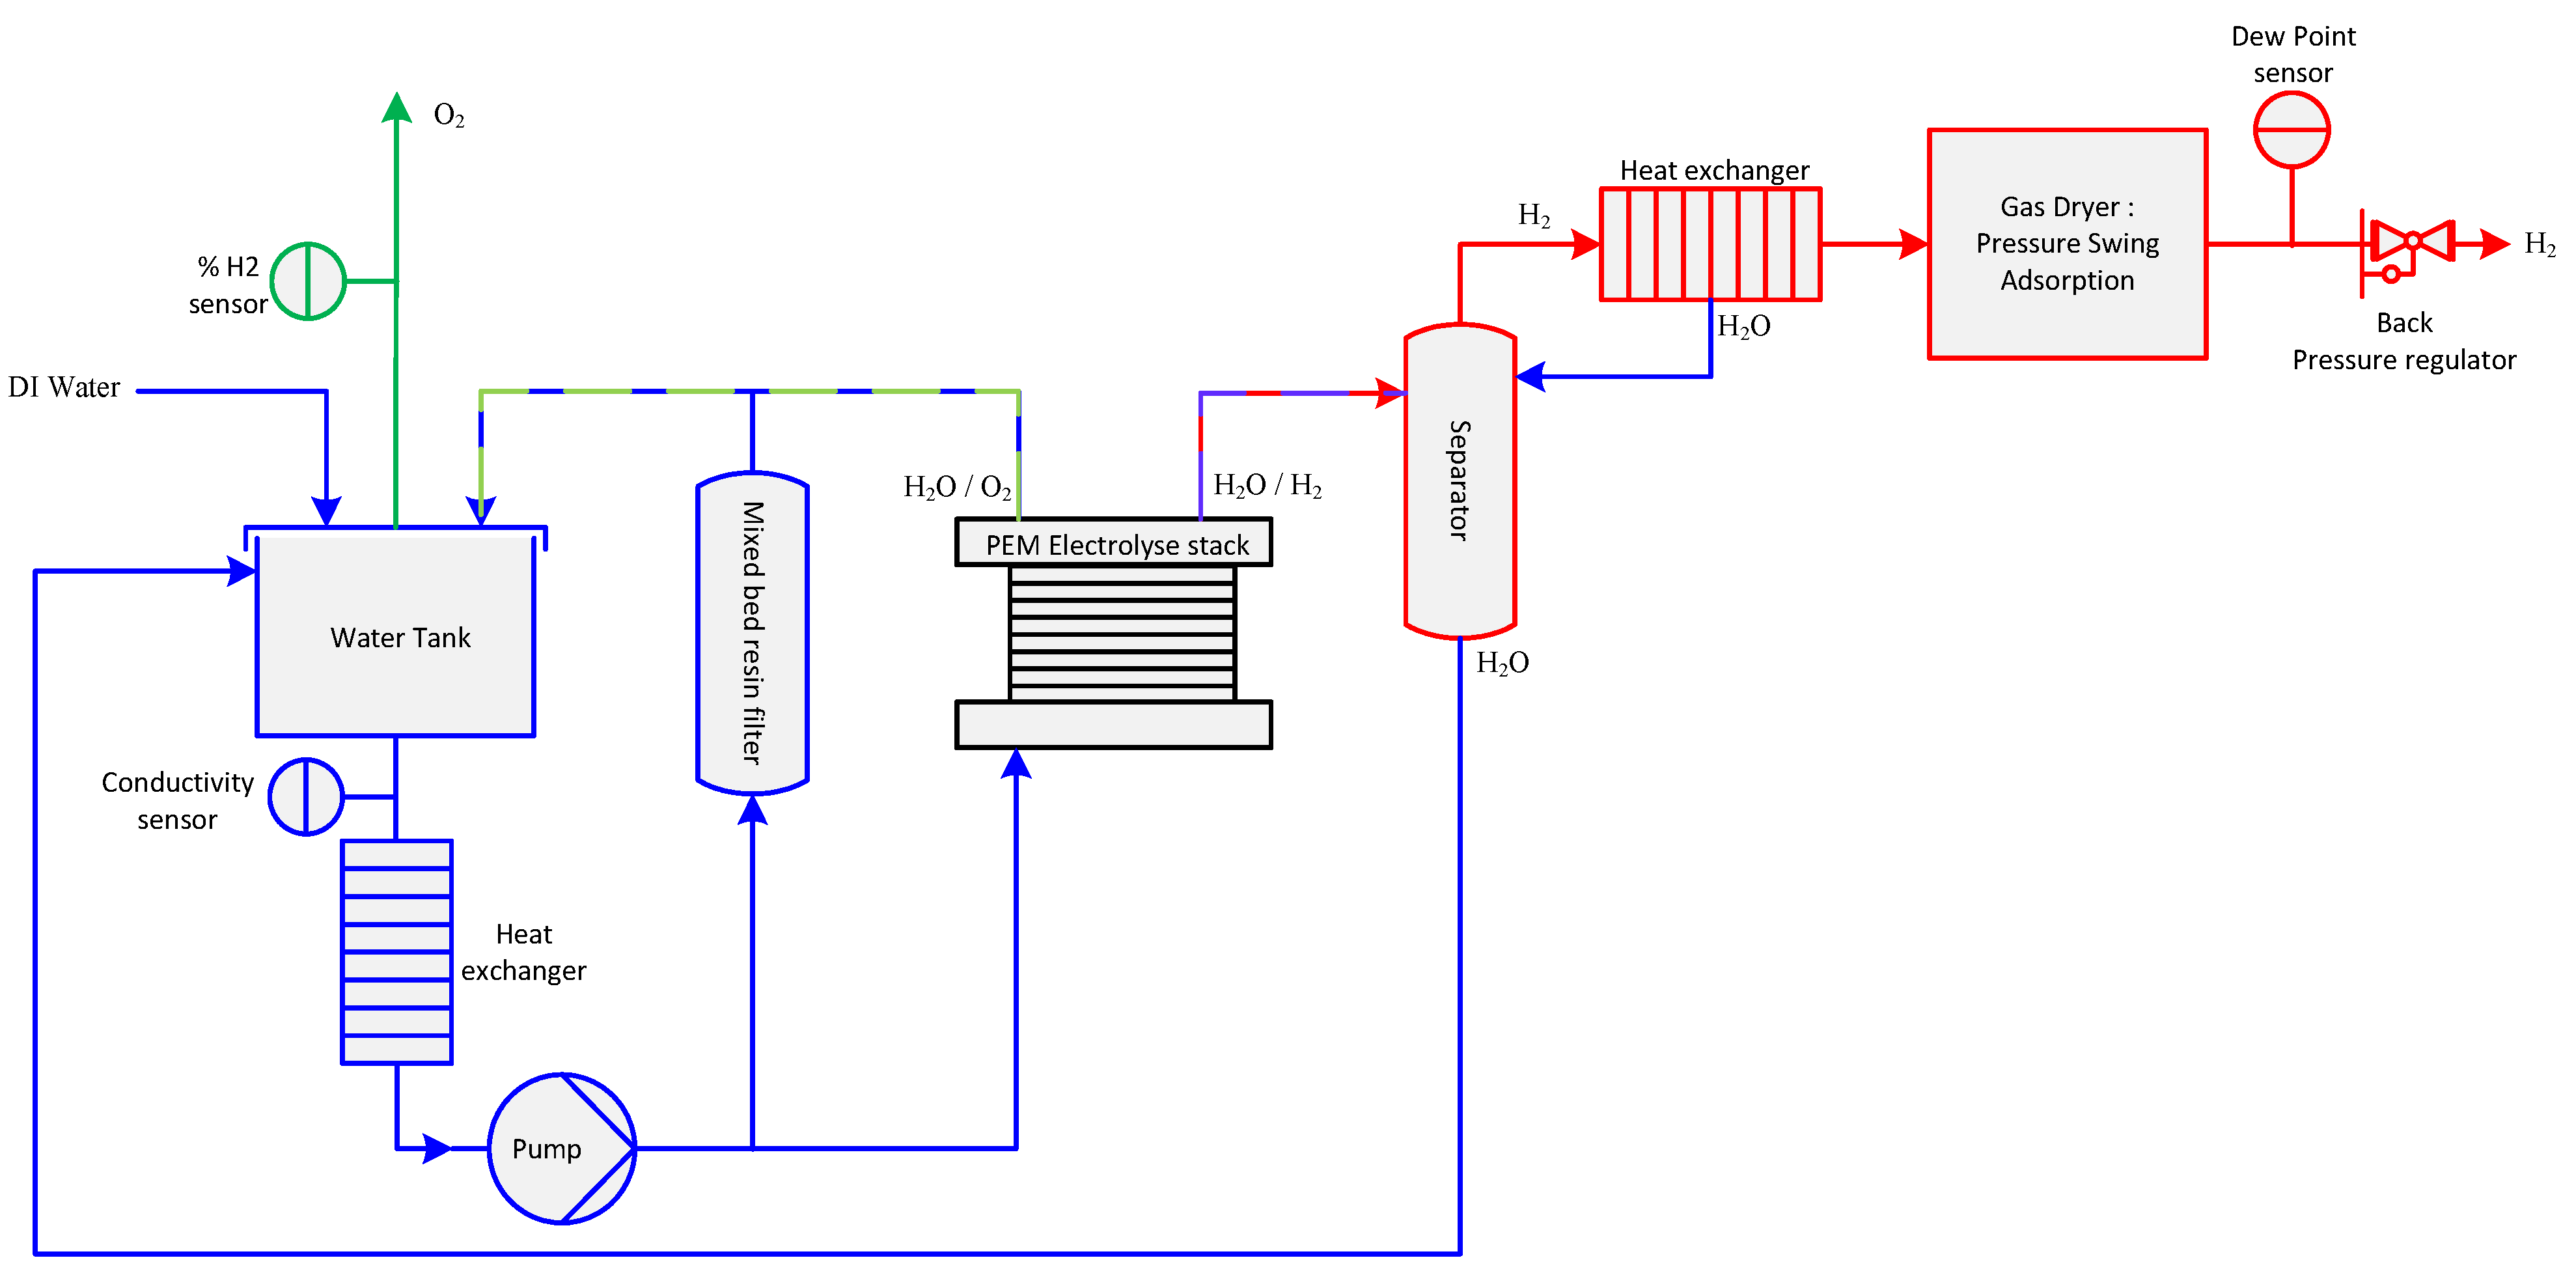
2.1.2. PEM Water Electrolyser (PEMWE)

Water electrolysis splits the water electrochemically, generating hydrogen gas at the cathode and oxygen gas at the anode. The vessel electrolyser can produce up to 4 Nm3/h of hydrogen at a 30 Bar gauge and with a dew point equal to −65 °C. The expected purity of the hydrogen is at least 99.9995%. Oxygen production is generated above atmospheric pressure.
The electrochemical reactions take place inside the PEM electrolyser stack. Under the passage of electrical current, water is oxidised into oxygen and protons at the anode. Protons cross through the membrane and are reduced at the cathode to produce hydrogen according to Equations (1)–(3). Water electrolysis also produces heat depending on reaction efficiency.
Anode reaction:   H2O → 2H+ + 2e + ½ O2
Cathode reaction:   2H+ + 2e → H2
Global reaction:   H2O → H2 + ½ O2
The fluid schematic presented in the Figure 3 shows a simple view of the electrolyser’s main components.
A pump feeds the stack with water to manage the supply of reactant and the thermal evacuation. Produced oxygen and excess water are returned to the main water tank. Gas is separated from liquid water by gravity and before venting oxygen, a sensor measures hydrogen concentration as part of the safety features. The presence of high hydrogen levels in oxygen reflects membrane or seal defects, which can lead to the creation of an explosive atmosphere. During operation, circulated water is continuously filtered with guard mixed bed resin filter while the water conductivity is monitored. If the water conductivity is higher than 1 µS/cm (equivalent to 1 MΩ.cm) during steady state operation, the electrolysis process is stopped. The membrane of a PEM electrolyser is sensitive to cation poisoning, which can cause a loss of stack performance and a shorter lifetime. Ionic contaminants could also lead to the production of nondesired compounds during operation. Even if deionised (DI) water supply meets conductivity criteria, ions can be generated by the electrolyser itself due to internal component degradation [24,25], such as a porous transport layer and catalyst or ancillary components [26] such as pump, tubing, water tank, or from air dissolution in water, especially during long-term shutdown for both cases. The water at the electrolyser stack inlet must therefore be purified to a very high standard [27], highlighting the importance of the seawater purification system beforehand.
Out of the cathodic stack compartment, hydrogen is exhausted at 45 °C and is water saturated. Moreover, it is mixed with liquid water due to electro-osmosis water flow. Consequently, three additional steps are needed to obtain dry hydrogen. Firstly, a liquid/gas separator allows the removal of water from gas and sends it back to the main water tank. Then a heat exchanger cools gases to around 10/15 °C, condensate water goes down to liquid/gas separator. Finally, a pressure swing adsorption dryer decreases the hydrogen dew point to −65 °C. A dew point sensor monitors hydrogen humidity and can be considered as a barrier for water contamination of hydrogen. The pressure regulator maintains hydrogen pressure at 30 Bar gauge inside the electrolyser. To reach the hydrogen purity target continuously, hydrogen is vented for several minutes during start up.
Due to the permeability of the membrane, the produced gas can cross over from anode to cathode side and vice-versa. This gas permeation involves the presence of oxygen in hydrogen, which is the main source of oxygen contamination during operation. Considering that the rate of oxygen permeation is a function of the applied current [28], maintaining a minimum hydrogen production rate limits the maximum concentration of oxygen in hydrogen (and hydrogen in oxygen concentration). Moreover, stack conception and the chemical composition of the membrane electrode assembly help to reduce gas crossover through the membrane. It is constant for a specific electrolyser, and the permeation rate is diluted in the hydrogen production.

2.2. Probability of Contaminant Occurrence—Risk Assessment Method

The evaluation of the risk of noncompliance to the hydrogen fuel quality requirements should be based on scientific knowledge and ultimately link to the protection of the fuel cell stack. The approach used in the study followed the principles of ISO 19880-8 [18], EN 17124:2019 [29] and an example from literature [19]. To clearly define the probability of occurrence, two questions were used:
  • Possible failures: which events can cause the impurities to be above the threshold value?
  • What is the likelihood that impurities can be above the threshold value?
In this study, only the probability of contaminant occurrence was studied for the electrolyser production method using seawater. The consequence (severity) for the fuel cell stack was not considered as it requires additional study to understand the severity of new compounds identified in the study. For each contaminant of the ISO 14687:2019 specification and any new contaminant identified, a dedicated risk assessment was carried out. The objective was to identify the probability of occurrence to have each contaminant above the threshold values of the specifications given in ISO 14687 [17] in the hydrogen at the end of the production process. The possible cause of contaminant was established compound per compound, based on the technical knowledge of the process. It also considered the existing barriers in the current process and online analysis in the process (i.e., conductivity measurement)
For the probability of occurrence of the event: impurities in hydrogen exceeding the threshold value, Table 1 summarizes the five levels of occurrence classes defined in the study.
A link between the occurrence or frequency and the occurrence in hydrogen refuelling was made to provide an estimate of the event frequency for fuel cell users. In performing an effective risk assessment, the robustness of the data set is important because it determines the quality of the output. Revealing assumptions and reasonable sources of uncertainty will enhance confidence in this output and/or help identify its limitations. The output of the contaminant probability of its presence is a qualitative description of a range of occurrence.
A previous study [19] provided an example of the probability of occurrence of contaminant from a water PEMWE model considering purified tap water as the feed. In this study, the water PEM electrolyser was considered functioning in normal conditions, steady state. The risk assessment also considers any impurities that could arise via the electrolysis process using PEM electrolysis fed with purified seawater.
The water purification system is one of the key aspects of the risk assessment exercise. The seawater composition varies depending on the ship’s location, it is important to consider spot contamination and potential breakthrough in the water purification system. The types of contamination considered are oil contamination, antifouling agents, biocides, biological materials or small particles. Even if these contaminants are not part of ISO 14687’s list of contaminants, it would be important to consider them in the risk assessment and link the probability of their presence to the vessel routes (i.e., contaminated areas on the route, harbour location, spillage event).

2.3. Sample Analysis

2.3.1. Hydrogen Gas Analysis from Energy Observer

Hydrogen sampling was performed at the hydrogen storage pressurised tank of the Energy Observer ship. Samples were taken into four cylinders provided by NPL. They were filled by the same hydrogen process and considered collectively as the energy observer sample. The cylinders provided by NPL were 10 L aluminium cylinder with SPECTRA-SEAL treatment (BOC, UK) evacuated below 10−5 mbar. The sampling cylinders were filled to 21 bar by direct transfer from the hydrogen storage pressurised tank. The samples were analysed within one month after arrival to NPL.
The National Physical Laboratory (NPL, UK) is a national metrology laboratory and has developed analytical methods to measure the hydrogen fuel contaminants listed in ISO 14687. The analyses were performed for the following compounds: N2, O2, Ar, CO, CO2, CH4, nonmethane hydrocarbons (NMHC), total sulphur, halogenated compounds, ammonia, formaldehyde, formic acid, H2O, He, ions (ammonium ion, sodium ion, calcium ion, nitrate ion, magnesium ion, potassium ion, lithium ion, chloride ion) and trace elements (Si, P, Al, B, Be, Sc). The analytical methods used were NPL internal methods and accredited ISO 17025 methods for the following contaminants (N2, O2, Ar, CO, CO2, CH4, NMHC, total sulphur, H2O, He). All analyses were calibrated using NPL gravimetric gas standards in hydrogen matrix gas. Gravimetric standards and/or dynamic standards (prepared by dilution using mass flow controller system (Bronkhorst, NL)) were used to generate calibration curve ranges covering the EN 17,124 and ISO 14687 thresholds and the measured values (as long as it is above the limit of detection). The data was scrutinised; however, no result was discarded without a technical reason. Trace elements and ion analysis was performed after the gas passed through an impinger system. Then the impinger water was analysed inductively by coupled plasma mass spectrometry (ICP-MS) and ion chromatography (IC). The calibration curve, results of analysis and associated uncertainties were determined using NPL software XLGENline [30]. An expanded uncertainty was provided with 95% confidence level. In some cases, a more conservative uncertainty was derived from scientific experience. Detailed information about the analytical methods is provided in Supplementary Materials.

2.3.2. Water Analysis

A sample of water was taken from the water tank of the Energy Observer ship into a 250 mL polyethylene bottle. The water sample was stored at 4 °C until analysis. The analysis was done less than 2 weeks after reception at NPL. Trace elements and ions analysis were performed by ICP-MS and IC. The ion chromatography analysis results are traceable to NPL’s calibration solutions, which are gravimetrically prepared using traceable certified reference materials.

3. Results

3.1. Probability of Occurrence

3.1.1. Contaminants Known to Impact PEMFC Performance (ISO 14687)

Based on the model described in Figure 1, Figure 2 and Figure 3, the probability of contaminant occurrence for the onboard Energy Explorer ship electrolyser system is discussed in this section for each relevant contaminant. Several contaminants (helium, methane, carbon monoxide) are not discussed as they are expected to be completely absent from the production process. Contaminants with a probability of presence of very unlikely (ammonia, argon, formaldehyde, formic acid and total hydrocarbons) are not detailed in this section but in the additional material 1.
Nitrogen: Four sources of nitrogen were identified: (i) air dissolved in seawater, (ii) air intake, (iii) pure nitrogen/air used as a purging/inerting/actuating gas and (iv) nitrate in water converted to nitrogen at the electrolyser. The presence of dissolved air in the seawater or an air intake in the water pretreated in a plastic tank (air exchange) are considered as two sources of nitrogen. The equilibrium concentration of dissolved nitrogen in water at ambient temperature (25 °C) and atmospheric pressure (1 atm), calculated using Henry’s Law [31], is around 14 mg/L (equivalent to 6–7 µmol/mol). As the nitrogen threshold in ISO 14687 is 300 µmol/mol, dissolved nitrogen is not sufficiently abundant to allow 300 µmol/mol in the hydrogen gas. Gases are known to routinely cross over the PEM within the electrolyser, however, this is rather unlikely to reach the ISO 14687 threshold due to the very low concentration of dissolved nitrogen. The presence of nitrate in the water used by the electrolyser is highly unlikely as the presence of a mixed bed resin filtration and online conductivity measurement set at a low threshold were considered sufficient to set the occurrence of nitrogen from this nitrate presence to extremely low. It requires a double failure of the conductivity measurement and the resin exchange filtration to allow nitrate in the water intake of the PEM electrolyser.
Nitrogen or air are commonly used to actuate pneumatic valves. Any leakage of air or nitrogen from the valve may become a source of nitrogen in the hydrogen gas. However, it was considered unlikely as it would be an issue for the process and detected by the pneumatic valve monitoring. The last possible source is insufficient purging after a maintenance operation leading to contamination of the hydrogen in the system. Maintenance should be carried out by trained staff following specific procedures; however, this is perceived as a possible occurrence. Therefore, the probability of occurrence of nitrogen was set to 2.
Carbon dioxide: Several carbon dioxide sources can be found in the process: (i) dissolved CO2 in seawater, (ii) oxidation of carbon-based impurities into CO2 and (iii) air intake in the onboard plastic tank. The high potential of the anode in the PEMWE is capable of electrochemically oxidising organics into CO2 [28]. The generation of CO2 in the electrolyser due to other impurities would require a significant amount of organic carbon in the purified water. The different purification steps involved in the system are enough of a barrier to reduce the total organic carbon to a level below 1 µmol/mol. All dissolved CO2 found in the seawater passes the membrane to the permeate (around 0.5 µmol/mol). As soon as this water is dispensed into a vessel (i.e., onboard plastic tank) it may come into contact with air. The oxygen and nitrogen contents do not change significantly but CO2 may rapidly be absorbed from the air. Like other gases, CO2 passes unaltered through filters. The actual fraction of dissolved CO2 will vary based on different water parameters (i.e., pH, equilibrium with air, pressure) and due to the possible appearance of bicarbonate and carbonate ions. However, the estimation of dissolved CO2 was considered below 1 µmol/mol in the water which is lower than the ISO 14687 threshold. The presence of carbonate ions can, in effect, be retained on anion exchange resins, therefore, their contribution in increasing the level of dissolved CO2 may be low. Therefore, the conductivity measurement can be used as a barrier to detect a high content of CO2 due to the presence of carbonate ions. Therefore, the probability of occurrence of carbon dioxide above ISO 14687 was set to unlikely and 1.
Oxygen: Four sources of oxygen were investigated: (i) oxygen dissolved in seawater, (ii) air intake, (iii) pure air used as purging/inerting/actuating gas and (iv) electrolyser. The presence of dissolved air in the seawater or air intake in the water pretreated in the plastic tank (air exchange) are considered as sources of oxygen. The concentration of dissolved oxygen in water at ambient temperature is around 8.9 mg/L using Henry Laws. The PEM membrane (low crossover through the membrane) was considered as a last existing barrier leading to the probability of occurrence of oxygen above ISO 14687 to be unlikely from this source. A leakage of air from the pneumatic valve may be a source of oxygen in the hydrogen gas. However, it was considered very unlikely as it would be an issue for the process and would be detected on the pneumatic valve monitoring. The main sources of oxygen in the hydrogen may be the electrolyser process itself. Compared to dissolved oxygen in water that come from various sources, the majority of oxygen comes from the anode compartment where water is split into oxygen and protons. It is widely known that oxygen may cross over into the anode side during operation. Up to 0.1 vol.% of O2 was reported in the hydrogen gas when a lab-scale PEM electrolyser was operated using a Nafion 117 membrane [32]. The membrane employed on the Energy Observer uses a recombination catalyst embedded within the membrane to mitigate gas crossover. The recombination catalyst, typically Pt based, works by recombining H2 and O2 chemically into water. The concept has been shown to effectively mitigate H2 crossover into the anode chamber [33] and also works the other way around in preventing O2 contaminating the hydrogen gas. In addition, the cathode chamber is operated at elevated pressure, further reducing the likelihood of O2 contamination through membrane crossover. It should be noted that different electrolyser manufacturers may employ a different strategy and choose a membrane with no recombination catalyst inside. In this case, an external purification system, such as pressure swing adsorption (PSA) is implemented. Oxygen presence above ISO 14687 is considered possible and set to class 2.
Water: Water is a reactant in the electrolysis process that is typically supplied at the anode side only. Four possible sources of water in the hydrogen produced were considered: (i) permeation through the PEM membrane due to electro-osmosis and diffusion, (ii) oxygen conversion into water, (iii) hydrogen water saturated and (iv) hydrogen drying malfunction. Out of the four, water permeation through the membrane plays the most prominent role. Electro-osmosis drag takes place when water is transported along with the proton from the anode to the cathode. The dragged water will be higher at high current density and high temperature [34]. Even if there are several sources of water contamination, the presence of a PSA and a dew point hygrometer (with set point at −65 °C dew point) represents a significant barrier to avoid the presence of water above 5 µmol/mol in hydrogen. Finally, the procedure may ensure venting of gas production after restart (time of venting depend on the installation) to avoid ambient water still present in the pipeline. Following these reasons, water was considered unlikely and set to class 1. The system is not cooling hydrogen for fast refuelling therefore the impact of water on the fuel cell system needs to be reconsidered for this application compared to ISO 14687 and ISO 19880-8 guidelines.
Total sulphur components (includes sulphate ions): Even if the presence of sulphur compounds is unlikely in a conventional PEM water electrolyser, the use of seawater as a raw material needs to be investigated. Sulphate ions from seawater (2639 mg/kg) [35] are some of the most abundant ions in seawater and a preponderant source of sulphur. It would contribute to the overall total sulphur fraction against a target threshold set at 4 nmol/mol. To mitigate this risk, the prefiltration prior to reverse-osmosis, together with the desalination itself and finally the resin filtration are considered barriers to most ions. The conductivity measurement (with alarm if conductivity is above 0.5 µS/cm) is the last barrier to ensure that the fraction of ions is at nmol/mol level when reaching the electrolyser. Another source of sulphur compound is correlated with material gaskets or valve seats. If the material is not correctly selected, a release of nmol/mol of sulphur could contaminate the hydrogen. To avoid this, the selection of the material should exclude any sulphur-containing material. The probability of occurrence of sulphur compounds in the hydrogen was set to possible (2) due to the lack of technical evidence and the prevalence of sulphate ions in the seawater. Despite technical evidence that sulphates may not be harmful to fuel cells, it would be part of the total sulphur budget as defined in the ISO 14687 requirements. Further studies may lead to a change in the total sulphur budget. As it is required to demonstrate that the total sulphur content is below the ISO 14687 threshold, therefore the probability of occurrence is set to possible (2) but could be decreased to very unlikely (0) based on technical evidence.
Halogen and chloride ions: One of the main potential contaminant sources is the seawater composition. Chloride ions make up the largest proportion of salts dissolved in seawater (around 19 g/kg of Cl). The prefiltration prior to reverse-osmosis, together with the desalination itself and finally the resin filtration are considered barriers to most ions. The conductivity measurement is the last barrier to ensure that the fraction of ions is at nmol/mol level when reaching the electrolyser. At the anode of the electrolyser, chloride ions can be oxidised through a side reaction into Cl2. The generated chlorine gas can easily permeate into the hydrogen side and contaminate the hydrogen which may contribute to key halogenated hydrocarbons. As a high fraction of Cl2 could damage the fuel cell stack [36], it is critical to ensure that sufficient barriers are present to avoid key halogenated (chlorine basis) to be over 50 nmol/mol (ISO 14687). Considering the conductivity measurement threshold, it is expected that the ion fraction would be below µmol/L. However, the chlorine ion crossover of the membrane is difficult to estimate, therefore, the probability of occurrence of chlorine ions in the hydrogen was set to unlikely (value of 1) due to the lack of technical evidence and their prevalence in the seawater. For organo-halogenated compounds that could be present in the seawater (pollution), the reverse osmosis purification unit is considered a sufficient barrier to consider the probability of occurrence to be zero.
Table 2 summarises the probability of occurrence of the ISO 14687 contaminants from an electrolyser using purified seawater onboard a ship like the Energy Observer.

3.1.2. Contaminant Originating from Seawater and Not Regulated in ISO 14687

In the evaluation of contaminant presence, additional contaminants not currently regulated in ISO 14687 were considered due to their presence in the seawater. As the contaminants are unregulated, the probability of presence is not based on internationally agreed thresholds but on assumptions. Table 3 summarises the findings for these contaminants originating from seawater.
Seawater compounds including sodium and inorganic carbon: One of the main potential contaminants of an electrolyser using purified seawater is the main composition of the seawater [23]. Chloride and sodium ions make up the largest proportion of salts dissolved in seawater (19,000 mg/kg of Cl and 10,500 mg/kg of Na+). Other ions are significantly present in seawater, such as magnesium ions (1300 mg/kg), calcium ions (400 mg/kg), potassium ions (380 mg/kg) or at lower amount fraction bromide (65 mg/kg), strontium (13 mg/kg), boron (5 mg/kg), fluoride (1.4 mg/kg) ions. Most of these ions are removed completely through the prefiltration prior to reverse-osmosis, desalination, and the ion exchange resin. The conductivity measurement is the last barrier to ensure that the fraction of ions is at nmol/mol level when reaching the electrolyser. Considering the existing ISO 14687, there is no precise requirement on ions except a recommendation linked to the water fraction in the annex of ISO 14687:2019 [17]. As long as the water fraction is maintained below the threshold of 5 µmol/mol, the transport mechanism for water-soluble contaminants such as K+ and Na+ when present as an aerosol would not allow the level of ions (i.e., K+, Na+) to exceed 50 nmol/mol [18]. Considering the conductivity measurement threshold, it is expected that the concentration of all the ionic compounds are below µmol/L level. For these reasons, the probability of the occurrence of ions in the hydrogen was set to very unlikely (0) except for Na+ set to unlikely (1), due to the lack of technical evidence and their prevalence in seawater. These probabilities may need to be revised based on technical evidence and the potential impact of some ions on the fuel cell system at a low fraction.
Inorganic carbon as carbonate (excluding CO and CO2): Inorganic carbon particulate present in seawater (30 mg/kg) would be expected to be removed in a prefiltration step that is required before desalination/reverse osmosis. Subsequently, any smaller particulate would be removed in the reverse-osmosis process. Therefore, the conductivity measurement can be used as a barrier to detect a high content of inorganic carbon due to the presence of carbonate ions. For these reasons, the probability of the occurrence of inorganic carbon in the hydrogen was set to very unlikely (0).
Contaminant originating from seawater: Another category of contaminant investigated were chemical compounds originating from seawater pollution. Three categories were considered as chemical contaminants in seawater (e.g., antifouling paints containing tributyltin (TBT)), biocides (copper salts), heavy metals (i.e., mercury, cadmium, lead), biological materials in seawater (sewage, plant/animal matter). Chemical contaminants in seawater were considered, especially antifouling paints (organotin tributyltin), biocides (copper salts). TBT paint has been prohibited since 2008, however, TBT still impacts some localised European coastal ecosystems [37]. Copper-based biocides have been the main alternative to TBT-paints [22]. Most of the biocides and booster biocides (i.e., Diuron) [22] are large complex metal-based molecules which would be filtered by the reverse osmosis systems, thin film and exchange resin. Most antifouling paints and biocide molecules have a mass above 200 Daltons and therefore, the probability of their presence is very unlikely and set to zero. Heavy metals are known to be present and could be found in seawater, however, they are often present in the colloidal phase or in solid form (i.e., particulate) [38]. The purification process will remove any molecule above 200 Daltons and therefore the probability of any heavy metal presence is very unlikely and set to zero. The presence of biological materials in seawater from various human activities (sewage, plant/animal matter). There are multiple examples of sea and ocean coastal areas contaminated by biological materials. Most of the biological materials will be in the form of large molecules that the prefiltration and the reverse osmosis would be expected to remove, due to the large molecular size of the biological materials.

3.1.3. Contaminants Originating from Seawater Purification

Antiscaling and antifouling inhibitors: antiscaling and antifouling inhibitors (i.e., acids, organic polymers, polyacrylamide, polymaleic acid, phosphonates, polyphosphates, biocides, ozone, sodium, calcium hypochlorite) were considered as a source of contamination from the purification system itself. It should be considered that it is part of the normal maintenance process of the purification system. So, adherence to the maintenance protocol should avoid the presence of any of these compounds. Most of these compounds are particulate and would not pass through the reverse osmosis or filters. It is recommended to rinse thoroughly the system after maintenance and ensure that a proper procedure is in place to define the length of rinsing prior to the use of the purified water. The conductivity measurement will provide a last barrier informing that the purification process is not functioning correctly. The probability of the presence of these compounds was set to very unlikely.
Filtration materials: The compounds from the filtration system as sodium polystyrene sulphonate or trimethylammonium groups (CH3)3NR+OH) have been considered but not expected to be present above the ISO 14687 threshold as long as maintenance is performed according to the filtration manufacturer’s recommendations. Therefore, the probability of the presence of these compounds was set to very unlikely.
Oil contaminants: The purification process and the compression process include a few compressors and pumps. The pump that provides the seawater into the system could potentially leak oil. In this situation, the leakage would be noticed due to process monitoring and the leakage would be tackled by the purification system (most oil compounds are above 200 Dalton). In this situation, the probability that oil contaminants would not be stopped by the purification filter is unlikely. Another potential contamination could be in the compression of the hydrogen produced by the electrolyser. The hydrogen is stored under pressure to minimise storage space. The compressor using oil may leak in a case of malfunction, maintenance issues or failure. This situation is unlikely as the process is monitored, the event may be considered as unlikely. Therefore, the probability of the presence of oil contaminant was set to unlikely (1).

3.2. Analytical Results

3.2.1. Purified Water Composition

The sample of purified water from a prototype system designed for onboard application was tested. Results for elemental compounds and ions are provided in Table 4. It can be noticed that none were quantified above detection limit except calcium, sodium, chloride and sulphate ions. The reported values were consistent with the conductivity of 0.5 µS/cm. The four ions quantified were consistent with seawater composition representing approximately 250 nmol/mol of ions in solution. Considering the guideline of 0.05 µmol/mol of ions in hydrogen reported in ISO 14687 [18], it would require the crossover of 50% of all chlorine ions or sodium ions in solution into the hydrogen gas to reach the guideline. Therefore, the ion crossover is a vital parameter to monitor, to avoid significant contamination of the hydrogen gas produced.
The results of the analysis clearly support the probability of presence of all ions (except sodium and chloride) to be defined as very unlikely (0). It was noticed that some elemental compounds had a higher limit of detection above 50 nmol/mol. It is recommended to continue monitoring the performance of the purification system by elemental analysis of the water produced especially for the four ions detected (sodium, calcium, sulphate and chloride ions). While it is not the scope of this work to evaluate electrolyser durability, it is of note that even 1 µmol/mol of cation has been reported to be able to degrade performance in a lab-scale electrolyser [39]. The longevity of the electrolyser on-board should be thoroughly investigated in future work, to assess whether this water quality is sufficient to sustain long maritime operations.

3.2.2. Hydrogen Quality after Compression

A sample of hydrogen produced by the onboard electrolyser fed by purified seawater was tested for quality by NPL. The hydrogen gas was tested for the contaminants mentioned in ISO 14687:2019. The results are presented in Table 5.
These results of the analysis demonstrate that the hydrogen produced onboard the pilot ship is compliant with the ISO 14687 standard. The level of oxygen, nitrogen, water and carbon dioxide are below the ISO 14687 threshold which is in coherence with the probability of occurrence “unlikely”. All the other compounds are below the detection limit as expected from the probability of occurrence exercise. It is important to note that the “total sulphur” fraction was below the detection limit and considered to be absent. These results tend to support a decrease in the sulphur probability of presence, however, further measurement may be required in a more polluted environment.
An interesting finding in Table 5 and Table 6 was the low fraction of halogenated compounds in the sampled hydrogen, while 223 ± 30 µg/L of chloride ions were present at the inlet of the water electrolyser. It would support the low cross over of chloride ions through the electrolyser membrane. Therefore, as long as the presence of Cl in the water stays within the conductivity limit, the ions may not be a concern for hydrogen fuel production.

4. Discussion—Perspective for Hydrogen Quality Monitoring

This study presents the first evaluation of contaminant presence from an electrolyser using purified seawater. The contaminants highlighted by the expert knowledge (Table 7) are coherent with the process and with the seawater and its purification system on the Energy Observer. The hydrogen fuel measurement showed that the hydrogen fuel produced was highly pure and coherent with the requirement of ISO 14687:2019. It tends to prove that some contaminants, such as total sulphur may be relaxed from the “possible” to “unlikely” probability. The additional contaminants (outside the ISO 14687 scope) considered were not observed at a significant fraction (below the analytical method limit of detection in most cases).
For future maritime applications, it is critical to understand the boundaries of this system (i.e., seawater purification limits), and any additional requirements to ensure the quality control of the hydrogen produced (i.e., sensors). This study has highlighted that nitrogen, oxygen and water needs specific attention (Table 7). Several contaminants (i.e., sulphur, due to local pollution) may require attention or additional process control (choosing the location of the seawater intake). Moreover, when considering maritime application, it is important to have a reliable sensor or analyser onboard to monitor some contaminants on a regular basis. It may be more complicated to manage failure or loss of performance while at sea compared to road transport. Currently, the conductivity and dewpoint sensor already onboard Energy Observer are routine control measures for quality monitoring of this type of system. Nitrogen, sulphur and oxygen sensors may need to be developed to allow control of the preponderant contaminants for this system.

5. Conclusions

This study demonstrated that an electrolyser using onboard purified seawater can generate hydrogen compliant with ISO 14687 quality standard and with fuel cell stack requirements. This study presents the first hydrogen quality measurement from an electrolyser using purified seawater on a ship (the Energy Observer). The probability of contaminant presence was proposed based on the ISO 19880-8 guidelines in order to define the quality control requirements for the process. It highlights the fact that few contaminants need monitoring or additional barriers (nitrogen, oxygen, water and total sulphur) and with lower importance (carbon dioxide, oil contamination and chloride ions). This study demonstrates that the current system on the Energy Observer is providing hydrogen fuel compliant to ISO 14687:2019 and may not require complex quality monitoring.
To further progress the hydrogen as a fuel for maritime application, it may be interesting to investigate the potential impact and presence from contaminants not currently listed in the ISO 14687 standards. The study highlights the fact that seawater may contain contaminants currently unregulated and not studied as anion, cations or heavy metals. While it is not the scope of this work to evaluate the electrolyser’s durability, it is of note that even 1 ppm of cation has been reported to be able to degrade performance in a lab-scale electrolyser.
Another important aspect related to the use of seawater is its variability in composition and contamination. It is important to realize that local contamination due to human activity could significantly disturb the seawater purification system and could impact the final purity. It is, therefore, recommended to avoid using the seawater in the vicinity of large industrial areas, large cities or harbours, unless the impact is known.
Therefore, a future perspective would be to investigate the impact of new and known contaminants related to seawater, their transfer to the hydrogen in the electrolysis process, and if found at relevant levels, how they would impact the fuel cell performance and lifetime.

Supplementary Materials

The following are available online at https://0-www-mdpi-com.brum.beds.ac.uk/article/10.3390/pr9071252/s1, Additional material 1: Analytical methods–detailed information.

Author Contributions

Conceptualization of the study, T.B., V.M., J.O.; methodology, T.B., V.M., J.O.; Design of the seawater purification and electrolyser system: S.G., P.R.; formal analysis, T.B., N.M., R.W., S.B., A.S.O.M.; investigation, T.B., N.M., R.W., S.B., A.S.O.M., H.B.; data curation, T.B., A.M.; writing—original draft preparation, T.B., N.M., R.W., S.B.; writing—review and editing, T.B., N.M., R.W., S.B., A.S.O.M., J.O., H.B., T.A.A., S.G., P.R., A.M., V.M.; supervision, T.B., A.M., V.M. All authors have read and agreed to the published version of the manuscript.

Funding

This research project has received funding from the Fuel Cells and Hydrogen 2 Joint Undertaking under grant agreement No (779475). This Joint Undertaking receives support from the European Union’s Horizon 2020 research and innovation programme, Hydrogen Europe and Hydrogen Europe research.

Informed Consent Statement

Not applicable.

Data Availability Statement

The data presented in this study are available in this article.

Acknowledgments

The authors would like to acknowledge the Energy Observer for allowing the study to be done on their vessel and with their technical support.

Conflicts of Interest

The authors declare no conflict of interest. The funders had no role in the design of the study; in the collection, analyses, or interpretation of data; in the writing of the manuscript, or in the decision to publish the results.

References

  1. Transport & Environment. Mission (Almost) Accomplished. Available online: https://www.transportenvironment.org/sites/te/files/publications/2020_10_TE_Car_CO2_report_final.pdf (accessed on 25 February 2021).
  2. Staffell, I.; Scamman, D.; Velazquez Abad, A.; Balcombe, P.; Dodds, P.E.; Ekins, P.; Shah, N.; Ward, K.R. The role of hydrogen and fuel cells in the global energy system. Energy Environ. Sci. 2019, 12, 463–491. [Google Scholar] [CrossRef] [Green Version]
  3. Cames, M.; Graichen, J.; Siemons, A.; Cook, V. Emission Reduction Targets for International Aviation and Shipping, Direc-torate General for Internal Policies, IP/A/ENVI/2015-11; European Parliament: Brussels, Belgium, 2015. [Google Scholar]
  4. Smith, T.W.P.; Jalkanen, J.P.; Anderson, B.A.; Corbett, J.J.; Faber, J.; Hanayama, S.; O’Keeffe, E.; Parker, S.; Johansson, L.; Aldous, L.; et al. Third IMO GHG Study 2014; International Maritime Organization (IMO): London, UK, 2014. [Google Scholar]
  5. Communication from the Commission to the European Parliament. The European Council, The Council, The European Economic and Social Committee of the Regions the European Green Deal. COM/2019/640 Final. Available online: https://ec.europa.eu/info/sites/info/files/european-green-deal-communication_en.pdf (accessed on 11 August 2020).
  6. OECD Observer. Sea Fairer: Maritime Transport and CO2 Emissions. OECD Observer No 267, May–June 2008. Available online: https://oecdobserver.org/news/fullstory.php/aid/2600/Sea_fairer:_Maritime_transport_and_CO2_emissions.html (accessed on 26 June 2020).
  7. Antolini, A. Maritime Issues—Utilisation of LNG and Hydrogen as Fuel: The Decarbonising Challenge in Maritime Transport: Hydrogen Fuel Cells as a Ship Propulsion Option. JTTRI 2019. Available online: https://www.jttri.or.jp/document/2019/andrea55.pdf (accessed on 26 June 2020).
  8. Brandt, J.; Silver, J.D.; Frohn, L.M.; Christensen, J.H.; Andersen, M.S.; Bønløkke, J.H.; Sigsgaard, T.; Geels, C.; Gross, A.; Hansen, A.B.; et al. Assessment of Health-Cost Externalities of Air Pollution at the National Level Using the EVA Model System, CEEH Scientific Report No 3, Centre for Energy, Environment and Health Report Series, p. 96. Available online: www.ceeh.dk/CEEH_Reports/Report_3 (accessed on 25 May 2021).
  9. IEA. International Shipping; International Energy Agency: Paris, France, 2020; Available online: https://www.iea.org/reports/international-shipping (accessed on 25 May 2021).
  10. International Transport Forum. Decarbonising Maritime Transport: Pathways to zero-carbon shipping by 2035. Int. Transp. Forum Policy Pap. 2018. [CrossRef]
  11. Abbasov, F.; Earl, T.; Hemmings, B.; Calvo Ambel, C.; Hemmings, B.; Gilliam, L. Roadmap to Decarbonising European Shipping, Transport & Environment; European Federation for Transport and Environment AISBL: Brussel, Belgium, 2018; Available online: https://www.transportenvironment.org/sites/te/files/publications/2018_11_Roadmap_decarbonising_European_shipping.pdf (accessed on 25 May 2021).
  12. Hughes, E. Initial IMO GHG Strategy—Role of Alternative Fuels in Meeting the Ambition? Symposium on IMO 2020 and Alter-native Fuels IMO HQ, 18 October 2019. Available online: https://wwwcdn.imo.org/localresources/en/About/Events/Documents/Alternative%20fuels/2-1%20-%20Edmund%20Hughes_Symposium_18%20October%202019_rev.1.pdf (accessed on 26 February 2021).
  13. van Biert, L.; Godjevac, M.; Visser, K.; Aravind, P. A review of fuel cell systems for maritime applications. J. Power Sources 2016, 327, 345–364. [Google Scholar] [CrossRef] [Green Version]
  14. Energy Observer. Our Vessel. Available online: https://www.energy-observer.org/about/vessel (accessed on 26 May 2021).
  15. Becker, H.; Bacquart, T.; Perkins, M.; Moore, N.; Ihonen, J.; Hinds, G.; Smith, G. Operando characterisation of the impact of carbon monoxide on PEMFC performance using isotopic labelling and gas analysis. J. Power Sources Adv. 2020, 6, 100036. [Google Scholar] [CrossRef]
  16. Narusawa, K.; Hayashida, M.; Kamiya, Y.; Roppongi, H.; Kurashima, D.; Wakabayashi, K. Deterioration in fuel cell performance resulting from hydrogen fuel containing impurities: Poisoning effects by CO, CH4, HCHO and HCOOH. JSAE Rev. 2003, 24, 41–46. [Google Scholar] [CrossRef]
  17. International Organization for Standardization. ISO 14687:2019 Hydrogen Fuel—Product Specification—Part 2: Proton Exchange Membrane (PEM) Fuel Cell Applications for Road Vehicles; International Organization for Standardization: Geneva, Switzerland, 2019. [Google Scholar]
  18. International Organisation for Standardisation. ISO 19880-8:2019 Gaseous Hydrogen—Fuelling Stations—Part 8: Fuel Quality Control; International Organisation for Standardisation: Geneva, Switzerland, 2019. [Google Scholar]
  19. Bacquart, T.; Murugan, A.; Carré, M.; Gozlan, B.; Auprêtre, F.; Haloua, F.; Aarhaug, T.A. Probability of occurrence of ISO 14687-2 contaminants in hydrogen: Principles and examples from steam methane reforming and electrolysis (water and chlor-alkali) production processes model. Int. J. Hydrogon Energy 2018, 43, 11872–11883. [Google Scholar] [CrossRef]
  20. Toyota Europe Newsroom. Toyota Develops Specially Designed Fuel Cell System for Energy Observer’s 2020 Tour. Available online: https://newsroom.toyota.eu/toyota-develops-specially-designed-fuel-cell-system-for-energy-observers-2020-tour/ (accessed on 26 May 2021).
  21. European Commission. Contaminants in the Marine Environment. Available online: https://ec.europa.eu/environment/marine/good-environmental-status/descriptor-8/index_en.htm (accessed on 25 May 2021).
  22. Tornero, V.; Hanke, G. Chemical contaminants entering the marine environment from sea-based sources: A review with a focus on European seas. Mar. Pollut. Bull. 2016, 112, 17–38. [Google Scholar] [CrossRef]
  23. Mackenzie, F.T.; Bryne, R.H.; Duxbury, A.C. Seawater, Encyclopᴂdia Britannica. 2018. Available online: https://www.britannica.com/science/seawater (accessed on 25 May 2021).
  24. Rakousky, C.; Reimer, U.; Wippermann, K.; Kuhri, S.; Carmo, M.; Lueke, W.; Stolten, D. Polymer electrolyte membrane water electrolysis: Restraining degradation in the presence of fluctuating power. J. Power Sources 2017, 342, 38–47. [Google Scholar] [CrossRef]
  25. Siracusano, S.; Hodnik, N.; Jovanovic, P.; Ruiz-Zepeda, F.; Šala, M.; Baglio, V.; Aricò, A.S. New insights into the stability of a high performance nanostructured catalyst for sustainable water electrolysis. Nano Energy 2017, 40, 618–632. [Google Scholar] [CrossRef]
  26. Sun, S.; Shao, Z.; Yu, H.; Li, G.; Yi, B. Investigations on degradation of the long-term proton exchange membrane water electrolysis stack. J. Power Sources 2014, 267, 515–520. [Google Scholar] [CrossRef]
  27. Feng, Q.; Yuan, X.; Liu, G.; Wei, B.; Zhang, Z.; Li, H.; Wang, H. A review of proton exchange membrane water electrolysis on degradation mechanisms and mitigation strategies. J. Power Sources 2017, 366, 33–55. [Google Scholar] [CrossRef]
  28. Trinke, P.; Bensmann, B.; Hanke-Rauschenbach, R. Experimental evidence of increasing oxygen crossover with increasing current density during PEM water electrolysis. Electrochem. Commun. 2017, 82, 98–102. [Google Scholar] [CrossRef]
  29. European Committee for Standardization. EN 17124:2018. Hydrogen Fuel—Product Specification and Quality Assurance—Proton Exchange Membrane (PEM) Fuel Cell Applications for Road Vehicles; European Committee for Standardization: Brussels, Belgium, 2018. [Google Scholar]
  30. Smith, I.M.; Onakunle, F.O. SSfM-3 1.6.1—XLGENLINE, Software for Generalised Least-Squares Fitting, Developed by the (NPL), Teddington, UK, NPL Document Reference: CMSC/M/06/657; National Physical Laboratory: Teddington, London, UK, 2007. [Google Scholar]
  31. Sander, R. Compilation of Henry’s law constants (version 4.0) for water as solvent. Atmos. Chem. Phys. 2015, 15, 4399–4981. [Google Scholar] [CrossRef] [Green Version]
  32. Ju, H.; Badwal, S.; Giddey, S. A comprehensive review of carbon and hydrocarbon assisted water electrolysis for hydrogen production. Appl. Energy 2018, 231, 502–533. [Google Scholar] [CrossRef]
  33. Klose, C.; Trinke, P.; Böhm, T.; Bensmann, B.; Vierrath, S.; Hanke-Rauschenbach, R.; Thiele, S. Membrane Interlayer with Pt Recombination Particles for Reduction of the Anodic Hydrogen Content in PEM Water Electrolysis. J. Electrochem. Soc. 2018, 165, F1271–F1277. [Google Scholar] [CrossRef]
  34. Onda, K.; Murakami, T.; Hikosaka, T.; Kobayashi, M.; Notu, R.; Ito, K. Performance Analysis of Polymer-Electrolyte Water Electrolysis Cell at a Small-Unit Test Cell and Performance Prediction of Large Stacked Cell. J. Electrochem. Soc. 2002, 149, A1069–A1078. [Google Scholar] [CrossRef]
  35. Dittmar, W. Report on researches into the composition of oceanwater, Collected by H.M.S. Challenger. Chall. Repts. Phys. Chem. 1884, 1, 1–251. [Google Scholar]
  36. Unnikrishnan, A.; Janardhanan, V.M.; Rajalakshmi, N.; Dhathathreyan, K.S. Chlorine-contaminated anode and cathode PEMFC-recovery perspective. J. Solid State Electrochem. 2018, 22, 2107–2113. [Google Scholar] [CrossRef]
  37. Sousa, A.A.; Ikemoto, T.; Takahashi, S.; Barroso, C.; Tanabe, S. Distribution of synthetic organotins and total tin levels in Mytilus galloprovincialis along the Portuguese coast. Mar. Pollut. Bull. 2009, 58, 1130–1138. [Google Scholar] [CrossRef]
  38. Guo, L.; Santschi, P.H.; Ray, S.M. Metal partitioning between colloidal and dissolved phases and its relation with bioavailability to American oysters. Mar. Environ. Res. 2002, 54, 49–64. [Google Scholar] [CrossRef]
  39. Li, N.; Araya, S.S.; Kær, S.K. Long-term contamination effect of iron ions on cell performance degradation of proton exchange membrane water electrolyser. J. Power Sources 2019, 434, 226755. [Google Scholar] [CrossRef]
Figure 1. Schematic of the hydrogen production, storage and use on the Energy Observer vessel.
Processes 09 01252 g001
Figure 2. Schematic of the seawater purification system from seawater down to deionised water used to feed the PEMWE. An approximative conductivity value is presented for each step of the processes.
Processes 09 01252 g002
Figure 3. Simplified scheme of electrolyser device including main components.
Processes 09 01252 g003
Table 1. Definition of the occurrence or frequency for the probability of contaminant occurrence.
Occurrence ClassClass NameOccurrence or Frequency
0Very unlikely (Practically impossible)Contaminant above threshold never been observed for this source/supply chain/station
1UnlikelyKnown to occur at least once for this source/supply chain/station
2PossibleHas happened once a year for this source/supply chain/station
3LikelyHas happened more than once a year for this source/supply chain/station
4Very likelyHappens on a regular basis for this source/supply chain/station
Table 2. Probability of occurrence of ISO 14687 contaminants in hydrogen produced from onboard electrolyser using purified seawater. Some probabilities proposed may be changed based on technical evidence.
ContaminantThreshold
[µmol/mol]
Possible CauseExisting BarrierProbability
Nitrogen300Air dissolved in sea water
Leak at electrolyser
Air intake into water tank
PEM membrane crossover
H2 pressure > air pressure
Operational procedure
2
Argon300Possibly presence from air dissolved in seawater
Leak at electrolyser
PEM membrane crossover
H2 pressure > air pressure
Operational procedure
0
Helium300Not expected to be present 0
Methane100Not expected to be present 0
Oxygen5Generated at anode
Membrane crossover
Air dissolved in sea water
Leak at electrolyser
H2 pressure > air pressure
Pt particle convert O2 in H2O
Operational procedure
2
Carbon dioxide2Air dissolved in sea water
Leak at electrolyser
Air intake into water tank
reverse osmosis, ion exchange membrane, conductivity measurement
PEM membrane
1
Carbon monoxide0.2Not expected to be present 0
Water5Reactant, through PEM membraneOperating procedure2
Sulfur0.004Material (gasket, seal)
Seawater composition
Material choice
Desalination, reverse osmosis
2 *
Ammonia0.1Water on anodic side
Local seawater pollution
Reverse osmosis, PEM membrane0 **
Total hydrocarbons2Local seawater pollutionReverse osmosis, PEM membrane0 **
Formaldehyde0.2Not expected to be present
Local seawater pollution
Reverse osmosis
PEM membrane
0 **
Formic acid0.2Not expected to be present 0
Halogens0.05Water at anodic sideReverse osmosis, water purification0
chloride ions0.05Seawater compositionReverse osmosis, water purification1 *
* probability may be reduced based on technical evidence and measurements; ** avoid using water for the electrolyser when reaching known contaminated water area (i.e., industrial regions, harbours) until further evidence available.
Table 3. Probability of occurrence of seawater contaminants in the hydrogen produced from onboard electrolyser using purified seawater.
ContaminantThreshold
[µmol/mol]
Possible CauseExisting BarrierProbability
Ions (including sodium and heavy metal)0.05Seawater compositionReverse osmosis
Anion exchange
Conductivity measurement
0
Or
1 (for sodium)
Chemical contaminant (antifouling paints, biocides)n.a.Human contamination and aquaculture
Purification system
Reverse osmosis
Anion exchange
Conductivity measurement
0
Heavy metaln.a.Industrial contaminationReverse osmosis
Anion exchange
Conductivity measurement
0
Biological materialn.a.Sewage, plant/animal materialMaintenance of the purification system
Filter
Reverse osmosis
Anion exchange
0
Table 4. Results of analysis of ions and elemental compounds from purified seawater before use in the electrolyser. (1) Other chemical elements include V, Cr, Mn, Fe, Co, Ni, Cu, Zn, Ga, Ge, As, Se, Br, Rb, Sr, Zr, Nb, Mo, Ru, Rh, Pd, Ag, Cd, In, Sn, Sb, Te, I, Cs, Ba, La, Ce, Pr, Nd, Sm, Eu, Gd, Tb, Dy, Ho, Er, Tm, Yb, Lu, Hf, Ta, W, Re, Os, Ir, Pt, Au, Hg, Tl, Pb, Bi, Th, U.
Chemical ElementMeasured ValueUnits
Si<20mg/L
P<20µg/L
Al, B<200µg/L
Ammonium ion<50µg/L
Sodium ion122 ± 17µg/L
Calcium ion85 ± 30µg/L
Nitrate ion<50µg/L
Magnesium ion<50µg/L
Potassium ion<50µg/L
Lithium ion<50µg/L
Chloride ion223 ± 30µg/L
Be, Sc, Zn, Fe<3.0µg/L
Sulfate ion26 ± 7µg/L
Other chemical elements (1)<1.0µg/L
Table 5. Results of hydrogen gas quality from ship onboard electrolyser according to ISO 14687:2019 list of contaminants.
CompoundMeasured ValueUnits
Nitrogen4.59 ± 0.11µmol/mol
Helium<10µmol/mol
Argon<1.0µmol/mol
Oxygen0.60 ± 0.10µmol/mol
Water<0.6µmol/mol
Nonmethane hydrocarbons<50nmol/mol
Carbon dioxide<30nmol/mol
Methane<25nmol/mol
Carbon monoxide<30nmol/mol
Formic acid<30nmol/mol
Ammonia<30nmol/mol
Formaldehyde<10nmol/mol
Total halogenated compounds<37nmol/mol
Individual organo-halogenated compounds<4nmol/mol
Total sulphur compounds<1.2nmol/mol
Table 6. Results of elemental analysis from hydrogen gas. The hydrogen was passed through a filter that was then analysed for chemical elements. (1) Other chemical elements include V, Cr, Mn, Fe, Co, Ni, Cu, Zn, Ga, Ge, As, Se, Br, Rb, Sr, Zr, Nb, Mo, Ru, Rh, Pd, Ag, Cd, In, Sn, Sb, Te, I, Cs, Ba, La, Ce, Pr, Nd, Sm, Eu, Gd, Tb, Dy, Ho, Er, Tm, Yb, Lu, Hf, Ta, W, Re, Os, Ir, Pt, Au, Hg, Tl, Pb, Bi, Th, U.
ComponentMeasured ValueUnits
Si<20µmol/mol
P<0.5µmol/mol
Al, B<0.20µmol/mol
Ammonium ion<60nmol/mol
Sodium ion<50nmol/mol
Calcium ion<50nmol/mol
Nitrate ion<50nmol/mol
Magnesium ion<40nmol/mol
Potassium ion<30nmol/mol
Lithium ion<50nmol/mol
Chloride ion<20nmol/mol
Be, Sc<10nmol/mol
Sulfate ion<4.0nmol/mol
Other chemical elements (1)<1.0nmol/mol
Table 7. Summary of contaminant presence in the PEMWE using purified seawater onboard Energy Observer.
Probability of Contaminant PresencePEM water Electrolysis Process with TSA
Very LikelyNone identified
LikelyNone identified
PossibleN2, O2 and H2O, sulphur compounds *
UnlikelyCO2, oil contaminant, chloride and sodium ions
Very unlikelyHe, Ar, CO, CH4, CH2O, CH2O2, NH3, hydrocarbons compounds, organo-halogenated compounds
* total sulphur may be relaxed from the “possible” to “unlikely” probability based on analytical results.
Publisher’s Note: MDPI stays neutral with regard to jurisdictional claims in published maps and institutional affiliations.

