Article

Rapid, Sensitive, and Sustainable Reversed-Phase HPTLC Method in Comparison to the Normal-Phase HPTLC for the Determination of Pterostilbene in Capsule Dosage Form

1
Department of Pharmacognosy, College of Pharmacy, Prince Sattam Bin Abdulaziz University, P.O. Box 173, Al-Kharj 11942, Saudi Arabia
2
Department of Pharmaceutics, College of Pharmacy, King Saud University, P.O. Box 2457, Riyadh 11451, Saudi Arabia
3
School of Pharmacy, Alkarim University, Katihar 854106, Bihar, India
4
Nano Drug Delivery®, Raleigh-Durham, Durham, NC 27705, USA
*
Author to whom correspondence should be addressed.
Submission received: 28 June 2021 / Revised: 21 July 2021 / Accepted: 26 July 2021 / Published: 28 July 2021
(This article belongs to the Special Issue Pharmaceutical and Biomedical Analysis)

Abstract

:
The greenness evaluation of literature analytical methods for pterostilbene (PT) analysis was not performed. Accordingly, the rapid, sensitive, and green/sustainable reversed-phase high-performance thin-layer chromatography (RP-HPTLC) method was developed and compared to the normal-phase (NP)-HPTLC (NP-HPTLC) for the estimation of PT with a classical univariate calibration. The RP quantification of PT was performed using green solvent systems; however, the NP analysis of PT was performed using routine solvent systems. The PT was detected at 302 nm for both of the methods. The greenness scores for the current analytical assays were evaluated by the analytical GREEnness (AGREE) metric approach. The classical univariate calibration for RP and NP methods indicated the linearity range as 10–1600 and 30–400 ng band−1, respectively. The RP method was more reliable for PT analysis compared to the NP method. The PT contents in commercial capsule dosage form were found to be 100.84% using the RP method; however, the PT contents in commercial capsule dosage form were determined as 92.59% using the NP method. The AGREE scores for RP and NP methods were 0.78 and 0.46, respectively. The sustainable RP-HPTLC assay was able to detect PT in the presence of its degradation products, and hence it can be considered as a selective and stability-indicating method. Accordingly, the RP-HPTLC method with univariate calibration has been considered as a superior method over the NP-HPTLC method for PT analysis.

1. Introduction

Natural polyphenolic compounds are potent antioxidants, which have a vital role in the prophylaxis and management of several diseases [1,2]. Pterostilbene (PT) is one of the polyphenolic compounds [3]. It has been found in several plants and fruits but is mainly isolated from Pterocarpus marsupium [3,4,5]. In the Indian traditional system of medicine, PT has been used in the treatment of diabetes and hypertension [6]. It showed diversified therapeutic activities in literature, which includes antioxidant [7,8], anti-inflammatory [8], antitumor [8,9], antidiabetic [10], cardioprotective [11], and neuroprotective [12], etc. The quality control and standardization of PT in its commercial polyherbal formulations are important due to its diversified therapeutic activities.
Various pharmaceutical assays have been applied for the qualitative and quantitative estimation of PT in medicinal plants, pharmaceutical products, commercial polyherbal formulations, and physiological fluids [13,14,15,16,17,18,19,20,21,22,23]. Some ultra-violet (UV) spectrophotometry-based assays were used for the quantification of PT in its plant/pharmaceutical-based products [13,14]. Various high-performance liquid chromatography (HPLC)-based assays have also been developed and validated for the quantification of PT in plant extracts, food products, pharmaceutical products, and wine samples [15,16,17]. HPLC-based assays were also applied for the determination of PT in biological samples [18,19]. An ultra-fast liquid chromatography (UFLC)-based assay is also established for PT analysis in its commercial capsule dosage form [20]. Some ultra-performance liquid chromatography-tandem mass spectrometry (UPLC-MS)-based assays were developed and validated for the analysis of PT in rat plasma along with other bioactive compounds [21,22]. A high-performance thin-layer chromatography (HPTLC) technique had also been reported for PT analysis in Ayurvedic antidiabetic plants [23].
Based on literature analytical methods of PT, it has been found that the various analytical methods are established for the estimation of PT in the variety of sample matrices [13,14,15,16,17,18,19,20,21,22,23]. Nevertheless, the greenness score of reported analytical methods was not taken into consideration. Nowadays, the analytical assays related to the green analytical chemistry (GAC) or environmental-friendly analytical techniques are increasing markedly for the determination of naturally derived phytopharmaceuticals [24,25,26,27,28,29]. Various metric approaches are established for the prediction of greenness profiles of pharmaceutical analytical techniques [30,31,32,33,34]. Among these approaches, only the analytical GREEnness (AGREE) approach includes all 12 principles of GAC for the evaluation of the greenness profile [32]. Accordingly, AGREE metric approach was applied for the greenness evaluation of present reversed-phase (RP)-HPTLC (RP-HPTLC) and normal-phase (NP)-HPTLC (NP-HPTLC) methods [32].
Therefore, the present work was an attempt to develop and validate a rapid, sensitive, and sustainable RP-HPTLC-based assay in comparison to the NP-HPTLC-based assay for the determination of PT in its commercial capsule dosage form. The present RP and NP spectrodensitometry assays for the quantitation of PT were validated in terms of various validation parameters, including linearity, system suitability parameters, accuracy, precision, robustness, sensitivity, selectivity, and specificity/peak purity as per the International Council for Harmonization for the Technical Requirements for Pharmaceuticals for Human Use (ICH) Q2 (R1) guidelines [35].

2. Materials and Methods

2.1. Materials

The working standard of PT and different reagents such as hydrochloric acid (HCl), sodium hydroxide (NaOH), and hydrogen peroxide (H2O2) were obtained from Sigma-Aldrich (St. Louis, MO, USA). HPLC-grade chloroform (CHCl3), methanol (MeOH), and ethanol (EtOH) were obtained from E-Merck (Darmstadt, Germany). Water (H2O) used in the study was deionized water, which was obtained from a Milli-Q unit. PT commercial capsules were procured from the pharmaceutical shop in Al-Kharj, Saudi Arabia.

2.2. Analysis and Chromatography

For the analysis of PT using the current analytical techniques, the chromatography and analytical conditions included in supplementary Table S1 were used.

2.3. Univariate Calibration Plot for PT

The weighed amount of PT (10 mg) was dispensed in 100 mL of MeOH to obtain 100 μg mL−1 stock solution of PT. This stock solution was diluted again with MeOH to obtain PT concentrations in the 10–1600 ng band−1 range and 30–400 ng band−1 range for the sustainable RP and routine NP assays, respectively. The prepared solutions of PT were applied to RP-plates for the sustainable RP spectrodensitometry assay and NP-plates for routine NP spectrodensitometry assay. The peak area for PT was recorded at each concentration using RP and NP spectrodensitometry assays. In the present work, a single analyte, i.e., PT, was quantified, and therefore a classical univariate calibration plot was used for the estimation of PT [36,37]. The classical univariate calibration plot for PT was constructed by plotting its concentrations against peak area. The univariate calibration plot of PT for the sustainable RP assay was recorded in the 10–1600 ng band−1 range; however, the univariate calibration curve of PT for routine NP assay was recorded in 30–400 ng band−1 range.

2.4. Sample Processing for the Estimation of PT in Capsule Dosage Form

For the estimation of PT in marketed capsule dosage forms, five capsules with an equivalent amount of 150 mg of PT were taken randomly, and the average weight was noted. The capsule contents were taken out and mixed thoroughly to obtain the fine powder. The powder containing 150 mg of PT was dispensed in 100 mL of MeOH. Then, 10 mL of this stock was further diluted using MeOH to obtain the stock of 100 mL. The resultant samples of capsule dosage forms were filtered and sonicated for 15 min. The prepared samples were used for the quantitation of PT in marketed capsule dosage forms using the proposed analytical assays.

2.5. Validation Studies

The present RP and NP spectrodensitometry assays for the estimation of PT were validated for linearity range, system suitability, accuracy, precision, robustness, selectivity, and sensitivity according to ICH-Q2 (R1) guidelines [35]. The PT linearity was obtained by plotting PT concentrations versus its peak area. The linearity was obtained at 10–1600 ng band−1 range for sustainable RP spectrodensitometry assay and 30–400 ng band−1 range for routine NP spectrodensitometry assay. The parameters of system suitability for the current analytical techniques were obtained by the evaluation of retardation factor (Rf), asymmetry/tailing factor (As), and number of theoretical plates per meter (N m−1) [33,34]. The determination of Rf, As, and N m−1 was carried out according to literature [33].
The accuracy for the current analytical techniques was recorded as % recovery, which was determined at three different quality control (QC) levels, including low QC (LQC; 10 ng band−1), middle QC (MQC; 800 ng band−1), and high QC (HQC; 1600 ng band−1) for sustainable RP method. The accuracy for the routine NP method was evaluated at LQC (30 ng band−1), MQC (100 ng band−1), and HQC (400 ng band−1). The % recovery of PT was estimated for each solution (n = 6) for both methods [35].
The precision for the current analytical techniques was evaluated as instrumental and intra/interday precision. The instrumental precision was obtained by the repeated analysis of fixed concentration several times (n = 6). This precision was evaluated at MQC for RP-HPTLC and NP-HPTLC assays. Intraday precision was estimated by the determination of PT at the same QC levels used for the accuracy evaluation on the same day for RP and NP spectrodensitometry assays (n = 6). Interday precision was evaluated by the determination of PT at the same QC levels on three consecutive days for RP and NP spectrodensitometry assays (n = 6) [35].
The robustness for the current analytical methods was evaluated by making some minor changes in the chromatographic conditions, which includes the minor modifications in various instrumental conditions such as mobile phase compositions, total run length, wavelength, and saturation time for RP and NP spectrodensitometry assays. For the sustainable RP spectrodensitometry assay, the original EtOH-H2O (80:20, v v−1) mobile phase was changed to EtOH-H2O (82:18, v v−1) and EtOH-H2O (78:22, v v−1) compositions, and the change in Rf values and chromatographic response were recorded. For the routine NP spectrodensitometry assay, the original CHCl3-MeOH (90:10, v v−1) mobile phase was changed to CHCl3-MeOH (92:8, v v−1) and CHCl3-MeOH (88:12, v v−1) compositions, and the changes in Rf values and chromatographic response were recorded [33,35]. The total run length was modified from 80 to 82 and 78 mm for RP and NP spectrodensitometry assays, and the changes in Rf values and chromatographic response were noted. The saturation time was modified from 30 to 32 and 28 min, and the changes in Rf values and the chromatographic response were recorded for RP and NP spectrodensitometry assays [35]. The detection wavelength was changed from 302 to 304 and 298 nm, and the changes in Rf values and chromatographic response were recorded for RP and NP spectrodensitometry assays [33].
The sensitivity for the current analytical assays was estimated as the limit of detection (LOD) and limit of quantification (LOQ) using a standard deviation technique. The blank sample was injected in triplicates, and the standard deviation was calculated for the current analytical assays. The LOD and LOQ of PT for RP and NP spectrodensitometry assays were calculated using the Equations (1) and (2), respectively [35]:
LOD = 3.3 × σ S
LOQ = 10 × σ S
In which σ is the standard deviation and S is the slope for the univariate calibration plot of PT.
The specificity/peak purity for the current analytical assays was determined by comparing the Rf values and spectrodensitometry spectra of PT in marketed capsule dosage forms with those of pure PT.

2.6. Selectivity/Degradation Studies

Based on the superior validation parameters such as linearity range, accuracy, precision, robustness, and sensitivity of the sustainable RP spectrodensitometry assay compared to the routine NP spectrodensitometry assay, the selectivity/degradation studies were evaluated for the sustainable RP spectrodensitometry assay only. The selectivity/degradation studies were performed to evaluate the stability-indicating properties of the sustainable RP-HPTLC method. Degradation was performed under different stress conditions, which include acid degradation, base degradation, oxidative degradation, thermal degradation, and photolytic degradation, as reported previously [33,35]. For the acid- and base-degradation studies, the target concentration of PT was dispensed in the required amounts of acid (1 M HCl) or base (1 M NaOH) (n = 3.0). The resultant samples were heated under reflux for 12 h. The samples were evaporated separately under vacuum. The residues obtained were reconstituted with 10 mL of MeOH. The required solution containing 500 ng band−1 of PT was spotted on the TLC plates. The chromatograms were recorded and evaluated for the degradation products using the sustainable RP spectrodensitometry assay [33].
For the oxidative degradation studied, the target concentration of PT was dispensed in the required amount of MeOH, and an aliquot of 50 mL of H2O2 (3%, v v−1) was added (n = 3.0). The samples were heated in a boiling water bath for a period of 12 h. The obtained samples were evaporated under vacuum. The residues obtained were reconstituted with 10 mL of MeOH. The required solution containing 500 ng band−1 of PT was spotted on the TLC plates. The chromatograms were recorded and evaluated for the degradation products using the sustainable RP spectrodensitometry assay [33].
For thermal degradation studies, the target concentration of PT was dispensed in the required amount of MeOH and kept in a hot air oven at 55 °C for 24 h. After 24 h, the required solution containing 500 ng band−1 of PT was spotted on the TLC plates. The chromatograms were recorded and evaluated for the degradation products using the sustainable RP spectrodensitometry assay [33].
For the photolytic-degradation studies, the target concentration of PT was dispensed in the required amount of MeOH and exposed to 254 nm light in a UV chamber for 24 h. The samples were evaporated under vacuum. The residues obtained were reconstituted with 10 mL of MeOH. The required solution containing 500 ng band−1 of PT was spotted on the TLC plates. The chromatograms were recorded and evaluated for the degradation products using the sustainable RP spectrodensitometry assay [33].
The peak purity of PT at various stress conditions was also assessed. The peak purity of PT was assessed by comparing the respective densitograms at peak start, peak middle, and peak end, and average peak purity index was calculated at each stress condition [38,39].

2.7. Estimation of PT in Commercial Capsules

The processed samples of commercial capsule dosage form were applied to the TLC plates for RP-HPTLC and NP-HPTLC methods, and respective chromatographic responses were recorded. The chromatographic area of PT in capsule dosage form was then recorded. The PT contents in commercial formulations were determined from the classical univariate calibration plot of PT for RP-HPTLC and NP-HPTLC methods.

2.8. Greenness Assessment

The greenness scores for the current analytical assays were determined using all 12 different principles of GAC, reported previously [32]. The AGREE scores (0.0–1.0) were obtained using AGREE: The Analytical Greenness Calculator (version 0.5, Gdansk University of Technology, Gdansk, Poland, 2020) for the current analytical assays.

3. Results and Discussion

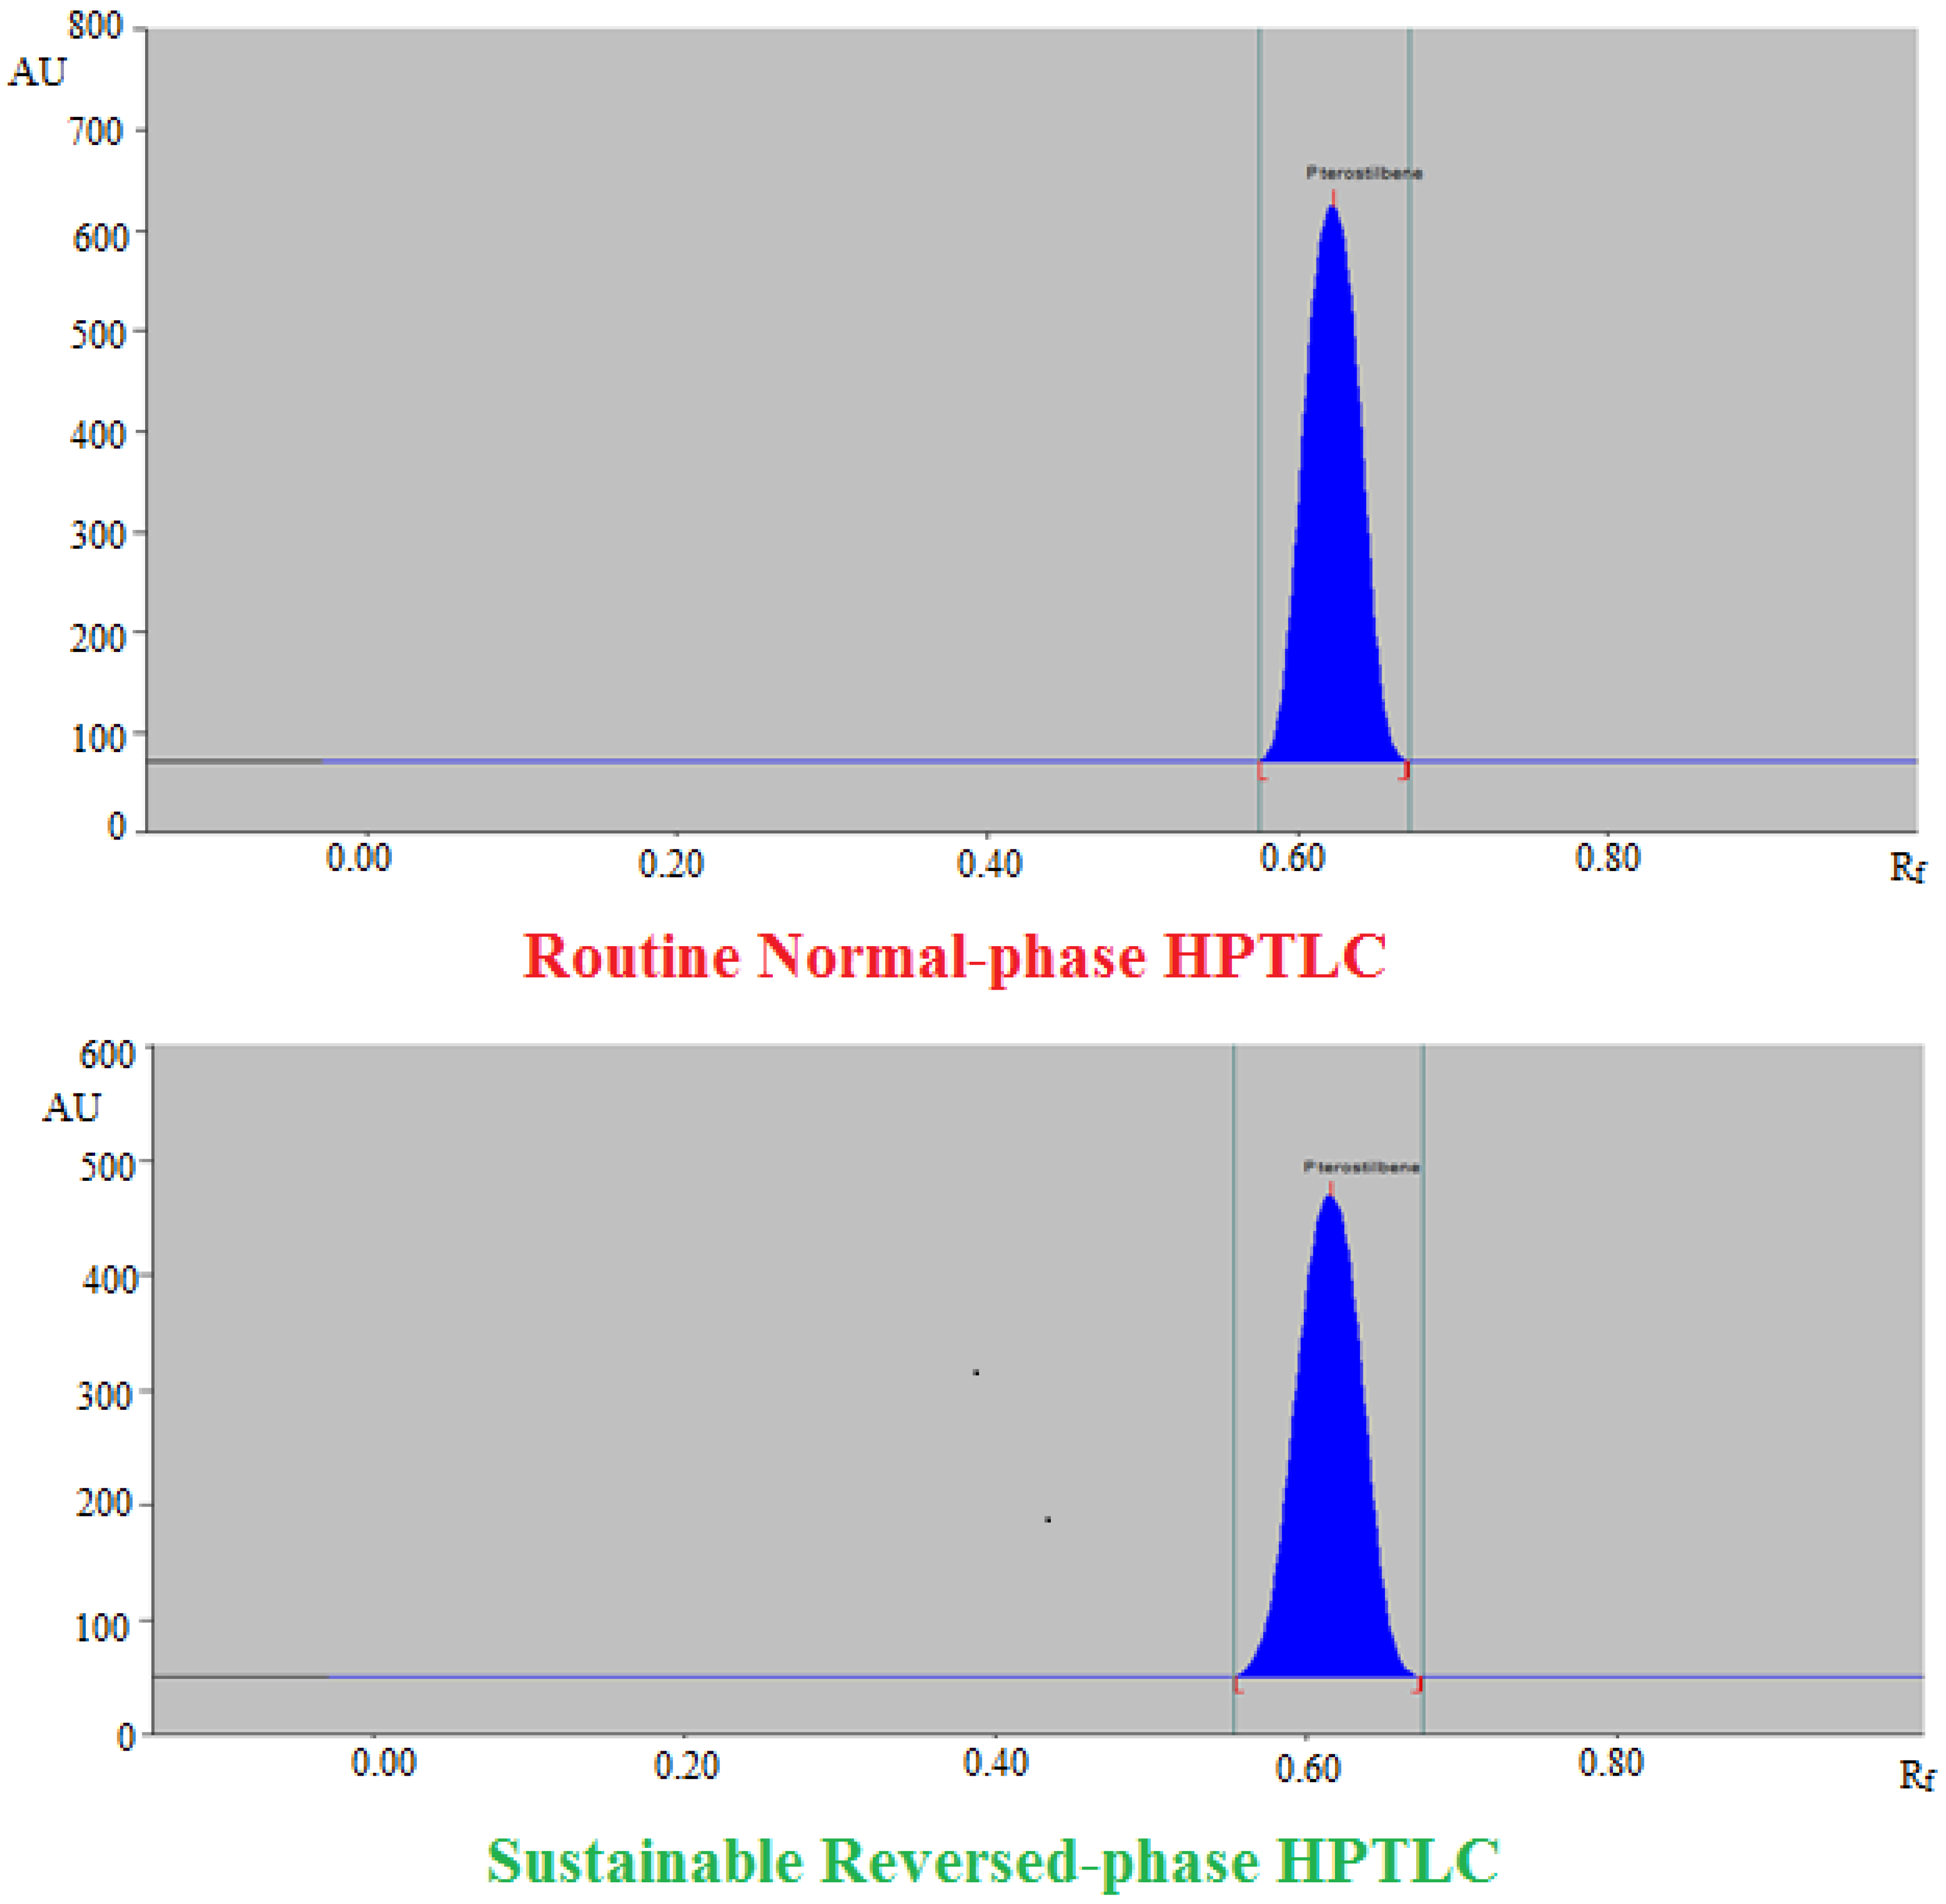
3.1. Method Development

Different analytical methodologies such as UV spectrophotometry, HPLC, UFLC, UPLC-MS, and HPTLC have been used for the analysis of PT in different sample matrices [13,14,15,16,17,18,19,20,21,22,23]. Nevertheless, the greenness scores with environmental viewpoint were not in the literature. Accordingly, the present work was performed for the development of a rapid, sensitive, and sustainable RP-HPTLC method in comparison to the NP-HPTLC for the determination of PT in its capsule dosage form.
In the case of the sustainable RP spectrodensitometry assay for the PT analysis, different proportions of EtOH and H2O such as EtOH-H2O (50:50, v v−1), EtOH-H2O (60:40, v v−1), EtOH-H2O (70:30, v v−1), EtOH-H2O (80:20, v v−1), and EtOH-H2O (90:10, v v−1) were studied as the mobile phase for the establishment of an acceptable spectrodensitogram for PT determination. The results showed that the solvent systems EtOH-H2O (50:50, v v−1), EtOH-H2O (60:40, v v−1), EtOH-H2O (70:30, v v−1), and EtOH-H2O (90:10, v v−1) offered a weak spectrodensitogram for PT with a weak As value (>1.25). However, EtOH-H2O (80:20, v v−1) solvent system offered a well-resolved and intact spectrodensitogram of PT with an acceptable As value (1.02) at Rf = 0.60 ± 0.01 (Figure 1). Accordingly, EtOH-H2O (80:20, v v−1) was selected as the solvent system for the determination of PT in marketed capsules using the sustainable RP spectrodensitometry assay.
In the case of the routine NP-HPTLC assay for the determination of PT, different proportions of CHCl3 and MeOH such as CHCl3-MeOH (50:50, v v−1), CHCl3-MeOH (60:40, v v−1), CHCl3-MeOH (70:30, v v−1), CHCl3-MeOH (80:20, v v−1), and CHCl3-MeOH (90:10, v v−1) were studied for the development of an acceptable spectrodensitogram for the PT determination. The results showed that CHCl3-MeOH (50:50, v v−1), CHCl3-MeOH (60:40, v v−1), CHCl3-MeOH (70:30, v v−1), and CHCl3-MeOH (80:20, v v−1) solvent systems presented a poor spectrodensitogram of PT with poor As value (>1.30). However, CHCl3-MeOH (90:10, v v−1) presented a well-resolved and compact spectrodensitogram of PT with an acceptable As value (1.08) at Rf = 0.62 ± 0.01 (Figure 1). Accordingly, the CHCl3-MeOH (90:10, v v−1) was selected as the solvent system for PT analysis using the routine NP assay. The spectral bands for RP-HPTLC and NP-HPTLC assays were recorded densitometrically, and the maximum chromatography response was obtained at the wavelength (λmax) = 302 nm for RP-HPTLC and NP-HPTLC assays. Accordingly, the entire analysis of PT was carried out at λmax = 302 nm for RP-HPTLC and NP-HPTLC assays.

3.2. Validation Studies

The current analytical assays for the quantification of PT were validated for various validation parameters following ICH-Q2 (R1) guidelines [35]. The resulting data for the classical univariate calibration plot/regression analysis of PT for RP and NP spectrodensitometry assays are summarized in Table 1. The univariate calibration plot for PT was linear in the 10–1600 ng band−1 range for the sustainable RP spectrodensitometry assay, while the univariate calibration plot for PT was linear in 30–400 ng band−1 range for the routine NP spectrodensitometry assay. The determination coefficient (R2) values for PT were predicted as 0.9992 and 0.9941 for the sustainable RP and routine NP spectrodensitometry assays, respectively. These observations and data indicated that RP and NP spectrodensitometry assays presented suitable linear regression data. In contrast, the linearity data of the sustainable RP spectrodensitometry assay was superior to the routine NP spectrodensitometry assay. Accordingly, the sustainable RP spectrodensitometry assay has been considered more reliable for the determination of PT.
The system suitability parameters for RP and NP assays were evaluated, and results are listed in Table 2. All the system suitability parameters such as Rf, As, and N m−1 for RP and NP spectrodensitometry assays were suitable for PT analysis.
The resulting data of accuracy analysis for RP and NP spectrodensitometry assays are listed in Table 3. The % accuracy of PT for the sustainable RP spectrodensitometry assay was found to be 98.79–100.94%. The % accuracy of PT for the routine NP spectrodensitometry assay was predicted as 90.42–108.82%. The results of % accuracy indicated that the sustainable RP assay was highly accurate for PT analysis in comparison to the routine NP assay.
The different types of precisions for both of the analytical assays were evaluated as the percent of coefficient of variation (% CV). The resulting data for instrumental precision are included in Table S2, and the resulting data for intra/interday precisions are listed in Table 4. The % CV for the instrumental precision of sustainable RP and routine NP methods were estimated as 0.41% and 3.07%, respectively. The % CVs for the intraday precision of the sustainable RP method were estimated as 0.16–0.54%. The % CVs for interday precision of the sustainable RP method were estimated as 0.18–0.64%. The % CVs for the intraday precision of the routine NP method were found to be 3.06–3.34%. The % CVs for interday precision of the routine NP method were found to be 3.32–3.48%. The recorded values of instrumental and inter/intraday precisions indicated that the sustainable RP assay was highly precise than the routine NP assay for PT analysis.
The resulting data of robustness analysis after modifying the mobile phase compositions for the RP and NP spectrodensitometry assays are listed in Table 5. The % CVs were estimated as 0.37–0.41% for the sustainable RP spectrodensitometry assay. The Rf values for PT were predicted as 0.59–0.61 for the sustainable RP spectrodensitometry assay. However, the % CVs were recorded as 2.95–3.06% for the routine NP spectrodensitometry assay. The Rf values for PT were predicted as 0.60–0.64 for the routine NP spectrodensitometry assay. The resulting data for robustness analysis after modifying the total run length for the RP and NP spectrodensitometry assays are presented in Table S3. The % CVs after this change were predicted as 0.44–0.49% for the sustainable RP spectrodensitometry assay. The Rf values of PT were predicted as 0.58–0.62. However, the % CVs after this change were determined as 2.39–2.47% for the routine NP spectrodensitometry assay. The Rf values of PT were predicted as 0.60–0.65. The results for the robustness analysis after modification of saturation time for the RP and NP spectrodensitometry assays are listed in Table S4. The % CVs after this change were found to be 0.46–0.47% for the sustainable RP spectrodensitometry assay. The Rf values of PT were predicted as 0.58–0.61. However, the % CVs after this modification were found to be 2.41–2.60% for the routine NP spectrodensitometry assay. The Rf values of PT were predicted as 0.61–0.63. The results for robustness analysis after changing detection wavelength for the RP and NP spectrodensitometry assays are listed in Table S5. The % CVs after changing detection wavelength were found to be 0.53–0.57% for the sustainable RP spectrodensitometry assay. However, the % CVs after changing the detection wavelength were found to be 2.24–2.69% for the routine NP spectrodensitometry assay. The Rf value of PT after changing the detection wavelength was also not changed for RP and NP spectrodensitometry assays. The small changes in chromatographic conditions and low % CVs showed that RP and NP spectrodensitometry assays were robust enough for PT analysis. However, the sustainable RP spectrodensitometry assay was more robust than the routine NP assay for PT analysis.
The sensitivity for the RP and NP spectrodensitometry assays was obtained by the determination of LOD and LOQ, and the results are listed in Table 1. The LOD and LOQ for the sustainable RP spectrodensitometry assay were estimated as 3.51 ± 0.06 and 10.53 ± 0.18 ng band−1, respectively, for PT. However, the LOD and LOQ for the routine NP spectrodensitometry assay were determined as 11.12 ± 0.37 and 33.36 ± 1.11 ng band−1, respectively, for PT. These observations and results indicated that the sustainable RP spectrodensitometry assay was highly sensitive compared to the routine NP spectrodensitometry assay.
The specificity/peak purity for RP and NP spectrodensitometry assays was assessed by comparing the overlaid spectrodensitograms of PT in capsule dosage form with that of pure PT. The overlaid spectrodensitogram of pure PT and PT in capsule dosage form for the RP and NP spectrodensitometry assays are summarized in Figure 2. The maximum chromatographic response for PT in pure PT and commercial capsule dosage form was found at λmax = 302 nm for RP and NP spectrodensitometry assays. The similar spectrodensitograms, Rf values, and λmax of PT in pure PT and capsule dosage form suggested the specificity/peak purity for the RP and NP spectrodensitometry assays.

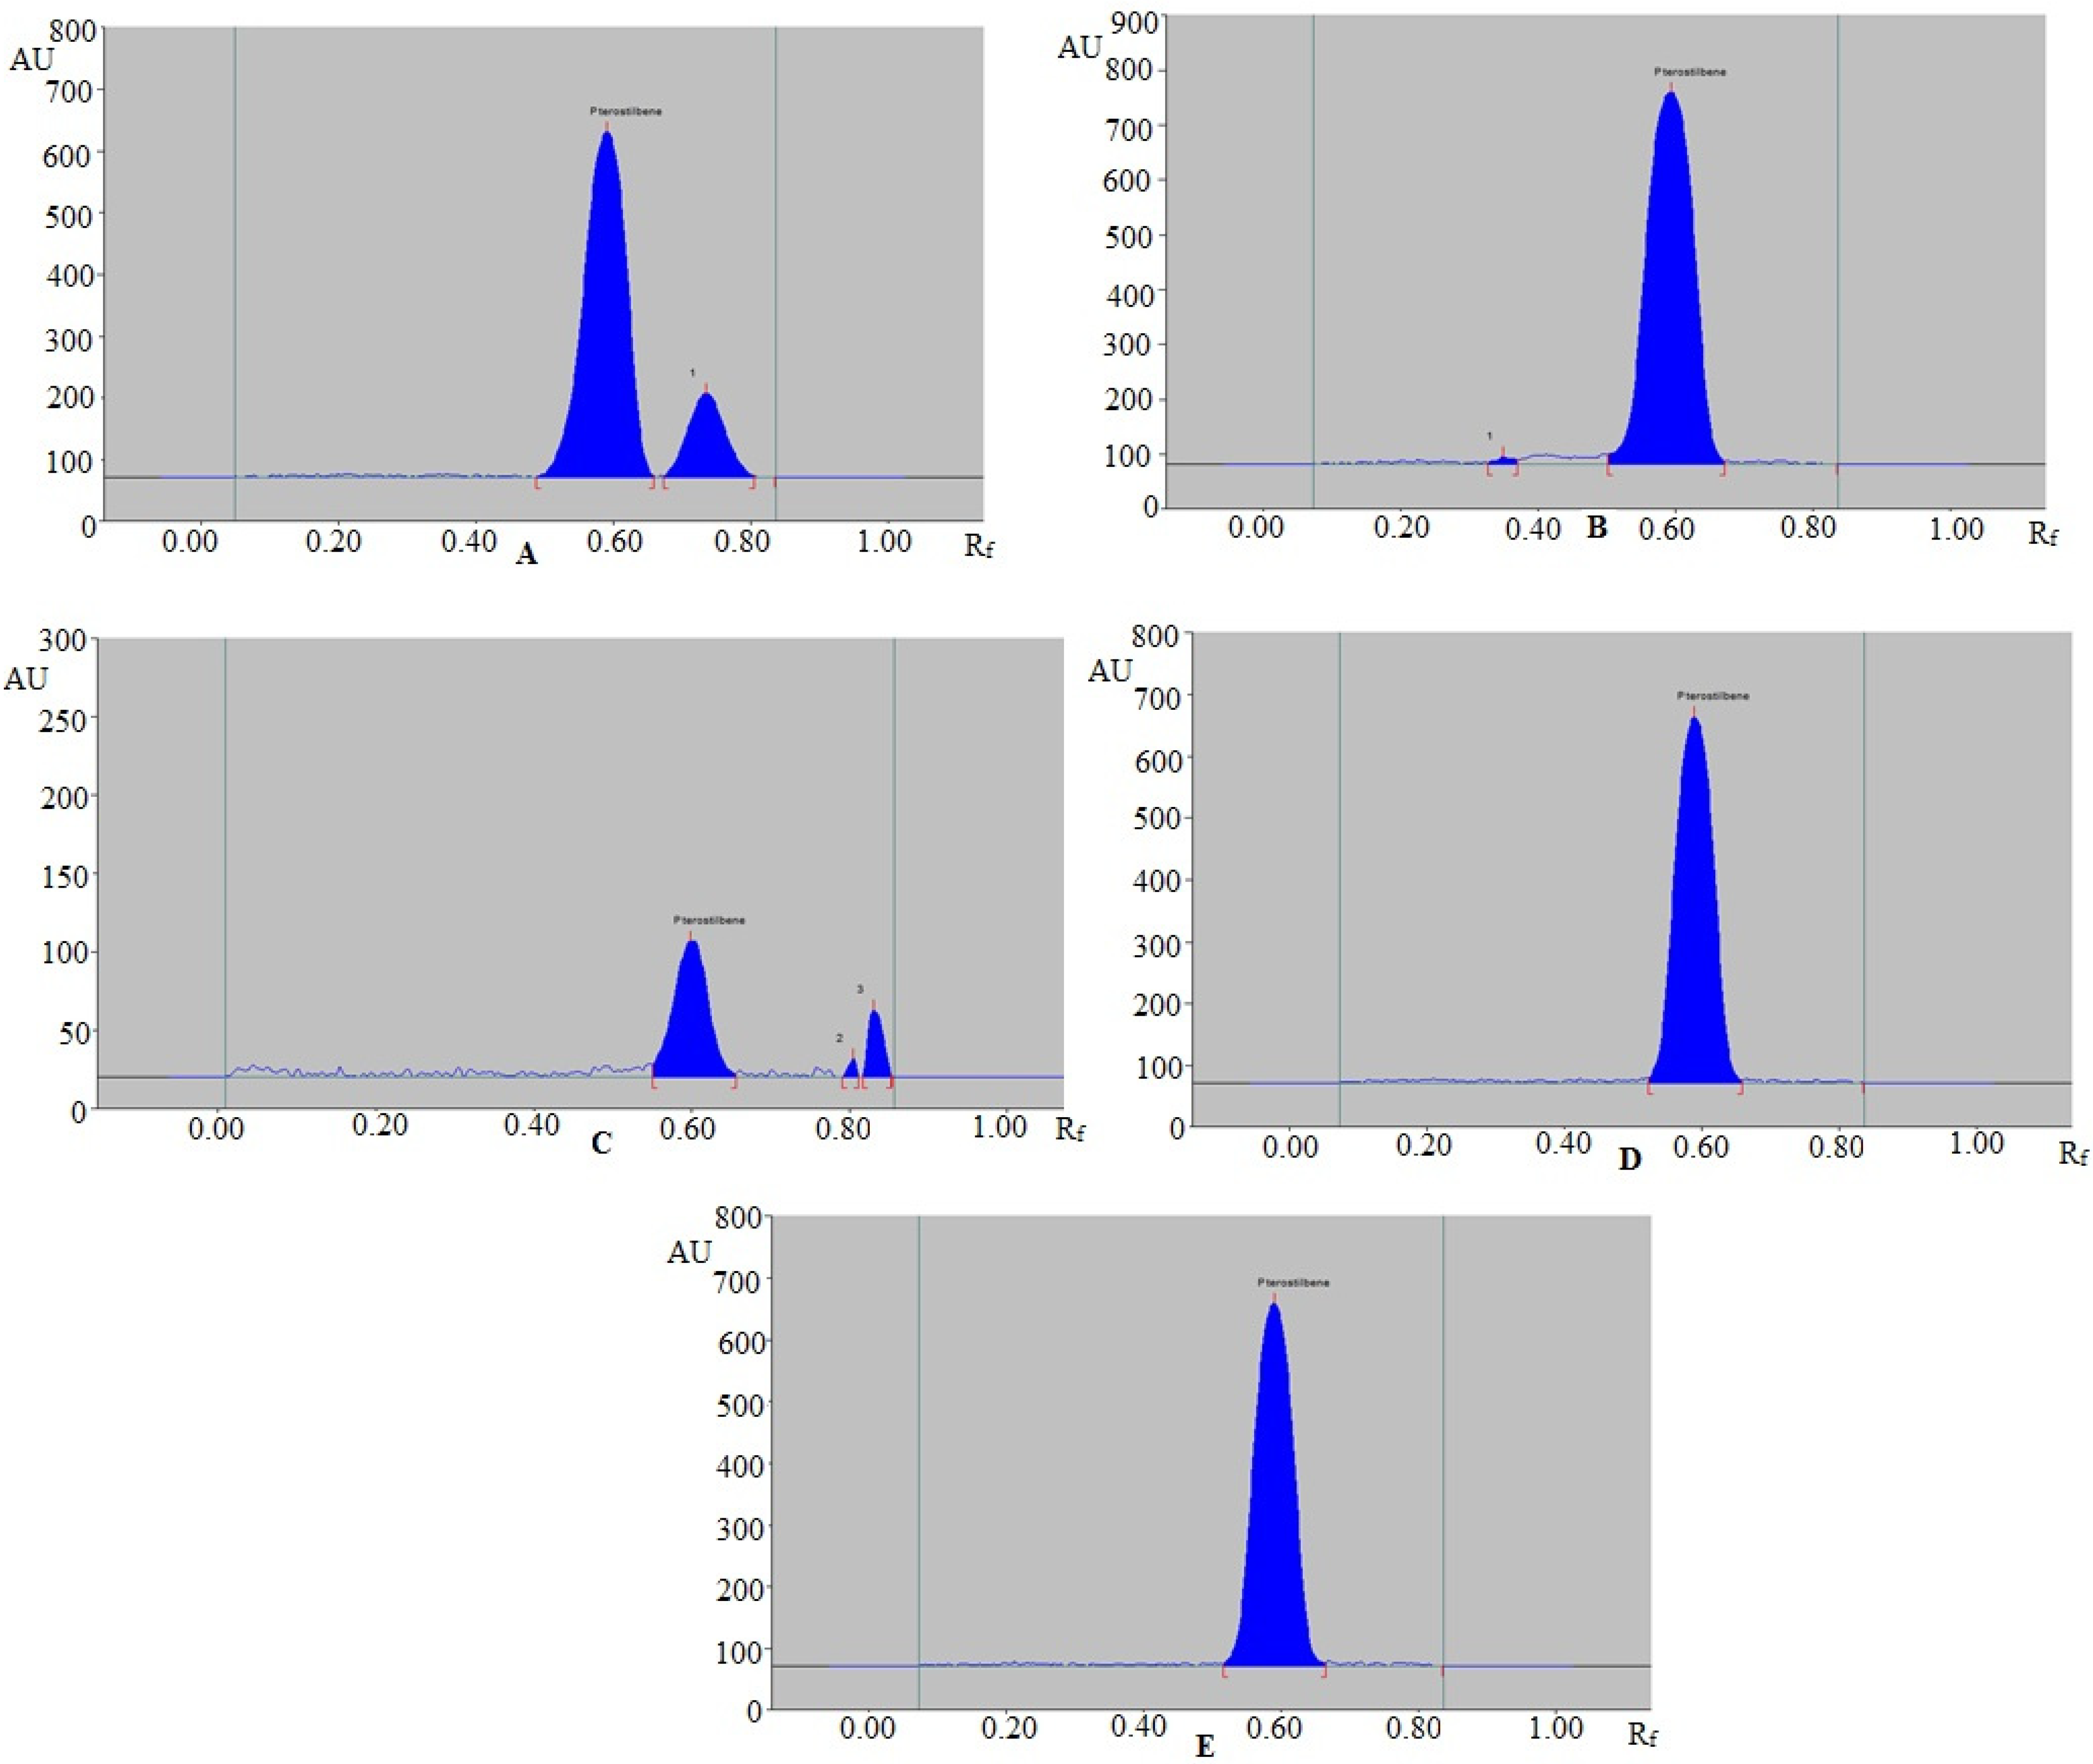
3.3. Selectivity/Degradation Studies

The selectivity/degradation studies for the sustainable RP-HPTLC method were evaluated under various stress conditions. The results for the sustainable RP spectrodensitometry assay are included in Figure 3 and Table 6. The chromatographic peaks from such a study suggested well-separated peaks of PT with some additional peaks of degradation products (Figure 3). Under acid-degradation study, 82.46% of PT remained, and only 17.54% was decomposed (Table 6 and Figure 3A). Hence, PT was stable enough under acid-degradation study. The acid-induced degradation peak (peak 1 in Figure 3A) was resolved with an Rf value of 0.74. The Rf value of PT under acid-degradation study was not shifted (Rf = 0.60). Under base-degradation study, 99.28% of PT remained, and only 0.72% was decomposed (Table 6). The base-induced degradation peak (peak 1 in Figure 3B) was resolved with an Rf value of 0.35. The Rf value of PT under base-degradation study was also unchanged (Rf = 0.60). Under oxidative-degradation study, 80.72% of PT remained, and 19.28% was decomposed (Table 6 and Figure 3C). Hence, the PT was also stable under oxidative-degradation study. The H2O2-induced degradation peaks (peaks 2 and 3 in Figure 3C) were resolved with Rf values of 0.81 and 0.83, respectively. The Rf value of PT under oxidative-degradation study was also unchanged (Rf = 0.60). Under thermal (Figure 3D) and photolytic (Figure 3E) degradation studies, 100.00% of PT remained, and no decomposition of PT was recorded. Therefore, PT was highly stable under thermal and photolytic-degradation studies. Using the RP spectrodensitometry assay, the highest degradation of PT was recorded under oxidative-degradation study. The peak purity index of PT was also assessed in order to evaluate the peak purity. The peak purity index at various stress conditions was determined at 0.994–1.03 (Table 6), suggesting that PT was successfully resolved under various stress conditions. Accordingly, the present RP spectrodensitometry assay was able to detect PT in the presence of its degradation products. These observations and results indicated the selectivity and stability-indicating nature of the present RP spectrodensitometry assay.

3.4. Determination of PT in Commercial Formulations

The applicability of current analytical assays was confirmed in the estimation of PT in its commercial capsule dosage form. The HPTLC peak of PT from the commercial capsule dosage form was identified by comparing its single TLC band at Rf = 0.60 with that of pure PT for the sustainable RP assay. The RP spectrodensitogram of PT in commercial capsule dosage form for the RP method is shown in Figure S1, which was observed to be similar to that of pure PT. The HPTLC peak of PT from the commercial capsule dosage form was identified by comparing its single TLC band at Rf = 0.62 with that of pure PT for the routine NP method. The NP spectrodensitogram of PT in commercial capsule dosage form for the routine NP method is also shown in Figure S1, which showed a similar spectrodensitogram with that of pure PT.
The PT contents of the commercial capsule dosage form were quantified using the classical univariate calibration curve of PT for the current analytical assays. The % PT contents in commercial capsule dosage form were found to be 100.84% using the sustainable RP method; however, the % PT contents in commercial capsule dosage form were estimated as 92.59% using the routine NP method. These results and observations showed that the sustainable RP method was superior to the routine NP method for the determination of PT in the commercial capsule dosage form.

3.5. Assessment of Greenness Profile Using AGREE Approach

As mentioned earlier, various metric approaches are available for the evaluation of greenness profiles of the analytical assays [30,31,32,33,34]. However, AGREE metric approach includes all 12 principles of GAC in comparison to the other metric approaches [32]. Accordingly, in the present study, the greenness profile for the RP and NP assays was evaluated by AGREE: The Analytical Greenness Calculator (version 0.5, Gdansk University of Technology, Gdansk, Poland, 2020). The predicted AGREE scores for the RP and NP assays are shown in Figure 4. The AGREE scores for the sustainable RP and routine NP assays were obtained as 0.78 and 0.46, respectively. Based on predicted AGREE scores, the sustainable RP method has been considered as the excellent green analytical method for PT analysis.

4. Conclusions

The estimation of PT in commercial capsule dosage form was carried out using the RP and NP spectrodensitometry assays. The present RP and NP spectrodensitometry assays were validated well for linearity, system suitability parameters, accuracy, precision, robustness, sensitivity, selectivity, and specificity for PT analysis. The greenness score for the RP and NP spectrodensitometry assays was assessed by employing AGREE metric approach. The sustainable RP spectrodensitometry assay was highly sensitive, accurate, precise, and robust for PT analysis in comparison with the routine NP spectrodensitometry assay. The sustainable RP spectrodensitometry assay was also found to be selective and stability-indicating for the PT analysis in the presence of its degradation products. The sustainable RP spectrodensitometry assay was superior to the routine NP spectrodensitometry assay in the estimation of PT in the commercial capsule dosage form. The AGREE score for the RP spectrodensitometry assay indicated the excellent greenness profile compared to the NP spectrodensitometry assay. Overall, the sustainable RP spectrodensitometry assay has been considered superior over the routine NP spectrodensitometry assay. Accordingly, the sustainable RP spectrodensitometry assay could be used for the estimation of PT in its marketed formulations.

Supplementary Materials

The following are available online at https://0-www-mdpi-com.brum.beds.ac.uk/article/10.3390/pr9081305/s1, Figure S1: Representative chromatograms of PT in commercial formulation recorded using routine normal-phase HPTLC and sustainable reversed-phase HPTLC techniques, Table S1: Chromatographic conditions and instrumentations used for the determination of pterostilbene (PT) for the routine normal-phase HPTLC and the sustainable reversed-phase HPTLC techniques, Table S2: Results of instrumental precision for the routine normal-phase HPTLC and the sustainable reversed-phase HPTLC techniques (mean ± SD; n = 6), Table S3: Results of robustness analysis by changing total run length for the routine normal-phase HPTLC and the sustainable reversed-phase HPTLC techniques (mean ± SD; n = 6), Table S4: Results of robustness analysis by changing the saturation time for the routine normal-phase HPTLC and the sustainable reversed-phase HPTLC techniques (mean ± SD; n = 6), Table S5: Results of robustness analysis by changing the detection wavelength for the routine normal-phase HPTLC and the sustainable reversed-phase HPTLC techniques (mean ± SD; n = 6).

Author Contributions

Conceptualization, P.A. and S.A.; methodology, P.A., M.H.A., A.I.F. and F.S.; software, M.F.; validation, S.A., M.F. and F.S.; formal analysis, M.F.; investigation, P.A., A.I.F. and M.H.A.; resources, S.A.; data curation, M.F.; writing—original draft preparation, F.S.; writing—review and editing, S.A., P.A. and S.A.; visualization, M.H.A.; supervision, S.A. and P.A.; project administration, S.A.; funding acquisition, S.A. All authors have read and agreed to the published version of the manuscript.

Funding

This research was funded by the Researchers Supporting Project (number RSP-2021/146) at King Saud University, Riyadh, Saudi Arabia. The APC was funded by RSP.

Institutional Review Board Statement

Not applicable.

Informed Consent Statement

Not applicable.

Data Availability Statement

This study did not report any data.

Acknowledgments

The authors are thankful to Researchers Supporting Project (number RSP-2021/146) at King Saud University, Riyadh, Saudi Arabia.

Conflicts of Interest

The authors declare no conflict of interest.

References

  1. Caddeo, C.; Nacher, A.; Vassallo, A.; Armentano, M.F.; Pons, R.; Fernàndez-Busquets, X.; Carbone, C.; Valenti, D.; Fadda, A.M.; Manconi, M. Effect of quercetin and resveratrol co-incorporated in liposomes against inflammatory/oxidative response associated with skin cancer. Int. J. Pharm. 2016, 513, 153–163. [Google Scholar] [CrossRef]
  2. Lee, K.W.; Bode, A.M.; Dong, Z. Molecular targets of phytochemicals for cancer prevention. Nat. Rev. Cancer 2011, 11, 211–218. [Google Scholar] [CrossRef]
  3. Alqarni, M.H.; Haq, N.; Alam, P.; Abdel-Kader, M.S.; Foudah, A.I.; Shakeel, F. Solubility data, Hansen solubility parameters and thermodynamic behavior of pterostilbene in some pure solvents and different (PEG-400 + water) cosolvent compositions. J. Mol. Liq. 2021, 331, E115700. [Google Scholar] [CrossRef]
  4. Seshadri, T.R. Polyphenols of Pterocarpus and Dalbergia woods. Phytochemistry 1972, 11, 881–898. [Google Scholar] [CrossRef]
  5. Mathew, J.; Rao, A. Chemical examination of Pterocarpus marsupium. J. Indian Chem. Soc. 1984, 61, 728–729. [Google Scholar]
  6. Paul, B.; Masih, I.; Deopujari, J.; Charpentier, C. Occurrence of resveratrol and pterostilbene in age-old darakchasava, an ayurvedic medicine from India. J. Ethnopharmacol. 1999, 68, 71–76. [Google Scholar] [CrossRef]
  7. Waffo Teguo, P.; Fauconneau, B.; Deffieux, G.; Huguet, F.; Vercauteren, J.; Merillon, J.M. Isolation, identification, and antioxidant activity of three stilbene glucosides newly extracted from Vitis vinifera cell cultures. J. Nat. Prod. 1998, 61, 655–657. [Google Scholar] [CrossRef]
  8. Remsberg, C.M.; Yáñez, J.A.; Ohgami, Y.; Vega-Villa, K.R.; Rimando, A.M.; Davies, N.M. Pharmacometrics of pterostilbene: Preclinical pharmacokinetics and metabolism, anticancer, antiinflammatory, antioxidant and analgesic activity. Phytother. Res. 2008, 22, 169–179. [Google Scholar] [CrossRef]
  9. Chiou, Y.; Tsai, M.; Nagabhushanam, K.; Wang, Y.J.; Wu, C.H.; Ho, C.T.; Pan, M.H. Pterostilbene is more potent than resveratrol in preventing azoxymethane (AOM)-induced colon tumorigenesis via activation of the NF-E2-related factor 2 (Nrf2)-mediated antioxidant signaling pathway. J. Agric. Food Chem. 2011, 59, 2725–2733. [Google Scholar] [CrossRef]
  10. Pari, L.; Satheesh, A.M. Effect of pterostilbene on hepatic key enzymes of glucose metabolism in streptozotocin- and nicotinamide-induced diabetic rats. Life Sci. 2006, 79, 641–645. [Google Scholar] [CrossRef]
  11. Kosuru, R.; Cai, Y.; Kandula, V.; Yan, D.; Wang, C.; Zheng, H.; Li, Y.; Irwin, M.G.; Singh, S.; Xia, Z. AMPK contributes to cardioprotective effects of pterostilbene against myocardial ischemia-reperfusion injury in diabetic rats by suppressing cardiac oxidative stress and apoptosis. Cell. Physiol. Biochem. 2018, 46, 1381–1397. [Google Scholar] [CrossRef] [PubMed]
  12. Wang, B.; Liu, H.; Yue, L.; Li, X.; Zhao, L.; Yang, X.; Wang, X.; Yang, Y.; Qu, Y. Neuroprotective effects of pterostilbene against oxidative stress injury: Involvement of nuclear factor erythroid 2-related factor 2 pathway. Brain Res. 2016, 1643, 70–79. [Google Scholar] [CrossRef]
  13. Mukthinuthalapati, M.A.; Kumar, J.S.P. New derivative and differential spectrophotometric methods for the determination of pterostilbene-an antioxidant. Pharm. Methods 2015, 6, 143–147. [Google Scholar]
  14. Majeed, M.; Majeed, S.; Jain, R.; Mundkur, L.; Rajalakshmi, H.R.; Lad, P.; Neupane, P. A randomized study to determine the sun protection factor of natural pterostilbene from Pterocarpus marsupium. Cosmetics 2020, 7, E16. [Google Scholar] [CrossRef] [Green Version]
  15. Pezet, R.; Pont, V.; Cuenat, P. Method to determine resveratrol and pterostilbene in grape berries and wines using high-performance liquid chromatography and highly sensitive fluorimetric detection. J. Chromatogr. A 1994, 663, 191–197. [Google Scholar] [CrossRef]
  16. Annapurna, M.M.; Venkatesh, B.; Teja, G.R. Development of a validated stability indicating liquid chromatographic method for the determination of pterostilbene. Indian J. Pharm. Educ. Res. 2018, 52, S63–S70. [Google Scholar] [CrossRef] [Green Version]
  17. Waszczuk, M.; Bianchi, S.E.; Martiny, S.; Pittol, V.; Lacerda, D.S.; Araujo, A.S.D.S.; Bassani, V.L. Development and validation of a specific-stability indicating liquid chromatography method for quantitative analysis of pterostilbene: Application in food and pharmaceutical products. Anal. Methods 2020, 12, 4310–4318. [Google Scholar] [CrossRef]
  18. Remsberg, C.M.; Yanez, J.A.; Roupe, K.A.; Davies, N.M. High-performance liquid chromatographic analysis of pterostilbene in biological fluids using fluorescence detection. J. Pharm. Biomed. Anal. 2007, 43, 250–254. [Google Scholar] [CrossRef]
  19. Lin, H.S.; Yue, B.D.; Ho, P.C. Determination of pterostilbene in rat plasma by a simple HPLC-UV method and its application in pre-clinical pharmacokinetic study. Biomed. Chromatogr. 2009, 23, 1308–1315. [Google Scholar] [CrossRef]
  20. Bindu, G.H.; Annapurna, M.M. New stability indicating liquid chromatographic method for the determination of pterostilbene in capsules. Res. J. Pharm. Technol. 2018, 11, 3851–3856. [Google Scholar] [CrossRef]
  21. Li, J.; Li, D.; Pan, Y.; Hu, J.H.; Huang, W.; Wang, Z.Z.; Xiao, X.; Wang, Y. Simultaneous determination of ten bioactive constituents of Sanjie Zhentong Capsule in rat plasma by ultra-high-performance liquid chromatography tandem mass spectrometry and its application to a pharmacokinetic study. J. Chromatogr. B 2017, 1054, 20–26. [Google Scholar] [CrossRef]
  22. Sun, J.; Huo, H.; Song, Y.; Zheng, J.; Zhao, Y.; Huang, W.; Wang, Y.; Zhu, J.; Tu, P.; Li, J. Method development and application for multi-component quantification in rats after oral administration of Longxuetongluo capsule by UHPLC-MS/MS. J. Pharm. Biomed. Anal. 2018, 156, 252–262. [Google Scholar] [CrossRef]
  23. Mallavadhani, U.V.; Sahu, G. Pterostilbene: A highly reliable quality-control marker for the Ayurvedic antidiabrtic plant ‘Bijasar’. Chromatographia 2003, 58, 307–312. [Google Scholar]
  24. Foudah, A.I.; Alam, P.; Anwer, M.K.; Yusufoglu, H.S.; Abdel-Kader, M.S.; Shakeel, F. A green RP-HPTLC-densitometry method for the determination of diosmin in pharmaceutical formulations. Processes 2020, 8, E817. [Google Scholar] [CrossRef]
  25. Bhandari, P.; Kumar, N.; Gupta, A.P.; Singh, B.; Kaul, V.K. A rapid RP-HPTLC densitometry method for simultaneous determination of major flavonoids in important medicinal plants. J. Sep. Sci. 2007, 30, 2092–2096. [Google Scholar] [CrossRef] [PubMed]
  26. Sharma, U.K.; Sharma, N.; Gupta, A.P.; Kumar, V.; Sinha, A.K. RP-HPTLC determination and validation of vanillin and related phenolic compounds in accelerated solvent extract of Vanilla planifolia. J. Sep. Sci. 2007, 30, 3174–3180. [Google Scholar] [CrossRef]
  27. Foudah, A.I.; Alam, P.; Shakeel, F.; Alqasoumi, S.I.; Alqarni, M.H.; Yusufoglu, H.S. Eco-friendly RP-HPTLC method for determination of valerenic acid in methanolic extract of Valeriana officinalis and commercial herbal products. Lat. Am. J. Pharm. 2020, 39, 420–424. [Google Scholar]
  28. Alqarni, M.H.; Alam, P.; Foudah, A.I.; Muharram, M.M.; Shakeel, F. Combining normal/reversed-phase HPTLC with univariate calibration for the quantification with traditional ultrasound-assisted extracts of various food spices of Piper nigrum L. under green analytical chemistry viewpoint. Molecules 2021, 26, E732. [Google Scholar] [CrossRef] [PubMed]
  29. Foudah, A.I.; Shakeel, F.; Yusufoglu, H.S.; Ross, S.A.; Alam, P. Simultaneous determination of 6-shogaol and 6-gingerol in various ginger (Zingiber officinale Roscoe) extracts and commercial formulations using a green RP-HPTLC-densitometry method. Foods 2020, 9, E1136. [Google Scholar] [CrossRef]
  30. Nowak, P.M.; Koscielniak, P. What color is your method? Adaptation of the RGB additive color model to analytical method evaluation. Anal. Chem. 2019, 91, 10343–10352. [Google Scholar] [CrossRef]
  31. Duan, X.; Liu, X.; Dong, Y.; Yang, J.; Zhang, J.; He, S.; Yang, F.; Wang, Z.; Dong, Y. A green HPLC method for determination of nine sulfonamides in milk and beef, and its greenness assessment with analytical eco-scale and greenness profile. J. AOAC Int. 2020, 103, 1181–1189. [Google Scholar] [CrossRef]
  32. Pena-Pereira, F.; Wojnowski, W.; Tobiszewski, M. AGREE-Analytical GREEnness metric approach and software. Anal. Chem. 2020, 92, 10076–10082. [Google Scholar] [CrossRef]
  33. Foudah, A.I.; Shakeel, F.; Alqarni, M.H.; Alam, P. A rapid and sensitive stability-indicating green RP-HPTLC method for the quantitation of flibanserin compared to green NP-HPTLC method: Validation studies and greenness assessment. Microchem. J. 2021, 164, E105960. [Google Scholar] [CrossRef]
  34. Alam, P.; Salem-Bekhit, M.M.; Al-Joufi, F.A.; Alqarni, M.H.; Shakeel, F. Quantitative analysis of cabozantinib in pharmaceutical dosage forms using green RP-HPTLC and green NP-HPTLC methods: A comparative evaluation. Sustain. Chem. Pharm. 2021, 21, E100413. [Google Scholar] [CrossRef]
  35. International Conference on Harmonization (ICH). Q2 (R1): Validation of Analytical Procedures–Text and Methodology; International Conference on Harmonization: Geneva, Switzerland, 2005. [Google Scholar]
  36. Escandar, G.M.; Goicoechea, H.C.; Pena, A.M.D.L.; Olivieri, A.C. Second- and higher-order data generation and calibration: A tutorial. Anal. Chim. Acta 2014, 806, 8–26. [Google Scholar] [CrossRef]
  37. Mazivila, S.J.; Ricardo, I.A.; Leitao, J.M.M.; da Silva, J.C.J.E. A review on advanced oxidation process: From classical to new perspectives coupled to two- and multi-way strategies to monitor degradation of contaminants in environmental samples. Trends Environ. Anal. Chem. 2019, 24, E00072. [Google Scholar] [CrossRef]
  38. Patel, D.B.; Patel, N.J.; Patel, S.K.; Patel, P.U. Validated stability indicating HPTLC method for the determination of dutasteride in pharmaceutical dosage forms. Chromatogr. Res. Int. 2011, 2011, E278923. [Google Scholar] [CrossRef] [Green Version]
  39. Hewala, I.I.; Bedair, M.M.; Shousha, S.M. New concept for HPTLC peak purity assessment and identification of drugs in multi-component mixtures. Talanta 2012, 88, 623–630. [Google Scholar] [CrossRef] [PubMed]
Figure 1. Representative spectrodensitograms of standard pterostilbene (PT) recorded using routine normal-phase high-performance thin-layer chromatography (HPTLC) and sustainable reversed-phase HPTLC techniques.
Processes 09 01305 g001
Figure 2. Overlaid spectrodensitograms of standard PT and PT in commercial formulation.
Processes 09 01305 g002
Figure 3. RP-HPTLC chromatograms of PT recorded after (A) acid-induced degradation, (B) base-induced degradation, (C) oxidative degradation, (D) thermal degradation, and (E) photodegradation of PT using the sustainable RP-HPTLC method.
Processes 09 01305 g003
Figure 4. Representative pictograms for analytical GREEnness (AGREE) scores for the routine normal-phase HPTLC and sustainable reversed-phase HPTLC techniques obtained using the AGREE approach.
Processes 09 01305 g004
Table 1. Results for least square regression analysis of pterostilbene (PT) for the routine normal-phase high-performance thin-layer chromatography (HPTLC) and the sustainable reversed-phase HPTLC techniques (mean ± SD; n = 6).
ParametersRoutine Normal-Phase HPTLCSustainable Reversed-Phase HPTLC
Linearity range (ng band−1)30–40010–1600
Regression equationy = 44.05x + 1855.30y = 47.97x + 487.40
R20.99410.9992
Slope ± SD44.05 ± 2.1847.97 ± 1.74
Intercept ± SD1855.30 ± 31.74487.40 ± 6.21
Standard error of slope0.800.71
Standard error of intercept12.962.53
95% confidence interval of slope40.22–47.8844.91–51.02
95% confidence interval of intercept1799.53–1911.06476.48–498.31
LOD ± SD (ng band−1)11.12 ± 0.373.51 ± 0.06
LOQ ± SD (ng band−1)33.36 ± 1.1110.53 ± 0.18
Table 2. System suitability parameters in terms of retention factor (Rf), asymmetry/tailing factor (As), and number of theoretical plates per meter (N m−1) of PT for the routine normal-phase HPTLC and the sustainable reversed-phase HPTLC techniques.
ParametersRoutine Normal-Phase HPTLCSustainable Reversed-Phase HPTLC
Rf0.620.60
As1.081.02
N m−143884784
Table 3. Measurement of accuracy of PT for the routine normal-phase HPTLC and sustainable reversed-phase HPTLC techniques (mean ± SD; n = 6).
Conc. (ng band−1)Conc. Found (ng band−1) ± SDRecovery (%)CV (%)
Routine normal-phase HPTLC
5045.21 ± 1.1290.422.47
150163.24 ± 3.76108.822.30
350332.78 ± 7.1695.082.15
Sustainable reversed-phase HPTLC
3030.21 ± 0.26100.700.86
500493.98 ± 2.7198.790.54
15001514.21 ± 7.91100.940.52
Table 4. Measurement of intra/interday precision of PT for the routine normal-phase HPTLC and the sustainable reversed-phase HPTLC techniques (mean ± SD; n = 6).
Conc.
(ng band−1)
Intraday PrecisionInterday Precision
Area ± SDStandard ErrorCV (%)Area ± SDStandard ErrorCV (%)
Routine normal-phase HPTLC
504008 ± 13454.713.343965 ± 13856.343.48
15012,878 ± 412168.233.1913,453 ± 452184.563.35
35017,672 ± 542221.313.0616,986 ± 564230.293.32
Sustainable reversed-phase HPTLC
302213 ± 124.890.542176 ± 145.710.64
50021,342 ± 8635.110.4022,521 ± 9840.010.43
150073,654 ± 12551.040.1672,876 ± 13354.300.18
Table 5. Results of robustness analysis after modifying the mobile compositions for the routine normal-phase HPTLC and the sustainable reversed-phase HPTLC techniques (mean ± SD; n = 6).
Conc.
(ng band−1)
Mobile Phase Composition (CHCl3-MeOH)Results
OriginalUsed Area ± SD% CVRf
Routine normal-phase HPTLC
92:8+2.012,982 ± 3983.060.60
15090:1090:100.013,654 ± 4062.970.62
88:12−2.014,321 ± 4232.950.64
Sustainable reversed-phase HPTLC
Mobile phase composition (EtOH-H2O)
82:18+2.022,981 ± 870.370.59
50080:2080:200.023,113 ± 930.400.60
78:22−2.023,541 ± 980.410.61
Table 6. Resulting data of selectivity/degradation studies of PT at various stress conditions for the sustainable RP-HPTLC method (mean ± SD; n = 3).
Stress ConditionNumber of Degradation Products (Rf)PT RfPT Remaining (ng band−1)PT Recovered (%)Peak Purity Index
1M HCl1 (0.74)0.60412.3082.461.02
1M NaOH1 (0.35)0.60496.4099.280.998
3% H2O22 (0.81, 0.83)0.60403.6080.721.04
Thermal00.60500.00100.000.999
Photolytic00.60500.00100.000.994
Publisher’s Note: MDPI stays neutral with regard to jurisdictional claims in published maps and institutional affiliations.

