
Effects of Biochar on Soil Aggregation and Distribution of Organic Carbon Fractions in Aggregates


1
Department of Soil and Water Conservation, National Pingtung University of Science and Technology, Pingtung 91201, Taiwan
2
Department of Nursing, MacKay Junior College of Medicine, Nursing and Management, Taipei 11260, Taiwan
3
Center for Sustainability Science, Academia Sinica, Taipei 11529, Taiwan
*
Author to whom correspondence should be addressed.
Processes 2021, 9(8), 1431; https://0-doi-org.brum.beds.ac.uk/10.3390/pr9081431
Submission received: 16 July 2021
/
Revised: 8 August 2021
/
Accepted: 16 August 2021
/
Published: 19 August 2021
(This article belongs to the Special Issue The Role of Biochar in Soil Remediation Processes)
Abstract
:Soil aggregates are among crucial factors for determining both the quality and erosion resistance of soils. Biochar is a soil amendment that has seen increasing use to improve specific soil properties, mainly the physical structure and the preserving capacity of water and nutrients, as well as sequestration of soil organic carbon. In this study, we applied the rice husk biochar (RHB) and cattle manure compost (COM) in a sandy loam rural soil, which is widely distributed in southern Taiwan, to investigate the combined effects of the biochar and compost on soil aggregation and dynamic change of organic carbon fractions. Through our incubation experiment, both biochar and compost could promote the soil aggregation after eight weeks incubation. The total amounts of macroaggregates (MaAs, >2.0 mm) and mesoaggregates (MeAs, 0.25–2.0 mm) increased by 1.3–9%. During aggregation processes, a considerably greater amount of the soil organic carbon was found to enrich mainly in MaAs and MeAs in all treatments. The COM addition in the soil further promotes organic carbon enrichment in microaggregates (MiAs, <0.25 mm) + fine particles and MeAs after incubation. Increasing labile organic C (LOC) fractions were significantly found in MaAs and MeAs during aggregation processes, whereas decreasing LOC fractions were found in MiAs. The input of fresh organic matter (RHB and COM) initial acts as binding agents in MiAs, and then further enhances the formation of MeAs and MaAs gradually. In conclusion, RHB promotes the physical protection of organic C by increasing soil aggregation and is hence a management option to enhance the C sequestration potential.
1. Introduction
Biochar is a solid product produced by pyrolyzing biomass under anaerobic condition [1]. Previous studies in various ecosystems have conducted to explore their effects on soil properties due to its porous structure, nutrient retention ability and suitable habitats for the growth of microbes and prebiotics [2,3,4,5,6]. Many studies also mentioned that the important biochar characteristics for soil mediation are high C content, large surface area, high pH, and degradation resistance [1,7,8]. Biochar not only influences on soil properties, such as enhancing soil water retention, cation exchange capacity (CEC), soil aggregation, and nutrient turnover [9,10,11], but also it could be considered as an efficient strategy for increasing soil organic matters (SOM) [1,9,12,13]. However, as biochar ages, its active aliphatic hydrocarbons are converted into low aromatic carbon, which affects its flocculation with soil particles [14] and the formation of soil aggregates. The mechanism whereby biochar promotes soil aggregation remains unclear and requires elucidation. Furthermore, it is still obscure for the transformation of soil organic carbon (SOC) fractions during soil aggregation. Therefore, so far, compost as a common organic fertilizer increases the contents of OC and nutrients [3,4], contributing to improved soil physicochemical properties [5,6]. However, the compost could not effectively maintain soil organic carbon and retain nutrients in soils due to their rapid decomposition. Jien et al. [4] also indicated that higher aggregate stability was found in co-application of biochar and manure compost than in compost only application. Jien et al. [3] indicated that application of biochar-based compost, particularly the biochar produced at high pyrolysis temperature, efficiently stabilized and sequestered carbon in soils than biochar or compost alone application.
Soil aggregates have been widely recognized as one of the optimum sinks for storing and protecting SOM due to their hierarchical structure and sequential turnover [15,16]. Within this structure, aggregate turnover rate is directly related to SOM dynamics [17]. C-rich young organic matter residues form and stabilize MaAs (≥250 μm), and MiAs are induced within MaAs [15,18]. Factors affecting soil aggregation and the mean weight diameter (MWD) of soil include organic matter content, soil colloid, soil texture, canopy cover, and biological activity. These factors directly affect the formation and growth of soil aggregates. In addition, applying both compost and biochar can increase SOM and substantially improve the soil physical properties. This effect is particularly noticeable in soils with low SOM content. In wet conditions, heavily textured soils become poorly drained muddy masses, whereas they are hard as bricks, fracture, fail to infiltrate, making cultivation difficult in the dry seasons. The addition of biochar or other organic materials like compost could significantly improve these physical properties, such as porosity, bulk density and aggregate stability [2].
Improving soil aggregation could effectively increase SOM and promote microbial growth in soils [19,20]. Soil aggregates are responsible for SOM physical protection and chemical mechanism stability by the interactions of fragmented organic matter within the fine soil particles on mineral surfaces [15,16]. We, therefore, assume that organic matter occluded in the microaggregates is physically protected and inaccessible to microorganisms. Enhanced stable SOC storage mainly depends on the confinement role of microaggregate-associated C [17]. Microbial biomass carbon (MBC) in soils is liable to changes in temperature and humidity [21]. The organic carbon (OC) released by compost also alters the community and activity of soil microbes, thereby affecting the stability of soil aggregates [22].
Given this background, we aimed to improve soil structures using rice husk biochar (RHB) and compost (COM) to increase OC content in soils and facilitate soil flocculation to form stable aggregates. We investigated the interaction of biochar structure with the compost, soil particles, and soil aggregates. We also evaluated the feasibility of applying biochar in agricultural soils. We deduced the formation mechanism of soil aggregates after biochar and compost application according to our findings.
2. Materials and Methods
2.1. Studied Soil
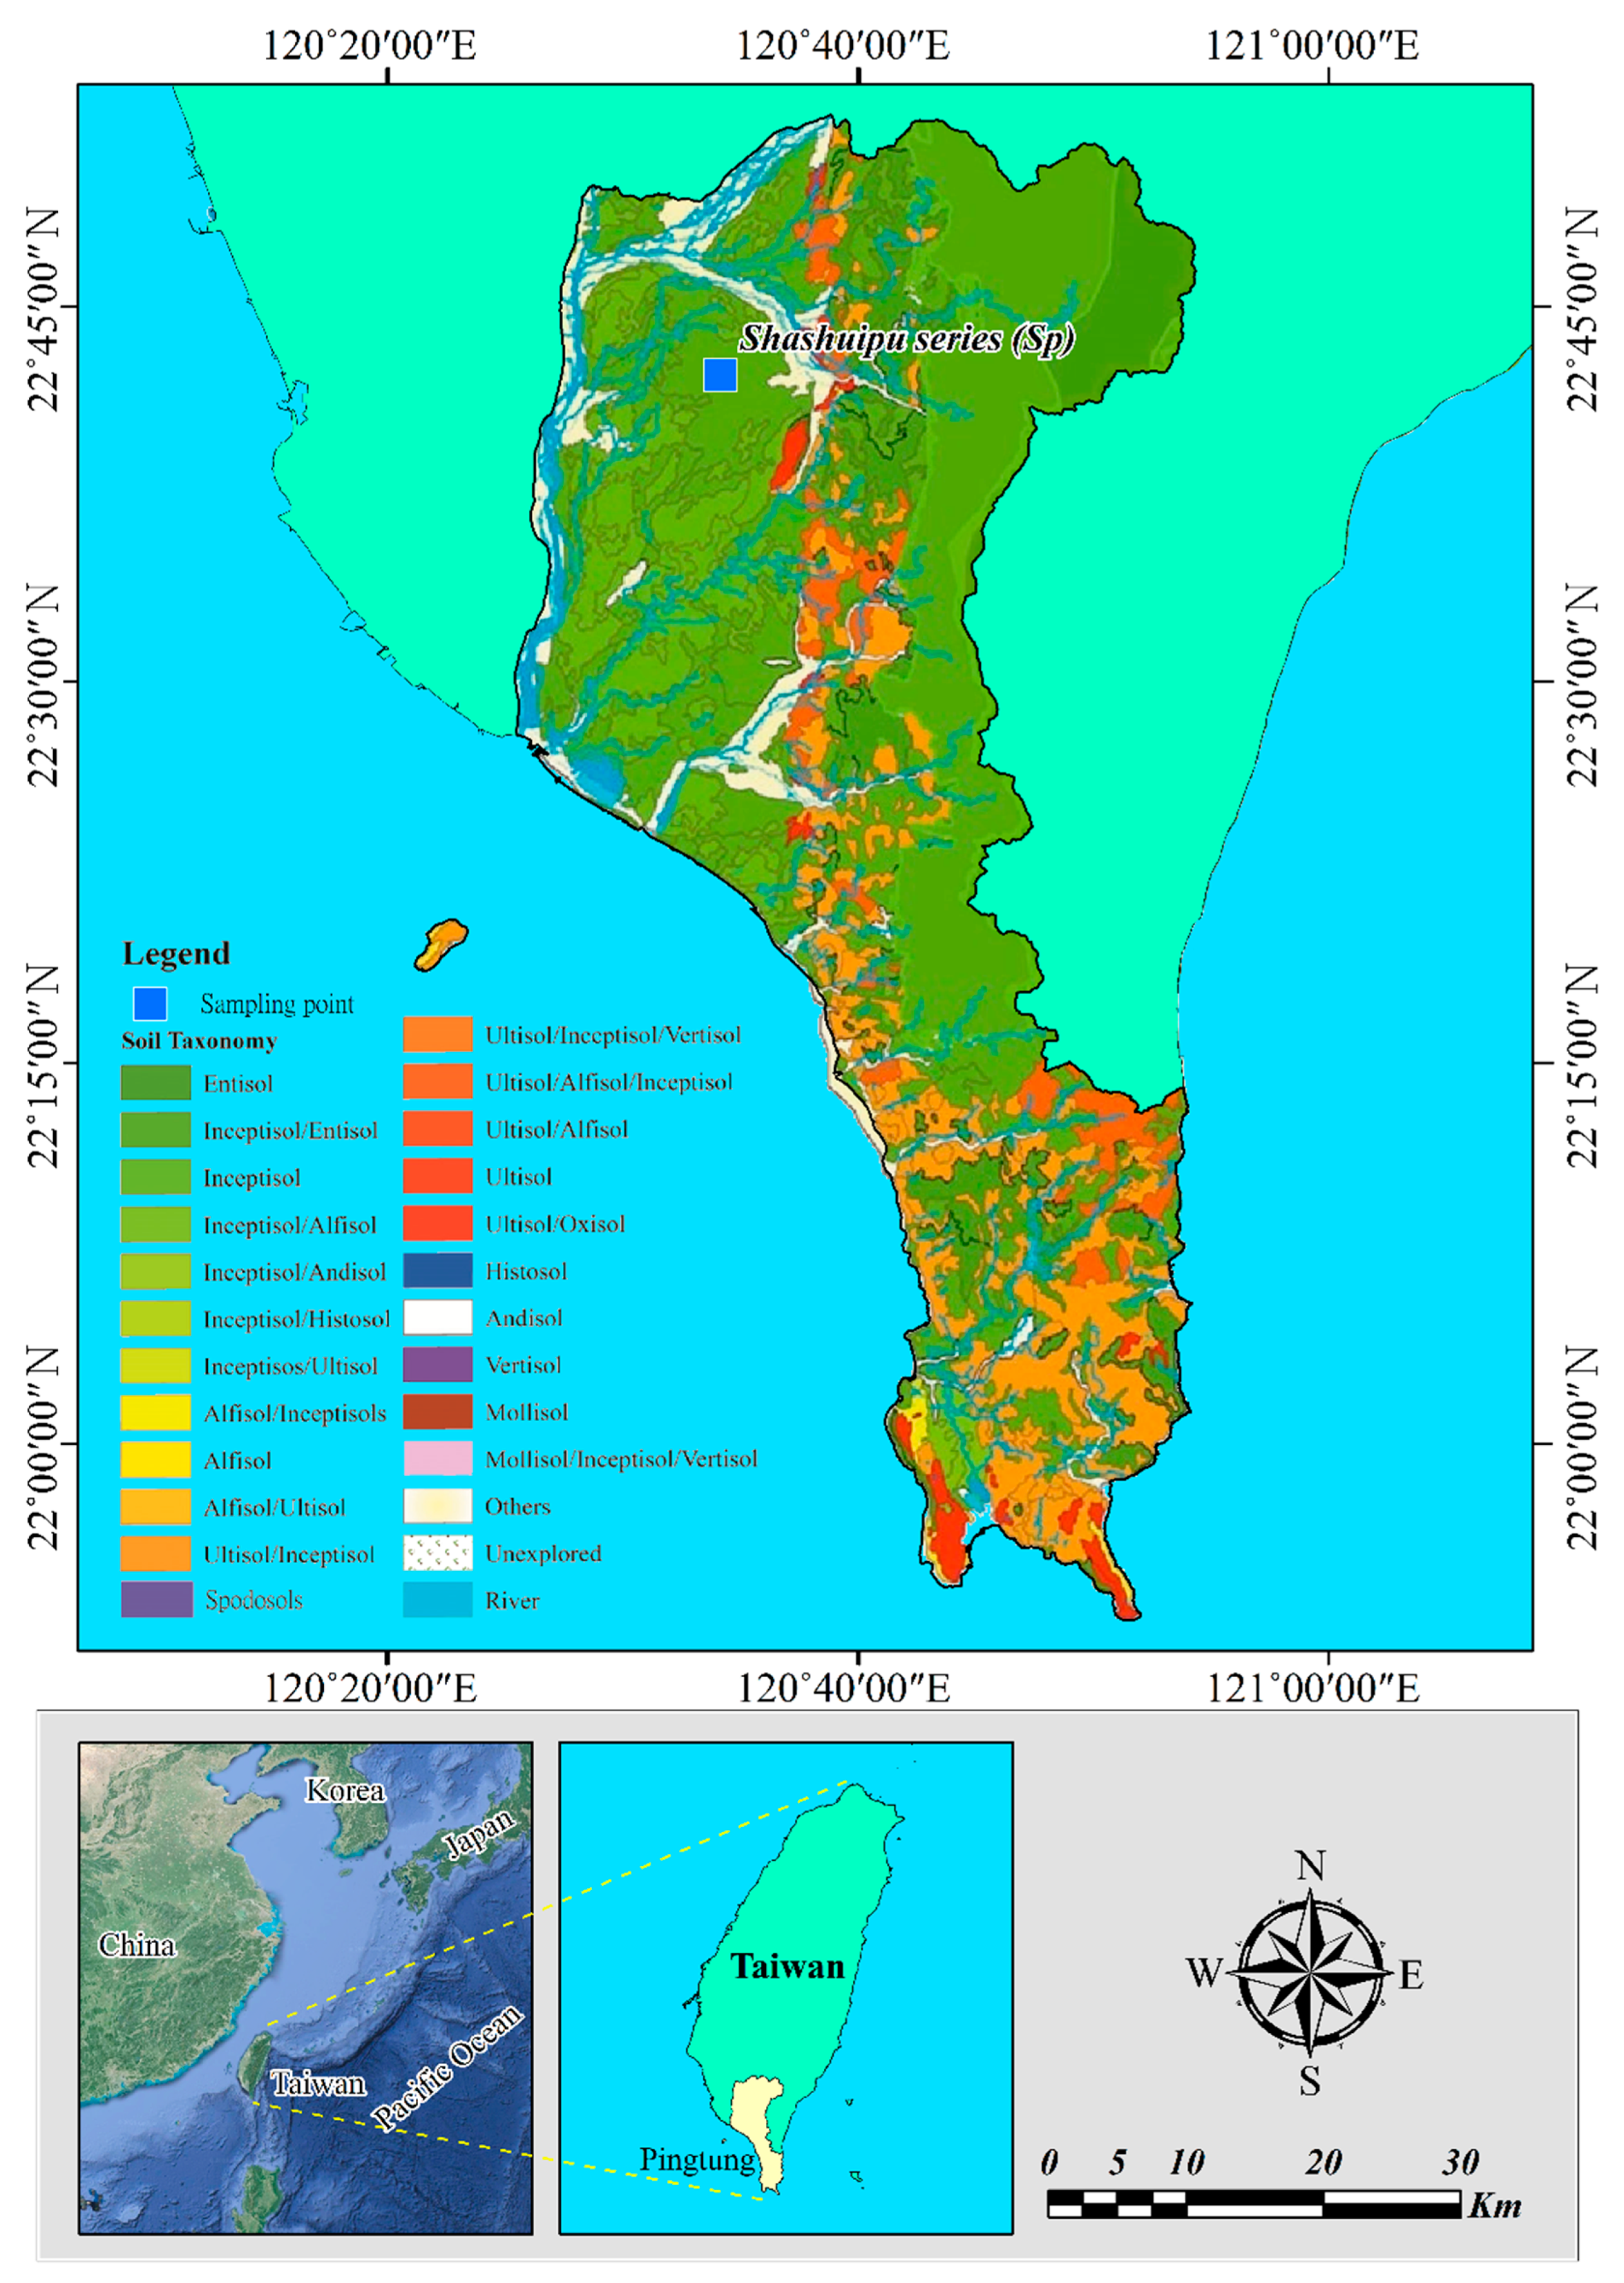
The studied soil lies in the township of Wandan in Pingtung County, Taiwan. Wandan has a climate of high temperatures (an average annual temperature of 34 °C) and heavy precipitation (average annual rainfall of 2500 mm). The topsoil in this region usually has a medium to coarse texture. Farm fields in Taiwan are widely distributed on alluvial plains, which feature fertile, deep, and thick sandy loam, conducive to farming. Thus, the studied topsoil is physically similar to the ordinary soil-based farmland of the west plain and riverside in Taiwan.
Sampling was conducted on the field with Shashuipu soil series (Figure 1) that could be classified as a Lithic Ustipsamment according to USDA Soil Taxonomy [23]. The field was less than 5% in slope gradient, and it had a ground coverage rate of up to 95% and a canopy cover of 10%. Its land use was for betel nut plantations. The topsoil (0–15 cm) was collected with no gravel followed by air-dry, grounding to pass through a 2-cm sieve for soil homogenous before aggregation experiment. The soils were well mixed with amendments for the subsequent incubation experiment. The properties of the studied soil related to the physical structure and carbon storage are shown in Table 1. Briefly, the soil is sandy loam with a low-level OC content of 0.6%.
2.2. Biochar and Compost
The rice husk biochar (RHB) was produced at the pyrolyzing temperature of 700 °C at Industrial Technology Research Institute (ITRI) of Taiwan. A commercial cattle manure compost (COM) that is highly fibrous and contains less nitrogen, phosphate, and potassium than the feces of chicken and pigs was used. The related properties of the RHB and the COM are shown in Table 1. The total carbon content of the RHB and COM was 95% and 30%, respectively. Nevertheless, both the contents of the OC and readily oxidizable carbon (ROC) in the RHB were much lower than the COM, indicating that the RHB is much more resistant to degradation than the COM.
2.3. Incubation Experiment
In this study, aggregation incubation experiment was carried out with homogenous mixing with 250 g soil, 2% (w/w) RHB and 20 t/ha (1%, w/w) of COM. The COM and biochar were grounded to pass through a 0.25-mm sieve, thereby increasing the area of contact with soil and facilitating soil incubation. Four incubation treatments were performed with three replications, including (a) control without the RHB and the COM, and soils with (b) 2% RHB, (c) 20 t/ha COM, and (d) 2% RHB + 20 t/ha compost (RHB + COM). To ensure the soil wetness, we adjusted it to 60% of the soil water-holding capacity daily throughout the incubation. Practically, the soil moisture contents were 20–28% for the four treatments. Samples (250 g) were carefully collected by planting trowel at Weeks 1, 4, and 8. For the control, the soil encountered no disturbance caused by the application of the RHB or COM, whereas RHB and COM application could break soil structures initially.
2.4. Measuring the Stability of Soil Aggregates through Wet Sieving
Wet sieving, which simulates water infiltration after precipitation, was used to analyze soil aggregates. The soil left at each sieve layer (2 mm, 1 mm, 0.5 mm, 0.25 mm, and 0.104 mm) was weighted followed by evaluation of the MWD, whereby soil aggregate stability and soil erosion resistance are determined. The soil aggregates were categorized as macroaggregates (MaAs) (>2.0 mm), mesoaggregates (MeAs) (0.25–2.0 mm), and microaggregates (MiAs) + fine particles (<0.25 mm) [24]. After weighting, aggregates on each sieve layer were retained for use later in the analyses of OC and other carbon fractions.
2.5. Measuring OC Content through Wet Oxidation
Wet oxidation was conducted to calculate organic matter content in the soil, and multistage wet sieving was conducted to estimate organic matter content in soil aggregates of different aggregate sizes. A soil sample of 0.5 g was passed through a sieve (<0.25 mm) and subsequently placed in an Erlenmeyer flask. A total of 20 mL of 0.5 N potassium dichromate and 10 mL of 95% concentrated sulfuric acid was added to the flask sequentially. After cooling, 100 mL of distilled water and 10 mL of 95% phosphoric acid were added. Before titration, four drops of ferroin indicator were added to it, after which 0.5 N ammonium iron (II) sulfate was titrated, and the titer of the compound was recorded followed by OC content estimation [25].
2.6. Water-Extractable Organic Carbon (WEOC)
Water-extractable organic carbon (WEOC) was obtained by shaking a 50-g soil sample with 200 mL ultrapure water at 120 revolutions per minute for 60 min at room temperature. Extraction solutions were then centrifuged for 15 min at 4600× g and filtered through 0.45-μm pore-size cellulose acetate filters [26]. Unlike the two other methods, the WEOC extraction method led to the breakdown of soil aggregates.
2.7. Readily Oxidizable Carbon
After soil aggregates of different sizes were oven-dried at 55 °C, 1 g of soil was placed in a 100-mL white flask, and 20 mL of 0.02 M potassium permanganate (KMnO4) was added to the flask. The flask was placed in a reciprocal shaking water bath for a 2-min shock and kept quiescent for 10 min or treated in a centrifuge (operating at 2000 rpm) for 5 min. The suspension in the upper layer of the flask was exhausted and filtered. Afterward, 0.5 mL of filtrate was collected and placed in a 50-mL volumetric flask followed by the addition of 50 mL of deionized water [27]. The diluted solutions were tested using an ultraviolet-visible spectrophotometer. The wavelength of the device was set at 550 nm, and the calibration curves of KMnO4 of 0, 10, 20, 30, 40, and 50 ppm were used to measure the content of readily oxidizable carbon (ROC) in soil.
2.8. Analyzing MBC
After wet sieving, two fresh soil samples of 10 g were taken from each layer of the sieves and then placed in a 25-mL beaker lying in a vacuum desiccator separately. One of the desiccators was evacuated to allow chloroform to evaporate and fill the soil pores, and the other proceeded without chloroform. The desiccators were then placed in a dark room at 25 ± 2 °C for 24 h using a thermostat chamber to reduce the effects of temperature and humidity on MBC. Both soil samples were extracted with 0.5 M potassium sulfate and placed in a reciprocal shaking water bath (operating at 200 rpm) for filtering in a 30-min shock. The filtrate was then collected. OC contents in the filtrates were estimated through wet oxidation [28].
2.9. Soil Micromorphology
The batch incubation set was conducted for micromorphological observations. Kubiena boxes (8 cm × 8 cm × 3 cm) were used to collect undisturbed blocks from the tested soils. The same solid mixture of each treatment was placed in a pot with a size larger than the Kubiena box; the incubation process described was then applied. After the 56-day (8 weeks) incubation, the soil blocks were collected using Kubiena boxes. Thin sections of 30-μm thickness were then prepared following air drying by using a microtome by Spectrum Petrographics Inc. (Vancouver, WA, USA). The thin sections were then used for observing the structure and distribution of organic matters among the soil particles under a polarized microscope (Leica DM EP, Morrisville, NC, USA).
2.10. Statistical Analysis
All treatments were conducted in triplicate during incubation. The triplicate data were subjected to mean separation analysis by using a one-way ANOVA test with a significance level of p = 0.05. Significant differences between mean values were identified using Duncan’s test. The statistical analyses were performed using IBM SPSS Statistics, version 22.
3. Results
3.1. Changes in the Weight of Soil Aggregates after Treatment with Biochar and Compost
Application of all amendments significantly promoted the formation and stabilization of MaAs (>2.0 mm) after incubation (after eight weeks) (p < 0.05) (Table A1). Figure 2 presents changes in the composition of aggregates of different particle sizes in the sandy loam soil with various incubation times after treating with biochar, compost and combination of RHB and COM. After eight weeks of incubation, the proportion of MaAs in control increased by 25.1% (Figure 2a), while the compositions of MeAs (0.25–2.0 mm) and the MiAs and fine particles (<0.25 mm) decreased by 4.9% and 20.2%, respectively. Notably, MaAs treated with biochar comprised the lowest proportion of <1% among all treatments at the 1st week, suggesting that biochar in the soils might not be prone to help to facilitate MaAs formation at the initial incubation period. However, the RHB-treated MaAs increased by 26% at the 4th week and by over 34% at the 8th, significantly higher than those of control, which indicates that the MiAs re-aggregated into MeAs or MaAs over the period gradually.
Different from the RHB treatment, compost addition could rapidly promote formation of MaAs and MeAs at the 1st week. After 4 and 8 weeks, MaAs progressively increased to 21.6% and 37.6%, respectively. However, MeAs decreased from 35.3% at the 4th week to 25.9% at the 8th week (Figure 2c) indicating probability of collapse of MeAs after four weeks since compost addition. In contrast to MaAs, MiAs proportion obviously decreased to 43.1% and 36.5% at Weeks 4 and 8, respectively. As shown in Figure 2d, the combined application of the RHB and compost did not promote aggregation at the 1st week either. However, the treatment caused the MeAs to surge in composition to 41% at the 4th and the MaAs to 45.6% at the 8th. Therefore, the soil aggregation could be more efficient under the combined treatment of the RHB and compost after four weeks than the other treatments.
3.2. Distribution and Classification of OC in Biochar and Compost-Treated Soil Aggregates
Through the formation of aggregates, most of OC were concentrated in the aggregates, particularly in MiAs fraction (Table 2). Table 2 indicates the accumulating status of OC in soil aggregates of different particle sizes under various treatments. After eight weeks of incubation, all the soil aggregates with different sizes revealed higher OC enrichment for the treatments of COM and RHB + COM. This phenomenon indicated that fresh added OC is strongly associated with the aggregation process in the soil, which was most noticeable in the treatments with the presence of compost.
OC in soils could be categorized operationally into different types: water extractable organic carbon (WEOC), readily oxidazable carbon (ROC), microbial mass carbon (MBC), and residual soil organic carbon (RSOC). WEOC, ROC, and MBC could be sequentially mineralized as being in the labile organic carbon (LOC) pool, whereas the RSOC is non-labile carbon and hardly undergoes biological decomposition. We also identified the distribution of these types of OC in various soil aggregates. During the wet sieve test, a portion of dissolved organic matter could lose. We estimated the recovery of the total OC of the four types to be higher than 98% compared to the total OC contents before the fractionation.
Figure 3 shows that the different parts of LOC for all treatments in the MaAs increased after eight weeks of incubation (Table A2). The LOC increased by 2.7%, 3.8%, 3.5%, and 9.4% for the control, RHB, compost, and the co-application of RHB and compost, respectively, particularly in proportion of MBC fraction. As the MaAs formed and enriched with more OC (Table 2 and Figure 3), these portions of OC transformed into more labile forms. The MBC largely contributed to the increases in LOC in the MaAs, indicating the critical role of soil microbes during the processes in forming MaAs and carbon enrichment.
Figure 4 shows changes in the composition of different OC types in the MeAs after incubation (Table A3). Only the two treatments involving the RHB addition revealed increases in LOC fractions by 6.1% to 3.5% (Figure 4b,d), whereas obvious increase proportion was found in MBC fraction. On the contrary, the differences in LOC fractions for the treatments of control and COM were not significant after eight weeks of incubation. Therefore, the organic matter encapsulated in the MeAs during its formation could be difficult to subject to biological decomposition. In addition, Table 2 presents that the MeAs were enriched with OC mainly by the compost addition, and therefore the compost could not only promote aggregation of MeAs but also enable the MeAs to protect OC from degradation.
Different from the MaAs and MeAs, the LOC fractions to OC of MiAs were higher than those of the MeAs and MaAs (Figure 3 and Figure 4) excluded RHB treatment (Table A4). MBC contributed most of the LOC fractions (23.1–38.4%), indicating that soil microbes were distributed mainly in the MiAs, especially in the initial stage of the incubation. As the MiAs transformed to MeAs and MaAs after eight weeks, MBC fractions in the MiAs significantly decreased except for the RHB treatment (Figure 5). This result indicates that soil microbes in MiAs re-allocated to MeAs and MaAs during the particle aggregation. In MiAs, the RHB was not likely to facilitate the activity of soil microbes initially, according to the comparison between biochar treatment and control and between compost treatment (Figure 5a,b) and co-application of the RHB and compost (Figure 5b,d). However, the proportion of MBC fraction was only found to increase in the RHB treatment after eight weeks. As a whole, all the treatments revealed higher MBC fractions than control after eight weeks of incubation, indicating the promoted activity of soil microbes after organic amendment addition.
4. Discussion
4.1. Effects of Biochar on the Formation of Soil Aggregates
In the present study, all treatments input with organic amendment obviously promote aggregation after eight weeks of incubation. Significant OC enrichment was found in MeAs and MiAs in the treatments of COM and RHB + COM, indicating probable physical protection of compost-derived C by aggregates. Tripathi et al. (2014) [29] have also pointed similar results, which was the application of fresh organic amendment (farm yard manure) resulted in OC accumulation in the fractions of MeAs and MaAs. As an important index of soil structure, aggregate formation physically protects SOM from biodegradation and, hence, promotes long-term carbon sequestration and soil structural stability [15]. Several studies have shown that MeAs and MaAs contain more C and N than MiAs [30,31,32] and contain organic matter characterized by more labile [19,33] and enriched in microbial biomass [34].
According to our results, even RHB seems not to effectively gather OC into aggregates; it could still provide well physical protection of natural or additional fresh OM (Figure 6) and more effectively facilitate microbial activity expressed by increasing proportion of MBC (Figure 3, Figure 4 and Figure 5) in each fraction of aggregate for the soil treated with RHB. Similar to our current results, Jien et al. (2021) [6] indicated that biochar in a highly weathered soil could increase microbial activity and diversity.
Our current results could reasonably assume that stable MeAs and MaAs shall consist of the association of <0.25 mm MiAs and primary particles during incubation period (Figure 7). Our other findings were also in accordance with the assumption that MeAs and MaAs had more labile OC (WEOC, ROC and MBC) contents during incubation, indicating more and more fresh OM were occluded at the moment of formation of MeAs and MaAs. Therefore, stable MaAs would also contain some additional organic matter (Figure 6d). Tobiašová et al. [35] indicated the similar outcomes with our results by evaluating LOC (WEOC and ROC) in the aggregate with different sizes. Based on our results, the RSOC seems to be transformed into MBC fraction obviously in MaAs and MeAs, which implied that the susceptible fresh OM might be occluded during formation process of larger aggregates. In addition, the larger carbon contents in stable MaAs were due to young organic carbon which was responsible for MaAs stability [36]. The application of organic amendments (added fresh OM) might induce the decomposition of OM where residual roots, hyphae and poly saccharides bind mineral particles into MiAs and then the MiAs bind to form C-enriched MeAs or MaAs [37,38]. Fan et al. (2013) [14] further indicated that soil aggregates grow up layer-by-layer, and eventually form MaAs. They pointed that the content of aliphatic-C was significantly greater in aggregate external layers than in internal layers where aromatic-C was dominant. Regarding transformation of OC fractionations in the MiA + fine particles, the MBC seems to be significantly transformed into RSOC, which illustrated that OM in the MiAs might be well protected by biochar or phyllosilicates and resistant to attack by microorganism.
Moreover, our study suggested some differences among treatments of RHB, COM and RHB + COM during aggregate formation. At the beginning of incubation, the very low proportion of MaAs were only found in the treatments with RHB-treated soils (RHB and RHB-COM); however, after four weeks, MaAs increased significantly in proportion, particularly in the treatment of co-application. The result implicated that the RHB seems not to instantly promote formation of MaAs. The reasons could be deduced as follows: (1) the size of biochar we incorporated into the soil; (2) the biochar experienced with relatively strongly charring, especially at higher temperature, to induce changes of their surface functional groups. Our previous study [39] have presented that the RHB pyrolized with high temperate (≥400 °C) might be characterized by aromatic C in their functional groups. Lei and Zhang (2013) [40] also indicated that the increased content of aromatic C of a strongly charred biochar resulted in low reactivity and transformation rate, leading to little formation of functional groups, and thus less potential for interactions with minerals to form aggregates [41]. The results conducted by Rabbi et al. (2015) [42] also showed that SOM fractions in MaAs had greater O-alkyl carbon but lower aromatic carbon content compared to that of SOM fractions in MiAs. This further implied that biochar characterized by aromatic C groups was prone to lead to the formation of MiAs in the biochar-amended soil. This might be the reason that MaAs could not quickly form at the initial incubation in this study, and this situation was in accordance of the results of Wiesmeier et al. (2012) [33].
4.2. Formation Mechanism of Soil Aggregation
Based on our findings, we developed a conceptual model that links the physical protection of SOC and soil aggregate formation after application of biochar and compost. Figure 6 shows polarizing microscope images of the respective microstructures of soil aggregates with various treatments. The findings showed both the aggregation improvement and microstructure change under the treatments with the RHB and compost. Based on the analytic and the observational results of this experiment, the mechanism underlying soil aggregation was proposed and illustrated in Figure 7. This mechanism could involve three steps. First, clay and silt particles and a small amount of OC interacted to form the MiAs distributed uniformly in the soil during incubation. Second, as incubation time increased, MiAs merged with clay particles and the soil OC into more structurally stable MeAs; meanwhile, OC embedded in the MeAs gradually became non-labile. Third, MeAs combined with organic matters into MaAs by eight weeks of incubation, which embedded more OC. RHB embedded in the MaAs were porous, thereby creating embedding positions that could protect the compost from microbial decomposition to extend its mineralization cycle and reduce its frequency of usage. During these processes, soil microbes tended to re-allocate along with the aggregation from MiAs to MaAs, indicating that soil microbes, as affected by organic carbon application and protective effect of particle aggregation, play a critical role in particle aggregation.
Consequently, MiAs at a lower hierarchical order possessed less labile OM between the particles and aggregates that comprise a higher order [33]. The MaAs are therefore generally less stable than MiAs. Moreover, residual roots, hyphae and other labile OM are transient binding agents which might be decomposed relatively quickly, resulting in a further decrease of MaAs stability [30]. The large input of OM in treatment of co-application of RHB and COM probably promotes the formation of soil aggregates in a hierarchical order associated with relatively poor macro-aggregate stabilities. As considering the OC distribution among the three fractions of aggregate (MaAs, MeAs and MiAs + fine particles), our results corroborate the aggregate hierarchy concept (bottom-up theory) of Tisdall and Oades (1982) [30].
5. Conclusions
The present study shows that the rice husk biochar (RHB) and the compost (COM) could significantly promote the aggregation of the sandy loam soil, helping to produce more MeAs and MaAs after eight weeks of incubation. Moreover, co-application with the RHB and the COM could not only facilitate soil aggregation but also the co-benefit effects on the capacity for carbon sequestration and increase efficiency of the compost. Our results presented that the SOC in the MiAs had a greater proportion of slow-C pool than in MeAs and MaAs, which implied that larger aggregates might derived from the MiAs initially, followed by occluding easily mineralized OC to form larger ones. Our findings support the development of soil amendments combining both RHB and COM, and provide a possible management strategy for degraded soils.
Author Contributions
Conceptualization and methodology, S.-H.J.; sample analysis, J.-Y.C.; writing—original draft preparation, S.-H.J. and M.-H.L.; writing—review and editing, E.-H.C. and C.-H.L. All authors have read and agreed to the published version of the manuscript.
Funding
This research was funded by the Ministry of Science and Technology of the R.O.C. (Grant number MOST 109-2313-B-020-006-).
Institutional Review Board Statement
Not applicable.
Informed Consent Statement
Not applicable.
Data Availability Statement
We would like to exclude this statement.
Acknowledgments
The authors are also grateful to Chuan-Chi Chien from the Industrial Technology Research Institute, Tainan, Taiwan, for providing the rice hull biochar.
Conflicts of Interest
The authors declare no conflict of interest.
Appendix A

Table A1.
The proportions of aggregates with different sizes in amended-soils.
| Time | MaAs (>2.0 mm) | MeAs (2.0–0.25 mm) | MiAs + Fine Particles (<0.25 mm) | |||||||||
|---|---|---|---|---|---|---|---|---|---|---|---|---|
| CK | RHB | COM | RHB + COM | CK | RHB | COM | RHB + COM | CK | RHB | COM | RHB + COM | |
| % | ||||||||||||
| 1w | 24.3 ± 4.42 bA * | 0.30 ± 0.02 cC | 9.20 ± 1.76 cB | 0.90 ± 0.11 cC | 14.5 ± 2.48 cB | 24.5 ± 2.36 aA | 28.3 ± 2.48 bA | 23.1 ± 3.61 bA | 61.2 ± 2.69 aB | 75.2 ± 1.93 aA | 62.5 ± 2.55 aB | 76.1 ± 3.01 aA |
| 4w | 20.6 ± 3.00 bB | 25.8 ± 1.45 bA | 21.6 ± 1.71 bB | 12.9 ± 1.55 bC | 35.9 ± 1.54 aB | 17.6 ± 1.41 bC | 35.3 ± 1.99 aB | 40.8 ± 2.34 aA | 43.5 ± 2.41 bB | 55.6 ± 2.63 bA | 43.1 ± 1.65 bB | 46.3 ± 2.91 bB |
| 8w | 32.4 ± 2.67 aC | 34.6 ± 2.70 aBC | 37.6 ± 2.12 aB | 45.6 ± 2.78 aA | 28.6 ± 1.23 bA | 27.7 ± 2.85 aAB | 25.9 ± 2.07 bAB | 23.5 ± 2.65 bB | 39.0 ± 2.25 bA | 37.7 ± 2.21 cA | 36.5 ± 2.46 cA | 30.9 ± 2.31 cB |
MiAs: macroaggregates (MaAs, >2.0 mm); MeAs: mesoaggregates (MeAs, 2.0–0.25 mm); MiA: microaggregates (MiAs, <0.25 mm). * Lowercase letters represent comparisons between the same treatment at different days (p < 0.05); uppercase letters represent comparisons between different treatments on the same day (p < 0.05).
Table A2.
The contents of different organic carbon fractionations in macroaggregates (MaAs, >2.0 mm).
Table A2.
The contents of different organic carbon fractionations in macroaggregates (MaAs, >2.0 mm).
| Time | WEOC | ROC | MBC | RSOC | ||||||||||||
|---|---|---|---|---|---|---|---|---|---|---|---|---|---|---|---|---|
| CK | RHB | COM | RHB + COM | CK | RHB | COM | RHB + COM | CK | RHB | COM | RHB + COM | CK | RHB | COM | RHB + COM | |
| mg/kg | ||||||||||||||||
| 1w | 86.3 ± 11.0 bA * | 80.5 ± 10.0 bA | 94.8 ± 10.7 cA | 86.5 ± 5.19 bA | 267± 4.92 aA | 259 ± 16.3 aA | 246 ± 10.6 aA | 240 ± 29.1 bA | 466 ± 169 bA | 474 ± 129 bA | 351 ± 173 cA | 384 ± 88.7 bA | 7810 ± 1132 aA | 8133 ± 404 aA | 8783 ± 365 aA | 8893 ± 359 aA |
| 4w | 114 ± 16.6 bB | 125 ± 8.63 aB | 217 ± 25.7 aA | 195 ± 25.4 aA | 229 ± 19.1 bB | 251 ± 1.25 aA | 207 ± 12.4 bB | 223 ± 0.87 bB | 643 ± 97.3 abC | 907 ± 6.82 aB | 1241 ± 1.97 aA | 652 ± 79.9 bC | 7823 ± 215.0 aA | 7697 ± 1007 aA | 8183 ± 541 aA | 8653 ± 412 abA |
| 8w | 189 ± 24.9 aA | 63.1 ± 8.65 bB | 153 ± 7.17 bA | 177 ± 23.7 aA | 180 ± 19.1 cBC | 162 ± 12.7 bC | 205 ± 16.4 bB | 295 ± 28.3 aA | 846 ± 63.9 aA | 937 ± 218 aA | 746 ± 43.6 bA | 1181 ± 382 aA | 7780 ± 1019 aA | 7843 ± 805 aA | 9123 ± 1083 aA | 8187 ± 480 bA |
WEOC: water extractable organic carbon; ROC: readily oxidizable carbon; MBC: microbial biomass carbon; RSOC: residual soil organic carbon. * Lowercase letters represent comparisons between the same treatment at different days (p < 0.05); uppercase letters represent comparisons between different treatments on the same day (p < 0.05).
Table A3.
The contents of different organic carbon fractionations in mesoaggregates (MeAs, 2.0–0.25 mm).
Table A3.
The contents of different organic carbon fractionations in mesoaggregates (MeAs, 2.0–0.25 mm).
| Time | WEOC | ROC | MBC | RSOC | ||||||||||||
|---|---|---|---|---|---|---|---|---|---|---|---|---|---|---|---|---|
| CK | RHB | COM | RHB + COM | CK | RHB | COM | RHB + COM | CK | RHB | COM | RHB+COM | CK | RHB | COM | RHB + COM | |
| mg/kg | ||||||||||||||||
| 1w | 77.6 ± 5.38 cA * | 71.6 ± 11.0 bA | 84.9 ± 4.86 bA | 86.5 ± 13.3 aA | 267 ± 4.92 aA | 259 ± 16.3 aA | 246 ± 10.6 aA | 240 ± 29.1 aA | 466 ± 169 bA | 474 ± 129 bA | 350 ± 173 cA | 384 ± 88.8 cA | 7810 ± 1130 aA | 8133 ± 404 aA | 8783 ± 365 aA | 8893 ± 359 aA |
| 4w | 105 ± 7.63 bAB | 125 ± 28.8 aA | 79.1 ± 11.4 bB | 107 ± 21.4 aAB | 203 ± 9.78 bB | 260 ± 1.34 aA | 206 ± 5.51 bB | 175 ± 3.20 bC | 626 ± 75.8 abC | 933 ± 68.5 aB | 1320 ± 39.7 aA | 525 ± 22.5 bC | 7877 ± 380 aA | 7657 ± 748 aA | 8250 ± 702 aA | 8923 ± 725 aA |
| 8w | 144 ± 18.9 aA | 99.1 ± 17.2 abB | 113 ± 18. 6aAB | 108 ± 11.8 aB | 189 ± 11.6 bB | 198 ± 22.7 bB | 245 ± 10.9 aA | 246 ± 14.2 aA | 701 ± 30.4 aC | 963 ± 12.5 aA | 655 ± 41.0 bC | 846 ± 66.8 aB | 7960 ± 465 aAB | 7743 ± 814 aB | 9217 ± 730 aA | 8640 ± 673 aAB |
WEOC: water extractable organic carbon; ROC: readily oxidizable carbon; MBC: microbial biomass carbon; RSOC: residual soil organic carbon. * Lowercase letters represent comparisons between the same treatment at different days (p < 0.05); uppercase letters represent comparisons between different treatments on the same day (p < 0.05).
Table A4.
The contents of different organic carbon fractionations in microaggregates + fine particles (MiAs + fine particles, <0.25 mm).
Table A4.
The contents of different organic carbon fractionations in microaggregates + fine particles (MiAs + fine particles, <0.25 mm).
| Time | WEOC | ROC | MBC | RSOC | ||||||||||||
|---|---|---|---|---|---|---|---|---|---|---|---|---|---|---|---|---|
| CK | RHB | COM | RHB + COM | CK | RHB | COM | RHB + COM | CK | RHB | COM | RHB + COM | CK | RHB | COM | RHB + COM | |
| mg/kg | ||||||||||||||||
| 1w | 112 ± 6.22 bB * | 35.6 ± 1.62 bD | 208 ± 22.1 abA | 67.2 ± 4.40 cC | 181 ± 10.4 aB | 107 ± 20.1 bC | 293 ± 25.6 bA | 125 ± 24.0 cC | 1993 ± 558 aB | 465 ± 116 cC | 3639 ± 362 aA | 2440 ± 12.2 aB | 6343 ± 297 cC | 8343 ± 270 aA | 5337 ± 320 bD | 6977 ± 332 bB |
| 4w | 185 ± 10.0 aB | 134 ± 5.61 aC | 236 ± 16.2 aA | 243 ± 20.4 aA | 149 ± 11.3 bC | 143 ± 1.08 aC | 236 ± 5.22 cB | 253 ± 8.26 bA | 1225 ± 66.1 bB | 1769 ± 7.36 aA | 1852 ± 344 bA | 1225 ± 9.52 cB | 7250 ± 368 bB | 6930 ± 346 bB | 7523 ± 345 aAB | 8000 ± 351 aA |
| 8w | 179 ± 11.7 aA | 126 ± 7.37 aB | 174 ± 17.1 bA | 167 ± 13.5 bA | 108 ± 14.0 cC | 89.9 ± 4.80 bD | 399 ± 6.75 aA | 374± 5.02 aB | 665 ± 92.9 bC | 1009 ± 33.2 bB | 1483 ± 283 bA | 1712 ± 52.7 bA | 8040 ± 400 aA | 7780 ± 276 aA | 8170 ± 346 aA | 7587 ± 317 abA |
WEOC: water extractable organic carbon; ROC: readily oxidizable carbon; MBC: microbial biomass carbon; RSOC: residual soil organic carbon. * Lowercase letters represent comparisons between the same treatment at different days (p < 0.05); uppercase letters represent comparisons between different treatments on the same day (p < 0.05).
References
- Kimetu, J.M.; Lehmann, J. Stability and stabilisation of biochar and green manure in soil with different organic carbon contents. Aust. J. Soil Res. 2010, 48, 577–585. [Google Scholar] [CrossRef]
- Hseu, Z.Y.; Jien, S.H.; Chien, W.H.; Liou, R.C. Impacts of Biochar on Physical Properties and Erosion Potential of a Mudstone Slopeland Soil. Sci. World J. 2014, 2014, 602197. [Google Scholar] [CrossRef]
- Jien, S.H.; Wang, C.C.; Lee, C.H.; Lee, T.Y. Stabilization of organic matter by biochar application in compost-amended soils with contrasting pH and textures. Sustainability 2015, 7, 13317–13333. [Google Scholar] [CrossRef] [Green Version]
- Jien, S.H.; Chen, W.C.; Ok, Y.S.; Awad, Y.M.; Liao, C.S. Short-term biochar application induced variations in C and N mineralization in a compost-amended tropical soil. Environ. Sci. Pollut. Res. 2018, 25, 25715–25725. [Google Scholar] [CrossRef]
- Lee, C.H.; Wang, C.C.; Lin, H.H.; Lee, S.S.; Tsang, D.C.W.; Jien, S.H.; Ok, Y.S. In-situ biochar application conserves nutrients while simultaneously mitigating runoff and erosion of an Fe-oxide-enriched tropical soil. Sci. Total Environ. 2018, 619, 665–671. [Google Scholar] [CrossRef] [PubMed]
- Jien, S.H.; Kuo, Y.L.; Liao, C.S.; Wu, Y.T.; Igalavithana, A.D.; Tsang, D.C.W.; Ok, Y.S. Effects of field scale in situ biochar incorporation on soil environment in a tropical highly weathered soil. Environ. Pollut. 2021, 272, 116009. [Google Scholar] [CrossRef]
- Gul, S.; Whalen, J.K. Biochemical cycling of nitrogen and phosphorus in biochar-amended soils. Soil Biol. Biochem. 2016, 103, 1–15. [Google Scholar] [CrossRef]
- Pandian, K.; Subramaniayan, P.; Gnasekaran, P.; Chitraputhirapillai, S. Effect of biochar amendment on soil physical, chemical and biological properties and groundnut yield in rainfed Alfisol of semi-arid tropics. Arch. Agron. Soil Sci. 2016, 62, 1293–1310. [Google Scholar] [CrossRef]
- Du, Z.L.; Zhao, J.K.; Wang, Y.D.; Zhang, Q.Z. Biochar addition drives soil aggregation and carbon sequestration in aggregate fractions from an intensive agricultural system. Biochar A Sustain. Environ. 2017, 17, 581–589. [Google Scholar] [CrossRef]
- Zhang, Y.L.; Chen, H.; Bai, S.H.; Menke, C.; Zhang, M.Y.; Xu, Z.H. Interactive effects of biochar addition and elevated carbon dioxide concentration on soil carbon and nitrogen pools inmine spoil. J. Soils Sediments 2017, 17, 2400–2409. [Google Scholar] [CrossRef]
- Zhang, J.; Sun, C.; Liu, G.; Xue, S. Effects of long-term fertilisation on aggregates and dynamics of soil organic carbon in a semi-arid agro-ecosystem in China. PeerJ 2018, 6, e4758. [Google Scholar] [CrossRef] [PubMed]
- Gunina, A.; Kuzyakov, Y. Pathways of litter C by formation of aggregates and SOM density fractions: Implications from 13C natural abundance. Soil Biol. Biochem. 2014, 71, 95–104. [Google Scholar] [CrossRef]
- El-Naggar, A.; Awad, Y.M.; Tang, X.Y.; Liu, C.; Niazi, N.K.; Jien, S.H.; Tsang, D.C.W.; Song, H.C.; Ok, Y.S.; Lee, S.S. Biochar influences soil carbon pools and facilitates interactions with soil: A field investigation. Land Dev. Degrad. 2018, 29, 2162–2171. [Google Scholar] [CrossRef]
- Fan, R.; Yang, X.; Drury, C.F.; Guo, X.; Zhang, X. Distribution and stability of organic carbon in soil aggregate external and internal layers under three different land-use systems. Soil Sci. Soc. Am. J. 2013, 77, 1625–1635. [Google Scholar] [CrossRef]
- Six, J.; Elliott, E.T.; Paustian, K. Soil macroaggregate turnover and microaggregate formation: A mechanism for C sequestration under no-tillage agriculture. Soil Biol. Biochem. 2000, 32, 2099–2103. [Google Scholar] [CrossRef]
- Zheng, H.; Wang, X.; Luo, X.; Wang, Z.; Xing, B. Biochar-induced negative carbon mineralization priming effects in a coastal wetland soil: Roles of soil aggregation and microbial modulation. Sci. Total Environ. 2018, 610–611, 951–960. [Google Scholar] [CrossRef]
- Huang, R.; Tian, D.; Liu, J.; Lv, S.; He, X.; Gao, M. Responses of soil carbon pool and soil aggregates associated organic carbon to straw and straw-derived biochar addition in a dryland cropping mesocosm system. Agric. Ecosyst. Environ. 2018, 265, 576–586. [Google Scholar] [CrossRef]
- Oades, J.M. Soil organic matter and structural stability: Mechanisms and implications for management. Plant Soil 1984, 76, 319–337. [Google Scholar] [CrossRef]
- Awad, Y.M.; Blagodatskaya, E.; Ok, Y.S.; Kuzyakov, Y. Effects of polyacrylamide, biopolymer and biochar on the decomposition of 14C-labelled maize residues and on their stabilization in soil aggregates. Eur. J. Soil Sci. 2013, 64, 488–499. [Google Scholar] [CrossRef]
- Six, J.; Bossuyt, H.; De Gryze, S.; Denef, K. A history of research on the link between (micro) aggregates, soil biota, and soil organic matter dynamics. Soil Tillage Res. 2004, 79, 7–31. [Google Scholar] [CrossRef]
- Wang, F.E.; Chen, Y.X.; Tian, G.M.; Kumar, S.; He, Y.F.; Fu, Q.L.; Lin, Q. Microbial biomass carbon, nitrogen and phosphorus in the soil profiles of different vegetation covers established for soil rehabilitation in a red soil region of southeastern China. Nutr. Cycl. Agroecosyst. 2004, 68, 181–189. [Google Scholar] [CrossRef]
- Chen, K.; Peng, J.; Li, J.; Yang, Q.; Zhan, X.; Liu, N.; Han, X. Stabilization of soil aggregate and organic matter under the application of three organic resources and biochar-based compound fertilizer. J. Soils Sediments 2020, 20, 3633–3643. [Google Scholar] [CrossRef]
- Soil Survey Staff. Soil Taxonomy: A Basic System of Soil Classification for Making and Interpreting Soil Surveys, 2nd ed.; U.S. Department of Agriculture Handbook 436; Natural Resources Conservation Service, USDA: Washington, DC, USA, 1999.
- Yoder, R.E. A Direct Method of Aggregate Analysis of Soils and a Study of the Physical Nature of Erosion Losses. Agron. J. 1936, 28, 337–351. [Google Scholar] [CrossRef]
- Nelson, D.W.; Sommer, L.E. Total Carbon, Organic Carbon and Organic Matter. Methods of Soil Analysis, Part 2. Chemical and Microbiological Properties, 2nd ed.; ASA-SSSA, Madison; Wiley: Hoboken, NJ, USA, 1982; pp. 539–579. [Google Scholar] [CrossRef]
- Guigue, J.; Lévêque, J.; Mathieu, O.; Schmitt-Kopplin, P.; Lucio, M.; Arrouays, D.; Jolivet, C.; Dequiedt, S.; Chemidlin Prevost-Boure, N.; Ranjard, L. Water-extractable organic matter linked to soil physico-chemistry and microbiology at the regional scale. Soil Biol. Biochem. 2015, 84, 158–167. [Google Scholar] [CrossRef]
- Awale, R.; Chatterjee, A.; Franzen, D. Tillage and N-fertilizer influences on selected organic carbon fractions in a North Dakota silty clay soil. Soil Tillage Res. 2013, 134, 213–222. [Google Scholar] [CrossRef]
- Brookes, P.C.; Landman, A.; Pruden, G.; Jenkinson, D.S. Chloroform fumigation and release of soil nitrogen: A rapid direct extraction method to measure civrobial biomass nitrogen in soil. Soil Biol. Biochem. 1985, 17, 837–842. [Google Scholar] [CrossRef]
- Tripathi, R.; Nayak, A.K.; Bhattacharyya, P.; Shukla, A.K.; Shahid, M.; Raja, R.; Panda, B.B.; Mohanty, S.; Kumar, A.; Thilagam, V.K. Soil aggregation and distribution of carbon and nitrogen in different fractions after 41 years long-term fertilizer experiment in tropical rice-rice system. Geoderma 2014, 213, 280–286. [Google Scholar] [CrossRef]
- Tisdall, J.M.; Oades, J.M. Organic matter and water-stable aggregates in soils. Eur. J. Soil Sci. 1982, 33, 141–163. [Google Scholar] [CrossRef]
- Elliott, E.T. Aggregate Structure and Carbon, Nitrogen, and Phosphorus in Native and Cultivated Soils. Soil Sci. Soc. Am. J. 1986, 50, 627–633. [Google Scholar] [CrossRef]
- Cambardella, C.A.; Elliot, E.T. Carbon and nitrogen distributions in aggregates from cultivated and native grassland soils. Soil Sci. Soc. Am. J. 1993, 57, 1071–1076. [Google Scholar] [CrossRef] [Green Version]
- Wiesmeier, M.; Steffens, M.; Mueller, C.W.; Kölbl, A.; Reszkowska, A.; Peth, S.; Horn, R.; Kögel-Knabner, I. Aggregate stability and physical protection of soil organic carbon in semi-arid steppe soils. Eur. J. Soil Sci. 2012, 63, 22–31. [Google Scholar] [CrossRef]
- Gupta, V.V.S.R.; Germida, J.J. Distribution of microbial biomass and its activity in different soil aggregate size classes as affected by cultivation. Soil Biol. Biochem. 1988, 20, 777–786. [Google Scholar] [CrossRef]
- Tobiašová, E.; Barancíková, G.; Gömryová, E.; Makovníková, J.; Skalsky, R.; Halas, J.; Koco, S.; Tarasovicová, Z.; Takác, J.; Špaňo, M. Labile Forms of Carbon and Soil Aggregates. Soil Water Res. 2016, 11, 259–266. [Google Scholar] [CrossRef] [Green Version]
- Puget, P.; Chenu, C.; Balesdent, J. Total and young organic matter distributions in aggregates of silty cultivated soils. Eur. J. Soil Sci. 1995, 46, 449–459. [Google Scholar] [CrossRef]
- Aoyama, M.; Kumakura, N. Quantitative and qualitative changes of organic matter in an Ando soil induced by mineral fertilizer and cattle manure applications for 20 years. Soil Sci. Plant Nutr. 2001, 47, 241–252. [Google Scholar] [CrossRef]
- Sodhi, G.P.S.; Beri, V.; Benbi, D.K. Soil aggregation and distribution of carbon and nitrogen in different fractions under long-term application of compost in rice-wheat system. Soil Tillage Res. 2009, 103, 412–418. [Google Scholar] [CrossRef]
- Jien, S.H. Physical Characteristics of Biochars and Their Effects on Soil Physical Properties. Biochar Biomass Waste; Elsevier: Amsterdam, The Netherlands, 2019; pp. 21–35. [Google Scholar] [CrossRef]
- Lei, O.; Zhang, R. Effects of biochars derived from different feedstocks and pyrolysis temperatures on soil physical and hydraulic properties. J. Soils Sediments 2013, 13, 1561–1572. [Google Scholar] [CrossRef]
- Kuzyakov, Y.; Subbotina, I.; Chen, H.; Bogomolova, I.; Xu, X. Black carbon decomposition and incorporation into soil microbial biomass estimated by 14C labeling. Soil Biol. Biochem. 2009, 41, 210–219. [Google Scholar] [CrossRef]
- Rabbi, S.M.F.; Tighe, M.; Delgado-Baquerizo, M.; Cowie, A.; Robertson, F.; Dalal, R.; Page, K.; Crawford, D.; Wilson, B.R.; Schwenke, G.; et al. Climate and soil properties limit the positive effects of land use reversion on carbon storage in Eastern Australia. Sci. Rep. 2015, 5, 17866. [Google Scholar] [CrossRef] [Green Version]
Figure 1.
Sampling site of the Shashuipu soil series in Pingtung, Taiwan.

Figure 2.
Changes in the composition of aggregates in the soils treated with different organic matters: (a) control, (b) 2% RHB, (c) 20 t/ha compost, and (d) 2% RHB and 20 t/ha compost.
Figure 2.
Changes in the composition of aggregates in the soils treated with different organic matters: (a) control, (b) 2% RHB, (c) 20 t/ha compost, and (d) 2% RHB and 20 t/ha compost.

Figure 3.
Changes in the composition of different types of OC in MaAs treated with: (a) control, (b) 2% RHB, (c) 20 t/ha compost, and (d) 2% RHB and 20 t/ha compost. WEOC: water extraction organic carbon; ROC: readily oxidizable carbon; MBC: microbial biomass carbon; RSOC: residual soil organic carbon; LOC: labile organic carbon (WEOC + ROC + MBC).

Figure 4.
Changes in the composition of different types of OC in MeAs treated with: (a) control, (b) 2% RHB, (c) 20 t/ha compost, and (d) 2% RHB and 20 t/ha compost. WEOC: water extraction organic carbon; ROC: readily oxidizable carbon; MBC: microbial biomass carbon; RSOC: residual soil organic carbon; and LOC: labile organic carbon (WEOC + ROC + MBC).

Figure 5.
Changes in the composition of different types of OC in MiAs + fine particles treated with: (a) control, (b) 2% RHB, (c) 20 t/ha compost, and (d) 2% RHB and 20 t/ha compost. WEOC: water extraction organic carbon; ROC: readily oxidizable carbon; MBC: microbial biomass carbon; RSOC: residual soil organic carbon; LOC: labile organic carbon (WEOC + ROC + MBC).

Figure 6.
Microstructures of soil aggregates treated with biochar by using a polarized microscope (plane polarized light (PPL)): (a,b) the soil mixed with 2% RHB; (c,d): the soil mixed with 2% RHB and 20 tons/ha compost.
Figure 6.
Microstructures of soil aggregates treated with biochar by using a polarized microscope (plane polarized light (PPL)): (a,b) the soil mixed with 2% RHB; (c,d): the soil mixed with 2% RHB and 20 tons/ha compost.

Figure 7.
Illustration of soil aggregation after a soil sample was treated with the RHB and compost.
Figure 7.
Illustration of soil aggregation after a soil sample was treated with the RHB and compost.

Table 1.
Characteristics of the studied soil, biochar and compost in this study.
| Properties | Soil | RHB | COM |
|---|---|---|---|
| Sand (%) | 55 | - | - |
| Clay (%) | 14 | - | - |
| Slit (%) | 31 | - | - |
| Soil texture | Sandy loam | - | - |
| BD (g/cm3) | 1.45 | - | - |
| PD (g/cm3) | 2.68 | - | - |
| TC (%) | 3.0 | 95 | 30 |
| OC (%) | 0.6 | 0.15 | 28 |
| pH (1:2.5) | 6.3 | 9.6 | 7.9 |
| CaCO3 (%) | 0.27 | 0.44 | - |
| NH4+-N (mg N/kg) | 13.4 | 10.1 | 211 |
| NO3-N (mg N/kg) | 16.0 | 8.67 | 118 |
| TN (%) | 0.16 | 0.91 | 1.8 |
| ROC (%) | 0.06 | 0.31 | 2.29 |
| CEC (cmol(+)/kg) | 16 | 26 | 87 |
| Exc. K (cmol(+)/kg) | 2.4 | 18 | 64 |
RHB: rice husk biochar; COM: compost; BD: bulk density; PD: particle density; TC: total carbon contents; OC: organic carbon contents; TN: total nitrogen contents; ROC: readily oxidizable carbon; CEC: cation exchange capacity; Exc. K: exchangeable potassium.
Table 2.
Soil organic C contents of the soil and the aggregates for each size after incubation of 1 week and 8 weeks.
Table 2.
Soil organic C contents of the soil and the aggregates for each size after incubation of 1 week and 8 weeks.
| Treatments | Whole Soil | MaA (>2.0 mm) | MeA (2.0–0.25 mm) | MiA + Fine Particle (<0.25 mm) | |
|---|---|---|---|---|---|
| % | |||||
| 1 week | CK | 0.68 ± 0.07 aA | 0.78 ± 0.03 aA | 0.75 ± 0.02 aA | 0.22 ± 0.01 aA |
| RHB | 0.78 ± 0.04 aA | 0.89 ± 0.02 bA | 1.08 ± 0.10 bA | 0.27 ± 0.03 aA | |
| COM | 1.35 ± 0.01 bA | 0.95 ± 0.01 bA | 0.99 ± 0.06 bA | 0.32 ± 0.03 aA | |
| COM+RHB | 1.25 ± 0.07 bA | 0.96 ± 0.02 bA | 1.00 ± 0.08 bA | 0.39 ± 0.03 aA | |
| 8 weeks | CK | 0.54 ± 0.01 aB | 0.89 ± 0.09 aA | 0.92 ± 0.05 bB | 0.28 ± 0.02 aA |
| RHB | 0.76 ± 0.03 bA | 0.90 ± 0.02 aA | 0.91 ± 0.06 bA | 0.31 ± 0.04 aA | |
| COM | 0.91 ± 0.01 bB | 1.01 ± 0.08 aA | 1.34 ± 0.36 bB | 0.84 ± 0.04 bB | |
| COM+RHB | 1.06 ± 0.03 cB | 1.08 ± 0.02 aA | 1.24 ± 0.38 bB | 0.73 ± 0.09 bB | |
MaA: macroaggregate; MeA: mesoaggragate; MiA: microaggregate; CK: control; RHB: rice husk biochar; COM: compost; COM+RHB: co-application of compost and biochar. Different lower-case letters in the same column indicate significant differences among treatments in the same incubation time at the 0.05 probability level. Different upper-case letters in the same column indicate significant differences for the same treatment between the initial and post-incubation at the 0.05 probability level.
Publisher’s Note: MDPI stays neutral with regard to jurisdictional claims in published maps and institutional affiliations. |
© 2021 by the authors. Licensee MDPI, Basel, Switzerland. This article is an open access article distributed under the terms and conditions of the Creative Commons Attribution (CC BY) license (https://creativecommons.org/licenses/by/4.0/).
Share and Cite
MDPI and ACS Style
Lee, M.-H.; Chang, E.-H.; Lee, C.-H.; Chen, J.-Y.; Jien, S.-H. Effects of Biochar on Soil Aggregation and Distribution of Organic Carbon Fractions in Aggregates. Processes 2021, 9, 1431. https://0-doi-org.brum.beds.ac.uk/10.3390/pr9081431
AMA Style
Lee M-H, Chang E-H, Lee C-H, Chen J-Y, Jien S-H. Effects of Biochar on Soil Aggregation and Distribution of Organic Carbon Fractions in Aggregates. Processes. 2021; 9(8):1431. https://0-doi-org.brum.beds.ac.uk/10.3390/pr9081431
Chicago/Turabian StyleLee, Ming-Hsi, Ed-Haun Chang, Chia-Hsing Lee, Jyun-Yuan Chen, and Shih-Hao Jien. 2021. "Effects of Biochar on Soil Aggregation and Distribution of Organic Carbon Fractions in Aggregates" Processes 9, no. 8: 1431. https://0-doi-org.brum.beds.ac.uk/10.3390/pr9081431
Note that from the first issue of 2016, this journal uses article numbers instead of page numbers. See further details here.