1. Introduction
Glycerol is the main by-product in biodiesel manufacturing from fats and vegetable oils by transesterification. The high production of biodiesel generates enormous quantities of glycerol. Glycerol is considered as a “building block molecule” in the biorefinery strategy because of its participation in various types of chemical reactions and its conversion into a large number of value-added chemicals. This has been reported in several previous studies [
1,
2,
3,
4].
The catalytic aqueous-phase reforming of glycerol [
5,
6] and the catalytic hydrogenolysis of glycerol [
7,
8] are pressure processes with water in liquid phase that can generate a liquid product stream with value-added chemicals such as 1,2-propanediol, acetol, and ethylene glycol, among others.
For example, 1,2-propanediol (also called propylene glycol) is used in unsaturated polyester resins, functional fluids such as antifreeze (an alternative to ethylene glycol, which is partially toxic), melting and heat transfer, liquid detergents, tobacco humectant and also in areas such as pharmacology, the food industry and personal healthcare as well as in the production of paints and animal feed [
9]. Acetol is widely used to accelerate some reactions such as dehydrogenation, dehydration, oxidation and polymerization. It is also used to give odour to bread and as a substitute for sodium dithionite, used for turning dyes into water-soluble compounds [
10]. Finally, ethylene glycol is used as an antifreeze liquid in planes and cars, in addition to polyester manufacturing.
A substantial number of studies reported in the literature are focused on the development of catalysts for the conversion of glycerol into 1,2-propanediol [
11]. However, there are few studies of their separation from the aqueous solution. The separation and purification of these value-added chemicals from the aqueous solution is required in order that they can be commercialized.
Distillation is the conventional procedure for separation [
12]. The value-added chemicals are usually highly diluted in the aqueous solution. Because the normal boiling points of 1,2-propanediol, acetol and ethylene glycol are higher than that of water, separation by distillation involves high energy costs.
Adsorption is commonly used in industrial processes such as bioethanol production for the recovery and purification of this compound from fermentation broth [
13]. In the review of Zentou et al. adsorption is also considered as an alternative ethanol recovery technique, activated carbon being the most frequently used adsorbent [
14].
This work studies the separation by adsorption of value-added chemicals from aqueous solutions obtained by pressure processes such as catalytic aqueous phase reforming or catalytic hydrogenolysis for glycerol conversion.
A review of the literature about the separation of these compounds (ethylene glycol, acetol and 1,2-propanodiol) and glycerol from aqueous solutions by adsorption has shown that their adsorption onto activated carbon occurs through dispersion interactions. These dispersion interactions occur with the non-oxidized portions of the carbon surface, while oxidized functional groups and in which −OH groups promote surface-water and solute-water interactions, decreasing the solute’s uptake [
15]. However, there is no agreement about this mechanism in compounds with −OH groups. Some authors, who studied different compounds, consider that these oxidized groups could be the sites of adsorption and that the mechanism of adsorption is based on π-π interaction, hydrogen bonding and dispersion interaction between the solute and the surface [
16,
17,
18]. In addition, compounds with shorter length chains are expected to be less adsorbed due to their lower interaction with the surface, and it has been postulated that micropore volume provides most of the active sites [
17,
19,
20]. Yu et al. [
17] proposed that micropores might be the crucial factor for acetone adsorption over activated carbons. They determined high linear coefficients of both microporous surface area and micropore volume with adsorption amount. Peereboom et al. [
19] concluded that the quantities of 1,2-propanediol and glycerol adsorbed on activated carbons are related to the carbon micropore volume. Lin et al. [
20] review some works and reported that micropores were the major provider of adsorption sites and played a relevant role in the phenol adsorption on activated carbon.
Surface area is an important parameter because large surface areas can lead to a high adsorption capacity, regardless of whether the pore size increases [
20] or decreases [
21]. Furthermore, the molecule size of each adsorbate compound has a significant effect because of the possibility of being adsorbed in the smallest pores and its influence on the diffusion inside the pores [
22].
The relationship between all the above-mentioned factors and the adsorption capacity of activated carbon were investigated in this study in order to identify relevant parameters influencing the adsorption.
In the present work, activated carbon was chosen as the adsorbent due to its low cost and easy availability. Some works in the literature have reported that a thermal pre-treatment of activated carbon improves its adsorption capacity, creating a more hydrophobic surface by removing most of the oxygenated functional groups such as the carboxylic, hydroxyl, carbonyl, lactonic and phenolic groups [
15,
23].
Because of the scarcity of studies of compounds such as acetol and glycerol in activated carbon adsorption, this study has the purpose of determining adsorption isotherms in order to characterize the specific performance of each compound. In addition, two mixtures with the four compounds have been tested. To the best of our knowledge, no previous study of the adsorption of acetol and mixtures of these compounds on activated carbon has been reported. Moreover, in this study the thermal pre-treatment of activated carbon has been carried out with the aim of improving its adsorption capacity. The temperatures used in this thermal pre-treatment were 800, 850, 900, 950 and 1000 °C in order to know the effect of the thermal treatment on the adsorption properties of the activated carbon.
2. Material and Methods
2.1. Chemicals and Adsorbent
The chemicals used in the experiments were ethylene glycol (99% purity) purchased from Labkem (Dublin, Ireland); glycerol (99% purity) purchased from Panreac (Barcelona, Spain); acetol (90% purity) purchased from Aldrich Chemical (Burlington, MA, USA); and 1,2 propanediol (99.5% purity) purchased from Sigma Aldrich (St. Louis, MO, USA). Aqueous solutions were prepared using MiliQ water for analysis from Panreac Applichem (Barcelona, Spain).
Activated carbon, untreated (C3014-500G), from Sigma Aldrich was employed as adsorbent. The activated carbon has a particle size of 20–60 mesh (0.841–0.250 mm) and it was characterized by cryogen nitrogen adsorption and ultimate analysis. The
, which is the pH value at which the surface charge is zero, was also determined by batch adsorption experiments with water, varying the initial pH of the solution. More information can be found in Ferro-Garcia et al. [
24].
The thermal pre-treatment of the activated carbon was done in a stainless-steel column (8 mm internal diameter and 30 cm total height) in a HCV 56/12 furnace (Hobersal, Barcelona, Spain) with a
flow rate of 45 cm
3 (STP)/min. The temperature was raised from room temperature (25 °C) to 100 °C at a rate of 10 °C/min and kept at 100 °C for 24 h. It was then raised to the desired temperature at a rate of 10 °C/min and kept there for 24 h, following the method of Chinn and King [
15]. Thermal pre-treatment was done at 800, 850, 900, 950 and 1000 °C.
Thermally treated activated carbon was characterized by ultimate analysis, ash content and cryogen nitrogen adsorption. The ultimate analysis was carried out in a CHN628 system (LECO, St. Joseph, MI, USA) calibrated with appropriate methods to determine C, H, and N content. The ash content of the dried thermal pre-treated and commercial activated carbons was determined using the UNE-EN ISO 18122:2016 method. Finally, the oxygen content of the activated carbon was obtained by difference using Equation (1):
All activated carbons were characterised by cryogen nitrogen adsorption at 77.3 K in a ASAP 2020 V3.00 instrument (Micromeritics, Norcross, GA, USA). The surface area was obtained by the BET method, the micropore area and micropore volume were obtained by the t-Plot method, the pore volume was determined at single point desorption at P/P° of 0.994, and finally the BJH method was used in order to know the average pore diameter. The activated carbons were degasified prior to nitrogen adsorption. The procedure consisted of evacuation at 5 mmHg/s to 1.5 × 10⁻⁴ mmHg and held for 30 min, then a temperature ramp at 10 °C/min to 200 °C held for 300 min and, finally, cooling and backfilling.
2.2. Batch Experiments
Batch experiments were performed using the same methodology for three different objectives. The first was to determine the adsorption isotherms of the individual compounds (1,2-propanediol, ethylene glycol, glycerol and acetol). The second was to study the adsorption of mixtures. Finally, the third was to analyze the influence of the thermal pre-treatment.
All batch experiments were conducted in 50 mL beakers containing a 14 mL aqueous solution with a single compound (1,2-propanediol, ethylene glycol, glycerol or acetol) at concentrations from 0.06 to 1.5 M for all the studied compounds. The adsorbent was oven dried prior to use. The amount of dried adsorbent added to the aqueous solution was similar to that used by Peereboom et al. [
19], depending on the solute concentration. Thus, 1.125 g of adsorbent were used when the solute concentration was equal to or smaller than 0.75 M. For solute concentrations between 0.75 and 2 M, the amount of adsorbent employed was 2.25 g. The beakers were sealed with parafilm. The experiments were conducted using a SHHD1619AL orbital shaker (OHAUS, Parsippany, NJ, USA) at 160 rpm during 24 h at room temperature (25 °C). After the time of adsorption, the resulting aqueous and solid mixture was centrifugated in a Heraeus Megafuge 16 from ThermoFisher Scientific (Waltham, MA, USA) at 2000 rpm for 8 min, following the procedure employed by Chinn and King [
15]. The solid and liquid phases were then weighed, and the Total Organic Carbon (TOC) of the liquid phase was determined on a TOC-L CSH system (Shimadzu, Kyoto, Japan). Each batch adsorption experiment was performed in duplicate in order to study the repeatability of the experimental procedure.
Two mixtures of the four compounds were used. The first one contained 4 wt% glycerol, 2 wt% 1,2-propanediol, 1 wt% ethylene glycol and 1 wt% acetol. The second one was composed of 6 wt% glycerol, 2 wt% 1,2-propanediol, 0.5 wt% ethylene glycol and 0.25 wt% acetol. The composition of the mixtures was selected from the liquid product of glycerol hydrogenolysis [
25]. The experimental procedure was similar to that of the batch experiments with a single compound. Because the content of all the organic compounds was between 0.75 and 2 M, the amount of dried activated carbon used was 2.25 g. The analysis of the liquid phase after adsorption was carried out by an 7820A GC-FID system (Agilent, Santa Clara, CA, USA) which allows the amount of each compound to be quantified. 1-butanol was used as the internal standard. An HP-FFAP 19091F-105 capillary column (Agilent) was employed.
To study the performance of the activated carbon after the thermal pre-treatment, an aqueous solution containing 2 wt.% of 1,2-propanediol, which corresponds to 0.26 M, was mixed with 1.125 g of pre-treated activated carbon following the above procedure.
2.3. Adsorption Capacity and Isotherms
The constant volume hypothesis was not assumed because different volumes of the initial and final solutions were determined. It was considered that the centrifugation stage involves the release of all the liquid retained mechanically, so the liquid retained in the adsorbent was considered adsorbate. Equation (2) was employed in order to calculate the amount of compound retained in the activated carbon. This has been calculated from the difference between the original mass solute (
m0) and the carbon content in the aqueous solution, determined in ppm, using the TOC analyser:
where
represents the compound molar quantity adsorbed per kg of activated carbon (moL/kg AC);
TOC, the result in ppm (mass/mass);
(g), the mass of the final liquid phase;
MW, the molar weight of the compound analyzed;
, the number of carbons in the compound; and
, the mass of dry activated carbon in the experiment (kg).
Equation (3) allows us to calculate
CA (moL/L), the solute concentration at equilibrium, where
ρ (g/L) is the solution density:
All the data obtained from the single component adsorption experiments at 25 °C were modelled using both Langmuir and Freundlich isotherms to obtain adsorption constants, Equations (4) and (5) respectively:
CAS is the solute concentration in the adsorbent (moL/kg AC) and CA is the solute concentration at equilibrium (moL/L). For the Langmuir isotherm, Equation (4), coefficients and were obtained plotting experimental data as vs. , giving slope and an intercept . For the Freundlich isotherm, Equation (5), coefficients and were found by a least-squares linear regression of the experimental data as vs. to give slope and intercept .
2.4. Mixtures Adsorption
The activated carbon capacity was calculated for each of the four compounds in order to compare the behaviour in multicomponent adsorption compared to single-compound adsorption. In addition,
the percentage mass of the solute for each compound over the total solute in solution was calculated and contrasted with,
the percentage mass of the solute for each compound in the solid after the adsorption experiment to see if the activated carbon has a preference for any particular compound in the mixture. These two parameters were achieved using the following equations:
where
is the mass of each compound in the initial solution and
is the mass of each compound in the adsorbent.
Also, the mixtures adsorption was evaluated by Langmuir’s multicomponent adsorption model, described by the following equation:
where subscripts
i and
j are indices representing each compound in the system.
3. Results and Discussion
3.1. Adsorbent Characterization
Activated carbon was characterized using the methods described in
Section 2.1. Some parameters are summarized in
Table 1. The
of activated carbon was 10.08, from which it can be seen that for a pH lower than 10.08 the activated carbon surface has a positive charge and if the pH is higher the surface charge is negative [
20]. These results are compared with the solution and solute properties in order to provide some explanations about the adsorption mechanisms.
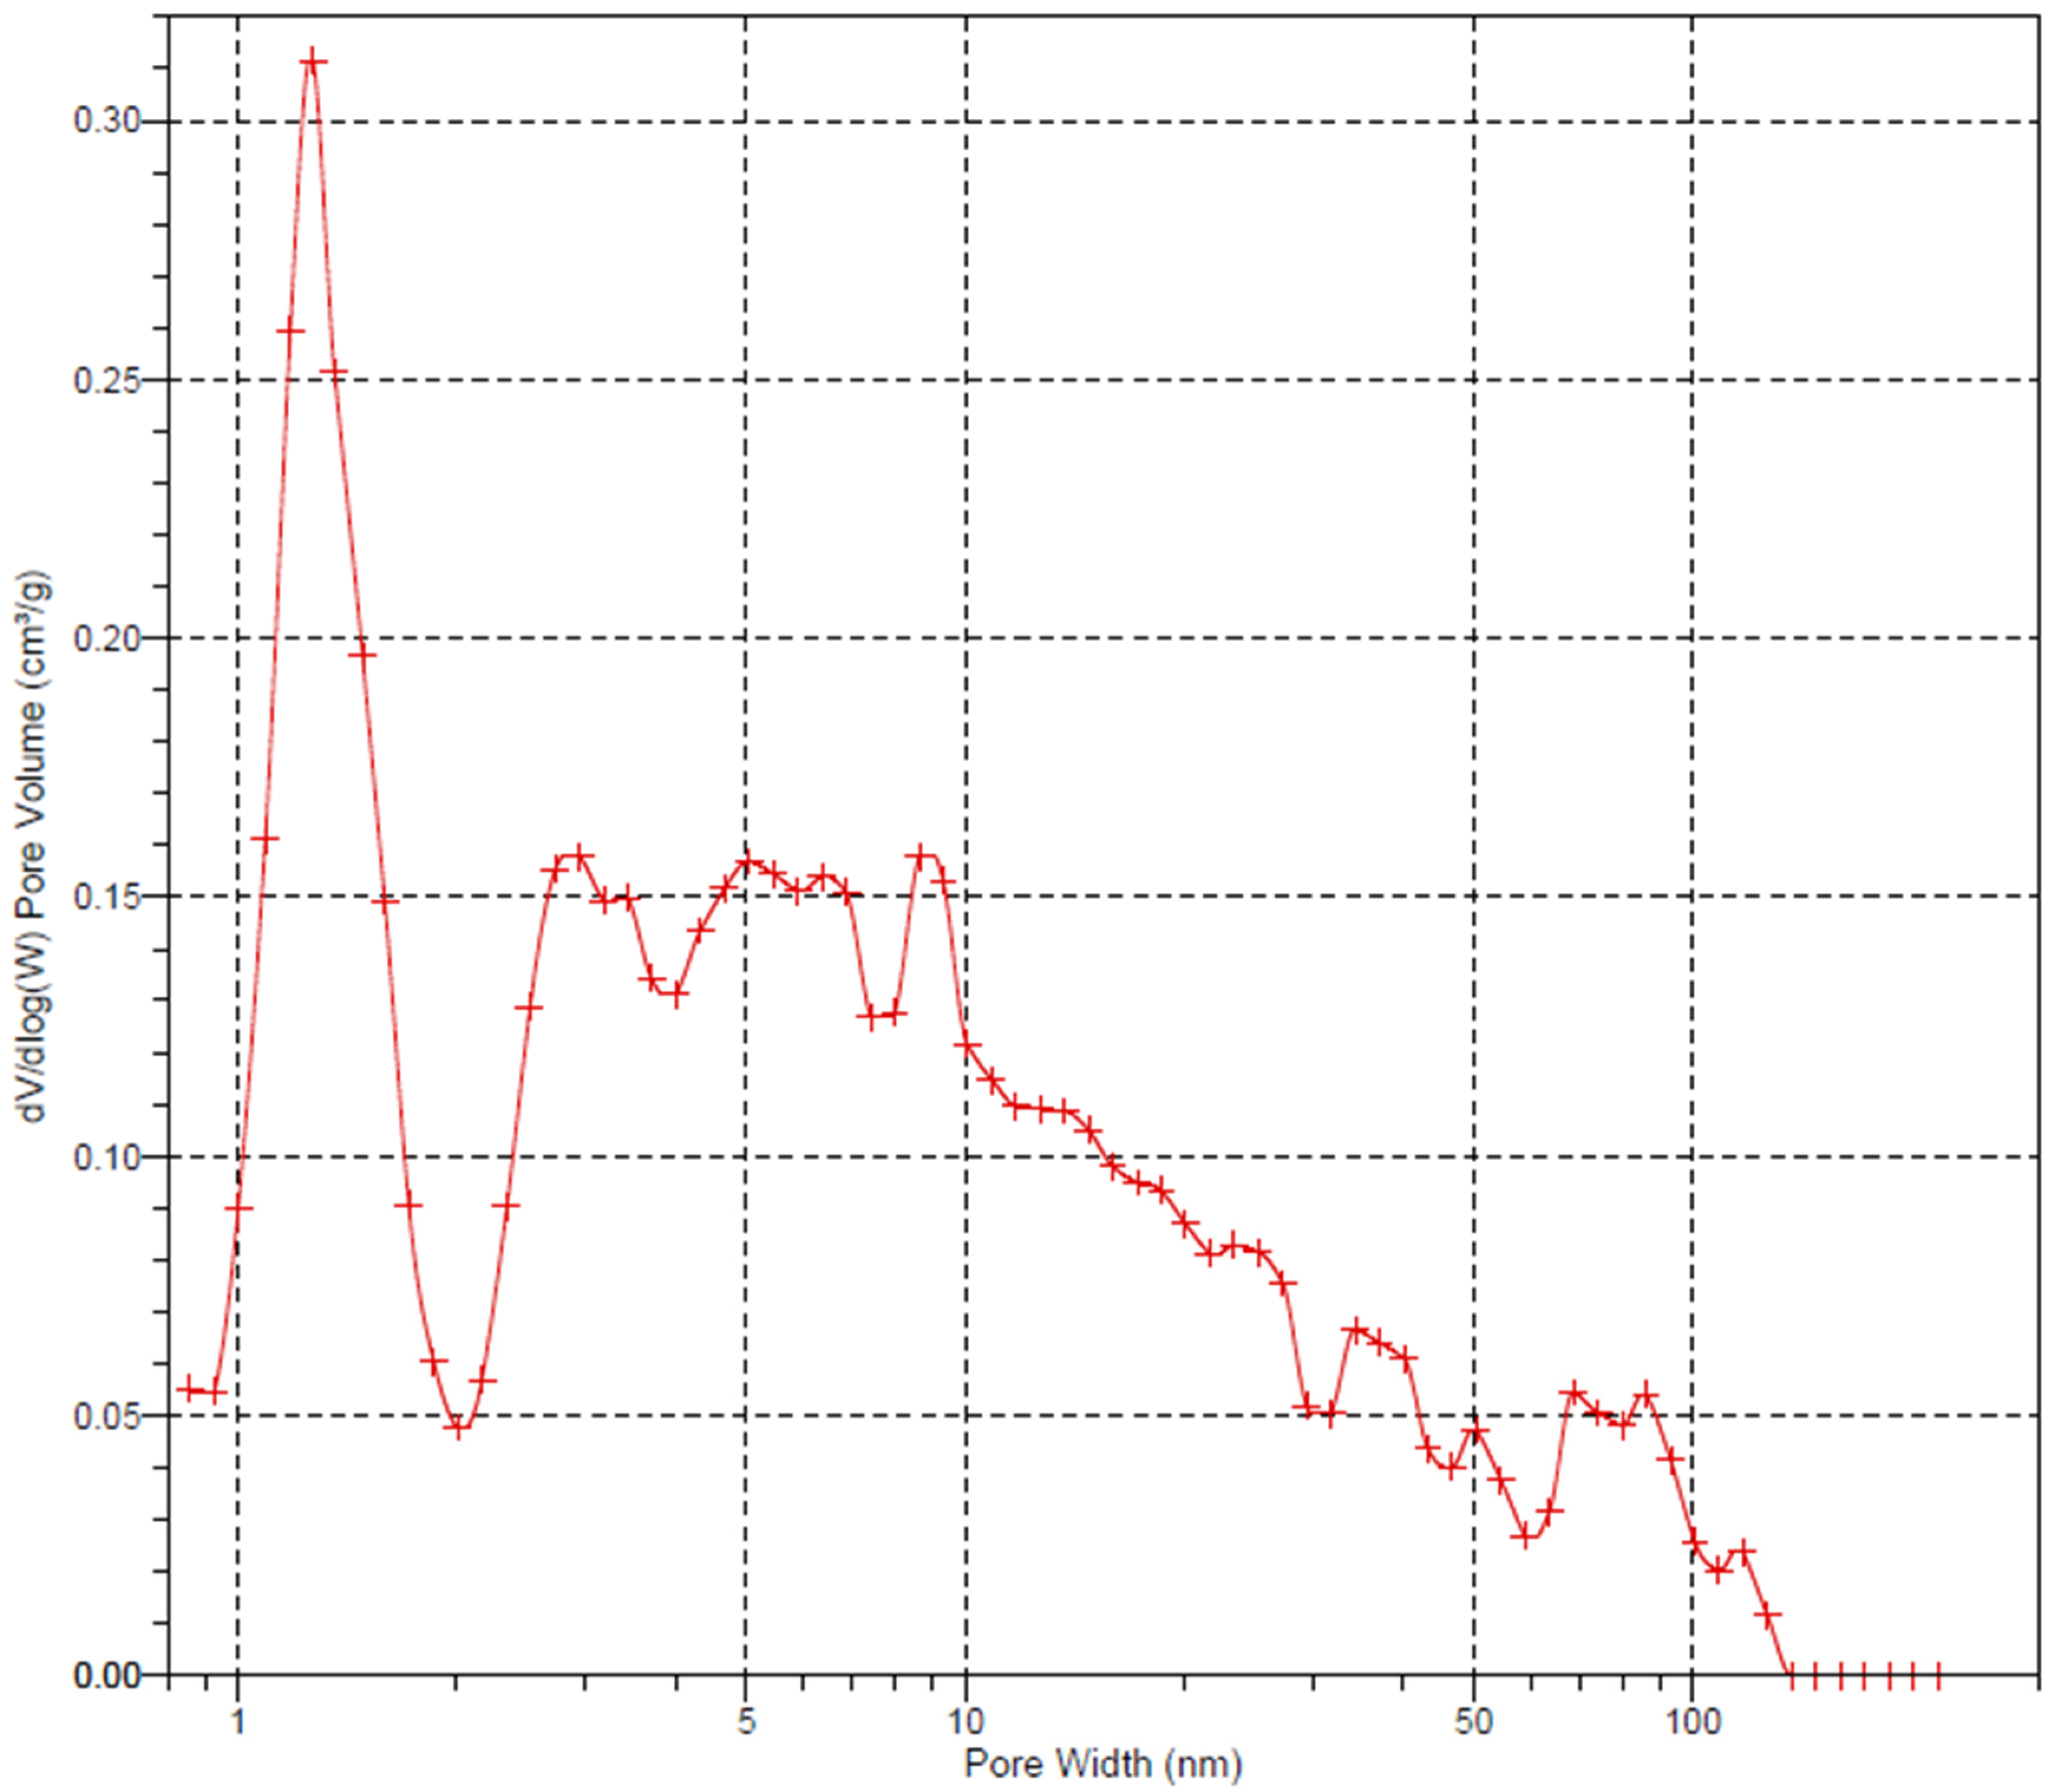
Figure 1 shows the pore size distribution by DFT model. There was a distribution with micropores around 1.3 nm and mesopores mainly from 2 to 30 nm.
Finally,
Table 2 shows the results of the ultimate analysis for the activated carbon, which shows an especially high ash content and a medium oxygen content compared with other activated carbons [
15].
3.2. Single-Compound Adsorption
Table 3 shows the summary of the coefficients from the adsorption isotherms for each compound, 1,2-propanediol, ethylene glycol, glycerol and acetol, in the concentration range from 0.06 to 1.5 M.
As can be seen, the Freundlich isotherm gives the best fit for all the compounds because the
values are higher for the fitting of the experimental data to this isotherm than to the Langmuir isotherm. However, the Langmuir isotherm also presents a good fitting with
values higher than 0.91 for all the compounds. The
n value from the Freundlich equation indicates that the relative distribution of energy sites depends on the nature and strength of the adsorption process. For example, the value of
n of the adsorption of 1,2-propanediol onto the activated carbon surface is 0.7106. In fact, this value refers to 71.06% of the active sites that have equal energy where adsorption take place [
21]. Ethylene glycol shows the highest value of
n, while acetol presents the lowest value.
From the Langmuir model it is obtained that acetol has the lowest
and ethylene glycol has the highest, with a difference of 206.30% from acetol. The difference between 1,2-propanediol and glycerol is about 5%, but we do not think that this difference is significant. Otherwise, the acetol value is about 40% less than the 1,2-propanediol and glycerol values. This parameter,
, constitutes the maximum concentration of compound in activated carbon, indicating that having a higher value implies a higher adsorption capacity. The value
from the Langmuir equation shows adsorbent-adsorbate interaction, in which a high value means a high adsorbent-adsorbate interaction [
24]. So, from
Table 3 it is obtained that acetol is the compound which has the highest interactions with the activated carbon.
Figure 2 shows the adsorption isotherms for 1,2 propanediol, glycerol, ethylene glycol and acetol and their respective experimental data at room temperature (25 °C). The fittings to Freundlich and Langmuir isotherms are included.
Figure 3 shows the experimental adsorption isotherms of the four individual compounds shown together for a better comparison. The experimental data have been fitted to the Freundlich isotherm. The figure shows that acetol is the most adsorbed compound when the solute concentration is lower than 1 M. In addition, the interactions of acetol with activated carbon indicate a more heterogeneous surface for the adsorption of this compound, due to the low
n value. Given these facts, it could be said that at the beginning acetol adsorption is promoted due to its higher interaction with the activated carbon surface, but then the effect of the heterogeneous sites of adsorption decreases the initial favourable behaviour. The high interaction between acetol and activated carbon could be due to the interaction with carbonyl groups over the carbon surface, as this takes place in acetone [
17]. It can be seen in
Figure 3 that in the solute concentration lower than 0.5 M there are few differences between the 1,2-propanediol, glycerol and ethylene glycol data, although ethylene glycol shows the lowest values.
Finally, 1,2-propanediol and glycerol have a similar behaviour but, due to its higher interaction with the activated carbon, 1,2-propanediol is slightly more adsorbed than glycerol. Glycerol shows the lowest adsorption data at solute concentrations higher than 1 M, except for acetol.
An analysis of these results suggests that ethylene glycol has low interactions with the surface, probably due to having the shortest chain length. However, this effect is not so significant.
Glycerol was expected to have a worse adsorption onto activated carbon than 1,2-propanediol due to the presence of three −OH groups. The higher extent of solvation of glycerol than 1,2-propanediol via hydrogen bonding can also explain this result [
19]. This behaviour was confirmed in
Figure 3 at solute concentrations higher than 1 M and in the
value. These slight differences in the adsorption behaviour of the compounds is not surprising given that the interactions between these molecules and the activated carbon seems to be similar [
26].
3.3. Understanding the Adsorption Mechanism
Some measurements have been made in order to determine the pH solutions of the individual compounds and their pKa values in order to explain the adsorption mechanism. The results, summarized in
Table 4, provide qualitative information about the pKa of the compounds. All the pKa values were obtained by pH measurement of a solution of 4 wt% of the desired compound with 40 mL volume using a pHmeter.
As can be seen in
Table 4, all four compounds have lower pH in solution than
, so that the activated carbon surface charge will be positive. Because the pH < pKa for the four compounds, this indicates that the compounds are not dissociated and therefore the adsorption process is not controlled by electrostatic interactions [
31]. Lin et al., found that the pH of a solution close to
increases adsorption due to the fact that surface electrostatic interactions on activated carbon were zero, and phenol remained in molecular forms making π-π dispersion interaction stronger. A decrease in the pH leads to a more positive charge of the activated carbon surface, decreasing the adsorption capacity [
20]. In this case, as compound’s pH is far from
, electrostatic interactions does not seem to have an influence in the process.
Kameda et al. proposed that urea and creatinine adsorption onto spherical activated carbon occurred because of a dipole-dipole interaction between the urea dipole and the surface on activated carbon. The porous surface can generate a dipole induced by the adsorbate, or oxygen groups from the adsorbent surface can participate [
32]. This hypothesis is thought to be more important than π-π dispersion interactions, because the latter interactions are more important in compounds with aromatic ring adsorption.
The dipole moments of the compounds are shown in
Table 4. The dipole moment of acetol was not found in the literature. However, it was estimated to be similar to the dipole moment of acetone (2.9 D), due to the presence of carbonyl group is relevant in the dipole moment. There are few differences among the compounds’ dipole moments. Nevertheless, acetol having the highest dipole moment, added to the influence of the functional groups, can explain why it has the highest adsorption capacity at concentrations below 1 M. In the case of glycerol, the higher value of its dipole moment than those of ethylene glycol and 1,2-propanediol is countered by having one −OH group more in its molecule. Glycerol is more hydrophilic than 1,2-propanediol and presents higher extent of solvation than 1,2-propanediol via hydrogen bonding [
19].
The molecular size of the compounds can also be seen in
Table 4. The mean size of micropores is 13 Å, which is a value close to the molecular size of the compounds. Ethylene glycol has the lowest value which can explain the shape of the isotherm as it can reach the smallest micropores. These adsorption sites have the highest diffusion resistance, so they are filled at higher concentrations. In addition, 1,2-propanediol adsorption can be promoted by having a small molecule size, decreasing the diffusion resistance, which is the highest resistance in activated carbon [
31]. Glycerol has the highest molecular size which could explain its lesser adsorption. However, the influence of this parameter is thought to be less important than the others discussed above.
3.4. Mixtures Adsorption
Table 5 presents the main results of the adsorption of the mixtures.
If activated carbon had the same behaviour with all four compounds, then the values from the first and second column,
M0i and
MSi, would be the same for all. However, as can be seen in
Table 5, this is not the case. The glycerol and ethylene glycol values decrease while the acetol and propylene glycol values increase, indicating that activated carbon has a slight selectivity for propylene glycol and acetol, both showing a similar increase.
The performance of activated carbon in multicomponent adsorption has been compared with the single-component adsorption described by Freundlich, as illustrated in
Figure 4.
Figure 4 shows that the adsorption capacity decreases when there are four compounds compared to just one compound. However, in the case of acetol and of propylene glycol, the adsorption performance is very similar to the isotherm. This explains the results shown in
Table 5, emphasizing the selectivity of activated carbon to acetol and propylene glycol. On the other hand, glycerol and ethylene glycol have the opposite behaviour for the same reason.
Figure 4 also shows that the adsorbent is less effective at removing solute in multicomponent adsorption than with one component, showing that there is a competitive adsorption and indicating that the mixture adsorption is lower than that predicted by each individual compound isotherm. For example, in mixture 1, the values predicted by the isotherm for propylene glycol, glycerol, ethylene glycol and acetol are, respectively, 1.212, 1.871, 0.663 and 0.620 moL/kg AC, the sum being 4.366 moL/kg AC, considerably higher than the 3.177 moL/kg AC obtained for the mixture adsorption. In the mixture 2 experiment the sum of the predicted values is equal to 5.028 moL/kg AC, also considerably higher than the 3.570 moL/kg AC obtained. This can be explained by the interaction between solutes in the solution and on the adsorbent.
The molar quantity adsorbed predicted by Langmuir’s multicomponent adsorption model has been compared with the experimental data for each compound and the two mixtures. These values are presented in
Table 6.
Langmuir’s multicomponent adsorption model predicts the experimental results observed of PG and EG quite well. However, the model predicts higher values of glycerol adsorption and lower values of acetol adsorption. The latter result could be related to the selectivity of activated carbon to acetol.
3.5. Thermal Pre-Treatment
After performing thermal pre-treatment of the activated carbon at different final temperatures (800, 850, 900, 950 and 1000 °C), batch experiments were conducted with 1,2-propanediol using 1.125 g pre-treated activated carbon and 2 wt.% (0.26 M) 1,2-propanediol, obtaining the results shown in
Figure 5. In this section, the term commercial refers to the activated carbon as received, and HT means Heat Treatment at its operation temperature.
As can be seen, the adsorption capacity is higher when the pre-treatment temperature is 800 °C compared with untreated adsorbent. However, the adsorption capacity is decreased as the thermal pre-treatment temperature is raised. Activated carbon with 1000 °C thermal pre-treatment has lower adsorption capacity than commercial activated carbon. Thermal pre-treatment at 800 °C raises the adsorption capacity by 12% compared to that of commercial activated carbon.
In order to explain the data obtained from the adsorption batch experiments, the results of the ultimate analysis and ash content of the activated carbons are presented in
Table 7. According to this table, the purpose of the thermal pre-treatment has been accomplished because of the decrease in the oxygen content in the adsorbent, and in consequence the acidic surface functional groups have been removed. However, the desorption of these with the thermal pre-treatment at 1000 °C was less effective than expected and it was found that the heat treatment which best accomplished the target was the 800 °C treatment. In addition, the heat treatment led to an increase of more than 1% of the carbon content in all the activated carbons. The greater quantity of oxygen removed produced an increase in the ash content.
As the solvent, water, is also retained on the adsorbent, the water adsorption was also calculated in order to know whether the activated carbon surface was more hydrophobic after the thermal pre-treatment.
As can be seen in
Figure 5, the water adsorption increased with the thermal pre-treatment. According to Chinn [
15] and Liu [
23], thermal pre-treatment should lead to an increase in the adsorption capacity of the organic compounds, as observed, as well as a more hydrophobic surface. However, a more hydrophilic surface has been obtained. Thus, this increase in water adsorption may be due to the increase in the total pore volume, which can be observed in
Table 8. Moreno-Castilla explains that mineral matter has a hydrophilic character which can favour water adsorption [
31]. The activated carbon pre-treated at 800 °C shows the highest ash content. The obtained results could be due to the effect both the total pore volume and the ash content.
The results of the nitrogen adsorption characterization of heat-treated activated carbons are summarized in
Table 8.
It can be seen from
Table 8 that the BET surface area of the activated carbon thermally pre-treated at 800 °C (HT800) is higher than that of the untreated carbon. As the thermal treatment temperature is raised, the BET surface area decreases, with a 19.31% decrease in the case of the carbon treated at 1000 °C. Supong et al. also found a decrease in the BET area in activation processes at high temperatures, which is consistent with our results, due to the shrinkage of the activated carbon structure [
16]. The micropore area for the activated carbon HT800 is the same as that of the commercial carbon, but it decreases as the heat pre-treatment temperature increases, the decrease being 28.46% with pre-treatment at 1000 °C. The micropore volume shows a similar tendency to the micropore area, decreasing as the thermal pre-treatment increases. The volume at 1000 °C (HT1000), is 25.88% lower than that of the commercial activated carbon. This could be the explanation for the decrease in the adsorption capacity as the pre-treatment temperature is raised. Peereboom et al. found a correlation between micropore volume and adsorption capacity [
19]. Finally, the total pore volume presents a similar tendency to that of the BET surface area. An increase in the total pore volume may be due to the removal of surface functional groups, supposedly located in mesopores and big micropores [
33], but this volume decreases as the temperature is increased. The activated carbon thermally pre-treated at 1000 °C has almost the same pore volume as the commercial carbon. As stated in the introduction, an increase in pore size could lead to an increase in adsorption capacity. This could be a possible additional explanation for why the HT800 has one of the biggest pore diameters. In the case of the HT1000, it could explain why despite a big decrease in the micropore volume and the micropore area, and the removal of only a small quantity of the functional surface groups, the adsorption capacity is not significantly decreased. The pore size distribution by DFT model of the pre-treated activated carbons showed a similar distribution to the commercial one.
The results show that the removal of the surface functional groups leads to an improvement in the adsorption capacity of the organic compounds by the activated carbon, as seen in several references [
15,
19,
23]. The HT800 removes 91% of the oxygen content when compared with the commercial carbon and consequently the same percentage of surface functional groups. These activated carbons have the same micropore volume. An increase in the adsorption capacity of 12% is produced for the HT800. On the other hand, in the HT1000 a reduction of 25% of the micropore volume is observed compared to the commercial carbon. This decrease in the micropore volume has a negative influence on the adsorption capacity in spite of the removal of 46% of the surface functional groups.
In order to know which factor has the greatest effect on the adsorption capacity, all the parameters have been fitted against the quantity of 1,2 propanediol adsorbed onto the activated carbon. The parameters studied were oxygen content, ash content, carbon content, pore size, specific micropore area, specific micropore volume, specific mesopore area, specific mesopore volume, specific area and specific volume. Among these factors, only specific volume and ash content have a value bigger than 0.65, being 0.8 and 0.86 respectively. It was expected that the most influential factors would be specific micropore volume, oxygen content and specific area, but specific volume was found to be the most significant.
4. Conclusions
This study constitutes the first step in employing adsorption with activated carbon for the separation of value-added compounds from aqueous solutions of glycerol conversion processes. Adsorption isotherms for 1,2-propanediol, acetol, glycerol and ethylene glycol adsorbing onto activated carbon have been slightly better fitted to the Freundlich isotherm than to the Langmuir isotherm. Acetol is the compound with the highest adsorption capacity at a solution concentration lower than 1 M. For example, the acetol adsorption data for 0.3 M in solution is 2 moL/kg AC. Ethylene glycol is the compound with the lowest adsorption capacity at solution concentrations lower than 0.5 M. As an example, the ethylene glycol adsorption data for 0.2 M in solution is 1 moL/kg AC. However, the Freundlich isotherm predicts the highest adsorption capacity of ethylene glycol at high concentrations. 1,2-propanediol and glycerol show similar equilibriums of adsorption, glycerol adsorption being lower at solution concentrations higher than 1 M. The adsorption of acetol onto activated carbon could be explained by a dipole-dipole interaction, while the adsorption of ethylene glycol must be affected by its small size. The low adsorption capacity of glycerol can be related to the number of −OH groups in the molecule.
The adsorption of mixtures of the four compounds has demonstrated that the molar amount adsorbed is less than that predicted from the adsorption isotherms of the individual compounds. Acetol and 1,2-propanediol are preferably adsorbed onto activated carbon.
The activated carbon thermally treated at 800 °C has shown an increase in the adsorption capacity of 1,2-propanediol of 12% compared to that of commercial activated carbon. The characterization of the activated carbon thermally treated at 800 °C has shown the highest BET surface area and total pore volume. Ash content and pore volume are the parameters with the greatest effect on the adsorption capacity.


