
Towards A Socioeconomic Model of Sleep Health among the Canadian Population: A Systematic Review of the Relationship between Age, Income, Employment, Education, Social Class, Socioeconomic Status and Sleep Disparities


Abstract
:1. Introduction
2. Methods
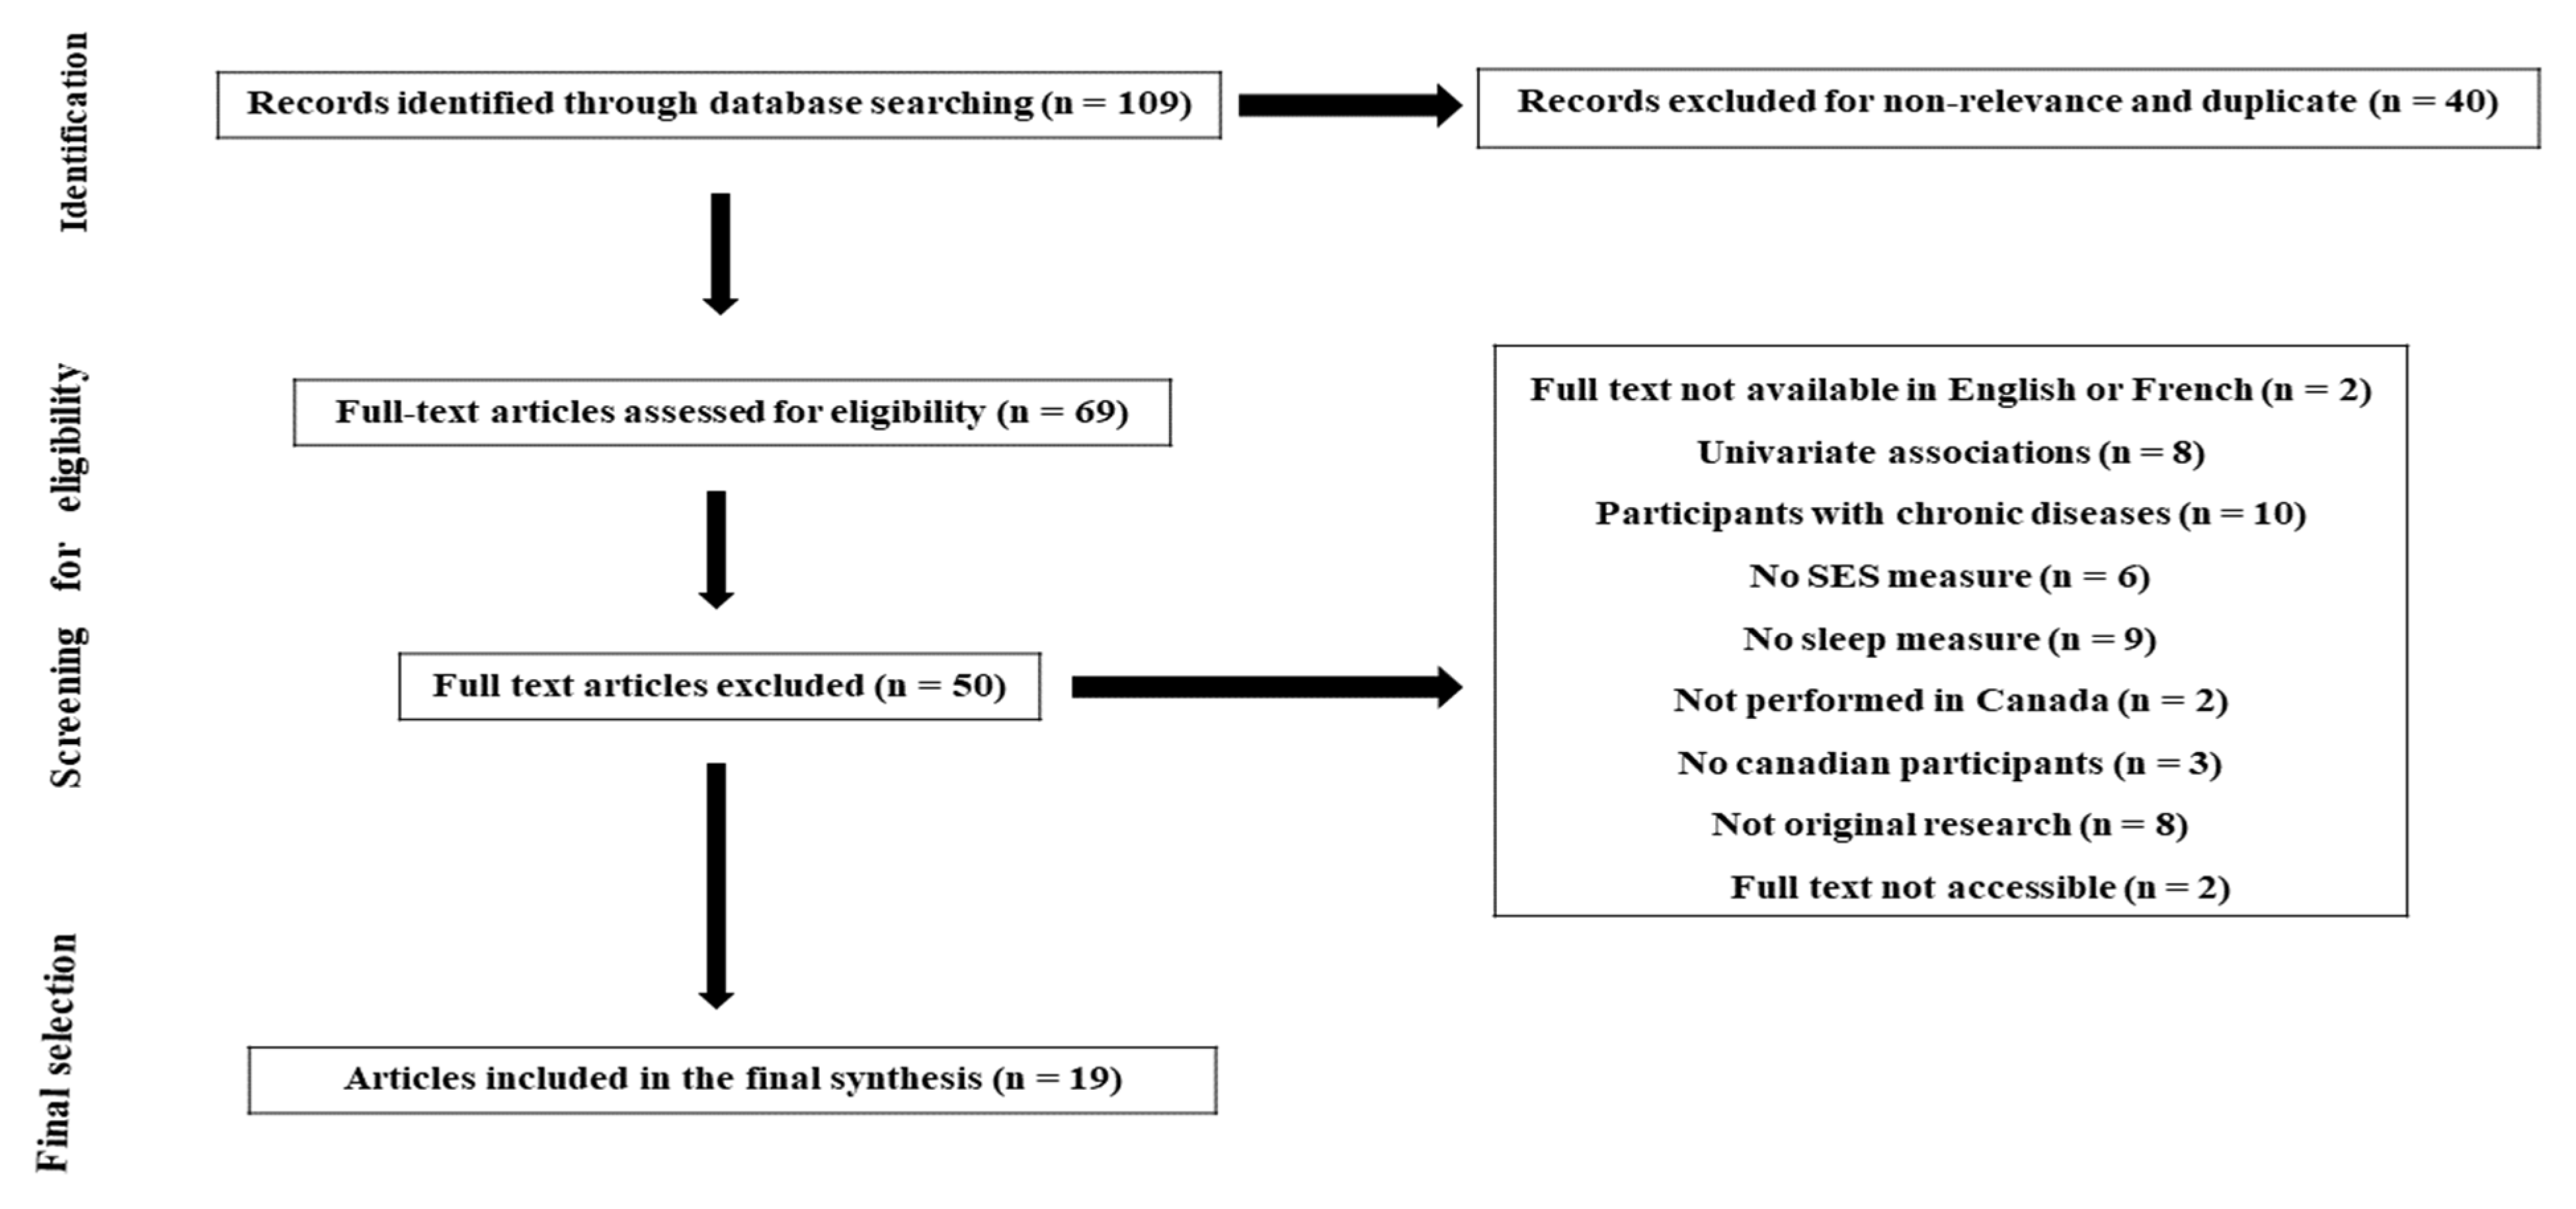
2.1. Literature Search
2.2. Inclusion Criteria
2.3. Exclusion Criteria
2.4. Data Extraction, Quality Assessment and Synthesis of Results
3. Results
3.1. Characteristics of Studies
3.2. Children and Adolescents Sleep Health Disparities
3.3. Adults Sleep Health Disparities
4. Discussion
4.1. Summary of Findings
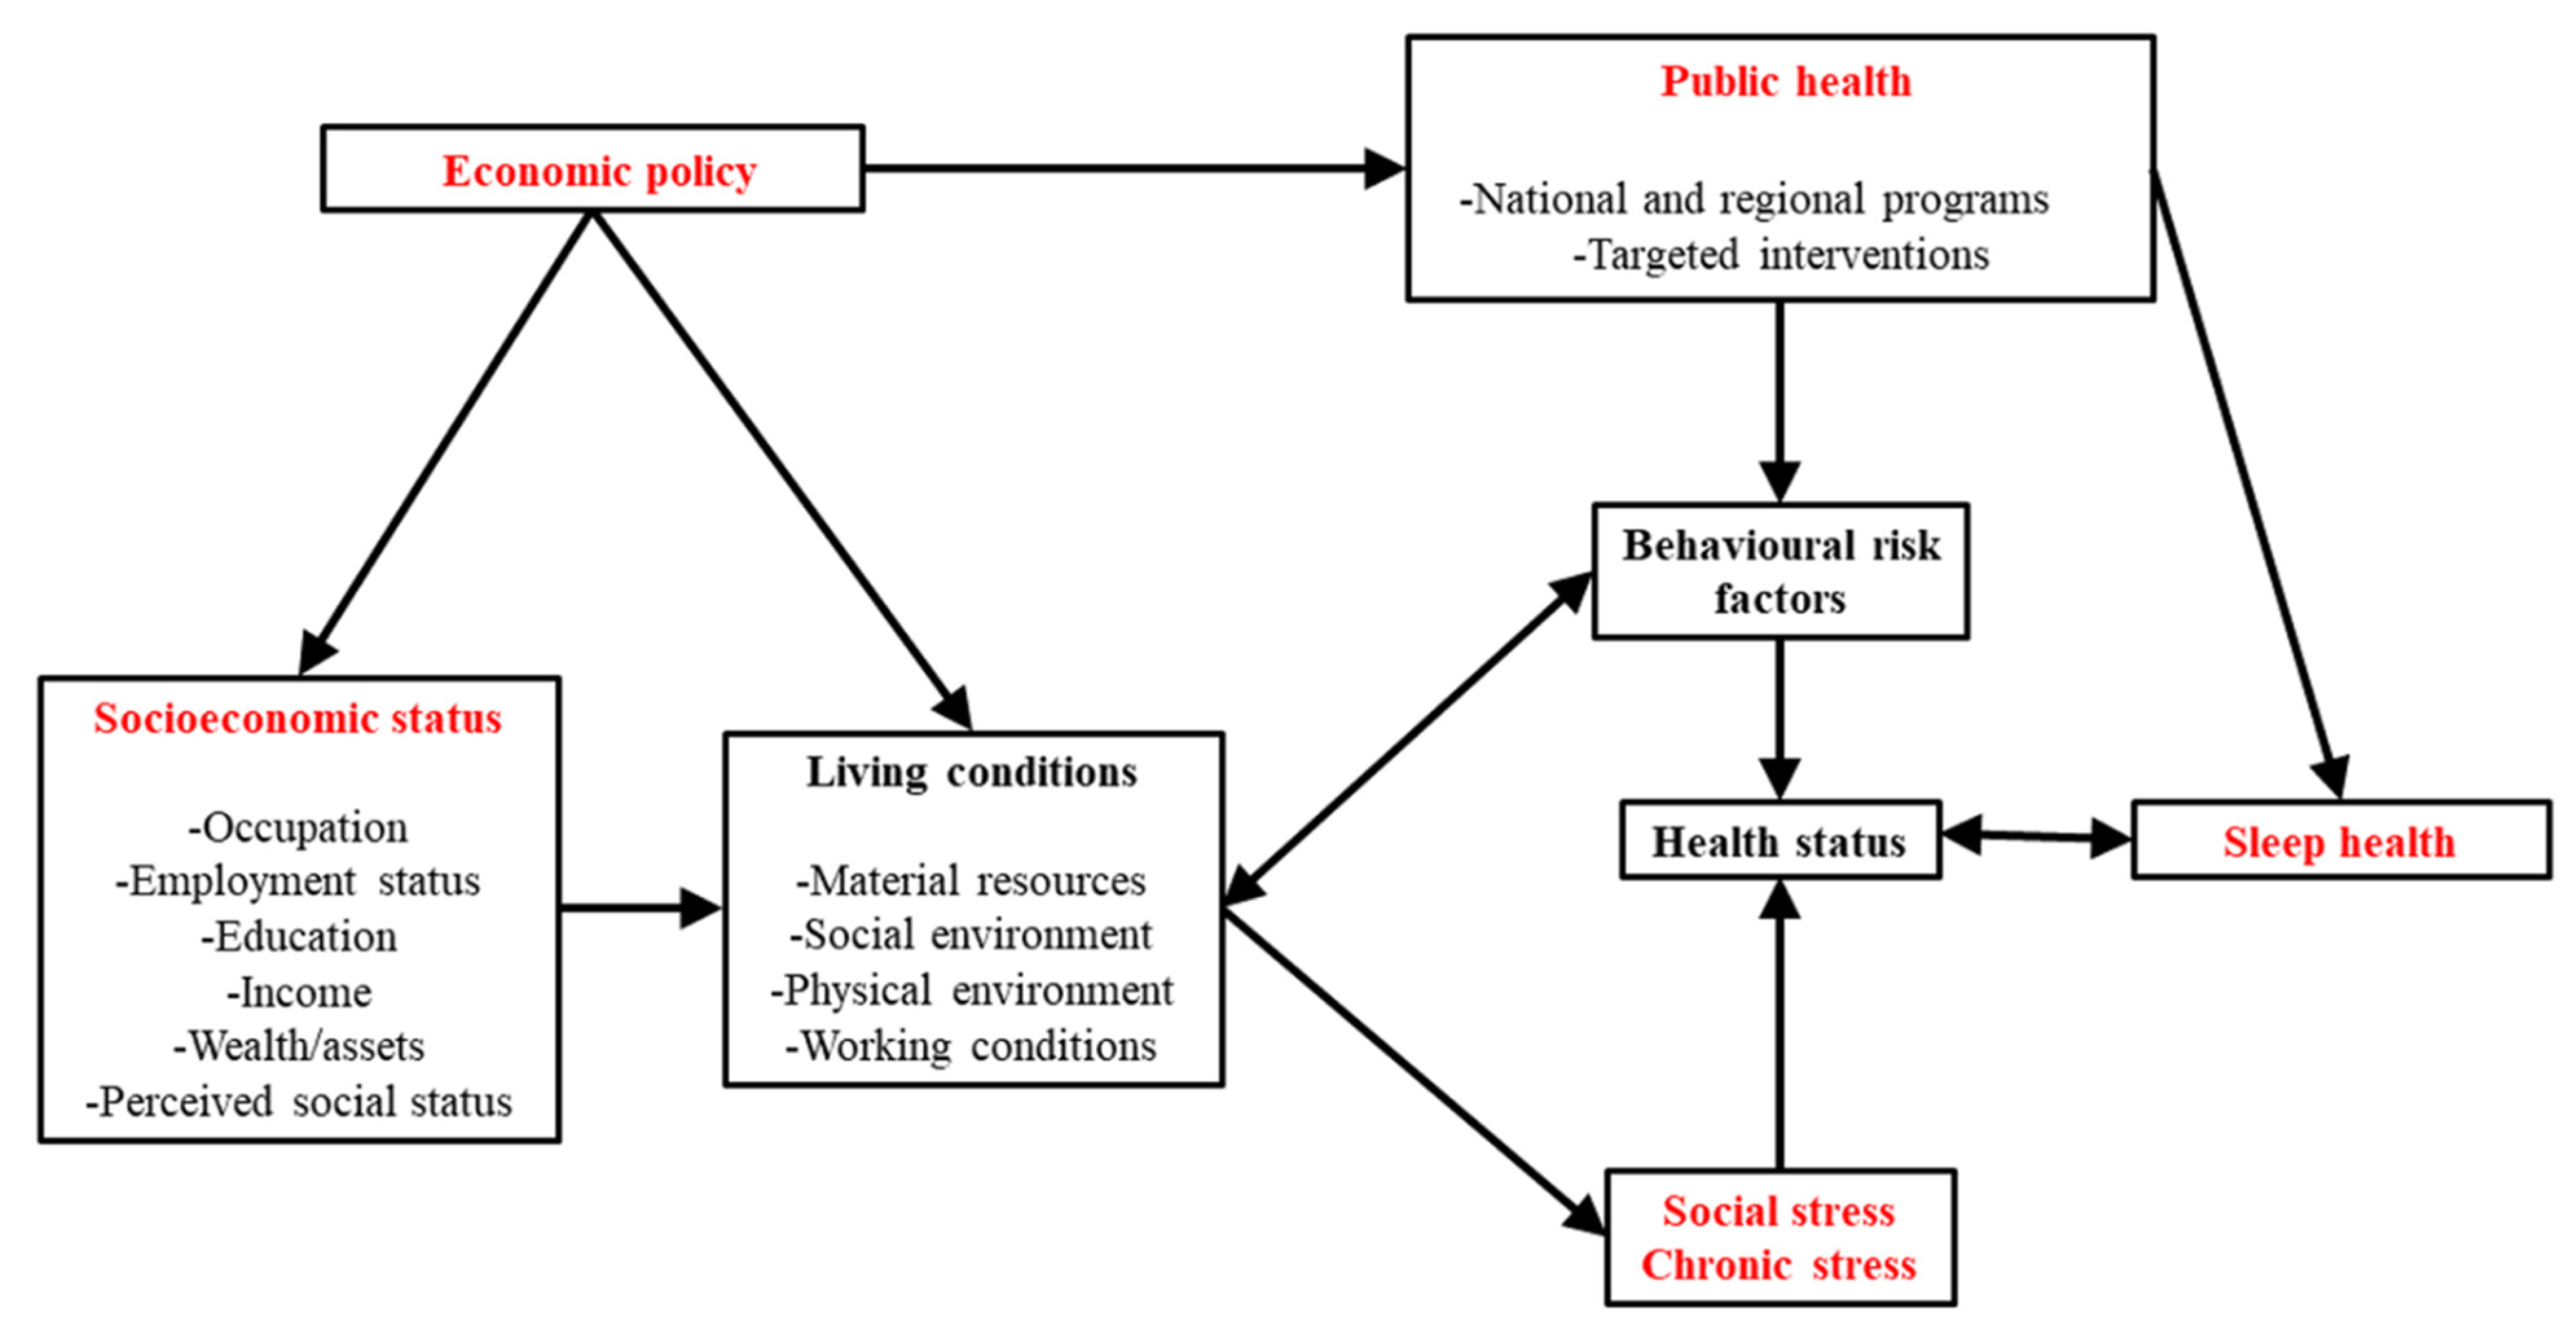
4.2. The Socioeconomical Model of Sleep Health
4.2.1. The Economic Policy
4.2.2. The Individual, Family and Community SES
4.2.3. The Living Conditions and Behavioral Risk Factors
4.2.4. Chronic Stress and Social Stress
4.2.5. Sleep Disturbances
4.3. Implications for Public Health Policy
4.4. Implications for Future Research
4.5. Current Limitations and Challenges
5. Conclusions
Supplementary Materials
Author Contributions
Funding
Institutional Review Board Statement
Informed Consent Statement
Data Availability Statement
Acknowledgments
Conflicts of Interest
References
- Seo, W.H.; Kwon, J.H.; Eun, S.-H.; Kim, G.; Han, K.; Choi, B.M. Effect of socio-economic status on sleep. J. Paediatr. Child Health 2017, 53, 592–597. [Google Scholar] [CrossRef] [PubMed]
- Delpierre, C.; Castagné, R.; Lang, T.; Kelly-Irving, M. Social environment, biological embedding and social inequalities in health. Med. Sci. Paris 2018, 34, 740–744. [Google Scholar] [PubMed]
- Chaput, P.J.; Wong, S.L.; Michaud, I. Durée et qualité du sommeil chez les Canadiens âgés de 18 à 79 ans. Rapp. Santé 2017, 28, 30–35. [Google Scholar]
- Phelan, C.J.; Link, B.G.; Tehranifar, P. Social conditions as fundamental causes of health inequalities: Theory, evidence, and policy implications. J. Health Soc. Behav. 2010, 51, S28–S40. [Google Scholar] [CrossRef]
- Wong, K.; Chan, A.H.S.; Ngan, S.C. The Effect of Long Working Hours and Overtime on Occupational Health: A Meta-Analysis of Evidence from 1998 to 2018. Int. J. Environ. Res. Public Health 2019, 16, 2102. [Google Scholar] [CrossRef]
- Rodriguez, J.M.; Karlamangla, A.S.; Gruenewald, T.L.; Miller-Martinez, D.; Merkin, S.S.; Seeman, T.E. Social stratification and allostatic load: Shapes of health differences in the MIDUS study in the United States. J. Biosoc. Sci. 2019, 51, 627–644. [Google Scholar] [CrossRef]
- Vermeiren, A.P.; Willeboordse, M.; Oosterhoff, M.; Bartelink, N.; Muris, P.; Bosma, H. Socioeconomic multi-domain health inequalities in Dutch primary school children. Eur. J. Public Health 2018, 28, 610–616. [Google Scholar] [CrossRef]
- Ribeiro, A.I.; Amaro, J.; Lisi, C.; Fraga, S. Neighborhood Socioeconomic Deprivation and Allostatic Load: A Scoping Review. Int. J. Environ. Res. Public Health 2018, 15, 1092. [Google Scholar] [CrossRef]
- Braveman, P.A.; Cubbin, C.; Egerter, S.; Williams, D.R.; Pamuk, E. Socioeconomic disparities in health in the United States: What the patterns tell us. Am. J. Public Health 2010, 100 (Suppl. S1), S186–S196. [Google Scholar] [CrossRef]
- Mai, Q.D.; Hill, T.D.; Vila-Henninger, L.; Grandner, M.A. Employment insecurity and sleep disturbance: Evidence from 31 European countries. J. Sleep Res. 2019, 28, e12763. [Google Scholar] [CrossRef]
- Bøe, T.; Hysing, M.; Stormark, K.M.; Lundervold, A.J.; Sivertsen, B. Sleep problems as a mediator of the association between parental education levels, perceived family economy and poor mental health in children. J. Psychosom. Res. 2012, 73, 430–436. [Google Scholar] [CrossRef]
- Biggs, S.N.; Lushington, K.; Martin, A.J.; Heuvel, C.J.V.D.; Kennedy, J.D. Gender, socioeconomic, and ethnic differences in sleep patterns in school-aged children. Sleep Med. 2013, 14, 1304–1309. [Google Scholar] [CrossRef]
- Peltzer, K.; Pengpid, S. Nocturnal sleep problems among university students from 26 countries. Sleep Breath 2015, 19, 499–508. [Google Scholar] [CrossRef]
- Perlus, J.G.; O’Brien, F.; Haynie, D.L.; Simons-Morton, B.G. Adolescent sleep insufficiency one year after high school. J. Adolesc. 2018, 68, 165–170. [Google Scholar] [CrossRef]
- Doane, L.D.; Breitenstein, R.S.; Beekman, C.; Clifford, S.; Smith, T.J.; Lemery-Chalfant, K. Early Life Socioeconomic Disparities in Children’s Sleep: The Mediating Role of the Current Home Environment. J. Youth Adolesc. 2019, 48, 56–70. [Google Scholar] [CrossRef]
- Peltzer, K.; Pengpid, S. Self-Reported Sleep Duration and Its Correlates with Sociodemographics, Health Behaviours, Poor Mental Health, and Chronic Conditions in Rural Persons 40 Years and Older in South Africa. Int. J. Environ. Res. Public Health 2018, 15, 1357. [Google Scholar] [CrossRef]
- Pandi-Perumal, S.R.; Abumuamar, A.M.; Spence, D.W.; Chattu, V.K.; Moscovitch, A.; BaHammam, A.S. Racial/Ethnic and Social Inequities in Sleep Medicine: The Tip of the Iceberg? J. Natl. Med. Assoc. 2017, 109, 279–286. [Google Scholar] [CrossRef]
- Papadopoulos, D.; Sosso, F.E.; Khoury, T.; Surani, S.R. Sleep Disturbances Are Mediators Between Socioeconomic Status and Health: A Scoping Review. Int. J. Ment. Health Addict. 2020, 20, 480–504. [Google Scholar] [CrossRef]
- Kim, K.T. Revisiting the Income Inequality Hypothesis With 292 OECD Regional Units. Int. J. Health Serv. 2019, 49, 360–370. [Google Scholar] [CrossRef]
- Etindele-Sosso, F.A. Insomnia, excessive daytime sleepiness, anxiety, depression and socioeconomic status among customer service employees in Canada. Sleep Sci. Sao Paulo Braz. 2020, 13, 54–64. [Google Scholar]
- Counts, C.J.; Grubin, F.C.; John-Henderson, N.A. Childhood socioeconomic status and risk in early family environments: Predictors of global sleep quality in college students. Sleep Health 2018, 4, 301–306. [Google Scholar] [CrossRef] [PubMed]
- Hoggard, L.S.; Hill, L.K. Examining How Racial Discrimination Impacts Sleep Quality in African Americans: Is Perseveration the Answer? Behav. Sleep Med. 2018, 16, 471–481. [Google Scholar] [CrossRef] [PubMed]
- Petrovic, D.; Haba-Rubio, J.; Carmeli, C.; Vollenweider, P.; Heinzer, R.; Stringhini, S. Social inequalities in sleep-disordered breathing: Evidence from the CoLaus|HypnoLaus study. J. Sleep Res. 2019, 28, e12799. [Google Scholar] [CrossRef] [PubMed]
- Mokarami, H.; Gharibi, V.; Kalteh, H.O.; Kujerdi, M.F.; Kazemi, R. Multiple environmental and psychosocial work risk factors and sleep disturbances. Int. Arch. Occup. Environ. Health 2020, 93, 623–633. [Google Scholar] [CrossRef]
- National Heart, Lung and blood Institute. Quality Assessment Tool for Observational Cohort and Cross-Sectional Studies; National Institutes of Health, Department of Health and Human Services: Bethesda, MD, USA, 2014; pp. 103–111. [Google Scholar]
- Brouillette, R.T.; Horwood, L.; Constantin, E.; Brown, K.; Ross, N.A. Childhood sleep apnea and neighborhood disadvantage. J. Pediatr. 2011, 158, 789–795.e1. [Google Scholar] [CrossRef]
- Karunanayake, C.P.; Dosman, J.; Rennie, D.; Lawson, J.; Kirychuk, S.; Fenton, M.; Ramsden, V.; Seeseequasis, J.; Abonyi, S.; Pahwa, P.; et al. Incidence of Daytime Sleepiness and Associated Factors in Two First Nations Communities in Saskatchewan, Canada. Clocks Sleep 2019, 1, 13–25. [Google Scholar] [CrossRef]
- Garland, S.N.; Rowe, H.; Repa, L.M.; Fowler, K.; Zhou, E.S.; Grandner, M.A. A decade’s difference: 10-year change in insomnia symptom prevalence in Canada depends on sociodemographics and health status. Sleep Health 2018, 4, 160–165. [Google Scholar] [CrossRef]
- Sutton, D.A.; Moldofsky, H.; Badley, E.M. Insomnia and health problems in Canadians. Sleep 2001, 24, 665–670. [Google Scholar] [CrossRef]
- Tjepkema, M. Insomnia. Health Rep. 2005, 17, 9–25. [Google Scholar]
- Bassett, E.; Moore, S. Neighbourhood disadvantage, network capital and restless sleep: Is the association moderated by gender in urban-dwelling adults? Soc. Sci. Med. 2014, 108, 185–193. [Google Scholar] [CrossRef]
- Gjevre, J.A.; Pahwa, P.; Karunanayake, C.P.; Hagel, L.; Rennie, D.C.; Lawson, J.; Dyck, R.; A Dosman, J. The Saskatchewan Rural Health Study Team Excessive daytime sleepiness among rural residents in Saskatchewan. Can. Respir. J. 2014, 21, 227–233. [Google Scholar] [CrossRef]
- Baiden, P.; Fallon, B.; den Dunnen, W.; Boateng, G.O. The enduring effects of early-childhood adversities and troubled sleep among Canadian adults: A population-based study. Sleep Med. 2015, 16, 760–767. [Google Scholar] [CrossRef]
- Nagy, E.; Moore, S.; Gruber, R.; Paquet, C.; Arora, N.; Dubé, L. Parental social capital and children’s sleep disturbances. Sleep Health 2016, 2, 330–334. [Google Scholar] [CrossRef]
- Costanian, C.; Abdullah, P.; Sawh, N.; Nagapatan, A.; Tamim, H. Factors associated with shorter night-time sleep in toddlers: The Survey of Young Canadians. Can. J. Public Health 2018, 108, e571–e577. [Google Scholar] [CrossRef]
- Patte, K.A.; Qian, W.; Leatherdale, S.T. Sleep duration trends and trajectories among youth in the COMPASS study. Sleep Health 2017, 3, 309–316. [Google Scholar] [CrossRef]
- Chang, V.; Chaput, J.-P.; Roberts, K.C.; Jayaraman, G.; Do, M.T. Factors associated with sleep duration across life stages: Results from the Canadian Health Measures Survey. Health Promot. Chronic Dis. Prev. Can. 2018, 38, 404–418. [Google Scholar] [CrossRef]
- Laganière, C.; Gaudreau, H.; Pokhvisneva, I.; Atkinson, L.; Meaney, M.; Pennestri, M. Maternal characteristics and behavioural/emotional problems in preschoolers: How they relate to sleep rhythmic movements at sleep onset. J. Sleep Res. 2019, 28, e12707. [Google Scholar] [CrossRef]
- Vézina-Im, L.-A.; Lebel, A.; Gagnon, P.; Nicklas, T.A.; Baranowski, T. Individual Correlates of Sleep Among Childbearing Age Women in Canada. Behav. Sleep Med. 2019, 17, 634–645. [Google Scholar] [CrossRef]
- Yao, C.; Fereshtehnejad, S.-M.; Keezer, M.R.; Wolfson, C.; Pelletier, A.; Postuma, R.B. Risk factors for possible REM sleep behavior disorder: A CLSA population-based cohort study. Neurology 2018, 92, e475–e485. [Google Scholar] [CrossRef]
- Jarrin, D.C.; McGrath, J.J.; Silverstein, J.E.; Drake, C. Objective and subjective socioeconomic gradients exist for sleep quality, sleep latency, sleep duration, weekend oversleep, and daytime sleepiness in adults. Behav. Sleep Med. 2013, 11, 144–158. [Google Scholar] [CrossRef]
- Jarrin, D.C.; McGrath, J.J.; Quon, E.C. Objective and subjective socioeconomic gradients exist for sleep in children and adolescents. Health Psychol. 2014, 33, 301–305. [Google Scholar] [CrossRef]
- Matenchuk, B.A.; Tamana, S.K.; Lou, W.Y.W.; Lefebvre, D.L.; Sears, M.R.; Becker, A.B.; Azad, M.B.; Moraes, T.J.; Turvey, S.E.; Subbarao, P. Prenatal depression and birth mode sequentially mediate maternal education’s influence on infant sleep duration. Sleep Med. 2019, 59, 24–32. [Google Scholar] [CrossRef]
- Seaton, C.L.; Bottorff, J.L.; Caperchione, C.M.; Johnson, S.T.; Oliffe, J.L. The Association Between Men’s Heath Behaviors and Interest in Workplace Health Promotion. Workplace Health Saf. 2020, 68, 226–235. [Google Scholar] [CrossRef]
- Di Cesare, M.; Khang, Y.-H.; Asaria, P.; Blakely, T.; Cowan, M.J.; Farzadfar, F.; Guerrero, R.; Ikeda, N.; Kyobutungi, C.; Msyamboza, K.P.; et al. Inequalities in non-communicable diseases and effective responses. Lancet 2013, 381, 585–597. [Google Scholar] [CrossRef]
- Meneton, P.; Hoertel, N.; Wiernik, E.; Lemogne, C.; Ribet, C.; Bonenfant, S.; Ménard, J.; Goldberg, M.; Zins, M. Work environment mediates a large part of social inequalities in the incidence of several common cardiovascular risk factors: Findings from the Gazel cohort. Soc. Sci. Med. 2018, 216, 59–66. [Google Scholar] [CrossRef] [PubMed]
- Billings, M.E.; Hale, L.; Johnson, D.A. Physical and Social Environment Relationship With Sleep Health and Disorders. Chest 2020, 157, 1304–1312. [Google Scholar] [CrossRef] [PubMed]
- Stranges, S.; Tigbe, W.; Gómez-Olivé, F.X.; Thorogood, M.; Kandala, N.-B. Sleep Problems: An Emerging Global Epidemic? Findings From the INDEPTH WHO-SAGE Study Among More Than 40,000 Older Adults From 8 Countries Across Africa and Asia. Sleep 2012, 35, 1173–1181. [Google Scholar] [CrossRef] [PubMed]
- Egan, K.J.; Knutson, K.L.; Pereira, A.C.; von Schantz, M. The role of race and ethnicity in sleep, circadian rhythms and cardiovascular health. Sleep Med. Rev. 2017, 33, 70–78. [Google Scholar] [CrossRef] [PubMed]
- Petrov, M.E.; Long, D.L.; Grandner, M.A.; MacDonald, L.A.; Cribbet, M.R.; Robbins, R.; Cundiff, J.M.; Molano, J.R.; Hoffmann, C.M.; Wang, X.; et al. Racial differences in sleep duration intersect with sex, socioeconomic status, and U.S. geographic region: The REGARDS study. Sleep Health 2020, 6, 442–450. [Google Scholar] [CrossRef]
- Hafner, M.; Stepanek, M.; Taylor, J.; Troxel, W.M.; van Stolk, C. Why Sleep Matters—The Economic Costs of Insufficient Sleep: A Cross-Country Comparative Analysis; RAND Corporation: Santa Monica, CA, USA, 2016. [Google Scholar]
- Leger, D.; Esquirol, Y.; Gronfier, C.; Metlaine, A.; Groupe consensus chronobiologie et sommeil de la Société française de recherche et médecine du sommeil (SFRMS). Shift-workers and night-workers’ health consequences: State of art and recommendations. La Presse Médicale 2018, 47, 991–999. [Google Scholar] [CrossRef]
- Upender, R.P. Chapter 63—Sleep Medicine, Public Policy, and Public Health. In Principles and Practice of Sleep Medicine, 6th ed.; Kryger, M., Roth, T., Dement, W.C., Eds.; Elsevier: Amsterdam, The Netherlands, 2017; pp. 638–645.e4. [Google Scholar]
- Peigneux, P.; Fogel, S.; Smith, C. Chapter 22—Memory Processing in Relation to Sleep. In Principles and Practice of Sleep Medicine, 6th ed.; Kryger, M., Roth, T., Dement, W.C., Eds.; Elsevier: Amsterdam, The Netherlands, 2017; pp. 229–238.e6. [Google Scholar]
- Hirshkowitz, M.; Bhandari, H. Neurotransmitters, neurochemistry, and the clinical pharmacology of sleep. In Sleep Disorders Medicine; Springer: Berlin, Germany, 2017; pp. 103–118. [Google Scholar]
- Daley, M.; Morin, C.; LeBlanc, M.; Grégoire, J.; Savard, J.; Baillargeon, L. Insomnia and its relationship to health-care utilization, work absenteeism, productivity and accidents. Sleep Med. 2009, 10, 427–438. [Google Scholar] [CrossRef]
- Lin, L.N.; Chang, L.; Hurng, B.; Wu, C.; Yen, L.; Chang, H.-Y. Sex differences in sleep patterns and changes in 7th to 12th graders: A longitudinal follow-up study in Taiwan. Sleep 2018, 41, zsx211. [Google Scholar] [CrossRef]
- Lei, W.-Y.; Chang, W.-C.; Wong, M.-W.; Hung, J.-S.; Wen, S.-H.; Yi, C.-H.; Liu, T.-T.; Chen, J.-H.; Hsu, C.-S.; Hsieh, T.-C.; et al. Sleep Disturbance and Its Association with Gastrointestinal Symptoms/Diseases and Psychological Comorbidity. Digestion 2019, 99, 205–212. [Google Scholar] [CrossRef]
- Sivertsen, B.; Bøe, T.; Skogen, J.C.; Petrie, K.J.; Hysing, M. Moving into poverty during childhood is associated with later sleep problems. Sleep Med. 2017, 37, 54–59. [Google Scholar] [CrossRef]
- Perales, F.; Plage, S. Losing ground, losing sleep: Local economic conditions, economic vulnerability, and sleep. Soc. Sci. Res. 2017, 62, 189–203. [Google Scholar] [CrossRef]
- McEwen, B.S. Neurobiological and Systemic Effects of Chronic Stress. Chronic Stress Thousand Oaks 2017, 1, 2470547017692328. [Google Scholar] [CrossRef]
- Jonsson, F.; Sebastián, M.S.; Strömsten, L.M.J.; Hammarström, A.; Gustafsson, P.E. Life Course Pathways of Adversities Linking Adolescent Socioeconomic Circumstances and Functional Somatic Symptoms in Mid-Adulthood: A Path Analysis Study. PLoS ONE 2016, 11, e0155963. [Google Scholar] [CrossRef]
- Chiang, J.J.; Tsai, K.; Park, H.; Bower, J.E.; Almeida, D.M.; Dahl, R.E.; Irwin, M.; Seeman, T.E.; Fuligni, A.J. Daily family stress and HPA axis functioning during adolescence: The moderating role of sleep. Psychoneuroendocrinology 2016, 71, 43–53. [Google Scholar] [CrossRef]
- Drake, C.L.; Pillai, V.; Roth, T. Stress and sleep reactivity: A prospective investigation of the stress-diathesis model of insomnia. Sleep 2014, 37, 1295–1304. [Google Scholar] [CrossRef]
- Karlamangla, A.S.; Friedman, E.M.; Seeman, T.E.; Stawksi, R.S.; Almeida, D.M. Daytime trajectories of cortisol: Demographic and socioeconomic differences—Findings from the National Study of Daily Experiences. Psychoneuroendocrinology 2013, 38, 2585–2597. [Google Scholar] [CrossRef]
- Yin, J.; Jin, X.; Shan, Z.; Li, S.; Huang, H.; Li, P.; Peng, X.; Peng, Z.; Yu, K.; Bao, W.; et al. Relationship of Sleep Duration With All-Cause Mortality and Cardiovascular Events: A Systematic Review and Dose-Response Meta-Analysis of Prospective Cohort Studies. J. Am. Heart Assoc. 2017, 6, e005947. [Google Scholar] [CrossRef]
- Li, L.; Zhang, S.; Huang, Y.; Chen, K. Sleep duration and obesity in children: A systematic review and meta-analysis of prospective cohort studies. J. Paediatr. Child Health 2017, 53, 378–385. [Google Scholar] [CrossRef]
- Lee, S.W.H.; Ng, K.Y.; Chin, W.K. The impact of sleep amount and sleep quality on glycemic control in type 2 diabetes: A systematic review and meta-analysis. Sleep Med. Rev. 2017, 31, 91–101. [Google Scholar] [CrossRef]
- Etindele Sosso, F.A.; Matos, E. Socioeconomic disparities in obstructive sleep apnea: A systematic review of empirical research. Sleep Breath. 2021, 25, 1729–1739. [Google Scholar] [CrossRef]
- Mayne, S.L.; Mitchell, J.A.; Virudachalam, S.; Fiks, A.G.; Williamson, A.A. Neighborhood Physical and Social Environments and Sleep Among Children and Adolescents: A Systematic Review. Sleep 2020, 43 (Suppl. S1), A152. [Google Scholar] [CrossRef]
- Hale, L.; Troxel, W.; Buysse, D.J. Sleep Health: An Opportunity for Public Health to Address Health Equity. Annu. Rev. Public Health 2020, 41, 81–99. [Google Scholar] [CrossRef]
- Gordon, S.; Vandelanotte, C.; Rayward, A.T.; Murawski, B.; Duncan, M.J. Sociodemographic and behavioral correlates of insufficient sleep in Australian adults. Sleep Health 2019, 5, 12–17. [Google Scholar] [CrossRef]
- van de Straat, V.; Cheval, B.; Schmidt, R.E.; Sieber, S.; Courvoisier, D.; Kliegel, M.; Burton-Jeangros, C.; Cullati, S.; Bracke, P. Early predictors of impaired sleep: A study on life course socioeconomic conditions and sleeping problems in older adults. Aging Ment. Health 2018, 24, 322–332. [Google Scholar] [CrossRef] [PubMed]
- Matthews, K.A.; Jennings, J.R.; Lee, L. Socioeconomic status in childhood predicts sleep continuity in adult Black and White men. Sleep Health 2018, 4, 49–55. [Google Scholar] [CrossRef] [PubMed]
- Walsemann, K.M.; Ailshire, J.A.; Fisk, C.E.; Brown, L.L. Do gender and racial/ethnic disparities in sleep duration emerge in early adulthood? Evidence from a longitudinal study of U.S. adults. Sleep Med. 2017, 36, 133–140. [Google Scholar] [CrossRef] [PubMed]
- Akay, A.; Martinsson, P.; Ralsmark, H. Relative concerns and sleep behavior. Econ. Hum. Biol. 2019, 33, 1–14. [Google Scholar] [CrossRef]
- Yu, X.-T.; Sadeh, A.; Lam, H.S.; Mindell, J.A.; Li, A.M. Parental behaviors and sleep/wake patterns of infants and toddlers in Hong Kong, China. World J. Pediatr. 2017, 13, 496–502. [Google Scholar] [CrossRef]
- Palmer, K.T.; D’Angelo, S.; Harris, E.C.; Linaker, C.; Sayer, A.A.; Gale, C.R.; Evandrou, M.; Van Staa, T.; Cooper, C.; Coggon, D.; et al. Sleep disturbance and the older worker: Findings from the Health and Employment after Fifty study. Scand. J. Work. Environ. Health 2017, 43, 136–145. [Google Scholar] [CrossRef]
- Jagannath, A.; Peirson, S.N.; Foster, R.G. Sleep and circadian rhythm disruption in neuropsychiatric illness. Curr. Opin. Neurobiol. 2013, 23, 888–894. [Google Scholar] [CrossRef]
- Canuto, R.; Garcez, A.S.; Olinto, M.T. Metabolic syndrome and shift work: A systematic review. Sleep Med. Rev. 2013, 17, 425–431. [Google Scholar] [CrossRef]
- Soltani, M.; Haytabakhsh, M.R.; Najman, J.; Williams, G.; O’Callaghan, M.J.; Bor, W.; Dingle, K.; Clavarino, A. Sleepless nights: The effect of socioeconomic status, physical activity, and lifestyle factors on sleep quality in a large cohort of Australian women. Arch. Women Ment. Health 2012, 15, 237–247. [Google Scholar] [CrossRef]
- Basner, M.; Spaeth, A.M.; Dinges, D.F. Sociodemographic characteristics and waking activities and their role in the timing and duration of sleep. Sleep 2014, 37, 1889–1906. [Google Scholar] [CrossRef]
- Eder, D.N.; Zou, D.; Grote, L.; Hedner, J. Self-reported features of sleep, utilization of medical resources, and socioeconomic position: A Swedish population survey. Behav. Sleep Med. 2011, 9, 162–172. [Google Scholar] [CrossRef]
- Akerstedt, T.; Knutsson, A.; Westerholm, P.; Theorell, T.; Alfredsson, L.; Kecklund, G. Sleep disturbances, work stress and work hours: A cross-sectional study. J. Psychosom. Res. 2002, 53, 741–748. [Google Scholar] [CrossRef]
- Juster, R.-P.; McEwen, B.S.; Lupien, S.J. Allostatic load biomarkers of chronic stress and impact on health and cognition. Neurosci. Biobehav. Rev. 2010, 35, 2–16. [Google Scholar] [CrossRef]
- Martire, V.L.; Caruso, D.; Palagini, L.; Zoccoli, G.; Bastianini, S. Stress & sleep: A relationship lasting a lifetime. Neurosci. Biobehav. Rev. 2019, 117, 65–77. [Google Scholar]
- Johnson, S.C.; Cavallaro, F.L.; Leon, D.A. A systematic review of allostatic load in relation to socioeconomic position: Poor fidelity and major inconsistencies in biomarkers employed. Soc. Sci. Med. 2017, 192, 66–73. [Google Scholar] [CrossRef]
- Chen, X.; Redline, S.; Shields, A.E.; Williams, D.R.; Williams, M.A. Associations of allostatic load with sleep apnea, insomnia, short sleep duration, and other sleep disturbances: Findings from the National Health and Nutrition Examination Survey 2005 to 2008. Ann. Epidemiol. 2014, 24, 612–619. [Google Scholar] [CrossRef] [PubMed]
- McEwen, B.S. Brain on stress: How the social environment gets under the skin. Proc. Natl. Acad. Sci. USA 2012, 109 (Suppl. S2), 17180–17185. [Google Scholar] [CrossRef]
- Petersen, H.; Kecklund, G.; D’Onofrio, P.; Nilsson, J.; Åkerstedt, T. Stress vulnerability and the effects of moderate daily stress on sleep polysomnography and subjective sleepiness. J. Sleep Res. 2013, 22, 50–57. [Google Scholar] [CrossRef] [PubMed]
- Castro, L.S.; Castro, J.; Hoexter, M.Q.; Quarantini, L.C.; Kauati, A.; Mello, L.E.; Santos-Silva, R.; Tufik, S.; Bittencourt, L. Depressive symptoms and sleep: A population-based polysomnographic study. Psychiatry Res. 2013, 210, 906–912. [Google Scholar] [CrossRef]
- Lima, M.G.; de Barros, M.B.; Ceolim, M.F.; Zancanella, E.; de Cardoso, T.A.M. Sleep duration, health status, and subjective well-being: A population-based study. Rev. De Saúde Pública 2018, 52, 82. [Google Scholar] [CrossRef]
- Khan, I.W.; Juyal, R.; Shikha, D.; Gupta, R. Generalized Anxiety disorder but not depression is associated with insomnia: A population based study. Sleep Sci. 2018, 11, 166–173. [Google Scholar] [CrossRef]
- Kumari, M.; Badrick, E.; Chandola, T.; Adler, N.E.; Epel, E.; Seeman, T.; Kirschbaum, C.; Marmot, M. Measures of social position and cortisol secretion in an aging population: Findings from the Whitehall II study. Psychosom. Med. 2010, 72, 27–34. [Google Scholar] [CrossRef]
- Green, M.J.; Espie, C.A.; Benzeval, M. Social class and gender patterning of insomnia symptoms and psychiatric distress: A 20-year prospective cohort study. BMC Psychiatry 2014, 14, 152. [Google Scholar] [CrossRef]
- Hawkley, L.C.; Lavelle, L.A.; Berntson, G.G.; Cacioppo, J.T. Mediators of the relationship between socioeconomic status and allostatic load in the Chicago Health, Aging, and Social Relations Study (CHASRS). Psychophysiology 2011, 48, 1134–1145. [Google Scholar] [CrossRef] [PubMed]
- Grandner, M.A. Chapter 5—Social-ecological model of sleep health. In Sleep and Health; Grandner, M.A., Ed.; Academic Press: Cambridge, MA, USA, 2019; pp. 45–53. [Google Scholar]
- Hawkins, S.S.; Takeuchi, D.T. Social determinants of inadequate sleep in US children and adolescents. Public Health 2016, 138, 119–126. [Google Scholar] [CrossRef] [PubMed]
- Patel, S.R.; Sotres-Alvarez, D.; Castaneda, S.; Dudley, K.A.; Gallo, L.C.; Hernandez, R.; Medeiros, E.A.; Penedo, F.J.; Mossavar-Rahmani, Y.; Ramos, A.R.; et al. Social and Health Correlates of Sleep Duration in a US Hispanic Population: Results from the Hispanic Community Health Study/Study of Latinos. Sleep 2015, 38, 1515–1522. [Google Scholar] [CrossRef]
- Kalmbach, D.A.; Pillai, V.; Cheng, P.; Arnedt, J.T.; Drake, C.L. Shift work disorder, depression, and anxiety in the transition to rotating shifts: The role of sleep reactivity. Sleep Med. 2015, 16, 1532–1538. [Google Scholar] [CrossRef]
- Suarez, E.; Fang, S.C.; Bliwise, D.; Yaggi, H.K.; Araujo, A. Disentangling racial/ethnic and socioeconomic differences in self-reported sleep measures: The Boston Area Community Health Survey. Sleep Health 2015, 1, 90–97. [Google Scholar] [CrossRef]
- Stringhini, S.; Haba-Rubio, J.; Marques-Vidal, P.; Waeber, G.; Preisig, M.; Guessous, I.; Bovet, P.; Vollenweider, P.; Tafti, M.; Heinzer, R. Association of socioeconomic status with sleep disturbances in the Swiss population-based CoLaus study. Sleep Med. 2015, 16, 469–476. [Google Scholar] [CrossRef]
- Bagley, E.J.; Kelly, R.J.; Buckhalt, J.A.; El-Sheikh, M. What keeps low-SES children from sleeping well: The role of presleep worries and sleep environment. Sleep Med. 2015, 16, 496–502. [Google Scholar] [CrossRef]
- Barazzetta, M.; Ghislandi, S. Family Income and Material Deprivation: Do They Matter for Sleep Quality and Quantity in Early Life? Evidence From a Longitudinal Study. Sleep 2017, 40, zsw066. [Google Scholar] [CrossRef]
- Wu, W.; Wang, W.; Dong, Z.; Xie, Y.; Gu, Y.; Zhang, Y.; Li, M.; Tan, X. Sleep Quality and Its Associated Factors among Low-Income Adults in a Rural Area of China: A Population-Based Study. Int. J. Environ. Res. Public Health 2018, 15, 2055. [Google Scholar] [CrossRef]
- Itani, O.; Jike, M.; Watanabe, N.; Kaneita, Y. Short sleep duration and health outcomes: A systematic review, meta-analysis, and meta-regression. Sleep Med. 2017, 32, 246–256. [Google Scholar] [CrossRef]
- Etindele Sosso, F.A.; Holmes, S.D.; Weinstein, A.A. Influence of socioeconomic status on objective sleep measurement: A systematic review and meta-analysis of actigraphy studies. Sleep Health 2021, 7, 417–428. [Google Scholar] [CrossRef] [PubMed]
- Zheng, W.; Luo, X.-N.; Li, H.-Y.; Ke, X.-Y.; Dai, Q.; Zhang, C.-J.; Ng, C.H.; Ungvari, G.S.; Xiang, Y.-T.; Ning, Y.-P. Prevalence of insomnia symptoms and their associated factors in patients treated in outpatient clinics of four general hospitals in Guangzhou, China. BMC Psychiatry 2018, 18, 232. [Google Scholar] [CrossRef]
- Foroughi, M.; Malekmohammad, M.; Sharafkhaneh, A.; Emami, H.; Adimi, P.; Khoundabi, B. Prevalence of Obstructive Sleep Apnea in a High-Risk Population Using the Stop-Bang Questionnaire in Tehran, Iran. Tanaffos 2017, 16, 217–224. [Google Scholar]
- Pallesen, S.; Sivertsen, B.; Nordhus, I.H.; Bjorvatn, B. A 10-year trend of insomnia prevalence in the adult Norwegian population. Sleep Med. 2014, 15, 173–179. [Google Scholar] [CrossRef]
- Bonuck, K.A.; Chervin, R.D.; Cole, T.J.; Emond, A.; Henderson, J.; Xu, L.; Freeman, K. Prevalence and persistence of sleep disordered breathing symptoms in young children: A 6-year population-based cohort study. Sleep 2011, 34, 875–884. [Google Scholar] [CrossRef]
- Sivertsen, B.; Krokstad, S.; Øverland, S.; Mykletun, A. The epidemiology of insomnia: Associations with physical and mental health. The HUNT-2 study. J. Psychosom. Res. 2009, 67, 109–116. [Google Scholar] [CrossRef]
- Xiang, Y.-T.; Ma, X.; Cai, Z.-J.; Li, S.-R.; Xiang, Y.-Q.; Guo, H.-L.; Hou, Y.-Z.; Li, Z.-B.; Li, Z.-J.; Tao, Y.-F.; et al. The prevalence of insomnia, its sociodemographic and clinical correlates, and treatment in rural and urban regions of Beijing, China: A general population-based survey. Sleep 2008, 31, 1655–1662. [Google Scholar] [CrossRef]


| Author’s Name & Year | Q1 | Q2 | Q3 | Q4 | Q5 | Q6 | Q7 | Q8 | Q9 | Q10 | Q11 | Q12 | Q13 | Q14 | Quality Score |
|---|---|---|---|---|---|---|---|---|---|---|---|---|---|---|---|
| Brouillette 2011 [26] | Y | Y | Y | Y | Y | N | Y | Y | Y | N | N | Y | Y | Y | Good |
| Karunanayake 2018 [27] | Y | Y | Y | Y | N | N | Y | N | Y | N | N | Y | Y | Y | Good |
| Garland 2018 [28] | Y | Y | Y | Y | Y | N | Y | Y | Y | N | N | Y | Y | Y | Good |
| Sutton 2001 [29] | Y | Y | Y | Y | N | N | N | Y | Y | N | N | NA | NA | Y | Fair |
| Tjepkema 2005 [30] | Y | Y | Y | Y | N | N | N | Y | Y | N | N | NA | NA | Y | Fair |
| Bassett 2014 [31] | Y | Y | Y | Y | N | Y | Y | Y | N | N | N | NA | N | Y | Fair |
| Gjevre 2014 [32] | Y | Y | N | Y | N | N | N | Y | Y | N | N | NA | NA | Y | Fair |
| Baiden 2015 [33] | Y | Y | NR | Y | N | N | N | Y | Y | N | N | NA | NA | Y | Fair |
| Nagy 2016 [34] | Y | Y | NR | Y | N | Y | Y | N | Y | N | N | NA | N | Y | Fair |
| Costanian 2017 [35] | Y | Y | Y | Y | N | N | N | Y | Y | N | N | NA | NA | Y | Fair |
| Patte 2017 [36] | Y | Y | Y | Y | N | Y | Y | Y | N | N | N | NA | N | Y | Fair |
| Chang 2018 [37] | Y | Y | Y | Y | N | N | N | Y | Y | N | N | NA | NA | Y | Fair |
| Laganiere 2019 [38] | Y | Y | NR | Y | N | Y | Y | N | Y | N | N | NA | N | Y | Fair |
| Vézina-Im 2019 [39] | Y | Y | Y | Y | N | N | N | Y | Y | N | N | NA | NA | Y | Fair |
| Yao 2019 [40] | Y | Y | Y | Y | N | N | N | Y | Y | N | N | NA | NA | Y | Fair |
| Jarrin 2013 [41] | Y | N | NA | Y | N | N | N | Y | Y | N | N | NA | NA | Y | Poor |
| Jarrin 2014 [42] | Y | N | NA | Y | N | N | N | Y | Y | N | N | NA | NA | Y | Poor |
| Matenchuk 2019 [43] | Y | Y | NR | Y | N | N | N | N | Y | N | N | NA | NA | Y | Poor |
| Seaton 2020 [44] | Y | Y | NR | Y | N | N | N | N | Y | N | N | NA | NA | Y | Poor |
| Studies Including Only Children and/or Adolescents < 18 Years Old | ||||||||||
| Study | Study Type | Type of Population | % Women | Mean Age or Age Range (years) | Sample Size (n) | Exposure | Exposure Measurement | Health Outcome | Health Outcome Measurement | Results and Conclusions |
| Brouillette 2011 [26] | Cross-sectional | Children from Montréal | 41 | 2–8 | 436 | Neighbourhood SES | Neighborhood characteristics were evaluated at the census tract level based on the 2006 Canadian census. | Obstructive Sleep Apnea (OSA) | PSG | Compared with the children without OSA, those with OSA were more likely to reside in disadvantaged neighbourhoods |
| Jarrin 2014 [42] | Cross-sectional | Children and adolescents recruited from schools and neighbourhoods in Montreal | 45.6 | 8–17 | 239 | (a) Income (b) Education (c) Social class | (a) Household income divided into 17 categories (b) Highest parental education divided into 9 categories (c) Subjective Social Status Scale-Youth Version (two 10-rung ladders: school and society, youth reported) | (a) Sleep quality (b) Daytime sleepiness (c) Sleep disturbances (d) Sleep duration | (a) youth-rated 10-point scale (b) Pediatric Daytime Sleepiness Scale (c) Children’s Sleep Habits Questionnaire (d) Self-reported sleep duration | In children, higher subjective SES predicted less daytime sleepiness and longer self-reported sleep duration and higher household income predicted longer parent-reported sleep duration. In adolescents, higher subjective SES was associated with better sleep quality and shorter parent-reported sleep duration, and higher household income was associated with fewer sleep disturbances. |
| Patte 2017 [36] | (a) Cross-sectional (b) Longitudinal cohort followed for 2 years | Adolescents 9th–12th grade from secondary schools in Ontario and Alberta | 53.9 | 6–14 | (a) 36,088 (b) 7394 | Income | School area average income (median household income of census divisions that corresponded with school postal codes according to data from the 2011 National Household Survey) | Sleep duration | (a) Short sleep duration (<8 h) (b) Sleep duration trajectories (short, low-normal, high-normal, long) | (a) Sufficient sleep was more likely among students attending schools in areas classified in the highest SES group (b) Attending schools in low-income areas predicted short and low-normal sleep duration trajectories over time |
| Costanian 2018 [35] | Cross-sectional | Toddlers from the general population | 49.6 | 1–2 | 3675 | (a) Income (b) Employment status (c) Education | (a) Household income (<$30,000, $30,000–<$60,000, $60,000–<$100,000, ≥$100,000) (b) Mother’s work status (currently working vs. not currently working) (c) Mother’s education level (college graduate or less vs. more than college graduate) | Sleep duration | Parent-reported sleep duration (<11 h vs. more) | Toddlers who came from a household with higher annual income were less likely to sleep <11 h per night |
| Chang 2018 [37] | Cross-sectional | Participants from the general population | 48.13 | 3–17 | 4924 | (a) Education (b) Income (c) Employment | (a) Highest level of education attained in the household for pre-schoolers, children and youth or by the respondent for adults and older adults (less than secondary school degree, secondary school degree, postsecondary school degree) (b) Household income adequacy (based on total annual household income and number of people living in the household and categorized as low, middle, or high) (c) Employment status (full-time, part-time, unemployed) for adults and older adults | Sleep duration | Self-reported or parent-reported (when participant have less than 12 years) sleep duration (recommended, short, long according to guidelines) | Among pre-schoolers, low household income was significantly associated with short sleep. |
| Laganiere 2019 [38] | Longitudinal cohort followed for 4 years | Children recruited at birth in obstetric clinics of Montreal and Hamilton | 26.56 | 0–4 | 529 | Global SES estimated with (a) education and (b) income | High SES (high maternal education level and high income) vs. middle/low SES (low on at least one of the variables) | Sleep rhythmic movements | Single question + Children ’s Sleep Habits Questionnaire) | Lower SES predicted sleep rhythmic movements in children |
| Matenchuk 2019 [43] | Cross-sectional | Newborn of a population-based birth cohort in Edmonton | 49.56 | 0.25 | 619 | Education | Maternal education (university degree vs. lower) | Sleep duration | Parent-reported sleep duration | Newborns of mothers without a university degree had significantly reduced sleep duration compared to those of mothers with a university degree |
| Studies Including Participants with All Ages | ||||||||||
| Study | Study Type | Type of Population | % Women | Mean or Range Age (years) | Sample Size (n) | Exposure | Exposure Measurement | Health Outcome | Health Outcome Measurement | Results and Conclusions |
| Sutton 2001 [29] | Cross-sectional | Adults from the general population | NA | ≥15 | 10,702 | (a) Education (b) Income (c) Employment | (a) Scale items are: some secondary or less, secondary graduation, some post-secondary, post-secondary degree or diploma (b) Income adequacy (lowest, next to lowest, middle, next to highest or highest) (c) working status (not in the work force, usually workdays, regular shift work) | Insomnia | Single question (yes vs. no) | Low socioeconomic status, reflected by having some secondary education or less, lowest income and not being in the work force, was associated with the presence of insomnia |
| Tjepkema 2005 [30] | Cross-sectional | Adults from the general population | NA | ≥15 | 36,984 | (a) Education (b) Income | (a) Scale items are: less than secondary graduation, secondary graduation, some postsecondary until postsecondary graduation (b) Household income (lowest, lower-middle, upper-middle, highest) | Insomnia | Insomnia symptoms frequency (none of the time, a little of the time, or some of the time vs. most of the time or all of the time) | People with less education and lower income were more likely to report insomnia |
| Jarrin 2013 [41] | Cross-sectional | Adults from advertisements in Montreal | 81.4 | 30–65 | 177 | (a) Income (b) Education (c) Employment (d) Subjective SES | (a) Household income (b) Years of education (c) Employment status (employed vs. unemployed) (d) MacArthur Scale of Subjective Social Status (scale 1–10) | (a) Sleep quality (b) Sleep latency (c) Sleep duration (d) Weekend oversleep (e) Daytime sleepiness | (a) Sleep quality (PSQI Global score) (b) Sleep latency (PSQI sleep latency subscale) (c) Weekday sleep duration (d) Difference between weekend and weekday total sleep duration (e) Measured with Epworth Sleepiness Scale (ESS) | Higher SES was associated with better sleep quality, shorter sleep latency, longer sleep duration, shorter weekend oversleeps and less daytime sleepiness. Subjective SES better predicted sleep duration, weekend oversleep and daytime sleepiness than objective SES. Objective SES better predicted sleep quality and latency than subjective SES. |
| Bassett 2014 [31] | Retrospective cross-sectional | Adults from the 2008 Montreal Neighborhood Networks and Healthy Aging Study | 64.81 | ≥25 | 2643 | (a) Neighborhood disadvantage (b) Social capital (c) SES | (a) Neighbourhood disadvantage measure was created using six census tract variables: unemployment rates, median household income, the percentage of immigrants, the percentage of single mothers, the percentage of renters, and the percentage of college educated residents (b) Social capital was measured with the network capital, generalized trust and neighborhood volunteering (c) SES score was created using principal components analysis of respondents’ income, education, and employment status | Restless sleep | Participants responded yes or no to the item “my sleep was restless.” extracted from the Center for Epidemiologic Studies Depression (CES-D) scale | Women were more likely to experience restless sleep than men. Network capital increased the likelihood of restless sleep in men but not women. High generalized trust decreased the odds of restless sleep in women. Neighbourhood disadvantages increased the odds of restless sleep in women but not men. The association among restless sleep, social capital, and neighbourhood environmental factors differed in male and female Montreal adults. |
| Gjevre 2014 [32] | Cross-sectional | Adults from the general population in Saskatchewan | 50.8 | >18 | 7597 | (a) Income (b) Education | (a) Household income adequacy (4 levels) Money left over at the end of the month (some, just enough, not enough) (b) Items used are: less than high school, completed high school, completed university, completed other postsecondary education | Excessive Daytime Sleepiness (EDS) | ESS score >10 | Not enough money left over at the end of the month increased the risk of EDS |
| Baiden 2015 [33] | Cross-sectional | Participants from the general population | 49.36 | >20 | 19,349 | (a) Education (b) Income | (a) Postsecondary education (no vs. yes) (b) Annual personal income (6 levels) | Insomnia | Insomnia symptoms (most/all of the time vs. none/a little of/some of the time) | Higher annual income was associated with less sleep disturbances |
| Nagy 2016 [34] | Cross-sectional | Parents with child of brain-to-society study in Montréal | 73.1 | 41.75 | 339 | (a) Parental social capital (b) Income | Position generator | Child sleep disturbances | Children’s Sleep Habits Questionnaire | Parents with higher social capital tended to have children with fewer total sleep disturbances than did parents with lower social capital |
| Chang 2018 [37] | Cross-sectional | Participants from the general population | 51.45 | 18–79 | 7250 | (a) Education (b) Income (c) Employment | (a) Highest level of education attained in the household for pre-schoolers, children and youth or by the respondent for adults and older adults (less than secondary school degree, secondary school degree, postsecondary school degree) (b) Household income adequacy (based on total annual household income and number of people living in the household and categorized as low, middle, or high) (c) Employment status (full-time, part-time, unemployed) for adults and older adults | Sleep duration | Self-reported or parent-reported (when participant have less than 12 years) sleep duration (recommended, short, long according to guidelines) | Among older adults, less than secondary school education and full-time employment were significantly associated with short sleep. Among adults and older adults, less than secondary school education was significantly associated with long sleep. Unemployed older adults were more likely to sleep longer. |
| Garland 2018 [28] | Retrospective cross-sectional | Adults from the general canadian population | 55 | ≥20 | 34,118 in 2002 And 23,089 in 2012 | Education | Secondary analysis of Data from the Canadian Community Health Survey-Mental Health cycles 2000–2002 and 2011–2012 | Insomnia | The question “How often do you have trouble going to sleep or staying asleep?” | Over a 10-year period, prevalence of insomnia symptoms increased from 15.6% to 17.1% between 2002 and 2012, representing an absolute increase of 1.5%. The likelihood of occurrence of insomnia symptoms was significantly influenced by education |
| Karunanayake 2018 [27] | Longitudinal | Adults from Canadian indigenous populations in Saskatchewan | 52.4 | ≥18 | 317 | (a) Income (b) Housing conditions (c) Employment status (d) Education (e) Marital status | Secondary analysis of Data from the First Nations Lung Health Project (FNLHP) | Excessive daytime sleepiness (EDS) | Epworth Sleepiness Scale (ESS) | This study showed an association between incidence of subjective EDS and less money left over at end of the month and having a house in need of repairs |
| Yao 2018 [40] | Cross-sectional | Adults from the general population | 56.91 | 45–85 | 19,584 | (a) Education (b) Income (c) Employment | (a) Education (middle school and under, secondary school, bachelor’s degree and above) (b) Annual personal income (<$20,000, $20,000–$49,000, $50,000–$99,000, ≥$100,000) (c) Employment status (employed vs. retired) | Possible RBD | Single question (yes vs. no) | Lower education level was a risk factor of possible RBD |
| Vézina-Im 2019 [39] | Cross-sectional | Women from the general population | 100 | 18–44 | 9749 | (a) Education (b) Income | (a) Items used are: less than high school; high school diploma; some postsecondary studies; postsecondary certificate/diploma or university degree (b) Household income | (a) Sleep duration (b) Insomnia | (a) Insufficient sleep duration (<7 h) (b) Insomnia symptoms (none/little of the time vs. some/most/all the time) | Lower education was associated with more frequent insomnia symptoms |
| Seaton 2020 [44] | Cross-sectional | Male employees from six workplaces in northern British Columbia | 0 | 18–66 | 227 | (a) Education (b) Income | (a) Items used are: some high school, completed high school, trades certification/college diploma, university degree (b) Items used are: >CAD $100,000, CAD $50,000–CAD $100,000, <CAD $50,000) | Sleep duration | Self-reported sleep duration | Education and income were not significantly associated with sleep duration |
Publisher’s Note: MDPI stays neutral with regard to jurisdictional claims in published maps and institutional affiliations. |
© 2022 by the authors. Licensee MDPI, Basel, Switzerland. This article is an open access article distributed under the terms and conditions of the Creative Commons Attribution (CC BY) license (https://creativecommons.org/licenses/by/4.0/).
Share and Cite
Etindele Sosso, F.A.; Kreidlmayer, M.; Pearson, D.; Bendaoud, I. Towards A Socioeconomic Model of Sleep Health among the Canadian Population: A Systematic Review of the Relationship between Age, Income, Employment, Education, Social Class, Socioeconomic Status and Sleep Disparities. Eur. J. Investig. Health Psychol. Educ. 2022, 12, 1143-1167. https://0-doi-org.brum.beds.ac.uk/10.3390/ejihpe12080080
Etindele Sosso FA, Kreidlmayer M, Pearson D, Bendaoud I. Towards A Socioeconomic Model of Sleep Health among the Canadian Population: A Systematic Review of the Relationship between Age, Income, Employment, Education, Social Class, Socioeconomic Status and Sleep Disparities. European Journal of Investigation in Health, Psychology and Education. 2022; 12(8):1143-1167. https://0-doi-org.brum.beds.ac.uk/10.3390/ejihpe12080080
Chicago/Turabian StyleEtindele Sosso, F. A., Marta Kreidlmayer, Dess Pearson, and Imene Bendaoud. 2022. "Towards A Socioeconomic Model of Sleep Health among the Canadian Population: A Systematic Review of the Relationship between Age, Income, Employment, Education, Social Class, Socioeconomic Status and Sleep Disparities" European Journal of Investigation in Health, Psychology and Education 12, no. 8: 1143-1167. https://0-doi-org.brum.beds.ac.uk/10.3390/ejihpe12080080