Article

A Validated RP-HPLC Method for the Determination of Butamirate Citrate and Benzoic Acid in Syrup, Based on an Experimental Design Assessment of Robustness

by
Antonios-Dionysios G. Neofotistos
1,
Kostas Gkountanas
2,
Haris Boutsikaris
2 and
Yannis Dotsikas
1,*
1
Laboratory of Pharmaceutical Analysis, Department of Pharmacy, National and Kapodistrian University of Athens, Panepistimioupoli Zografou, GR-157 71 Athens, Greece
2
Greek Military Pharmaceutical Laboratories, Tavros, GR-118 53 Athens, Greece
*
Author to whom correspondence should be addressed.
Submission received: 19 August 2021 / Revised: 16 September 2021 / Accepted: 23 September 2021 / Published: 27 September 2021
(This article belongs to the Special Issue Current Trends in Chromatography for Bioanalytical Applications)

Abstract

:
A reversed-phase high-pressure liquid chromatography (RP-HPLC) method was developed and subsequently validated for the simultaneous determination of butamirate citrate (BC) and benzoic acid (BA) in cough syrup. The separation was performed employing a cyanopropyl column with a mobile phase consisting of 50%/50% v/v MeOH/NaH2PO4 * H2O 50 mM aqueous solution pH = 3.0. The quantitation was achieved with a diode array detector (DAD) at 210 nm. The method demonstrated a congenitally satisfactory separation, yet the acquired peaks were asymmetrical. This effect was eliminated by using 1% triethylamine in the buffer solution as a silanol blocker. In addition, the method was found to unequivocally assess the target analytes in the sample matrix and fulfilled the required specifications in relevance to specificity, linearity, accuracy, precision and stability of both the standard solutions and of the sample solutions. Lastly, an experimental design was designed in order to assess the robustness of the proposed assay. To this purpose, a graphical and a statistical approach were utilized and compared to identify the factors that should be strictly controlled during each execution of the method.

1. Introduction

Butamirate citrate (BC) is a non-opioid central cough suppressant [1]. It is widely used in dry, non-productive cough and is believed to act on the cough center in the medulla oblongata, causing no respiratory suppression [2,3,4]. The drug is most commonly prescribed in the form of syrup [4,5], while controlled-release tablets and oral solutions constitute other available formulations [6]. Benzoic acid (BA) is an antimicrobial preservative mainly used in liquid pharmaceutical formulations to prevent the alteration of products. Most significantly, the role of preservatives in syrup preparations is quite prominent for the excipients and in some cases, the drug itself may be destroyed by different microorganisms. That would eventually lead to spoilage of the preparation as a whole [7]. By and large, benzoic acid and its p-hydroxy esters with different alcohols, also known as parabens, represent one of the most important groups of preservatives in pharmaceutical industry.
In spite of being commercially available on the European market and many other markets around the world, butamirate citrate is not officially described in any pharmacopoeia [4,5] and also no pharmacopeial monograph was reported for its determination in syrup [8]. According to the literature, the number of analytical methods having been reported for the quantification of BC in pharmaceutical dosage forms, e.g., in cough preparations, is relatively limited. These methods refer to techniques such as UV-visible spectrophotometry followed by derivative transformation of the acquired spectral data [5,9].
In complex matrices like syrup, BC cannot be directly determined by zero-order spectrophotometry, as the presence of different excipients completely covers the spectrum. Hence, suitable data processing leads to sensitive discrimination against any potential interference arising from no-specific matrix absorptions [5]. Some studies include a stage of derivatization for the photometric measurement of colored derivatives of BC [10,11], while some others refer to the use of chiral solvating agents and subsequent capillary electrophoresis [12]. Yet, more and more references have proposed the identification and quantification of either BC [5,13,14,15] or BA [7,16,17,18] by HPLC in recent years. In addition, the simultaneous separation of both analytes has been described once [4]. With respect to medicines, even though pharmacopoeia assays still rely quite heavily on direct UV spectroscopy, it is the UV monitoring combined with a preliminary HPLC separation that is mainly preferred by industry [19]. Therefore, the laborious and time-consuming procedures of sample extraction and/or sample derivatization included in many of the aforementioned spectroscopic methods can be avoided.
The present study aimed to develop and validate a simple, rapid, low cost and reproducible HPLC method for the quantitative determination of BC and BA in syrup. This formulation is a product of the Greek Military Pharmaceutical Laboratories in Athens, Greece. Regarding routine-based analysis, the employment of an uncomplicated and fast method is a matter of utmost importance. Moreover, since there is only one HPLC method reported in the literature to determine both analytes in cough preparation [4], it was considered useful to elaborate on that topic. Our efforts were mainly focused on the development of a novel method with a shorter run time (8 min in [4]) and a more acceptable peak symmetry of BC. The analytical procedure was designed and subsequently validated to rationally assess its performance characteristics throughout experimental documentation. The method itself proves to be suitable for its intended purpose (fitness for purpose). Furthermore, for the assessment of robustness a fractional factorial experimental design was utilized, with graphical and statistical data analysis, in an attempt to reveal the factors that “threaten” the robustness of the assay and should be carefully controlled.

2. Materials and Methods

2.1. Reagents and Solvents

Bulk forms of BA and BC syrup (Lot 191022911-Exp October 2024) were provided by the Greek Military Pharmaceutical Laboratories. Each 5 mL of syrup was labeled to contain 5 mg of BC. HPLC-grade methanol & acetonitrile and UPLC-grade water were purchased from Sigma-Aldrich (St. Louis, MO, USA). Sodium dihydrogen phosphate monohydrate, triethylamine and ortho-phosphoric acid were of analytical grade and obtained from Sigma-Aldrich, as well.

2.2. Instrumentation

A VWR Hitachi Chromaster HPLC system (Tokyo, Japan) was employed for the analysis. The system consisted of an automated sample injector equipped with a 100 μL loop (Auto Sampler 5260), a pump, an online degassing unit and a PDA detector. The chromatographic separation was carried out on a Pinnacle II Cyanopropyl-silane 250 mm × 4.6 mm, 5 μm column (Restek Corporation, Bellefonte, PA, USA). The column was kept in an integrated oven (Column Oven 5310). The pH measurements were conducted with three digital units Metrohm (913) pH meter (Herisau, Switzerland), calibrated with buffer solutions of pH 4.0 and 7.0. During the assessment stage of the method’s intermediate precision, an additional Merck-Hitachi HPLC system was employed. The system was equipped with a 200 μL loop autosampler, a pump, an external column oven and a variable wavelength (190–600 nm) UV Detector. Both HPLC systems were connected to a PC unit and the detectors output data were generated, collected, processed and recorded using the chromatographic software package Clarity VA v. 15.9.0 (DataApex®, Prague, Czech Republic).

2.3. Chromatographic Conditions

The mobile phase was prepared by mixing methanol and 50 mM sodium dihydrogen phosphate monohydrate aqueous solution in a ratio of 50:50, v/v. The salt solution contained 1% triethylamine (TEA), whereas the pH had been adjusted to 3.0 ± 0.1 with ortho-phosphoric acid. The mobile phase was filtered and degassed by means of vacuum filtration (off-line degassing) before each run so as to avoid pump-delivery problems or spurious peaks in the detector output and ensure operational reliability. A flow rate of 1.5 mL/min was set, with an injection volume of 10 μL and a total run time of 6 min. The column temperature was regulated at 36 °C and UV detection was performed at 210 nm.

2.4. Preparation of Stock and Working Solutions

Stock standard solutions of BC (500 μg/mL) and BA (1000 μg/mL) were prepared by accurately weighing the appropriate amount of analytes and dissolving them in MeOH-H2O 50:50, v/v, into 100 mL volumetric flasks to yield stock solutions. The solutions were stored in the refrigerator at 6 °C. The working standard solution (reference solution) was obtained by sequential dilution(s) of the respective stock solutions with mobile phase to give concentration(s) in the designated range.

2.5. Sample Preparation

As for the sample preparation, accurately measured volumes of syrup (1 mL) equivalent to 1 mg of BC (and 2 mg of BA) were diluted to 20 mL with mobile phase to provide the working sample solution (test solution). This solution was filtered through a PVDF 0.45 μm syringe filter, before being analyzed. Mobile phase was employed as a diluent for both standard and sample working solutions to minimize the possibility of inadequate buffering of the sample during separation [20].

2.6. Validation Procedures

As soon as the chromatographic conditions were established, a validation of the method was performed to provide documented evidence and assure its reliability during normal use. Based on ICH guidelines, the following parameters were assessed: specificity, stability, linearity, accuracy and precision.
Starting from specificity, the protocol was carefully designed so as to allow for a probing check of the potential interference (if any) between the analytes of interest and other components that are expected to be present in the sample matrix, such as excipients and/or impurities. To do this, a series of representative chromatograms were thoroughly evaluated, namely the chromatograms of the standard (reference) solution of BA, the standard (reference) solution of BC, the standard (reference) mixture of both BA and BC, the sample (syrup) solution, the placebo syrup solution, the placebo syrup solution spiked with BA, the placebo syrup solution spiked with BC and the dissolution media (diluent) solution. Each test solution was analyzed in triplicate and the mean peak area was then calculated.
In the frame of stability testing, the stability of the working standard solution of BC and BA (50.0 and 100 μg/mL, respectively) was assessed during the analytical day and up to a two-day interval. Three reference solutions were obtained by diluting the three independent stock standard solutions and then measured at four-time intervals (0 h, 5 h, 24 h and 48 h). The stability of the sample solution was also determined in the same way. Three independent test solutions were obtained by dilution of accurately measured volumes of syrup and were then assayed at the same time intervals.
Linearity enabled assessing whether the analytical procedure can obtain results that are directly proportional to the concentration (amount) of the analytes was assessed. This ability was evaluated within a given range, namely 50−150% (50%, 75%, 100%, 125% and 150%) of the expected concentration of BC (50.0 μg/mL) and BA (100 μg/mL) in a sample test solution during the assay. Five standard solutions were prepared by volumetric dilutions of a stock mixture solution with mobile phase and each of them was analyzed in triplicate (three consecutive injections). More specifically, the following concentrations were prepared: 25.0, 37.5, 50.0, 62.5 and 75.0 μg⁄mL for BC, while for BA the relevant concentrations were 50.0, 75.0, 100, 125 and 150 μg⁄mL. At every level and for each analyte, the mean (average) peak area of the triplicate injections was plotted against the respective concentration of the analyte in a given standard solution.
The accuracy of an analytical method expresses the closeness of agreement between an accepted reference value and the respective value found in a sample. Regarding a drug product, accuracy is evaluated by adding known quantities of the target analytes to the placebo syrup (spiking step). The latter contains all of the excipients of the final product. Accuracy is measured as the percentage of analyte recovered by the assay (%R), following the analysis of the aforementioned synthetic mixtures [20]. It is generally preferable that at least nine determinations should be performed, covering a minimum of three concentration levels. In this study, for each one of the BC fortification levels of 37.5 μg/mL (75%), 50.0 μg/mL (100%), and 62.5 μg/mL (125%), a total of three independent spiked samples were prepared. Regarding BA, the respective values were 75.0 μg/mL (75%), 100 μg/mL (100%) and 125.0 μg/mL (125%). Each test solution was analyzed once.
The precision of an analytical method is defined as the closeness of agreement among all of the individual test results, derived from a series of measurements by multiple sampling of the same homogeneous sample under the prescribed conditions [19,20]. Depending on the context under which the precision is being evaluated, precision can be further classified as method repeatability, intermediate precision, reproducibility and system precision. Method repeatability refers to the ability of the method to generate the same results over a short time interval under identical conditions [20].
In the current study, six independent spiked samples were prepared at the central fortification level (100%) for BC and BA (50.0 and 100 μg/mL, respectively). Intermediate precision refers to the agreement between the results from two or more method repeatability procedures, due to within-laboratory variations. In this study, the method repeatability protocol was performed on two additional days: by a different analyst on the second day, and employing a different HPLC system, as well as reagents from a different lot (buffer) or a different supplier (MeOH, H2O), on the third day. Reproducibility was not estimated, as the current analytical method is not intended to be transferred to another laboratory. Finally, system precision ascertains the suitability and effectiveness of the operating system as a whole [21] and is assessed with the system suitability test (SST). The latter is performed periodically and constitutes an integral part of an analytical method. In this study, the selected SST responses that were monitored prior to sample analysis are the chromatographic area (A), retention time (tR), column plate number (N) and the asymmetry factor (As) of each peak, as well as the critical peak pair resolution (Rs) for BA and BC. Five replicate injections of a standard solution were performed.

2.7. Robustness Testing Set-Up

The robustness of an analytical procedure is a measure of its capacity to remain unaffected by small but deliberate variations in method parameters, providing an indication of its suitability and reliability during normal use [20,21]. The robustness test evaluates the potential sources of variability for numerous responses of an analytical method, including those for which the system suitability test (SST) is carried out. In order to examine these sources, a number of method parameters (factors) from the operating procedure has to be selected and assessed in a designated interval. In the current study, the list of the factors under evaluation included the column flow, the % MeOH content in the mobile phase, the column temperature (T), the wavelength of detection (λ) and finally the pH, the salt concentration (mM) as well as the % Et3N content in the buffer solution. These factors were singled out based on their likelihood to be changed when the method will be carried out by different analysts and/or on different instruments. The interval between the extreme levels for each factor was situated symmetrically around the nominal level (Table 1). The selected monitored responses were the ones chosen in the SST.
The aforementioned factors were examined in a fractional factorial design (FFD) for a more advanced estimation of the robustness. Given the number of the factors (k = 7) which are examined, the number of the proposed experiments in the case of a grade three FFD is 27–3 = 16, with almost zero possibility of losing important data. For practical reasons, the experiments proposed by the FFD were blocked so as their execution to be performed in a more convenient way.
Three additional experiments performed at nominal conditions are usually incorporated in the experimental design to complete the experimental set-up of 19 experiments in the current study (Table 2). Design-Expert v.10-trial version (Stat-Ease-Inc, Minneapolis, MN, USA) and Office Excel 2013 (Microsoft, Redmond, WA, USA) were utilized for the statistical evaluation of the obtained data.

3. Results and Discussion

3.1. Method Development

During the method development stage, a systematic trial-and-error approach was adopted in order to reveal the right experimental conditions for an acceptable HPLC separation, primarily in terms of an adequate resolution and a reasonable run time (conflicting goals). An accurate regulation of the pH was quite critical, considering the chemical nature of the target analytes; a weak acid with pKa = 4.19 (BA) and a weak base (BC) with pKa = 9.41. When ionizable compounds are separated, it is necessary to buffer the mobile phase so as to maintain a constant pH and reproducible retention during the separation. The employment of NaH2PO4 * H2O was decided because of its enhanced stability and buffering capacity, namely the ability to maintain the pH of a solution in a narrow range. With regard to the organic modifier, given the need to develop a simple, less time-consuming and less cost-effective method, a plain solvent system without mixtures was decided. Acetonitrile was used in the first place in all trials.
A number of scouting trials in a non-polar (C18 250 mm × 4.6 mm, 5 μm) and then in a relatively polar stationary phase (Biphenyl 250 mm × 4.6 mm, 5 μm) showed a long delay elution of BC combined with a quite rapid elution of BA, close to the solvent front, and a co-elution of these analytes, respectively. Poor retention of an ionic solute is most attributed to its ionization, which can cause a marked decrease in values of k [20]. Moreover, because of the different nature of the target analytes (acidic character vs. basic character), changes in pH are expected to affect their ionization state (and therefore their polarity and retention behavior) in a clearly negative way. These facts led to the final selection of a cyano stationary phase, the use of which has been reported only once in relation to the determination of BC [14]. This special packing material consisted of a traditional monomeric cyanopropyl-silane, chemically bonded on the surface of base-deactivated spherical silica to form the final stationary phase [22]. In addition, endcapping was performed to shield solutes from potentially free silanols. Columns of this kind are considered the most polar amongst reversed-phase packings and the least polar amongst normal phase packings. They are often referred to as ‘‘moderately polar columns’’ [19] and are recommended as an excellent choice for the analysis of protonated bases [22], e.g., butamirate.
The analytical procedure described herein demonstrated a congenitally satisfactory separation during each trial of method development stage, and a baseline resolution was observed; the valley between the two peaks returned to baseline with values of Rs > 3, with a common goal for the separation of adjacent peaks to be ≥2 [20]. However, despite the high values of Rs, the method produced quite asymmetrical peaks; therefore, corrections were immediately made. Peak tailing can be assessed by either the asymmetry factor, As, or the tailing factor, Tf, with the former variable used in this study. Poor peak shapes most commonly stem from unwanted secondary interactions of residual silanol species on the solid support (silica surface in this case) and ionizable basic analytes. To block ionized silanols, an amine modifier, namely triethylamine (Et3N) was added to the aqueous solution in sufficient concentration; at first 0.5% and finally 1.0%. It was also considered useful that the separation be carried out at low pH values so that the ionization of silanol sites be suppressed (pKa of SiOH ≈ 3.50).
As for the interpretation of the acidic analytes tailing, i.e., benzoic acid, the origin of such peak tailing is as yet not fully understood. In addition, a higher buffer concentration was employed, 50 mM instead of 25 mM, that is, to minimize silanol effects. In this study, a minor but steady tension for peak shape improvement was noticed when the column was kept at 36 °C. As far as the organic modifier is concerned, MeOH is known to cause much fewer solubility problems than tetrahydrofuran (THF) and acetonitrile (ACN), provided that comparisons are made for the same %B and pH. Moreover, the extent of tailing generally decreases when MeOH and THF are employed instead of ACN, probably due to hydrogen bonding interactions with lone acidic silanols. Last but not least, the use of ACN is usually not recommended in the case of cyano-columns, as both dipole and π–π interactions (between polar aromatic solutes and the column) are strongly inhibited. Due to the aforementioned reasons, ACN was substituted by MeOH.
The modifications described in the above paragraphs allowed for a striking decrease in peak tailing, giving asymmetry factors of values as low as 1.5 for BA and 1.4 for BC, which are acceptable with a very good resolution and a short run time (Figure 1).

3.2. Validation Data
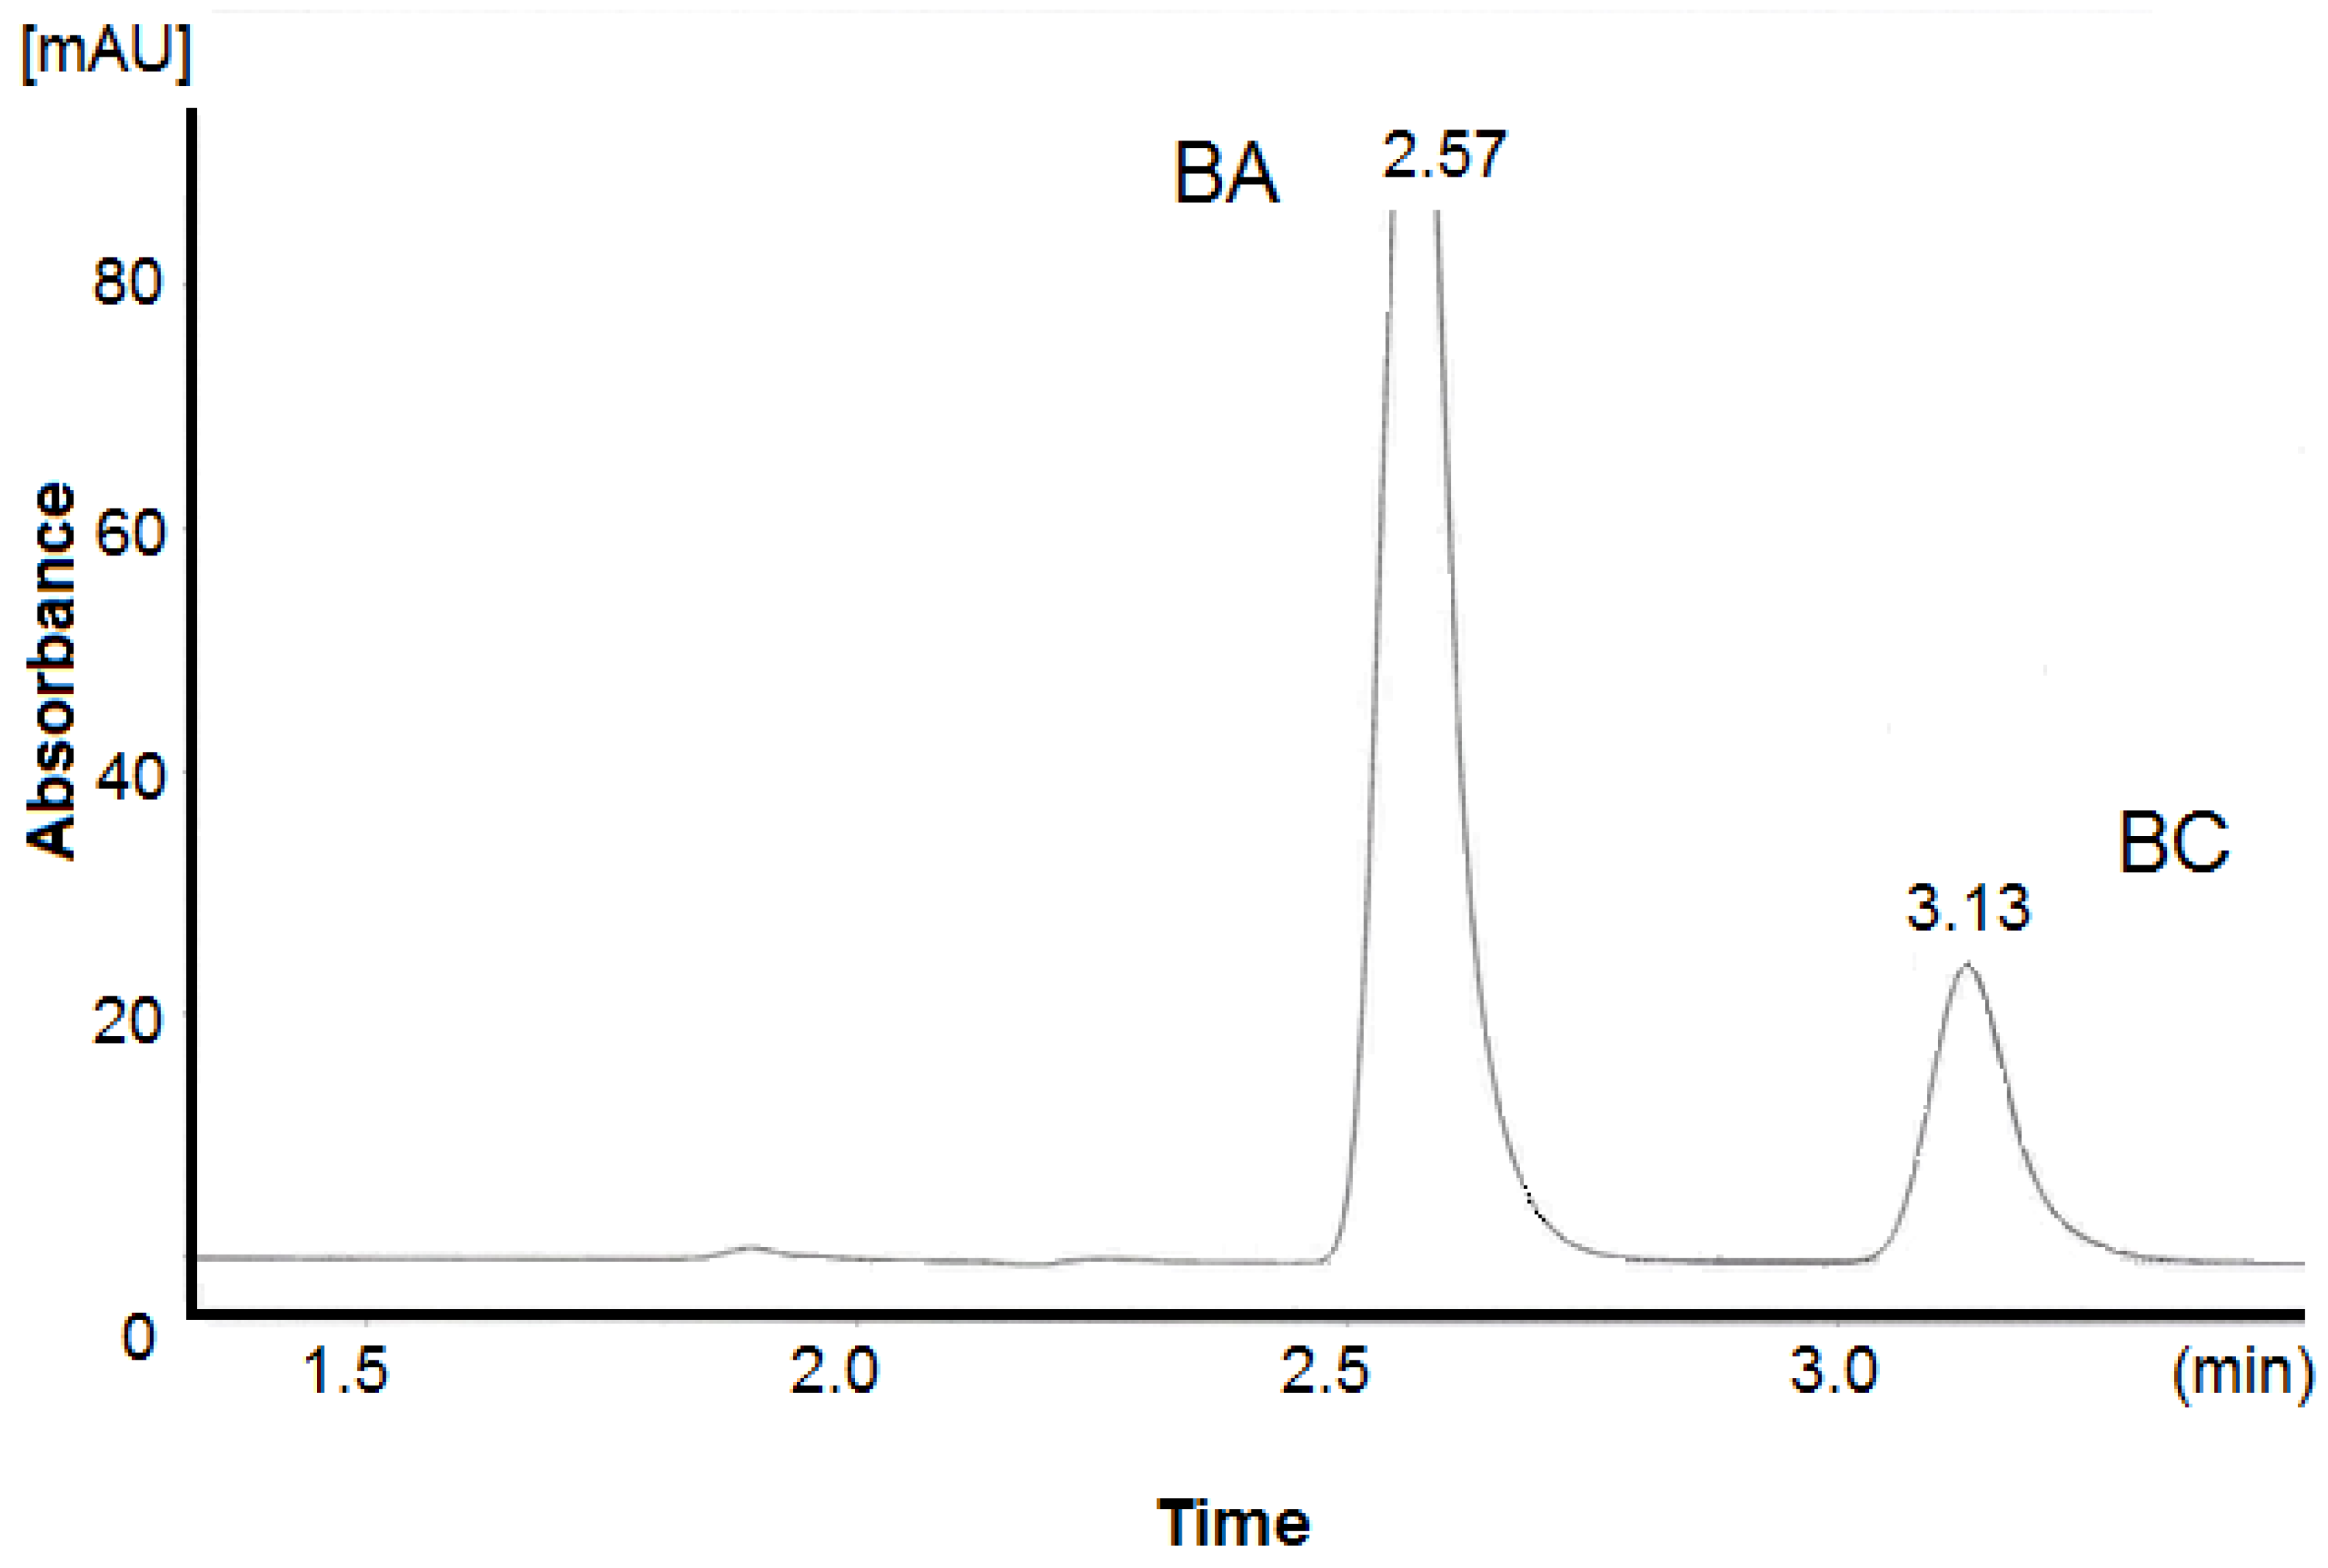
3.2.1. Specificity

The method was found to clearly distinguish the analytes of interest among other species and at the same time being unaffected by the presence of these spiked materials, e.g., excipients and colourants. With respect to the placebo solution, the latter additives were spiked in a suitable fortification level equivalent to their expected concentrations in a sample test solution during a routine analysis.

3.2.2. Stability

Both of the standard and sample working solutions were found to be stable for both compounds, kept in either ambient or cooled conditions. %RSD values were estimated for different time intervals, including 0 h (fresh sample). More specifically, with regard to the standard solution, %RSD values of ≤1.1 and 1.0 were obtained for BC and BA, respectively. As for the sample solution, low %RSD values were again estimated: ≤1.3 and 0.78% for BC and BA, respectively.

3.2.3. Linearity

A calibration curve was constructed for each analyte by plotting the mean peak area values versus the respective concentration. Regression analysis was performed on the resultant curves and the linear regression equations were computed. The regression equations of the calibration curves were found to be:
y = −2.2 (± 1.7) + 3073 (± 31) ∗ x for BC and
y = 3.6 (± 3.4) + 5570 (± 32) ∗ x for BA.
The requirements regarding correlation coefficients ≥0.998 (r = 0.9998 for BC, r = 0.99995 for BA) were fulfilled. The residual plots for both analytes showed a fairly random pattern, and no outliers were revealed; all the points were randomly dispersed around the horizontal axis, indicating that the linear model provided a decent fit to the data.

3.2.4. Accuracy

The requirements of a mean recovery of 98% ≤ %R ≤ 102% for each level (75%, 100% and 125%), as well as of 98% ≤ %R ≤ 102% between the three levels (nine independent replicates in total) were fulfilled for both analytes. More specifically, the obtained ranges of %R were 99.78–100.7 and 99.79–101.3 for BC and BA, respectively.
In addition, the criterion %RSD ≤ 1 in both cases was met. %RSD values of ≤0.56 and 0.74 were obtained for BC and BA, respectively.

3.2.5. Precision

Regarding method repeatability, the requirements of a mean recovery of 98% ≤ %R ≤ 102% and %RSDr ≤ 2 were fulfilled (%RSDr ≤ 0.52 and 0.30 for BC and BA, respectively). The collected primary data (peak area) were subjected to Dixon’s Q-test before proceeding with the calculation of the % recovery, R, (final data), and no outliers were revealed.
The intermediate precision data from 3 days were pooled and processed. The requirements of a mean recovery of 98% ≤ %R ≤ 102% and %RSDR = %RSDIP = grand RSD ≤ 2 were fulfilled (%RSDIP ≤ 1.0 and 0.59 for BC and BA, respectively). What is more, the %RSDIP was re-calculated with one-way ANOVA so as to maximize the integrity of the results. The calculated RSD value with respect to both BC and BA met the aforementioned criterion of ≤2% (≤1.2 and 0.67 for BC and BA, respectively). Lastly, the calculated Horwitz ratio (HorRat) of 0.36 (<0.5) for BC and 0.21 (<0.5) for BA demonstrated a quite satisfying level of method precision.
Finally, regarding system precision, the obtained results were acceptable for the selected SST responses. More specifically, for both BC and BA, %RSD values for the chromatographic areas (A), retention times (tR), column plates number (N), the asymmetry factor (As) of each peak, as well as the critical peak pair resolution (Rs) were <1.0%. Furthermore, the column plates number (N) were >4000 for both compounds and the same holds true for the asymmetry factor (As < 1.6).

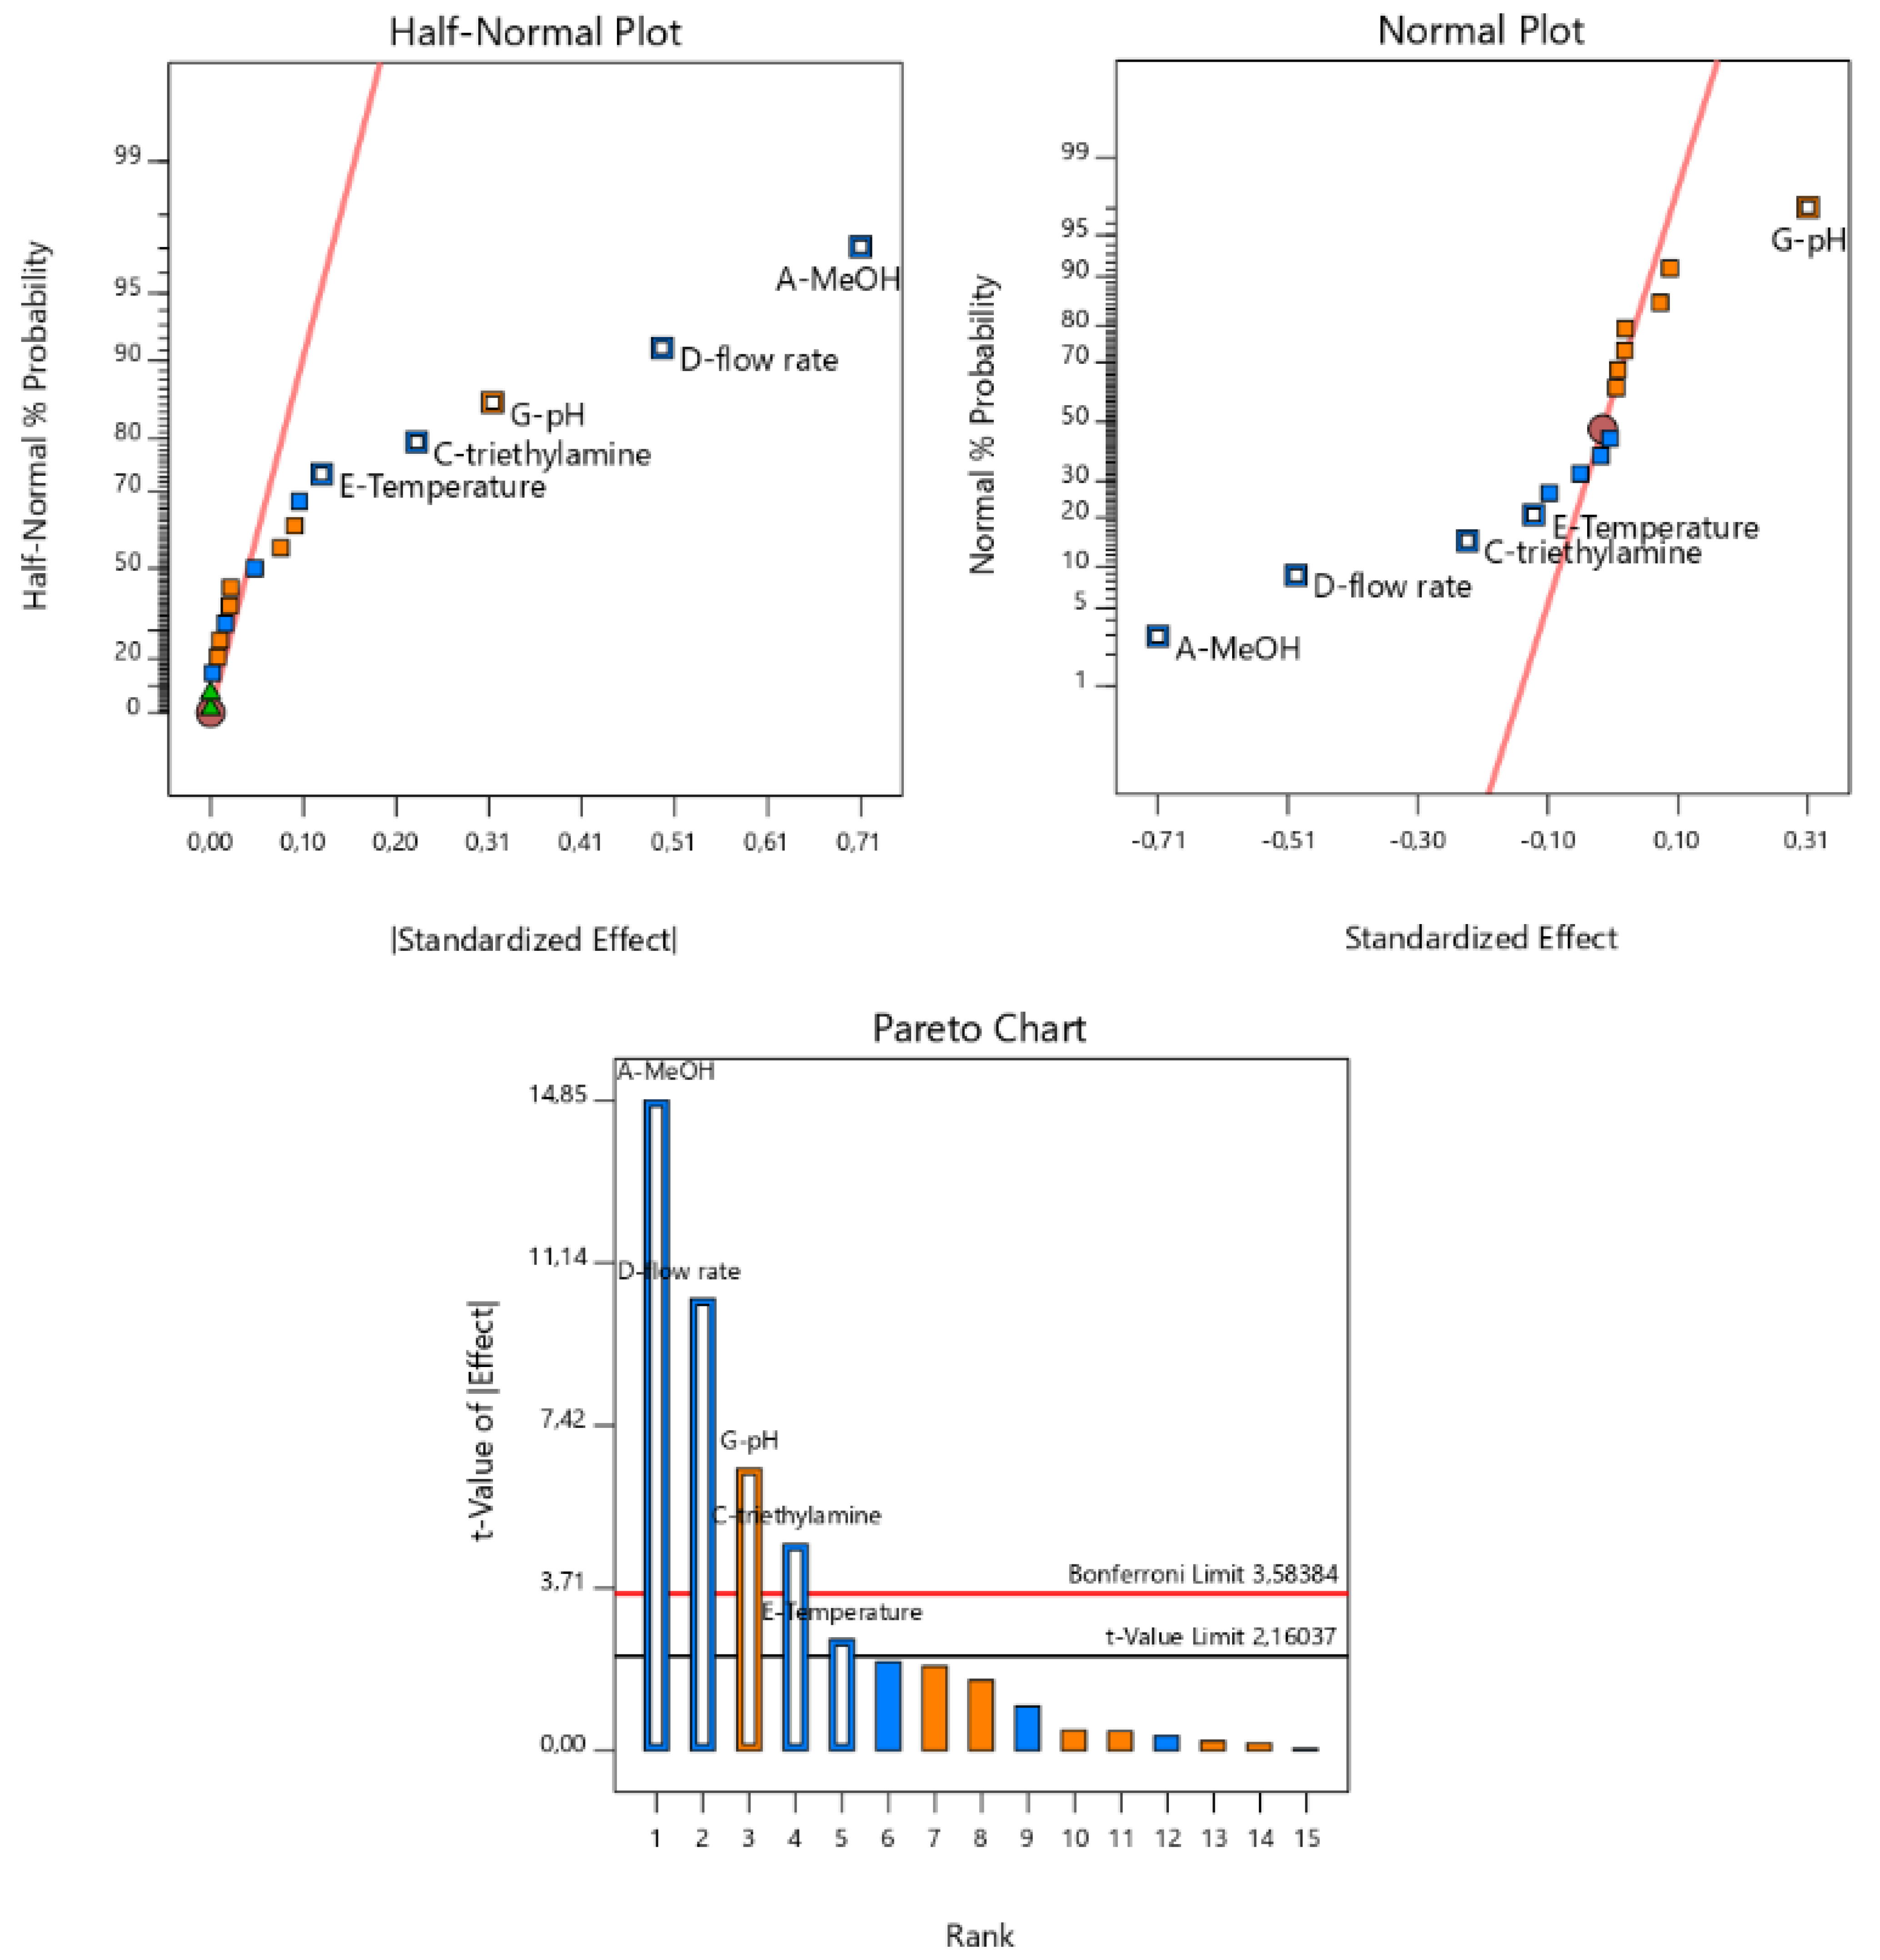
3.3. Robustness Testing Data

After the conduction of the 19 experiments of FFD, the following results were obtained (Table 3).
Then, the data were assessed either via the graphs of Design Expert software or by a more advanced statistical approach [21]. The first step of these statistical calculations includes the evaluation of the importance of a given factor by estimating its effect on the response(s) of the method. This effect is calculated employing the following equation:
E x = Σ Υ ( + ) Ν / 2 Σ Υ ( ) Ν / 2 × 100 %
Where X represents the respective factor, Ex is the effect of factor X on the response Y, ΣY(+) and ΣY(−) are the sums of the responses where X is set at the extreme levels (+) and (−) respectively and N is the number of the experiments.
The estimated effects of each of the seven experimental factors under examination on each one of the nine monitored responses are presented in Table 4. In the aspect of the statistical interpretation, a numerical limit value leads to the identification of statistically significant effects (Ex). This critical value, also denoted as critical effect (Ecritical), is usually derived from the t-test and refers to each given response:
t = | E x | ( SE ) e     t critical
(SE)e is the standard error of an effect, representing the experimental variability within the design. The aforementioned equation can be rewritten as:
| E x |     E critical   =   t critical   ×   ( SE ) e
For robustness experiments with the current approach, this (SE)e can be estimated via an intermediate precision estimates-based approach. According to this, the standard error of an estimated effect is calculated from the equation for the standard error on a difference of means:
SE = SD a 2 n a + SD b 2 n b
where SDa2 and SDb2 estimate the variances of the two designed sets of measurements and na, nb are the numbers of measurements in those sets. Since SDa2 and SDb2 are estimated by the same variance, SD2, and na = nb = N/2, the standard error of an effect subsequently becomes:
( SE ) e = SD 2 N / 2 + SD 2 N / 2 = 4 × SD 2 N
The variance SD2 can be determined from the data gained by the replicated experiments conducted at nominal levels (herein n = 3). The critical effect (Ecritical) is most frequently calculated at a significance level a = 0.05 (95%). For a = 0.05 and ν = n−1 degrees of freedom, tcritical = 4.303. Based on Table 5, the calculated effect (Ex) of a given factor on a response with a specific critical effect (Ecritical) is considered significant at the designated level a, only if |Ex| ≥ Ecritical.
Alternatively, a graphical approach can also be employed to obtain an acceptable interpretation of the effects. The graphical identification of important effects is most commonly applied with a normal probability plot or a half-normal probability plot. These plots lead to similar conclusions—non-significant effects tend to fall on a straight line through zero, while significant effects deviate from it. Yet, a normal probability plot allows for determining whether a given effect is positive or negative, whereas a half-normal probability plot allows for comparing the magnitude, therefore the importance, of different effects. Finally, the Pareto charts constitute a useful tool in evaluating the influence of a factor on a response: the experimental factors which exceed the Bonferroni limit (upper line) are significant, while the ones that do not exceed the t-value limit (lower line) are non-significant. The factors between the two limits are potentially significant, and their characterization is subject to the analyst’s experience (Figure 2).
Table 6 summarizes the statistically significant factors for each response by both approaches.
The two approaches exhibit an agreement of 71%. In general, the statistical interpretation evaluates the significance of each factor in a more firm and less subjective way than the visual one. As a result, it is normally expected to reveal more significant factors. Yet, a marked issue is being raised: one should notice that the Ecritical value for the responses As BA, tR BA, tR BC and Rs, is equal to 0.00, due to a zero-standard deviation (SD) value in the replicated experiments conducted at nominal levels. Therefore, an experimental factor with a relatively low calculated effect (Ex) on each of the aforementioned experimental responses could still be considered significant as |Ex| ≥ Ecritical. This ambivalent subject refers to the following cases: % Et3N-tR BC (Ex = 0.030), pH-tR BC (Ex = 0.027), T-As BA (Ex = 0.011), Csalt-Rs (Ex = 0.020), λ-As BA (Ex = 0.039), λ-Rs (Ex = 0.016), % MeOH-As BA (Ex = 0.091) and pH-As BA (Ex = 0.029). In addition, these factors are not evaluated as significant in the case of the alternative approach (graphical interpretation). Hence, they could be evaluated as non-significant in relevance to the respective responses. Finally, the effect of the column flow on the response As BC could be evaluated as non-significant as well, since it is proposed solely by the graphical approach and also lies between the two limits (Bonferroni limit, t-value limit).
After the proposed exclusion of the vague cases described above, the two methods exhibit an agreement of 85%. Each one of the seven experimental factors under evaluation is found to be significant for at least two of the nine monitored responses. The column flow seems to be a quite crucial factor as it has an impact on six responses, while the factor Csalt does not seem to heavily impair the method performance. The pH and the % Et3N of the buffer solution should be strictly regulated as they have an effect on numerous responses. The wavelength setting (proposed by both methods) is essential for a reproducible absorption for BC and BA. Finally, the factors % MeOH and column temperature seem to have an effect mainly on peak resolution.

4. Conclusions

A rapid, reproducible and simple gradient RP-HPLC method was developed for the simultaneous quantitative determination of butamirate citrate and benzoic acid in syrup. The designed analytical procedure was validated so that its performance characteristics be rationally assessed throughout an experimental documentation, and the method itself prove to be suitable for its intended purpose (fitness for purpose). The proposed method met the demands regarding selectivity, stability, linearity, accuracy and precision. Therefore, it allows for the determination of the aforementioned target analytes levels in a relatively complex matrix (syrup) with little sample pretreatment. The method is suitable for the routine analysis of both bulk and final product preparations as well as of aged syrup formulations during long-term stability studies. In addition, the robustness of the method was estimated via an experimental design and a combination of graphical/statistical interpretation of the results. Thus, the experimental factors that have a significant effect on each response can be revealed and attention could be paid to specific parameters for assurance of the method robustness.

Author Contributions

Conceptualization, Y.D. and H.B.; methodology, A.-D.G.N. and K.G.; validation, A.-D.G.N. and K.G.; writing—original draft preparation, A.-D.G.N. and K.G.; writing—review and editing, Y.D. and H.B.; supervision, Y.D. and H.B. All authors have read and agreed to the published version of the manuscript.

Funding

This research received no external funding.

Institutional Review Board Statement

Not applicable.

Informed Consent Statement

Not applicable.

Data Availability Statement

Data presented in this study are available on request from the corresponding author.

Acknowledgments

The authors would like to thank the personnel of Greek Military Pharmaceutical Laboratories for their assistance during the study.

Conflicts of Interest

The authors declare no conflict of interest.

References

  1. International Union of Pure and Applied Chemistry (IUPAC). Available online: https://iupac.org/ (accessed on 20 June 2021).
  2. Bayram, E.; Karakaya, P.; Topcu, Y.; Yis, U.; Hiz, S. Acute Cervical Dystonia After the First Dose of Butamirate Citrate. Pediatr. Emerg. Care 2013, 29, 80–81. [Google Scholar] [CrossRef] [PubMed]
  3. Brayfield, A. Martindale: The Complete Drug Reference, 39th ed.; Pharmaceutical Press: London, UK, 2017. [Google Scholar]
  4. Haider, M. Development and Validation of a Stability Indicating HPLC Method for the Estimation of Butamirate Citrate and Benzoic Acid in Pharmaceutical Products. J. Chromatograph. Separat. Techniq. 2011, 2, 2. [Google Scholar] [CrossRef] [Green Version]
  5. Malliou, E.T.; Antoniou, C.G.; Koundourellis, J.E. Determination of Butamyrate Citrate in Cough Preparations by Derivative UV Spectrophotometry and High Performance Liquid Chromatography. Anal. Sci. 2003, 19, 563–568. [Google Scholar] [CrossRef] [PubMed] [Green Version]
  6. Greek National Organization for Medicines (eof). Definition of Summary of Product Characteristics (SPC) for Pharmaceutical Products Containing the API “BUTAMIRATE CITRATE”, Protocol No 45964, Athens, 30 June 2009. Available online: https://www.eof.gr/ (accessed on 15 July 2021).
  7. Sudha, T.; Manthena, K.; Ravikumar, V.R.; Ganesan, V. HPLC method for the determination of ambroxol HCl in the presence of antimicrobial preservatives in oral liquid formulation. J. Pharm. Sci. Innov. 2015, 4, 134–139. [Google Scholar] [CrossRef]
  8. Mahmoud, A.; Sayed, N.; Mosaad, F.; Souaya, E.R. Chromatographic methods for the determination of butamirate citrate in presence of its degradation product. Chem. Pap. 2019, 73, 1309–1320. [Google Scholar] [CrossRef]
  9. Dol, I.; Altesor, C.; Knochen, M. Application of an optical compensation method to the simultaneous determination of butamirate citrate and sodium benzoate by derivative spectrophotometry in the ultraviolet. Quim. Anal. 1996, 15, 148–153. [Google Scholar]
  10. Gouda, A.A.; El-Sheikh, R.; Amin, A.S. Spectrophotometric determination of some anti-tussive drugs and its applications to pharmaceutical formulations. Anal. Chem. Ind. J. 2008, 7, 757–767. [Google Scholar]
  11. Taşkin, D.; Erensoy, G.; Sungur, S. Optimized and validated spectrophotometric determination of butamirate citrate in bulk and dosage forms using ion-pair formation with methyl orange and bromothymol blue. Farmacia 2017, 65, 761–765. [Google Scholar]
  12. Koppenhoefer, B.; Jakob, A.; Zhu, X.; Lin, B. Separation of Enantiomers of Drugs by Capillary Electrophoresis with Permethyl-gamma-Cyclodextrin as Chiral Solvating Agent. J. High Resolut. Chromatogr. 2000, 23, 413–429. [Google Scholar] [CrossRef] [Green Version]
  13. Paul, A.K.; Rahman, M.; Seraj, S.; Paul, A.; Arif, H.A.; Islam, T.; Arifuzzaman, S. Development and validation of a new stable HPLC method for the assay of butamirate citrate in pharmaceutical formulations. Adv. Nat. Appl. Sci. 2011, 5, 75–84. [Google Scholar]
  14. Mostafa, A.; El-Gindy, A.; Emara, S. Development, application and validation of RP-HPLC method for the simultaneous determination of butamirate citrate and its main degradation product in pharmaceutical dosage forms. Anal. Methods 2011, 3, 1643–1651. [Google Scholar] [CrossRef]
  15. Hassib, S.T.; El-Zaher, A.A.; Fouad, M.A. Development and validation of RP-HPLC stability-indicating methods for the determination of butamirate citrate and sodium cromoglycate. J. Chem. Pharm. Res. 2011, 3, 243–258. [Google Scholar]
  16. Heinänen, M.; Barbas, C. Validation of an HPLC method for the quantification of ambroxol hydrochloride and benzoic acid in a syrup as pharmaceutical form stress test for stability evaluation. J. Pharm. Biomed. Anal. 2001, 24, 1005–1010. [Google Scholar] [CrossRef]
  17. Madhu, M.; Sreeram, V.; Nagendrakumar, A.V.D.; Reddy, T.V. Validated Rp-Hplc method for the estimation of benzoic acid in bulk and pharmaceutical Formulation. Chem. Sin. 2014, 5, 52–60. [Google Scholar]
  18. Dönmez, Ö.A.; Dinç-Zor, Ş.; Aşçı, B.; Şen, E. Simultaneous HPLC-DAD determination of pseudoephedrine HCl, sodium benzoate, sunset yellow, and methyl paraben in syrup preparation by use of partial least squares and principal component regression. J. Liq. Chrom. Relat. Technol. 2019, 42, 648–653. [Google Scholar] [CrossRef]
  19. Watson, D.G. Pharmaceutical Analysis: A Textbook for Pharmacy Students and Pharmaceutical Chemists, 3rd ed.; Elsevier/Churchill: Livingstone, UK, 2012. [Google Scholar]
  20. Snyder, L.R.; Kirkland, J.J.; Dolan, J.W. Introduction to Modern Liquid Chromatography, 3rd ed.; John Wiley & Sons, Inc.: Hoboken, NJ, USA, 2009. [Google Scholar]
  21. Vander Heyden, Y.; Nijhuis, A.; Smeyers-Verbeke, J.; Vandeginste, B.G.M.; Massart, D.L. Guidance for robustness/ruggedness tests in method validation. J. Pharm. Biomed. Anal. 2001, 24, 723–753. [Google Scholar] [CrossRef]
  22. Restek Chromatography Products and Solutions. Available online: https://www.restek.com/ (accessed on 15 April 2021).
Figure 1. Representative chromatogram of the working standard solution (reference solution) of BC and BA (50.0 and 100 μg/mL, respectively).
Separations 08 00163 g001
Figure 2. Representative halfnormal and normal plots (top) and Pareto chart (bottom) showing the statistically significant effects of factors for Rs.
Separations 08 00163 g002
Table 1. Experimental factors under evaluation, regarding their effect on specific responses.
Experimental FactorIntervalExperimental Response
−10 (nominal value)+1Area of BA Area of BC
As of BA
As of BC
Theoretical plates (N) of BA
Theoretical plates (N) of BC
tR of BA
tR of BC
critical peak pair resolution (Rs)
Flow1.301.501.70
% MeOH485052
T343638
λ208210212
pH2.83.03.2
Csalt485052
% Et3N0.951.001.05
Table 2. The total of 19 experiments proposed by the software for FFD.
Experiment NrExperimental Factor
FlowpH% MeOHCsaltTλ% Et3N
11.302.84852382120.95
21.702.85252342080.95
31.303.25252342120.95
41.703.24852382080.95
51.302.84848342080.95
61.702.84848382081.05
71.302.85252382081.05
81.503.05050362101.00
91.702.85248382120.95
101.702.84852342121.05
111.703.25252382121.05
121.703.25248342081.05
131.503.05050362101.00
141.503.05050362101.00
151.303.24848382121.05
161.303.24852342081.05
171.303.25248382080.95
181.703.24848342120.95
191.302.85248342121.05
Table 3. Values of the responses per the FFD experiment.
Experiment NrResponse
BA Area (mAUxmin)BC Area (mAUxmin)Af of BAAf of BCRsNBANBCtR of BA (min)tR of BC (min)
1674.70149.951.601.674.19678767383.033.72
2502.19143.821.751.603.25510852452.232.67
3716.44151.041.701.543.92623268902.913.53
4536.26142.421.441.463.90457952512.302.87
5655.01186.071.551.504.37608571553.093.83
6510.32147.321.441.333.50468651292.332.84
7660.53190.451.601.503.41721364292.893.41
8568.17148.301.671.423.72485962442.573.13
9516.77116.371.441.502.97421550892.212.63
10513.16114.541.301.553.72484853982.372.91
11543.37113.491.441.503.15495650632.192.62
12544.56142.981.451.463.16426652452.222.67
13567.32148.391.671.503.72570354392.573.13
14567.18148.721.671.423.72570354392.573.13
15719.17151.361.601.464.35669767623.013.73
16690.48184.101.551.624.45598171053.073.82
17697.12186.251.781.583.93711466582.873.47
18540.17114.791.561.424.27564148762.342.97
19686.77150.421.601.583.26626057842.913.45
Table 4. Summarization of the effect of a given factor on each one of the monitored responses.
Experimental FactorEx on BA AreaEx on BA AreaEx on Af of BAEx on Af of BCEx on RsEx on NBAEx on NBCEx on tR of BAEx on tR of BC
Flow−161.67−39.24−0.14−0.080−0.49−1758.75−1528.13−0.70−0.85
pH33.52−1.560.029−0.0250.3133.00110.38−0.0190.027
% MeOH3.560.530.0910.033−0.717.50−251.38−0.14−0.28
Csalt−4.10−0.720.000.0730.02292.50117.630.000.00
T1.181.23−0.011−0.032−0.12228.25−72.38−0.039−0.070
λ14.26−32.68−0.0390.021−0.01675.50−202.130.000.00
% Et3N3.710.49−0.10−0.033−0.23−106.75−123.380.00−0.030
Table 5. Ecritical values of each one of the experimental responses.
Response
BA AreaBC AreaAf of BAAf of BCRsNBANBCtR of BAtR of BC
Ecritical1.150.480.000.100.001048.39999.950.000.00
Table 6. Summarization of the statistically significant factors using the statistical interpretation (●), graphically significant factors (○) and graphically potentially significant factors (□).
FactorBA AreaBC AreaAf of BAAf of BCRsNBANBCtR of BAtR of BC
Flow● ○● ○● □● ○● ○● ○● ○● ○
pH● ○ ● ○ ● ○
% MeOH ● ○ ● ○● ○
Csalt
T ● □ ● ○● ○
λ● ○● ○
% Et3N● □ ● ○
Publisher’s Note: MDPI stays neutral with regard to jurisdictional claims in published maps and institutional affiliations.

