
Development and Validation of a Novel HPLC Method for the Determination of Ephedrine Hydrochloride in Nasal Ointment


Abstract
:1. Introduction
2. Materials and Methods
2.1. Reagents and Solvents
2.2. Instrumentation
2.3. Chromatographic Conditions
2.4. Preparation of Standard Solution
2.4.1. Stock Solution
2.4.2. Working Standard Solution
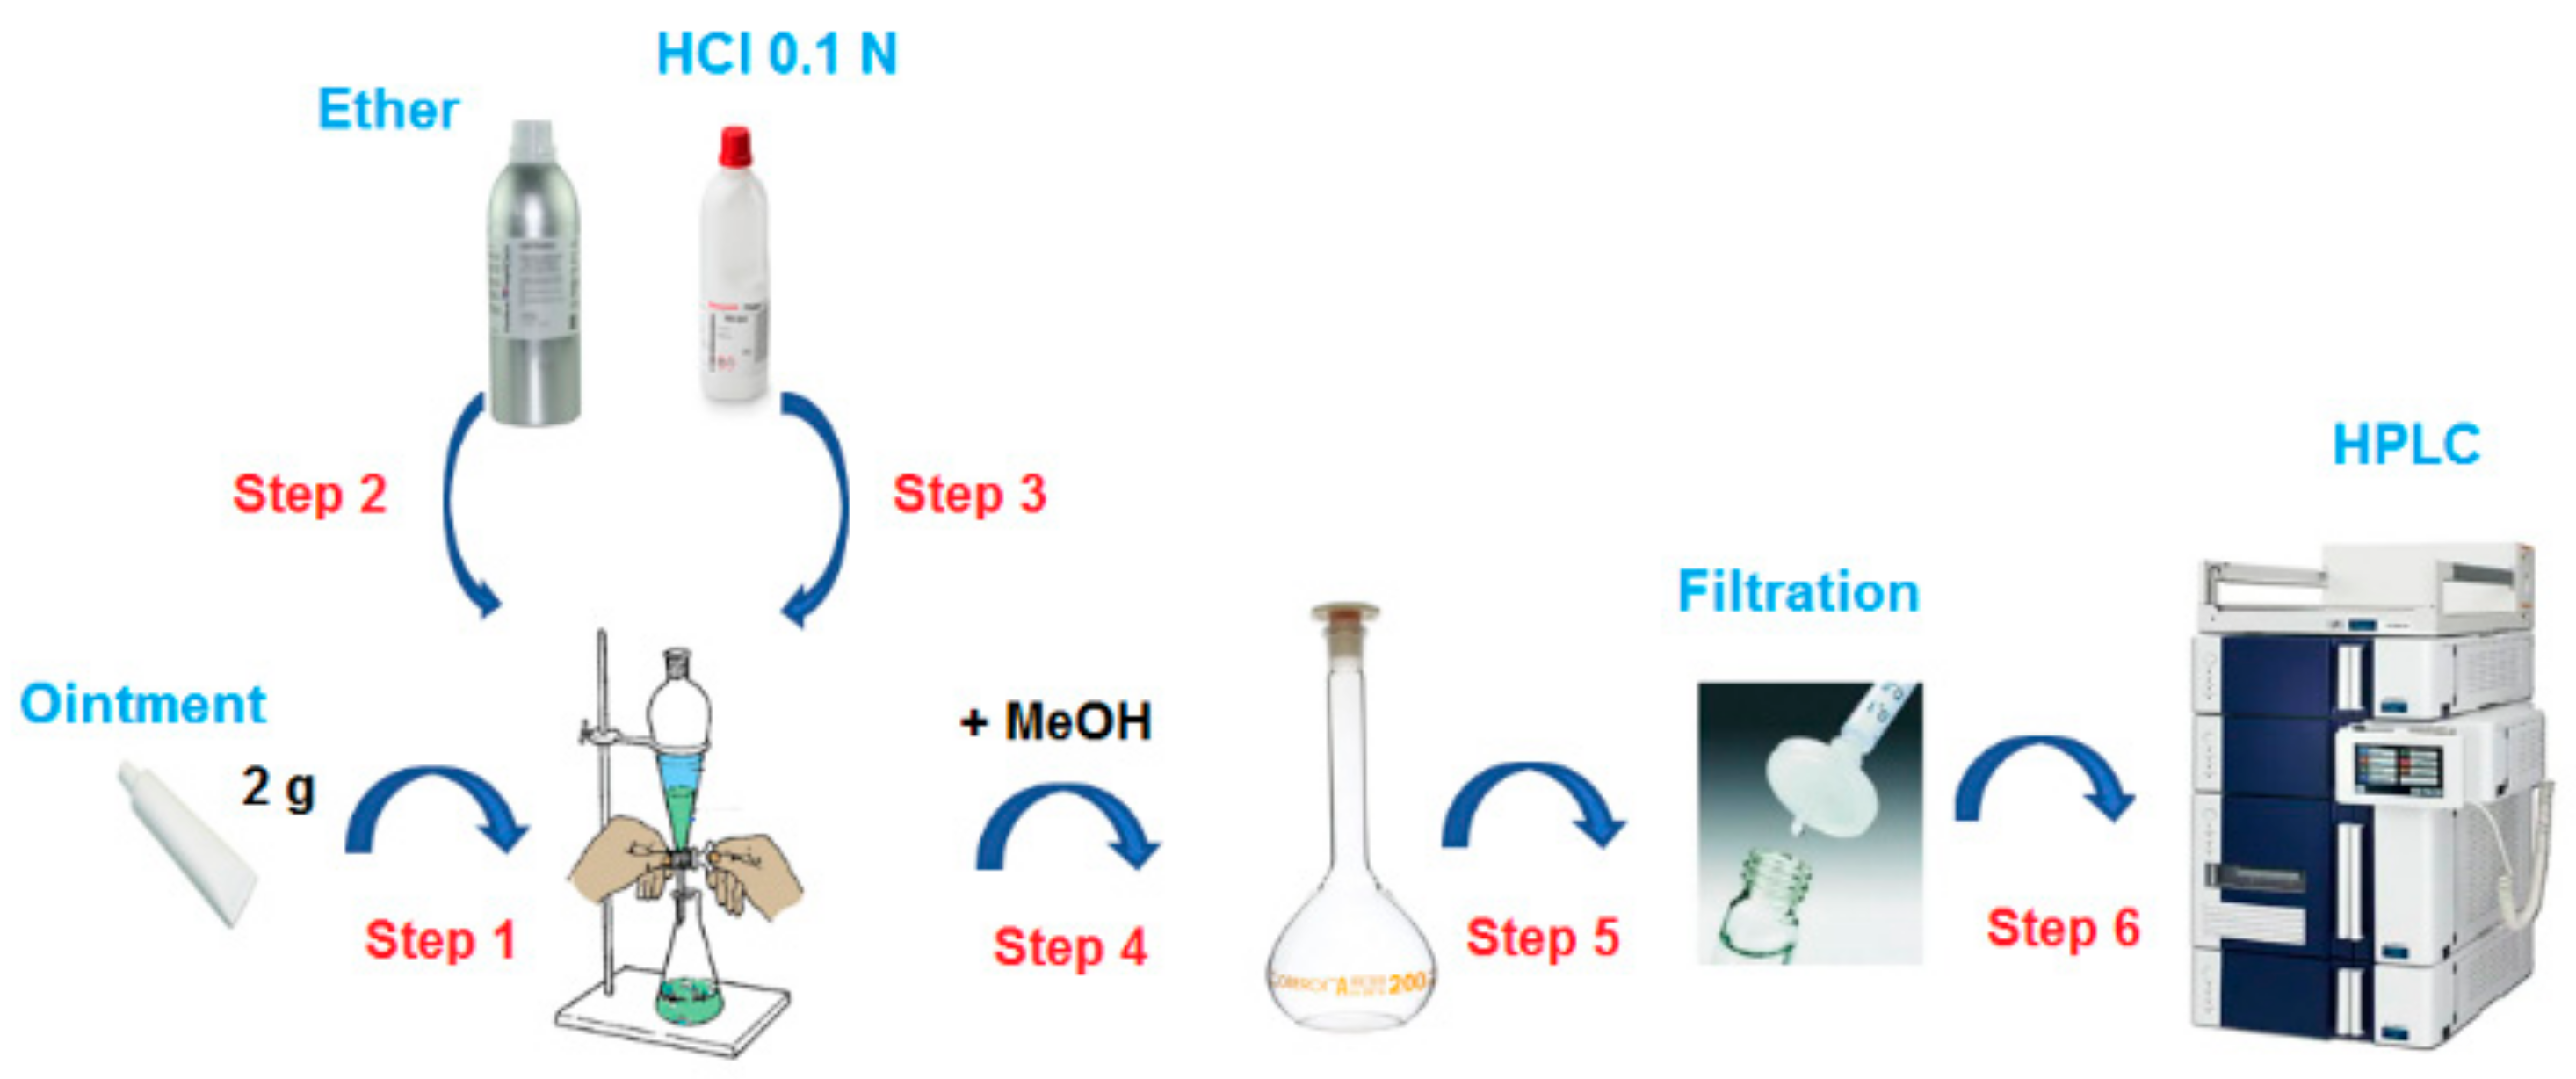
2.5. Sample Preparation
2.6. Validation Process
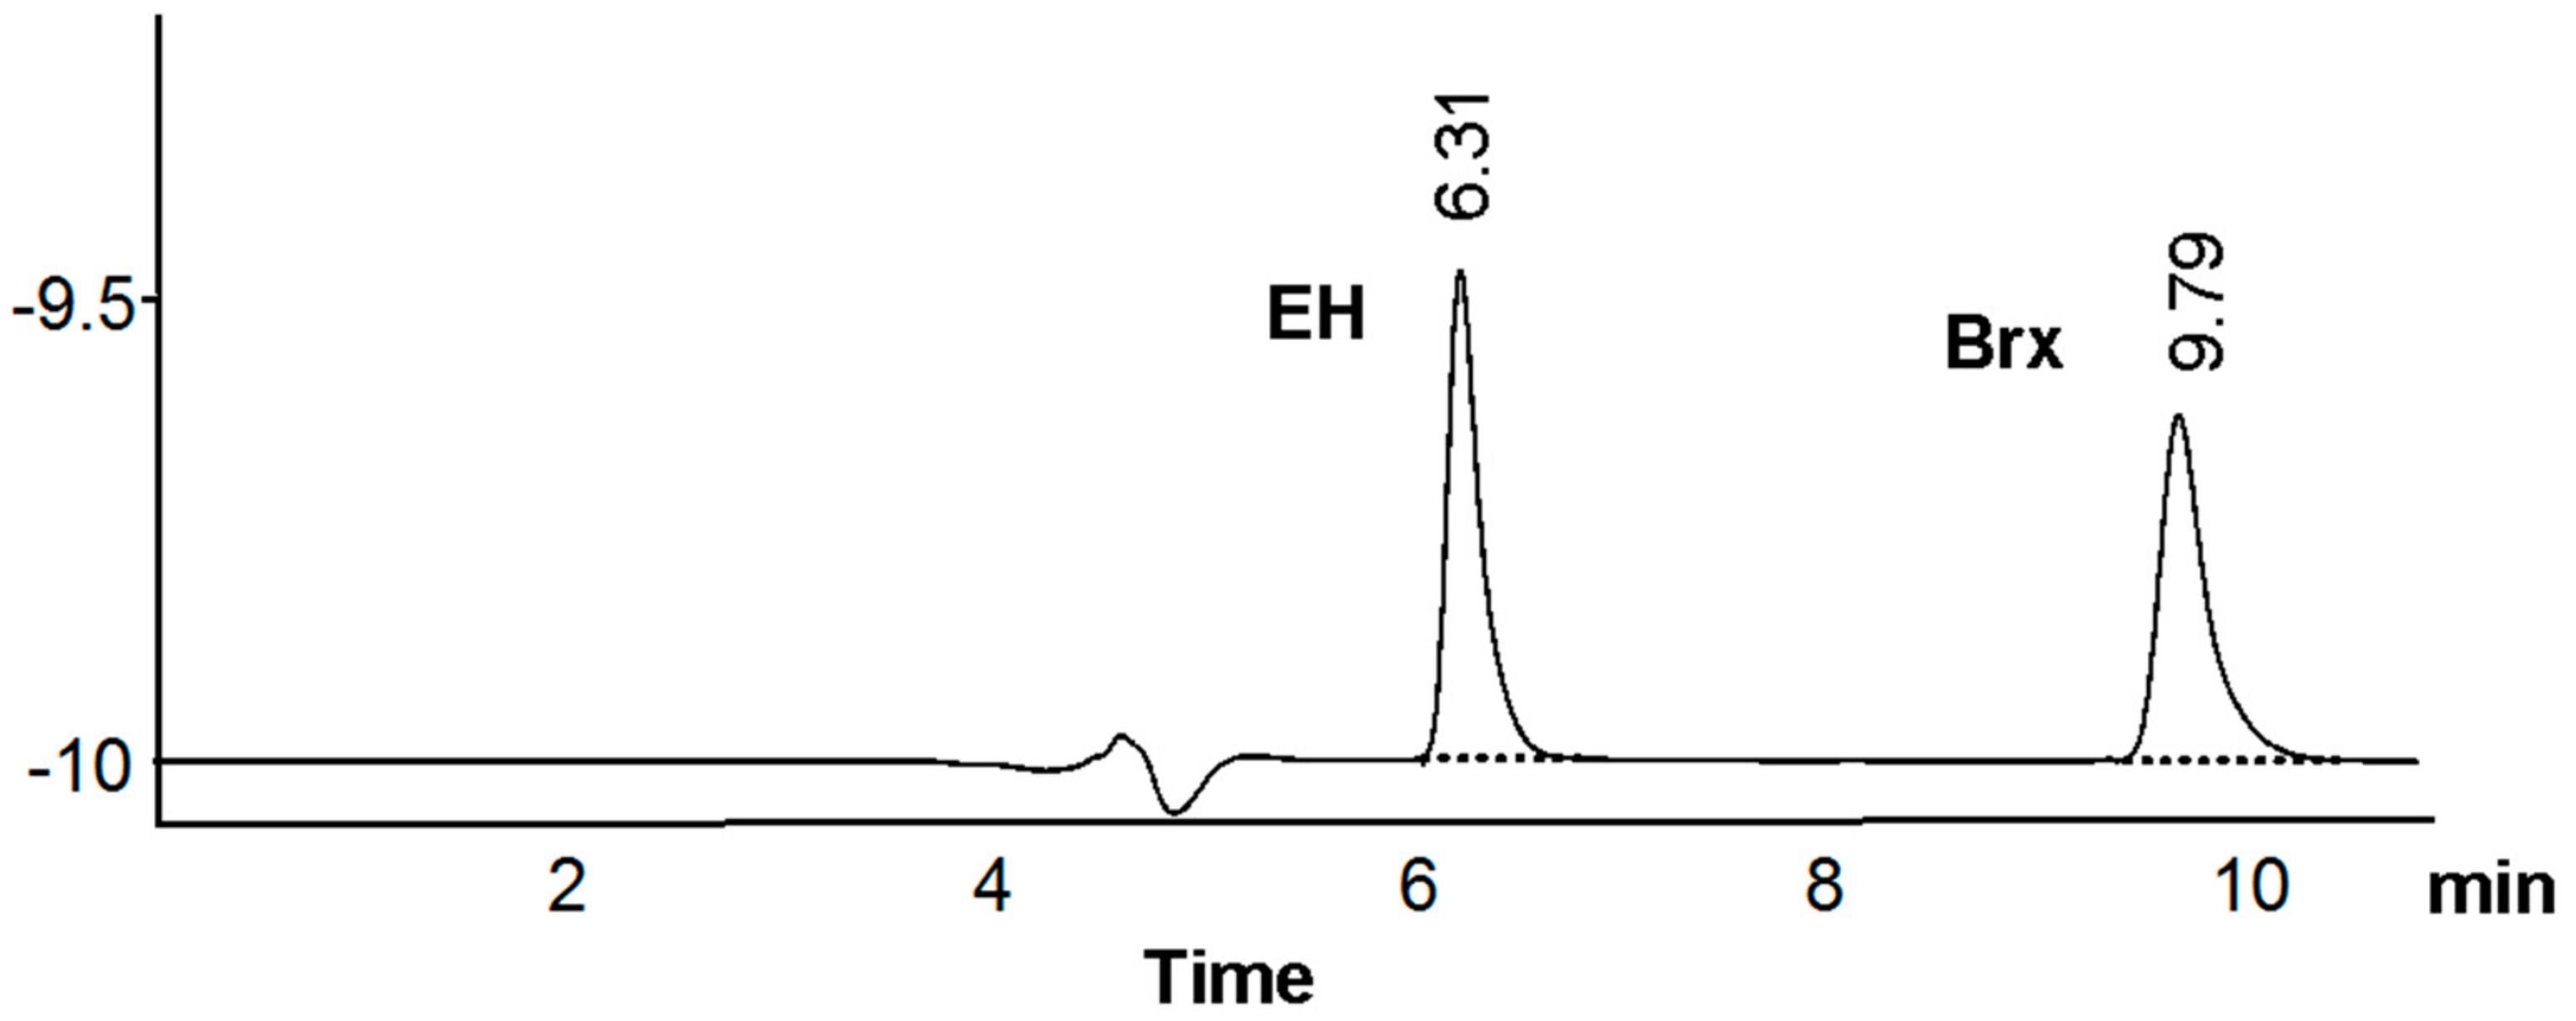
2.6.1. System Suitability
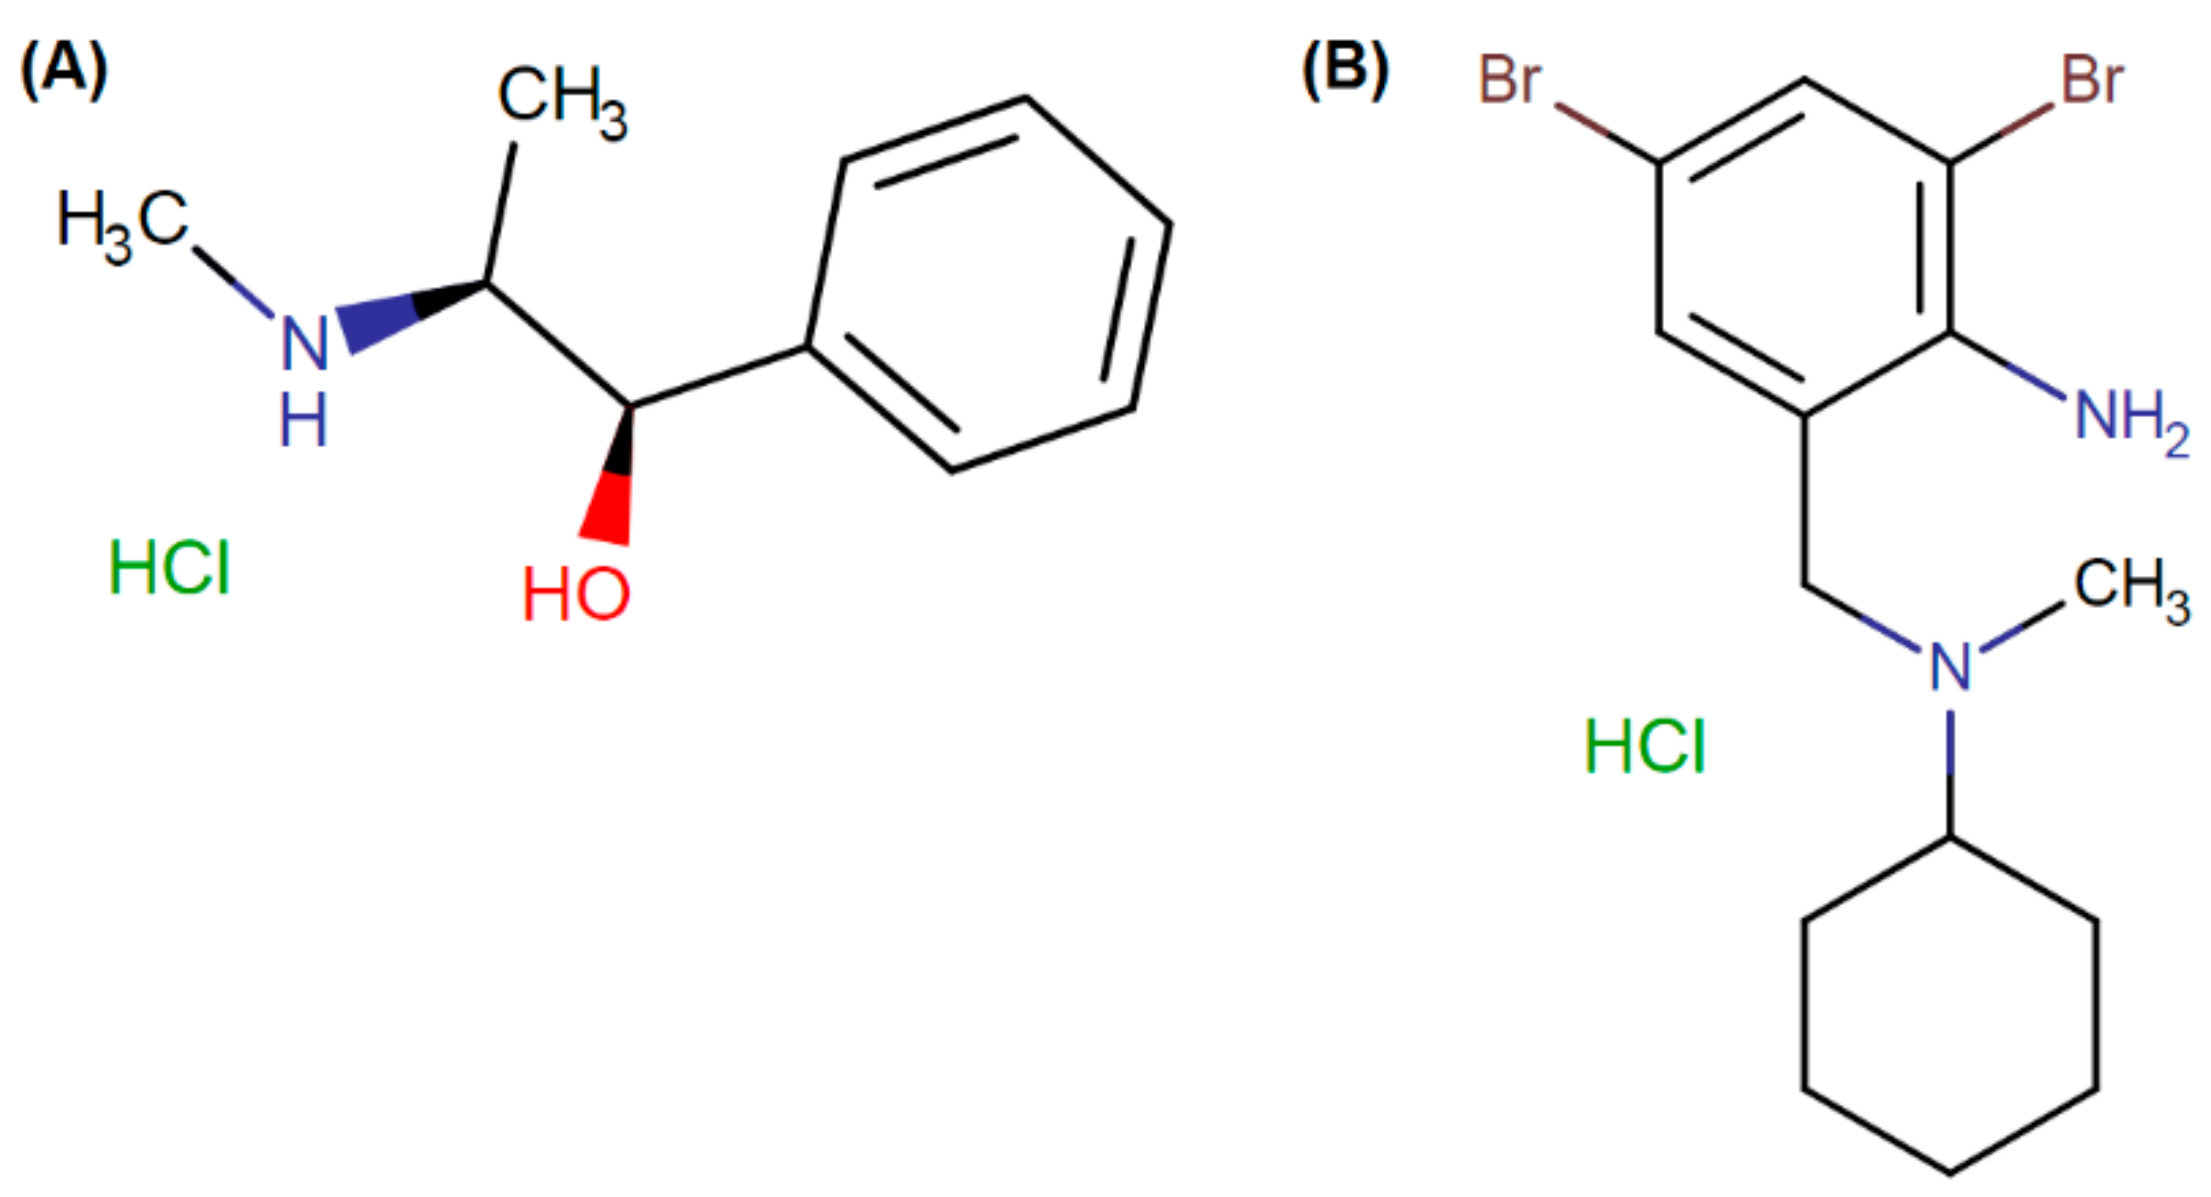
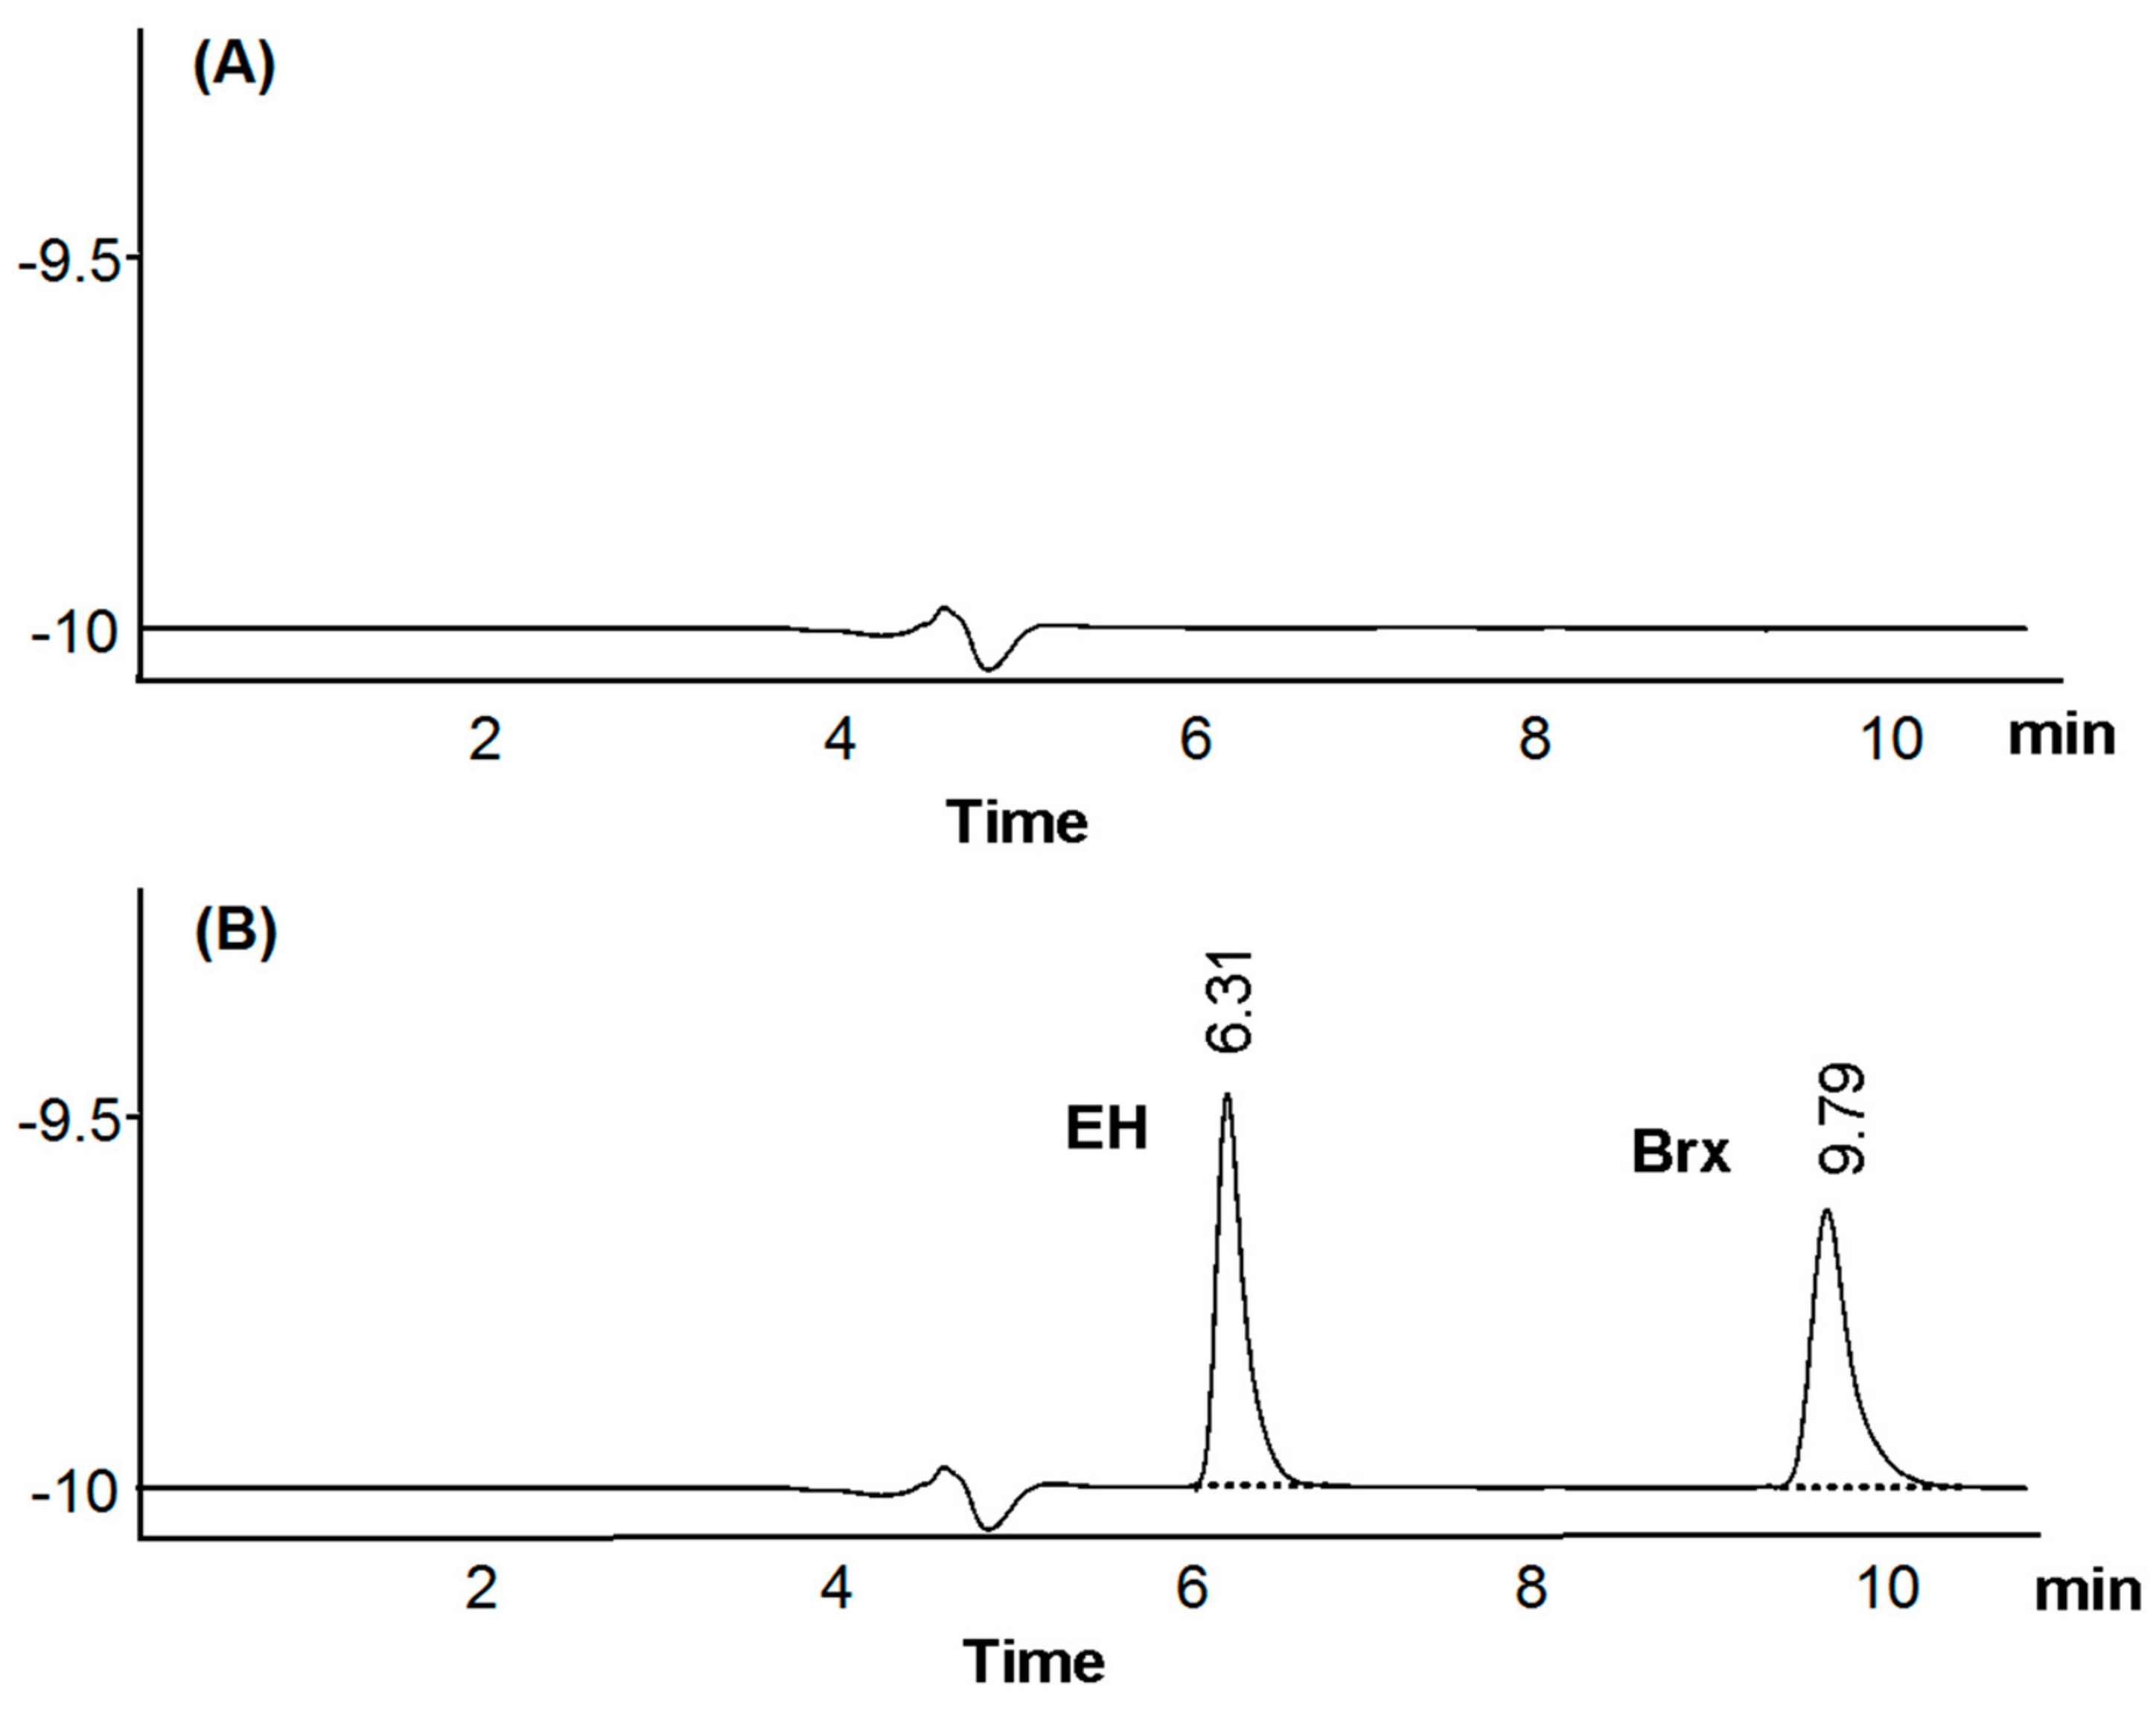
2.6.2. Specificity
2.6.3. Linearity
2.6.4. Accuracy
2.6.5. Precision
2.6.6. Stability of Solutions
2.6.7. Robustness Testing
3. Results and Discussion
3.1. Optimization of the Chromatographic Conditions
3.2. Development of Extraction Protocol for Ointment Sample
3.3. Method Validation
3.4. Robustness Testing Results
4. Conclusions
Author Contributions
Funding
Institutional Review Board Statement
Informed Consent Statement
Data Availability Statement
Acknowledgments
Conflicts of Interest
References
- Whalen, K.; Feild, C.; Radhakrishnan, R.; Véliz Salazar, L. Farmacología; Wolters Kluwer: Barcelona, Spain, 2019. (In Spanish) [Google Scholar]
- Rorabaugh, B. Ephedrine. In xPharm: The Comprehensive Pharmacology Reference; Elsevier: Amsterdam, The Netherlands, 2007; pp. 1–6. [Google Scholar]
- Webb, D.R. Ephedrine. In Reference Module in Biomedical Sciences; Elsevier: Amsterdam, The Netherlands, 2017; pp. 2–5. [Google Scholar]
- Ibragić, S.; Sofić, E.; Tahirović, I.; Uzunović, A.; Kresic, D.; Kalcher, K. Utilisation of a Simple and Fast HPLC-UV Method for Separation and Quantification of Ephedrine Alkaloids in Herb of Different Ephedra Species. Res. Rev. J. Pharmacol. Toxicol. Stud. 2017, 5, 7–10. [Google Scholar]
- Dindar, Ç.K.; Erkmen, C.; Uslu, B.; Göğer, N.G. The Development of Spectrophotometric and Validated Stability-Indicating RP-HPLC Methods for Simultaneous Determination of Ephedrine HCL, Naphazoline HCL, Antazoline HCL, and Chlorobutanol in Pharmaceutical Pomade Form. Comb. Chem. High Throughput Screen. 2020, 23, 1090–1099. [Google Scholar] [CrossRef] [PubMed]
- Pinnacle DB Cyano Columns (USP L10). Available online: https://www.restek.com/en/products/columns/HPLC--UHPLC-Columns/Analytical-Columns/4724/ (accessed on 14 April 2022).
- United States Pharmacopeia and the National Formulary (USP 42-NF 37); The United States Pharmacopeial Convention: Rockville, MD, USA, 2019; Volume 1, p. 1252.
- Tietje, C.; Brouder, A. International Conference on Harmonisation of Technical Requirements for Registration of Pharmaceuticals For Human Use. In Handbook of Transnational Economic Governance Regimes; Brill Academic Publishers: Leiden, The Netherlands, 2010; pp. 1041–1053. [Google Scholar]
- Zivanovic, L.; Zecevic, M.; Markovic, S.; Petrovic, S.; Ivanovic, I. Validation of liquid chromatographic method for analysis of lidocaine hydrochloride, dexamethasone acetate, calcium dobesilate, buthylhydroxyanisol and degradation product hydroquinone in suppositories and ointment. J. Chromatogr. A 2005, 1088, 182–186. [Google Scholar] [CrossRef] [PubMed]
- Da Silva Solon, L.G.; de Barros Lima, I.P.; Nogueira, F.H.A.; de Araújo, J.P.; Vivacqua, C.A.; Aragão, C.F.S. Development and validation of an UHPLC method for the determination of betamethasone valerate in cream, gel, ointment and lotion. Steroids 2016, 106, 70–77. [Google Scholar] [CrossRef] [PubMed]
- García-Alvarez-Coque, M.C.; Ramis-Ramos, G.; Ruiz-Angel, M.J. Liquid Chromatography/Ion Pair. In Reference Module in Chemistry, Molecular Sciences and Chemical Engineering; Elsevier: Amsterdam, The Netherlands, 2015; pp. 1–10. [Google Scholar]
- Marina, M.L.; García, M.A. Chromatography: Liquid, Micellar Liquid Chromatography. In Encyclopedia of Separation Science; Elsevier: Amsterdam, The Netherlands, 2000; pp. 726–737. [Google Scholar]
- NCATS Inxight: Drugs—Ephedrine Hydrochloride. Available online: https://drugs.ncats.io/substance/NLJ6390P1Z (accessed on 31 March 2022).
- United States Pharmacopeia and the National Formulary (USP 42-NF 37); The United States Pharmacopeial Convention: Rockville, MD, USA, 2019; Volume 2, p. 1857.
- Jovanović, M.; Rakić, T.; Ivanović, D.; Jančić–Stojanović, B. Optimization of the Separation of Ephedrine, Pseudoephedrine, Phenylephrine, and Synephrine by Hydrophilic Interaction Liquid Chromatography Employing Experimental Design Methodology. Instrum. Sci. Technol. 2015, 43, 156–169. [Google Scholar] [CrossRef]
- Heaton, J.; Gray, N.; Cowan, D.A.; Plumb, R.S.; Legido-Quigley, C.; Smith, N.W. Comparison of reversed-phase and hydrophilic interaction liquid chromatography for the separation of ephedrines. J. Chromatogr. A 2012, 1228, 329–337. [Google Scholar] [CrossRef] [PubMed]
- Okamura, N.; Miki, H.; Harada, T.; Yamashita, S.; Masaoka, Y.; Nakamoto, Y.; Tsuguma, M.; Yoshitomi, H.; Yagi, A. Simultaneous determination of ephedrine, pseudoephedrine, norephedrine and methylephedrine in Kampo medicines by high-performance liquid chromatography. J. Pharm. Biomed. Anal. 1999, 20, 363–372. [Google Scholar] [CrossRef]
- Johnston, S.E.; Gill, N.L.; Wei, Y.-C.; Markovich, R.; Rustum, A.M. Development and Validation of a Stability-Indicating RP-HPLC Method for Simultaneous Assay of Betamethasone Dipropionate, Chlorocresol, and for the Estimation of Betamethasone Dipropionate Related Compounds in a Pharmaceutical Cream and Ointment. J. Chromatogr. Sci. 2010, 48, 733–741. [Google Scholar] [CrossRef] [PubMed] [Green Version]
- Iqbal, D.N.; Ashraf, A.; Iqbal, M.; Nazir, A. Analytical method development and validation of hydrocortisone and clotrimazole in topical dosage form using RP-HPLC. Future J. Pharm. Sci. 2020, 6, 49. [Google Scholar] [CrossRef]
- Dejaegher, B.; Vander Heyden, Y. Experimental designs and their recent advances in set-up, data interpretation, and analytical applications. J. Pharm. Biomed. Anal. 2011, 56, 141–158. [Google Scholar] [CrossRef] [PubMed]
- Vander Heyden, Y.; Nijhuis, A.; Smeyers-Verbeke, J.; Vandeginste, B.G.M.; Massart, D.L. Guidance for robustness/ruggedness tests in method validation. J. Pharm. Biomed. Anal. 2001, 24, 723–753. [Google Scholar] [CrossRef]
- Vrachas, A.; Gkountanas, K.; Boutsikaris, H.; Dotsikas, Y. Development and Validation of a Novel RP-HPLC Method for the Determination of Cetrimide and Chlorhexidine Gluconate in Antiseptic Solution. Analytica 2022, 3, 79–91. [Google Scholar] [CrossRef]
- Neofotistos, A.D.; Gkountanas, K.; Boutsikaris, H.; Dotsikas, Y. A Validated RP-HPLC Method for the Determination of Butamirate Citrate and Benzoic Acid in Syrup, Based on an Experimental Design Assessment of Robustness. Separations 2021, 8, 163. [Google Scholar] [CrossRef]
- Dejaegher, B.; Vander Heyden, Y. The use of experimental design in separation science. Acta Chromatogr. 2009, 21, 161–201. [Google Scholar] [CrossRef]


| Experimental Factor | Interval | ||
|---|---|---|---|
| −1 | 0 (Nominal Value) | +1 | |
| A: Flow | 0.5 | 0.6 | 0.7 |
| B: pH | 2.0 | 2.2 | 2.4 |
| C: Csalt | 48 | 49.9 | 51.8 |
| D: T | 23 | 25 | 27 |
| E: % MeOH | 63 | 65 | 67 |
| F: λmax | 205 | 206 | 207 |
| G: % Et3N | 0.35 | 0.40 | 0.45 |
| Run | Experimental Factor | ||||||
|---|---|---|---|---|---|---|---|
| A (Flow) | B (pH) | C (Csalt) | D (T) | E (% MeOH) | F (λmax) | G (% Et3N) | |
| 1 | 0.7 | 2.0 | 51.8 | 27 | 63 | 205 | 0.45 |
| 2 | 0.6 | 2.2 | 49.9 | 25 | 65 | 206 | 0.4 |
| 3 | 0.7 | 2.0 | 48.0 | 27 | 67 | 207 | 0.35 |
| 4 | 0.6 | 2.2 | 49.9 | 25 | 65 | 206 | 0.4 |
| 5 | 0.5 | 2.4 | 48.0 | 23 | 67 | 207 | 0.35 |
| 6 | 0.5 | 2.4 | 48.0 | 27 | 67 | 205 | 0.45 |
| 7 | 0.7 | 2.4 | 51.8 | 23 | 67 | 205 | 0.35 |
| 8 | 0.7 | 2.4 | 51.8 | 27 | 67 | 207 | 0.45 |
| 9 | 0.5 | 2.0 | 48.0 | 27 | 63 | 207 | 0.45 |
| 10 | 0.7 | 2.0 | 51.8 | 23 | 63 | 207 | 0.35 |
| 11 | 0.5 | 2.0 | 51.8 | 27 | 67 | 205 | 0.35 |
| 12 | 0.5 | 2.0 | 48.0 | 23 | 63 | 205 | 0.35 |
| 13 | 0.5 | 2.4 | 51.8 | 27 | 63 | 207 | 0.35 |
| 14 | 0.7 | 2.4 | 48.0 | 27 | 63 | 205 | 0.35 |
| 15 | 0.5 | 2.0 | 51.8 | 23 | 67 | 207 | 0.45 |
| 16 | 0.6 | 2.2 | 49.9 | 25 | 65 | 206 | 0.4 |
| 17 | 0.5 | 2.4 | 51.8 | 23 | 63 | 205 | 0.45 |
| 18 | 0.7 | 2.4 | 48.0 | 23 | 63 | 207 | 0.45 |
| 19 | 0.7 | 2.0 | 48.0 | 23 | 67 | 205 | 0.45 |
| Parameter | EH * | Brx * | Limits |
|---|---|---|---|
| Retention factor | 0.33 | 1.05 | - |
| Resolution | 9.94 | 9.94 | R ≥ 2 |
| Tailing factor | 1.62 | 1.41 | 0.8 < Tf < 2 |
| Theoretical plates | 7149.7 | 9933 | N ≥ 2000 |
| Injection precision (Area)-% | 0.2 | 0.4 | %RSD ≤ 2 |
| Retention time (min) | 6.30 | 9.76 | - |
| Validation Parameter | Results | Criteria |
|---|---|---|
| Linearity (n = 3) (y:Area EH/Area Brx, x:EH concentration) | y = 14.093x + 0.008 r = 0.9996 | r > 0.9990 |
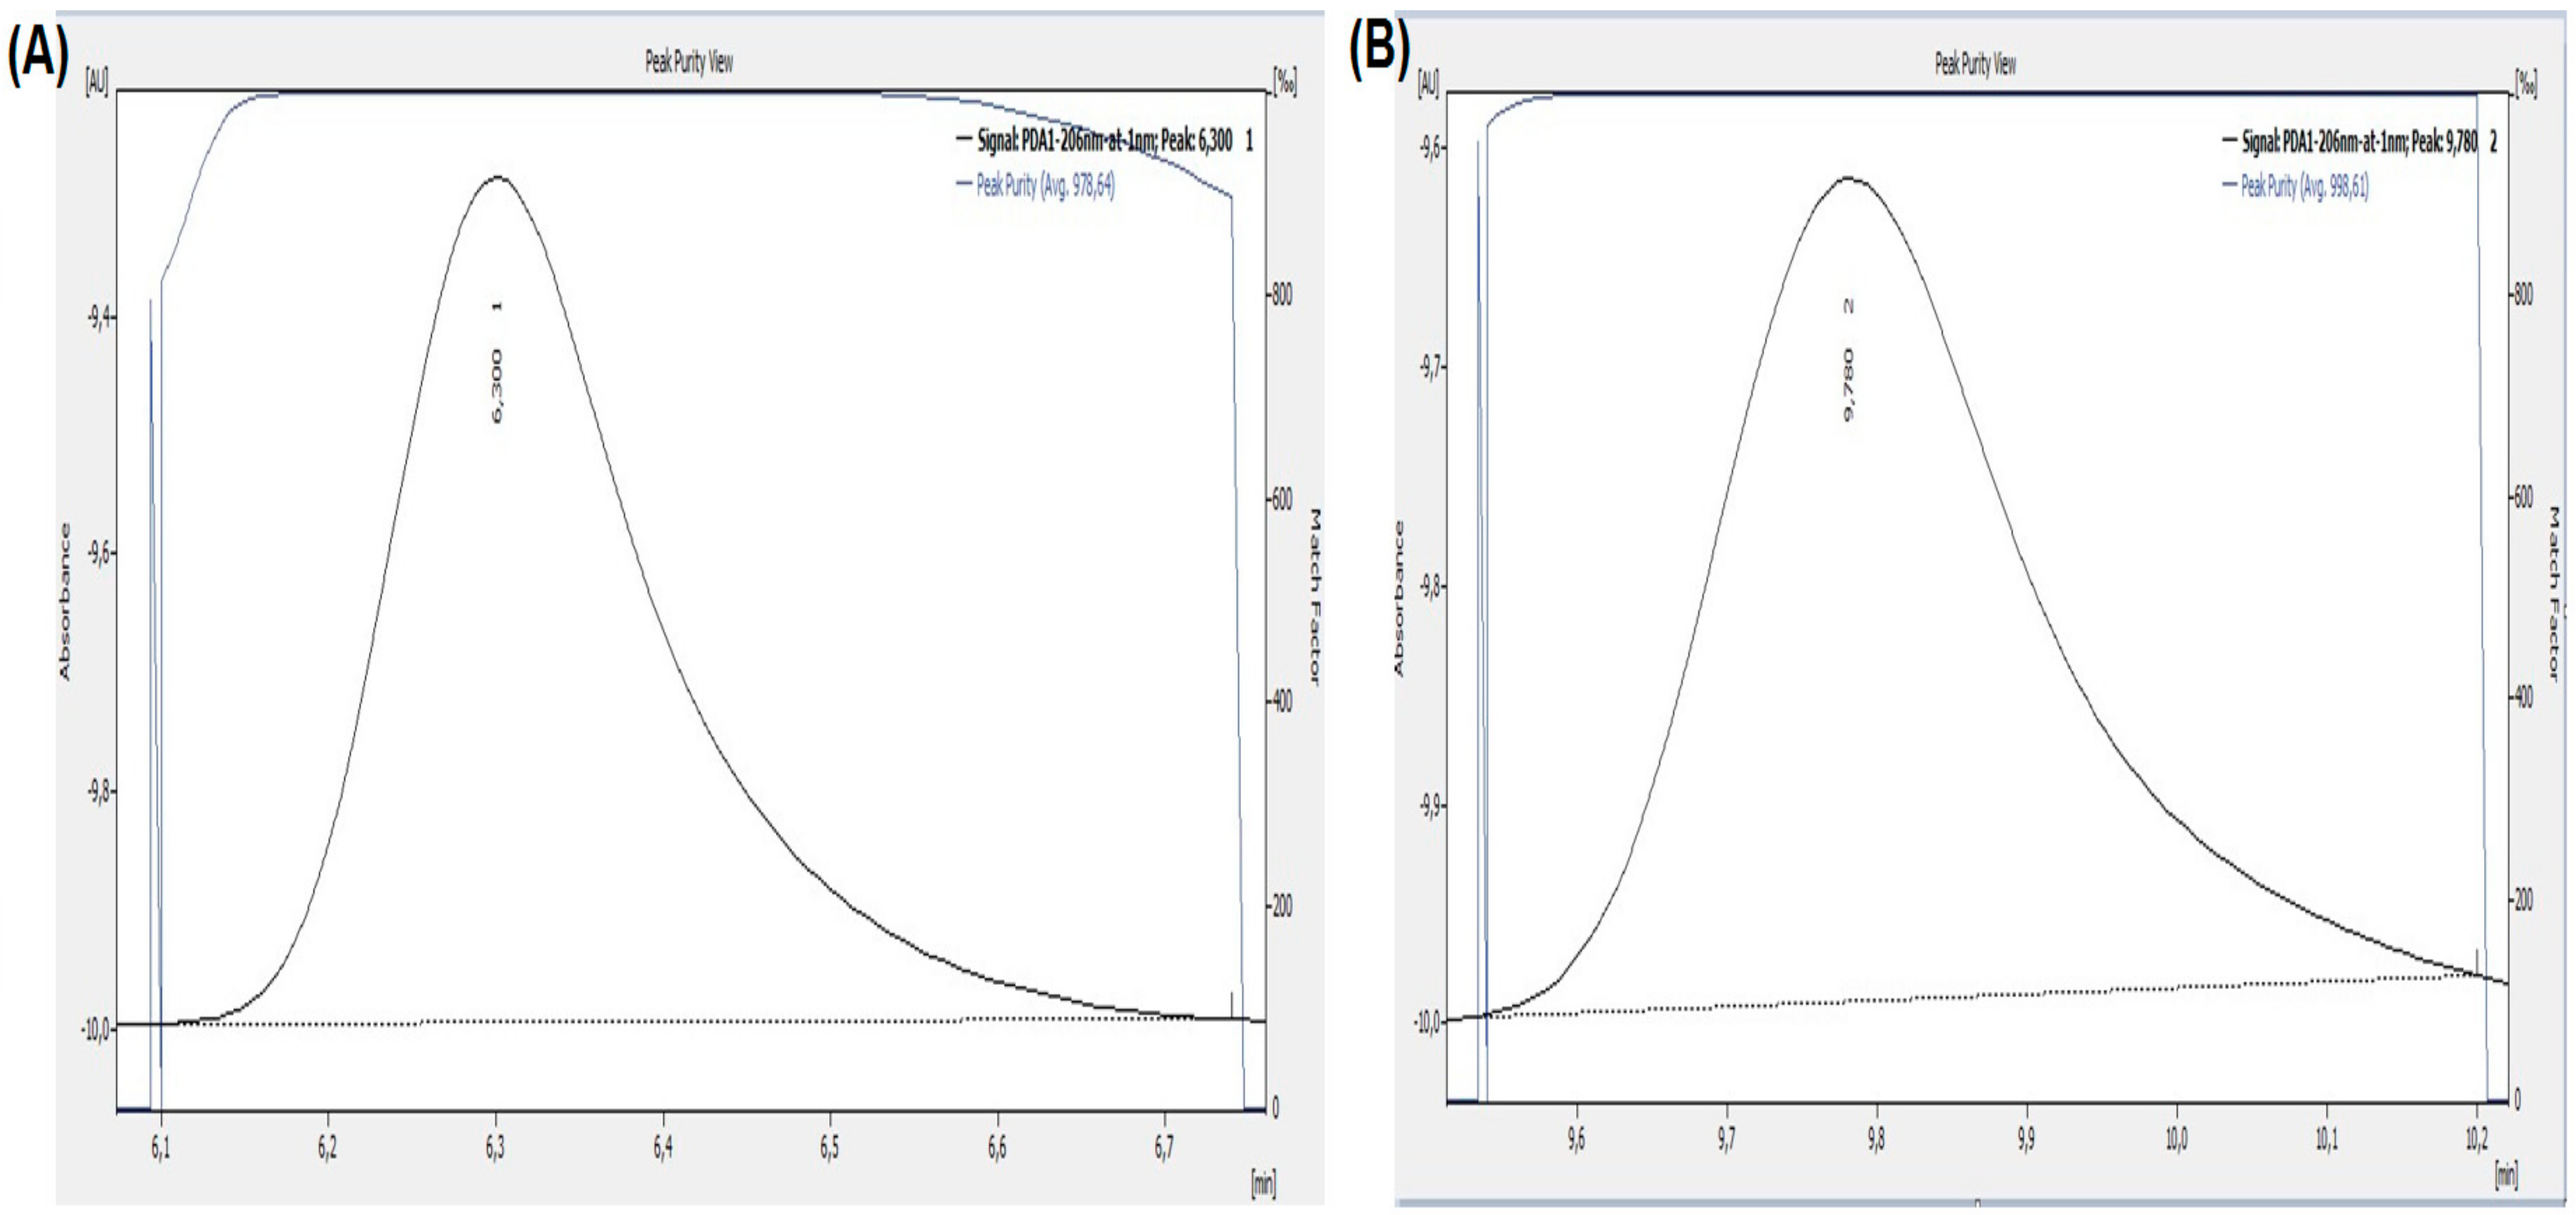
| Specificity, Peak Purity | EH: 978.69 Brx: 998.61 | |
| Accuracy (n = 3) | ||
| 75.0 μg/mL (75%) Recovery (%): 101.97 | X = 100 ± 2% | |
| 100 μg/mL (100%) Recovery (%): 101.81 | X = 100 ± 2% | |
| 125 μg/mL (125%) Recovery (%): 101.06 | X = 100 ± 2% | |
| Average Recovery: 101.62 RSD3 levels (%): 0.44 | X = 100 ± 2% %Χ < 2 | |
| Precision | ||
| Repeatability (n = 6) | 100 μg/mL (100%) RSDr (%): 1.35 | %Χ < 2 |
| Intermediate Precision (n = 18, different analyst & day) | 100 μg/mL (100%) RSDip (%): 1.2 HorRat: 0.43 * | %X < 3 X < 2 |
| Spiked sample stability | ||
| 25 °C (after 48 h) | Recovery (%): 99.69 | X = 100 ± 2% |
| 5 °C (after 48 h) | Recovery (%): 99.50 | X = 100 ± 2% |
| Run | Response | ||||||||
|---|---|---|---|---|---|---|---|---|---|
| Area EH | Area Brx | Tf EH | Tf Brx | Rs | NEH | NBrx | tR EH (min) | tR Brx (min) | |
| 1 | 6749.4 | 4272.62 | 1.20 | 1.45 | 9.76 | 4365 | 8439 | 5.45 | 8.90 |
| 2 | 7702.26 | 6095.67 | 1.60 | 1.58 | 9.71 | 7165 | 9339 | 6.23 | 9.58 |
| 3 | 6840.6 | 5244.46 | 1.53 | 1.54 | 8.12 | 7665 | 8263 | 5.17 | 7.46 |
| 4 | 7606.06 | 6096.18 | 1.60 | 1.56 | 9.95 | 7195 | 8901 | 6.24 | 9.62 |
| 5 | 9412.09 | 7051.03 | 1.59 | 1.50 | 9.51 | 8029 | 10,369 | 7.30 | 10.96 |
| 6 | 9244.43 | 6382.82 | 1.61 | 1.58 | 8.87 | 7812 | 10,644 | 7.26 | 10.52 |
| 7 | 6568.75 | 4629.22 | 1.52 | 1.51 | 7.48 | 6470 | 6969 | 5.24 | 7.56 |
| 8 | 6663.99 | 5185.93 | 1.52 | 1.50 | 7.83 | 6404 | 7413 | 5.21 | 7.56 |
| 9 | 9367 | 7162.84 | 1.56 | 1.55 | 12.39 | 8412 | 10,604 | 7.79 | 12.83 |
| 10 | 6660.39 | 5042.12 | 1.39 | 1.40 | 10.65 | 5324 | 7682 | 5.58 | 9.43 |
| 11 | 9053.91 | 6437.70 | 1.52 | 1.54 | 8.31 | 6937 | 8405 | 7.31 | 10.64 |
| 12 | 9194.87 | 6025 | 1.52 | 1.46 | 12.94 | 8571 | 10,389 | 7.86 | 13.28 |
| 13 | 9222.29 | 6902.07 | 1.43 | 1.45 | 11.04 | 6438 | 9130 | 7.72 | 12.72 |
| 14 | 9181.06 | 4574.15 | 1.42 | 1.57 | 10.95 | 6690 | 9451 | 5.56 | 9.087 |
| 15 | 9187.26 | 7328.10 | 1.39 | 1.57 | 8.84 | 7116 | 8633 | 7.40 | 11.05 |
| 16 | 7613.12 | 6070.78 | 1.57 | 1.56 | 9.82 | 7180 | 9430 | 6.24 | 9.62 |
| 17 | 9009.74 | 6293.74 | 1.38 | 1.49 | 11.14 | 5521 | 8609 | 7.78 | 13.14 |
| 18 | 6764.02 | 5272.55 | 1.52 | 1.53 | 11.45 | 7215 | 8650 | 5.53 | 9.22 |
| 19 | 8291.28 | 4580.49 | 1.48 | 1.56 | 8.46 | 7053 | 8254 | 5.23 | 7.72 |
| Factors | Ex(%) | ||||||||
|---|---|---|---|---|---|---|---|---|---|
| Area EH | Area Brx | Tf EH | Tf Brx | Rs | NE | NBrx | tR EH | tR Brx | |
| A | −26.1% | −30.4% | −3.3% | −0.5% | −10.6% | −13.3% | −15.8% | −35.0% | −36.7% |
| B | 1.18% | 0.41% | 3.16% | 0.40% | −1.52% | −1.50% | 0.77% | −0.38% | −0.72% |
| C | −8.5% | −0.4% | −6.9% | −3.0% | −9.7% | −22.4% | −15.4% | −0.03% | −0.1% |
| D | 2.02% | −0.12% | 0.03% | 1.18% | −4.09% | −1.00% | 3.79% | −0.90% | −3.44% |
| E | −1.45% | 2.7% | 5.8% | 3.2% | −29.1% | 8.6% | −5.4% | −6.3% | −19.7% |
| F | −5.2% | 12.3% | 2.1% | −0.8% | 2.4% | 5.5% | −0.6% | 0.0% | 0.5% |
| G | −1.40% | 1.18% | −1.98% | 1.99% | −0.34% | −3.88% | 0.80% | −0.18% | −0.25% |
| Area EH | Area Brx | Tf EH | Tf Brx | Rs | NEH | NBrx | tR EH | tR Brx | |
|---|---|---|---|---|---|---|---|---|---|
| 7640.48 | 6087.54 | 1.59 | 1.57 | 9.83 | 7180.00 | 9223.33 | 6.24 | 9.61 | |
| SD | 53.62 | 14.52 | 0.014 | 0.013 | 0.12 | 15.00 | 282.83 | 0.0040 | 0.025 |
| S^2 | 2875.04 | 210.82 | 0.00021 | 0.00018 | 0.015 | 225.00 | 79,994.33 | 0.000016 | 0.00064 |
| (SE)e | 26.81 | 7.26 | 0.0072 | 0.0066 | 0.060 | 7.50 | 141.42 | 0.0020 | 0.013 |
| Ecritical | 115.36 | 31.24 | 0.031 | 0.029 | 0.26 | 32.27 | 608.51 | 0.0087 | 0.055 |
| %Ecritical | 1.51% | 0.51% | 1.95% | 1.82% | 2.64% | 0.45% | 6.60% | 0.14% | 0.57% |
| Area EH | Area Brx | Τf EH | Τf Brx | Rs | NE | NBrx | tR EH | tR Brx | ||||||||||
|---|---|---|---|---|---|---|---|---|---|---|---|---|---|---|---|---|---|---|
| a | b | a | b | a | b | a | b | a | b | a | b | A | b | a | b | a | b | |
| A | √ | √ | √ | √ | √ | - | - | - | √ | √ | √ | √ | √ | √ | √ | √ | √ | √ |
| B | - | - | - | - | √ | - | - | - | - | - | √ | - | - | - | √ | - | √ | - |
| C | √ | - | - | - | √ | √ | √ | √ | √ | √ | √ | √ | √ | √ | - | - | - | - |
| D | √ | - | - | - | - | - | - | - | √ | √ | √ | - | - | - | √ | - | √ | √ |
| E | - | - | √ | √ | √ | √ | √ | √ | √ | √ | √ | √ | - | √ | √ | √ | √ | √ |
| F | √ | - | √ | √ | √ | - | - | - | - | - | √ | - | - | - | - | - | - | - |
| G | - | - | √ | - | √ | - | √ | - | - | - | √ | - | - | - | √ | - | - | - |
| Significant Factors | Non-Significance Limits |
|---|---|
| A | [0.59, 0.61] |
| C | [49.56, 50.24] |
| D | [23.50, 26.50] |
| F | [205.71, 206.29] |
Publisher’s Note: MDPI stays neutral with regard to jurisdictional claims in published maps and institutional affiliations. |
© 2022 by the authors. Licensee MDPI, Basel, Switzerland. This article is an open access article distributed under the terms and conditions of the Creative Commons Attribution (CC BY) license (https://creativecommons.org/licenses/by/4.0/).
Share and Cite
Kallinteris, K.; Gkountanas, K.; Karamitros, I.; Boutsikaris, H.; Dotsikas, Y. Development and Validation of a Novel HPLC Method for the Determination of Ephedrine Hydrochloride in Nasal Ointment. Separations 2022, 9, 198. https://0-doi-org.brum.beds.ac.uk/10.3390/separations9080198
Kallinteris K, Gkountanas K, Karamitros I, Boutsikaris H, Dotsikas Y. Development and Validation of a Novel HPLC Method for the Determination of Ephedrine Hydrochloride in Nasal Ointment. Separations. 2022; 9(8):198. https://0-doi-org.brum.beds.ac.uk/10.3390/separations9080198
Chicago/Turabian StyleKallinteris, Konstantinos, Kostas Gkountanas, Iοannis Karamitros, Haris Boutsikaris, and Yannis Dotsikas. 2022. "Development and Validation of a Novel HPLC Method for the Determination of Ephedrine Hydrochloride in Nasal Ointment" Separations 9, no. 8: 198. https://0-doi-org.brum.beds.ac.uk/10.3390/separations9080198