
Perchlorate Levels in Polish Water Samples of Various Origin


1
Department of Analytical Chemistry, Medical University of Lublin, 4a Chodźki Str., 20-093 Lublin, Poland
2
Institute of Chemistry, Health and Food Sciences, Faculty of Mathematics and Natural Sciences, Jan Dlugosz University in Czestochowa, 36a Armii Krajowej Str., 42-200 Czestochowa, Poland
3
Institute of Environmental Engineering, Polish Academy of Sciences, 34 Maria Curie-Skłodowska Str., 41-819 Zabrze, Poland
*
Author to whom correspondence should be addressed.
Separations 2021, 8(4), 37; https://0-doi-org.brum.beds.ac.uk/10.3390/separations8040037
Submission received: 5 March 2021
/
Revised: 22 March 2021
/
Accepted: 23 March 2021
/
Published: 25 March 2021
Abstract
:Perchlorate ion (ClO4−) is known as a potent endocrine disruptor and exposure to this compound can result in serious health issues. It has been found in drinking water, swimming pools, and surface water in many countries, however, its occurrence in the environment is still poorly understood. The information on perchlorate contamination of Polish waters is very limited. The primary objective of this study was to assess ClO4− content in bottled, tap, river, and swimming pool water samples from different regions of Poland and provide some data on the presence of perchlorate. We have examined samples of bottled, river, municipal, and swimming pool water using the IC–CD (ion chromatography–conductivity detection) method. Limit of detection and limit of quantification were 0.43 µg/L and 1.42 µg/L, respectively, and they were both above the current health advisory levels in drinking water. The concentration of perchlorate were found to be 3.12 µg/L in one river water sample and from 6.38 to 8.14 µg/L in swimming pool water samples. Importantly, the level of perchlorate was below the limit of detection (LOD) in all bottled water samples. The results have shown that the determined perchlorate contamination in Polish drinking waters seems to be small, nevertheless, further studies are required on surface and river samples. The inexpensive, fast, and sensitive IC–CD method used in this study allowed for a reliable determination of perchlorate in the analyzed samples. To the best of our knowledge, there are no other studies seeking to assess the perchlorate content in Polish waters.
1. Introduction
Perchlorate has been identified as an environmental pollutant [1] and it has been found in many countries in their soil, snow, ice, and also in their drinking water and dietary products [2,3]. Perchlorate is commonly used as a propellant, a component of solid rocket fuels, fireworks, signal flares, airbags, munitions, and other pyrotechnic materials. It also can be found in Chilean nitrate fertilizers and usage of those kind of fertilizers is a very important source [4]. Natural sources are still poorly understood, but some hypotheses of atmospheric formation are suggested [5,6]. Perchlorate can also be formed during the decomposition of sodium hypochlorite used in water disinfection, therefore it may contaminate drinking water. Water, soil, and fertilizers are considered to be potential sources of perchlorate contamination in food [7].
Health concerns over perchlorate exposure arise from the ability of these compounds to disrupt the function of the thyroid gland [8]. The deficiency of thyroid hormones may lead to many serious health consequences, due to their critical role in metabolic, neurodevelopmental, and other processes [9]. The European Food Safety Authority (EFSA) Panel on Contaminants in the Food Chain (CONTAM Panel) presented a scientific opinion on the public health risks associated with the presence of perchlorate in food. The CONTAM Panel concluded that chronic dietary exposure to perchlorate is a potential concern, especially for consumers who ingest high levels of perchlorate with food and belong to younger age groups of the population with mild to moderate iodine deficiency. In addition, it has been suggested that short term perchlorate exposure is a concern for breastfed infants and toddlers who consume low levels of iodine [10].
An updated review concerning human health effects of perchlorate exposure was published by the Authors elsewhere [2]. According to the Central Statistical Office of Poland (Główny Urząd Statystyczny, GUS) data, in Poland, 22% of the population suffered from various types of thyroid dysfunction [11], while epidemiological studies conducted in Silesia Region (southern Poland) indicate that the prevalence of thyroid diseases is systematically increasing. [12] One of the most important routes of exposure of perchlorate is contaminated water ingestion [10]. Tap water, as well as bottled spring and mineral waters may be significant sources of exposure due to their potential perchlorate contamination [3].
This study was designed to determine the concentration of perchlorate in water samples of various origin from Poland. The main scope was to determine ClO4− content in mineral and spring bottled water and its comparison to the current health advisory level. In addition, tap and river water samples from two different regions of Poland were collected from the highly industrialized area of Upper Silesia (southern Poland) and the mostly agricultural region of Lubelskie (southeastern Poland). We decided to compare the perchlorate content in the water samples from these two regions because of the significant geographic and socioeconomic differences between them. Our study is preliminary and we tried to indicate the possibility of perchlorate water contamination in Poland. In addition, perchlorate content in a number of swimming pool water samples was determined. Finally, the authors aimed to indicate feasible sources of exposure of the population to these harmful compounds and present recommendations of further studies on perchlorate in Poland.
The ion chromatography with conductometric detection was used to determine perchlorate in the samples. To the best of our knowledge, no studies on ClO4− levels in bottled, tap, river, or swimming pool water samples from different regions of Poland have been conducted so far.
2. Materials and Methods
2.1. Reagents and Standards
All of the eluents and standards were prepared using deionized water (DI, resistivity 18.2 MΩ/cm) obtained from Direct-Q 3-UVR water purifying system in place (Merck, Darmstadt, Germany). Perchlorate certified reference material (sodium perchlorate CRM 996 ± 6 mg/L), was purchased from Sigma, St. Louis, acetonitrile, sodium carbonate, and sodium bicarbonate were of reagent suprapure grade purchased from Merck, Darmstadt, Germany.
2.2. Validation of the Applied Analytical Method
The calibration was performed in compliance with the guidelines of International Organization for Standardization (ISO 8466-1) employed in our previous studies [13]. Seven standard solutions were prepared using a dilution of CRM to 0.5, 1.5, 3, 5, 7.5, 10, and 12.5 µg/L. Each solution went through ion chromatographic analysis three times. The obtained peak areas of the perchlorate ion served to calculate the following parameters: standard deviation, relative standard deviation, limits of detection and quantification, and correlation coefficient. The correlation coefficient of the calibration curve was R2 = 0.99945 with relative standard deviation (RSD) = 2.76% and standard deviation was 0.221 µg/L. Limit of detection (LOD) and limit of quantification (LOQ) were calculated as 0.43 µg/L and 1.42 µg/L, respectively. To demonstrate that the equipment was properly settled and calibrated during analysis a calibration verification standard (5 µg/L) was analyzed every 15 samples. Moreover, a blank sample of DI water was injected before each new sample to verify that the obtained results of perchlorate concentration were not an artefact.
2.3. Sample Collection
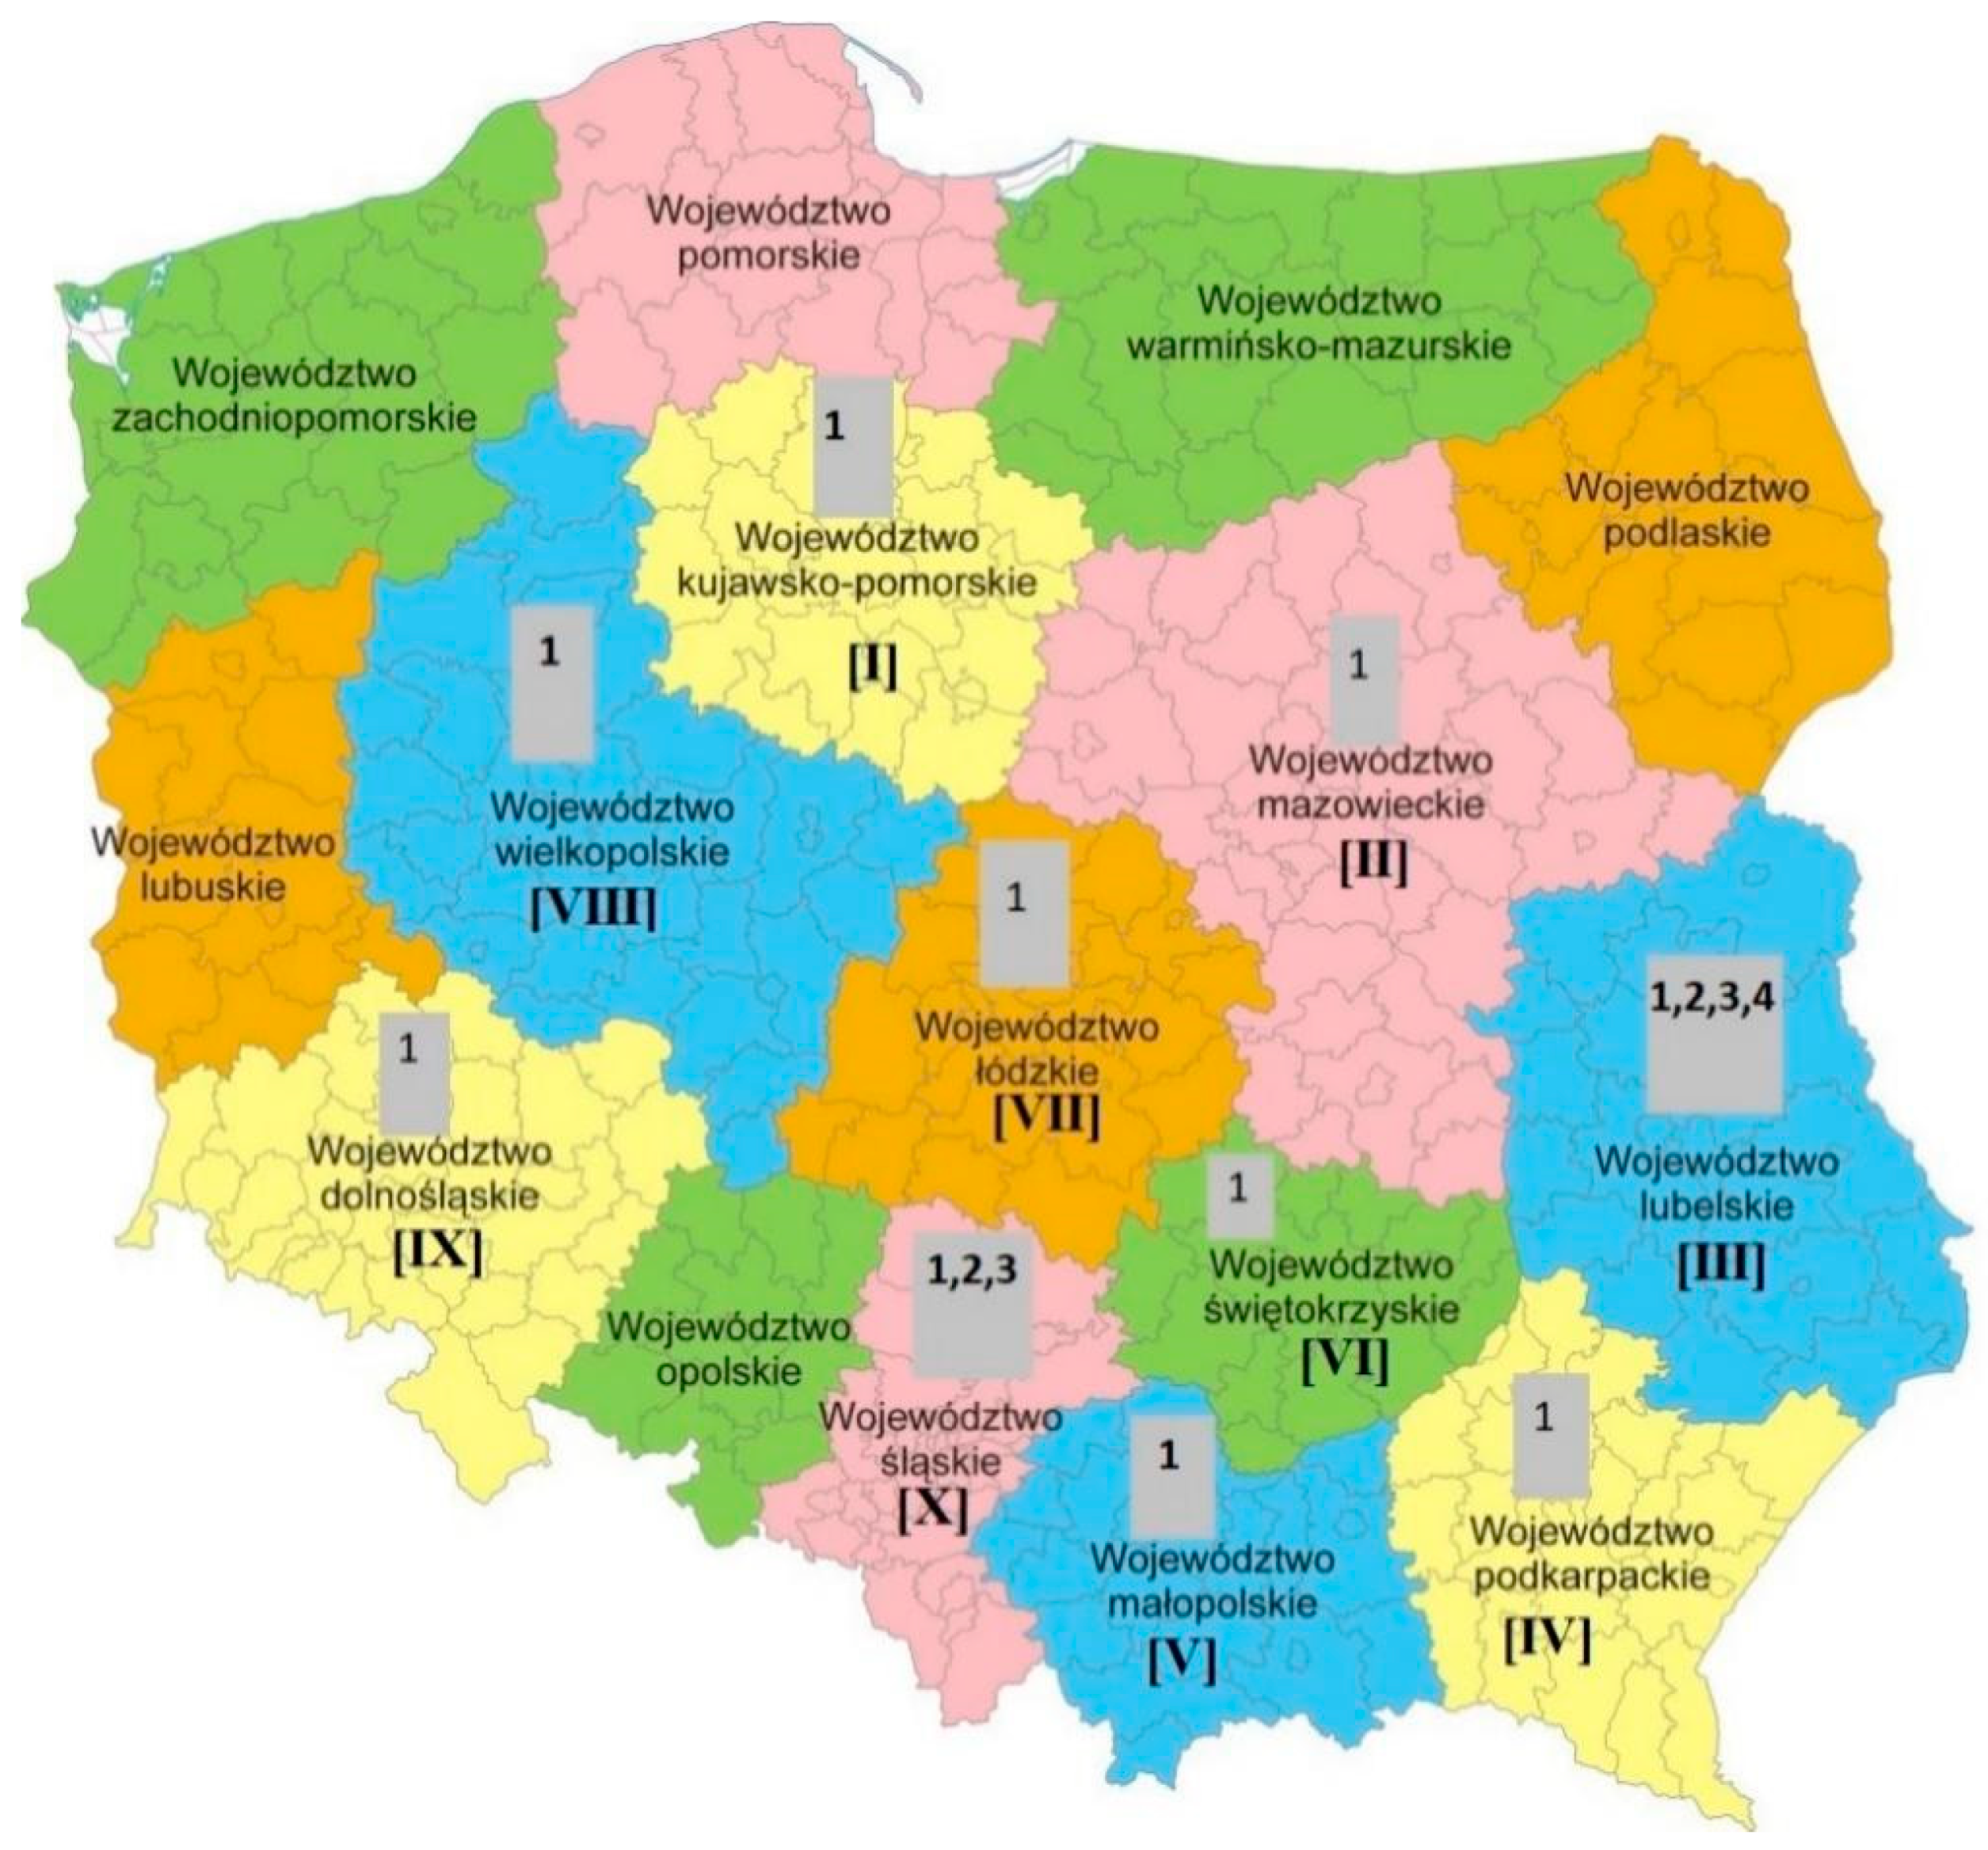
The samples of bottled, tap, river and swimming pool water were collected between January 2020 to July 2020. We collected approximately 100–1000 mL of each sample, depending on its type. All of the samples were refrigerated (5 °C) during transport to the laboratory and then they were kept at −20 °C in the polypropylene tubes until analysis. The following codes have been assigned to each type of sample: 1—bottled water, 2—tap water, 3—river water, and 4—swimming pool water. Brands of bottled water were chosen from those of a nationwide range of availability (n = 31) and were purchased from local merchants. The water springs were located within 10 out of 16 regions of Poland. Among the bottled water samples, as many as 12 had springs in the region of Małopolska, where in the Beskids Mountains rich sources of mineral waters can be found. The remaining samples have been obtained from the following regions: Śląskie (n = 4), Kujawsko-Pomorskie and Lubelskie (n = 3 for each region), Łódzkie, Podkarpackie, and Dolnośląskie (n = 2 for each region), as well as Wielkopolskie, Świętokrzyskie, and Mazowieckie (n = 1 for each region). Figure 1 below illustrates the geographical distribution of the sources of the studied bottled water samples. Tap and river water samples were collected from two regions of Poland: Upper Silesia and Lubelskie Voievodeship and they were collected between January and July 2020. The tap water samples originated from private homes and public buildings (n = 40). River water samples were collected from upper, middle, and lower courses of the rivers (n = 10).
Swimming pool water samples (n = 3) were collected from three different sport facilities in Lublin (Lubelskie Voievodeship) in January 2020. The total number of 84 samples were analyzed in this study. More detailed information of the samples is given in the Supplementary Materials (Table S1).
2.4. Sample Preparation
The sparkling mineral water samples were degassed using an ultrasonic bath (POLSONIC, Warsaw, Poland) for 15 min. The samples of river waters were filtered using MINISART® neutral syringe filters with a pore diameter of 0.45 µm (Sartorius AG, Göttingen, Germany). The swimming pool water samples were both directly injected and diluted (1:10 v/v) with deionized water. The tap water and still bottled water samples were directly injected without preparation.
2.5. Apparatus
Ion chromatograph 930 Compact IC Flex (Metrohm, Herisau, Switzerland) with isocratic pump, MSM-HC suppressor, conductivity cell detector and 919 IC Autosampler were used to perform perchlorate analysis in water samples. The improved and optimized AN-324 perchlorate determination method [14] was adopted, while the Magic IC Net 3.2 software (Metrohm, Herisau, Switzerland) served to operate the equipment and to collect and integrate data. Water samples were placed in 10-mL polypropylene autosampler vials, then they were automatically injected into the chromatography system and a 250-µL sample loop was used. Each sample was injected three times. More details of applied analytical conditions are given in the Supplementary Materials (Table S2).
3. Results
Occurrence of Perchlorate in the Studied Waters
None of the examined samples of bottled and tap water has exceed the LOD. Two samples of the river water had detectable perchlorate concentrations: in the Bytomka River, the mean ClO4− concentration was determined to be 3.12 ± 0.18 µg/L and in the Sanna River it was estimated to be 0.91 ± 0.04 µg/L. Perchlorate has been detected in all samples of swimming pool water, with the highest concentration of 8.14 ± 0.01 µg/L. Concentrations of perchlorate in the tested waters are shown in Table 1. The presented results are the average of the triplicate ± standard deviation. More detailed results are given in the Supplementary Materials (Table S1). Among all eighty-four samples tested, only 6% had a perchlorate content above the detection limit.

Table 1.
Results of perchlorate determination in water samples.
| Sample Type (Code) 1 | Region of Poland 1 | Number of Samples | Perchlorate Concentration Range ± SD 2 [µg/L] |
|---|---|---|---|
| bottled water (1) | I | 3 | <LOD |
| II | 1 | <LOD | |
| III | 3 | <LOD | |
| IV | 2 | <LOD | |
| V | 12 | <LOD | |
| VI | 1 | <LOD | |
| VII | 2 | <LOD | |
| IX | 4 | <LOD | |
| X | 2 | <LOD | |
| XI | 1 | <LOD | |
| tap water (2) | III | 24 | <LOD |
| IX | 16 | <LOD | |
| river water (3) | III | 7 | <LOD—<LOQ (0.91 *) ± 0.04 |
| IX | 3 | <LOD—3.12 ± 0.18 | |
| swimming pool water (4) | III | 3 | 6.38 ± 0.04—8.14 ± 0.01 |
1 see Figure 1. 2 standard deviation. * estimate, below limit of quantification (LOQ) and above limit of detection (LOD).
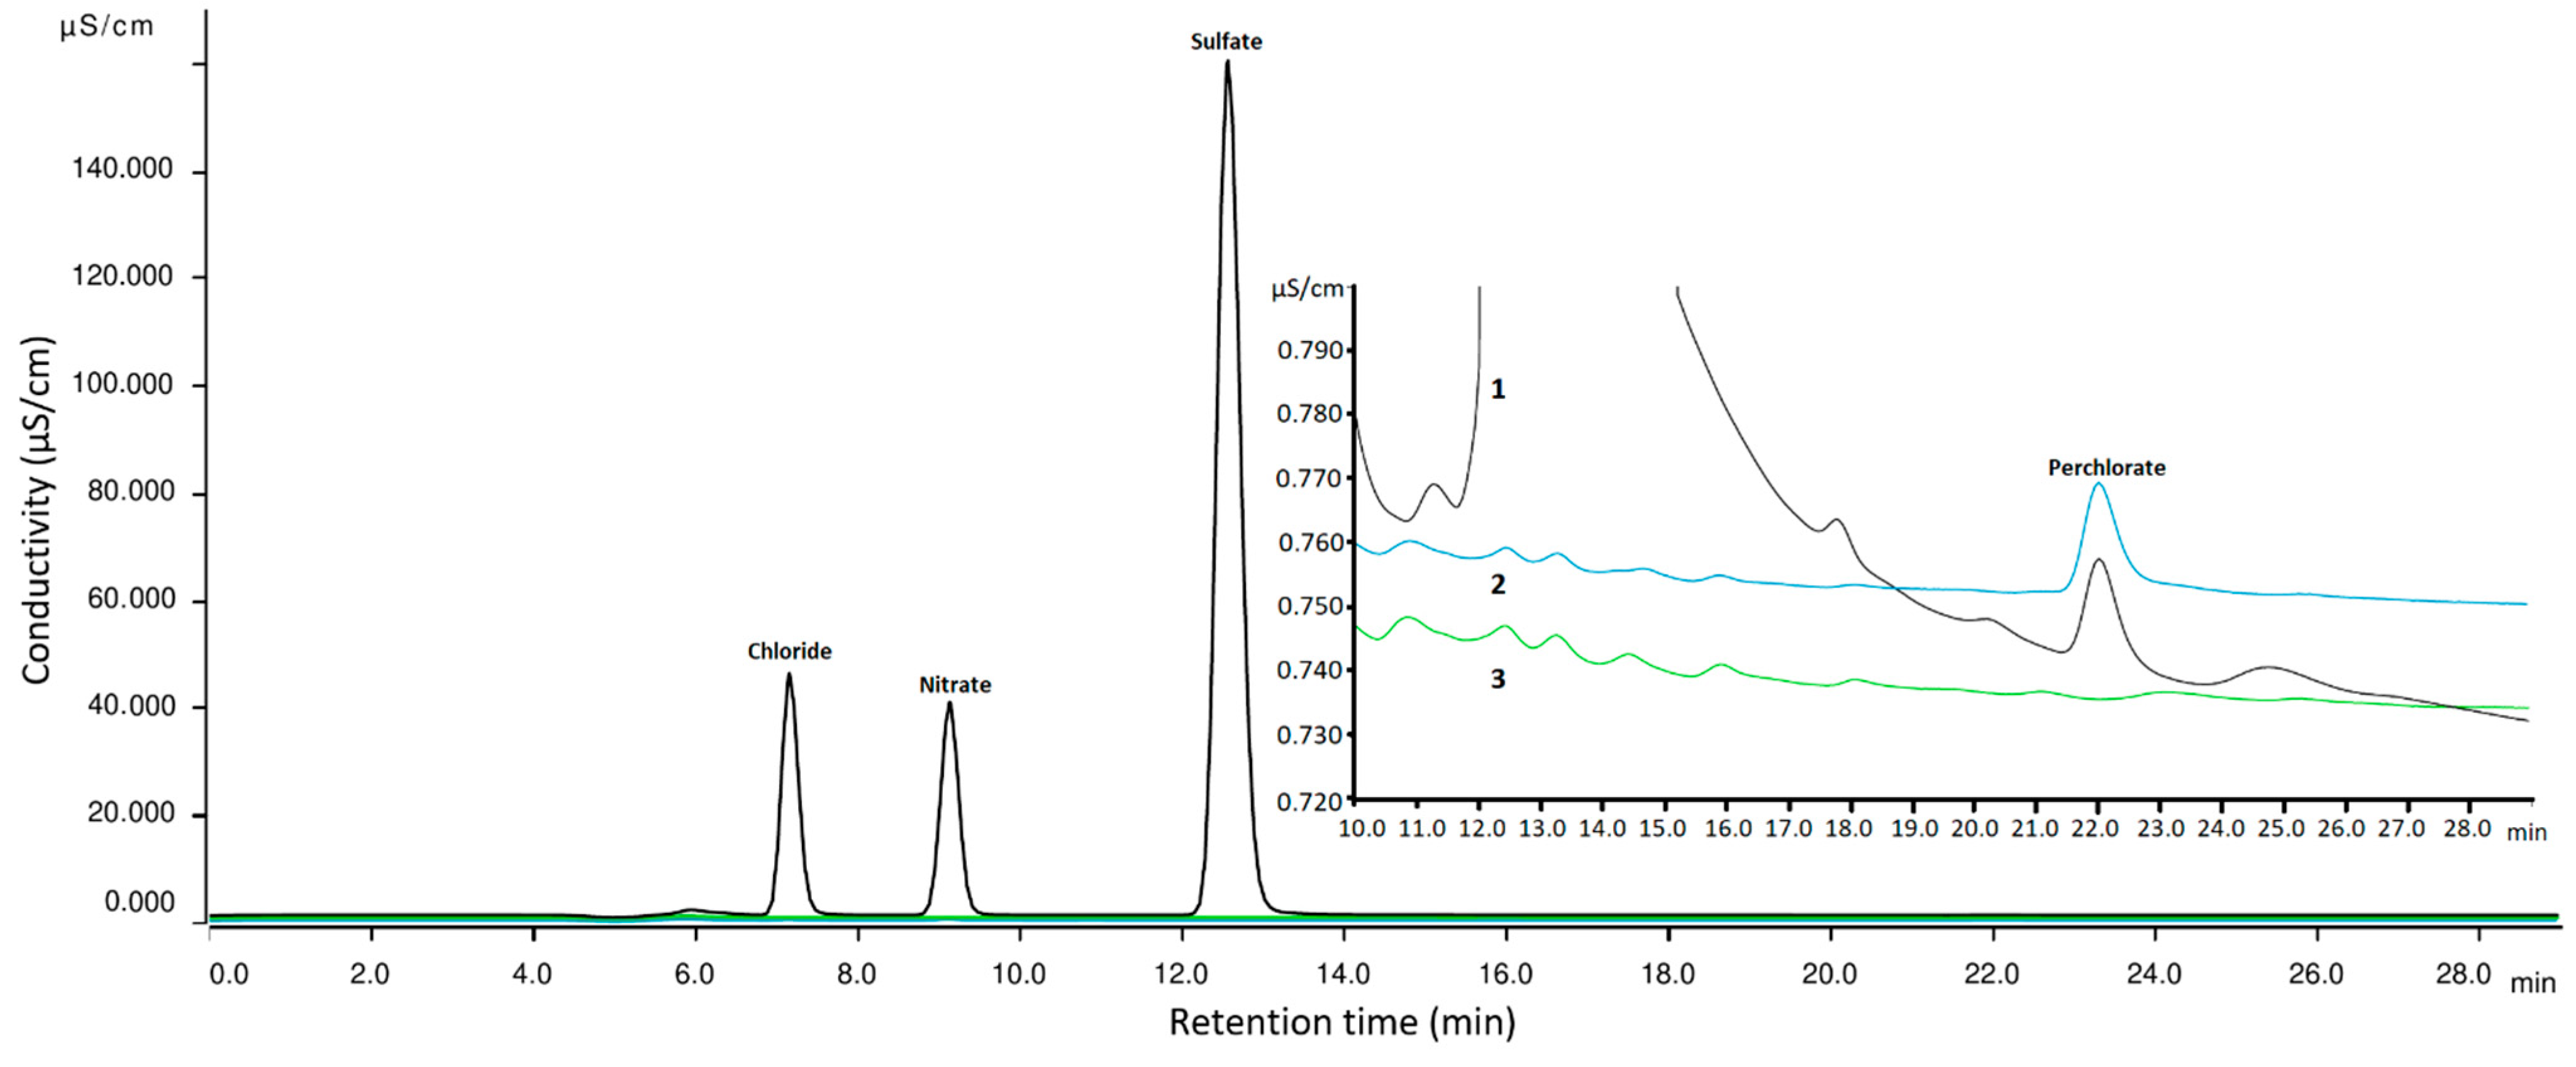
A reasonable separation of the peaks as well as a reliable and sufficient signal from perchlorate ion in the applied analytical conditions have been obtained. A detailed over-lay chromatogram of the blank, standard solution and real sample has been presented in Figure 2. In order to provide more extensive information of chromatographic analysis, separate chromatograms of the blank sample, perchlorate standard solution [5 µg/L], and analyzed sample of river water are given in the Supplementary Materials (Figures S1–S3).
We have also compared the determined concentration of perchlorate in the tested samples to the currently adopted recommendations, both in the European Union and in the United States. In 2005, the US National Academy of Sciences had established the daily dose of perchlorate, which does not cause observable adverse effects (NOAEL), at 0.7 µg/kg of body weight and it has been calculated to correspond to a perchlorate concentration in drinking water to 24.5 µg/L [15,16]. In 2015, the CONTAM Panel established the Tolerable Daily Intake (TDI) of perchlorate at 0.3 µg/kg of body weight, which can be converted to 10.5 µg/L in drinking water [10]. The concentrations did not exceed the NOAEL and the TDI levels in any of the tested water samples. The highest determined concentration of perchlorate was in the pool water sample (8.14 ± 0.01 µg/L) and was by 2.36 µg/L (22.5%) lower than the TDI and by as much as 16.36 µg/L (77.5%) lower than the NOAEL. The highest value of ClO4− concentration in river waters (3.12 ± 0.18 µg/L) was compared to the recommended levels and was lower by 7.36 µg/L (70.3%) and 21.38 µg/ L (87.3%), respectively. The results of comparison in graphical form are presented in the Supplementary Materials (Figure S4).
4. Discussion
4.1. Perchlorate in Bottled and Tap Water Samples
The results obtained in this study, where the concentration of perchlorate in any of the bottled water samples did not exceed the method detection limit (0.43 µg/L), appear to be consistent with the values published. Most of the works published so far that describe the content of perchlorate in bottled waters report a lower ClO4− concentration than measured in our study (see Table 2). Collected results of perchlorate determination in bottled waters from European countries where only one sample contained a significant amount of ClO4− (5.098 ± 0.040 µg/L, Porto, Portugal) [17] and the USA and some Asian countries indicate very little perchlorate pollution in this type of water. In the case of studies conducted in India, there are conflicting reports, in the studies of Naradaja et al., 2015, no perchlorate was detected in the tested samples [18], and the studies by Sijmol et al., 2016, indicate significant contamination of bottled waters from the same area (mean 84.71 µg/L) [19]. Unfortunately, the small number of samples tested (n = 5) in the study by Naradaja et al. versus Sijmol et al. (n = 68) does not allow one to simply compare and clearly explain the significant differences in the results of the determinations. Several works on the determination of perchlorate in bottled water have been published over the years. The results of the ClO4− determination in bottled waters from various regions of the world are summarized in Table 2.
4.2. Perchlorate in River Water Samples
Importantly, low levels of ClO4− were detected in two river samples, each from the Lubelskie (Sanna River) and the Upper Silesia (Bytomka River) regions. One possible reason for the contamination of rivers, in typically agricultural areas, may be due to the introduction of perchlorate into the soil by the process of its fertilization, in particular using fertilizers based on Chilean nitrate fertilizers.
The presence of ClO4− in rural river waters from Lubelskie region may be caused by gradual permeation of perchlorate from soils [34]. An example from Ontario, Canada indicates the presence of perchlorate (range 16–1047 ng/L) in streams in the rural area of the Thames River basin [35]. Recent studies from Chile revealed that fertilization is a decisive source of perchlorate to the environment. It has been found that nitrogenous Chilean fertilizers contain 3.1 mg/kg perchlorate compared to 1.3 mg/kg in non-nitrogenous [36].
According to the Chief Inspectorate of Environmental Protection (CIEP) data, the main source of chemical pollution of surface waters in the Lubelskie region is the use of artificial fertilizers in cultivation [37]. Monitoring of this area appears to be advisable, as it is potentially threatening to not only cultivation but also to dwellers of that region. It should be noted that mere traces were detected, and in addition only one water sample was taken from the middle course of the river. Greater contamination further down the river cannot be ruled out given its poor chemical state, nevertheless research needs to be continued and expanded. Confirmation of the persistent presence of perchlorate in water and soil can pose a real threat to the health of the population through the possible contamination of agricultural crops in the area. It has been proven that plants can absorb ClO4− directly from the ground via their root system to the other tissues. Furthermore, some of the plants (e.g., spinach and chard) can accumulate perchlorate in their leaves [38]
The Bytomka River flows through the Upper Silesian agglomeration, an industrially important region of Poland. Potential contamination may be caused by the discharge of industrial and municipal wastewater to the river [39]. One of the probable causes is the use of perchlorate-containing explosives in the nearby coal mines. In the case of the Upper Silesian agglomeration, constant monitoring of surface waters is necessary in order to estimate the concentration of perchlorate in rivers over a longer period of time. Importantly, it cannot be ruled out that the determined concentration was incidental, for example related to occasional works with the use of explosives. Fireworks can be another source of perchlorate pollution in rivers. Research conducted in Asia indicates that firework displays can significantly increase the content of perchlorate in river waters [40].
In short, some occurrences of ClO4− are naturally derived [5] and it cannot be precluded that the determined perchlorate content in the tested river water samples comes from a natural formation. It has been shown that the isotopic composition of synthetic Cl and O differs from the natural one, owing to which it will be possible to determine the probable sources of ClO4− in the environment more precisely [41].
4.3. Perchlorate in Swimming Pool Water Samples
The contamination of swimming pool water was expected due to some previous findings from different countries [42]. An application of gaseous chlorine or sodium hypochlorite as water disinfectants is the most likely source of perchlorate in the pool water. Chlorine and sodium hypochlorite may undergo oxidation reactions which lead to perchlorate development [43]. The studies by Dufour et al. show that recreational swimmers ingest approximately 32 mL of water from swimming pool per hour [44]. The results of perchlorate concentration in swimming pool water was in the range of 6.38–8.14 µg/L (as obtained by us) indicating that the level of perchlorate exposure through accidental consumption of swimming pool water during swimming is low. There is also the possibility of exposure to perchlorate via the transdermal route, however, ClO4− is poorly absorbed through skin [43], hence the occurrence of its toxic effects on humans is highly unlikely.
4.4. Current Regulations and Health Advisory Levels
Much controversy has surrounded the legal status of perchlorate as a health hazard, its environmental monitoring, as well as its maximum level in drinking water. Only in the United States have health advisory recommendations been settled: Reference Dose (RfD) of 0.7 µg/body weight/day and derivatives: Drinking Water Equivalent Level (DWEL) of 24.5 µg/L and Health Reference Level (HRL) of 15 µg/L [45]. In 2019, the US Environmental Protection Agency (EPA) proposed a maximum contamination level (MCL) in drinking water at 56 µg/L as the nationwide standard [46]. On the other hand, some states such as Massachusetts and California have their own regulations regarding MCL in drinking water of 2 and 6 µg/L, respectively [47,48]. There are currently no consistent standards for perchlorate concentration in public waters systems in Europe. Although in 2015, the European Commission issued a recommendation on the need to monitor perchlorate in food products, including waters, and a provisional level of Tolerable Daily Intake (TDI) has been established on 0.3 µg/body weight/day which can be calculated in the same way as DWEL on 10.5 µg/L [10]. In Poland, there are also no separate standards for the presence of perchlorate in food and water [49].
4.5. Limitations of the Study
The presented study has some limitations related to the number of samples tested. Collection of approximately 134 samples of different brands and production batches of bottled water available on the Polish market would be difficult for the academic research team and some support from the regulatory or government institutions seems necessary. The authors of the present work are fully aware that the territory of Poland appears highly diversified not only geographically but also economically and socially. Owning to this, the presented research may not fully reflect the real risk of environmental pollution with perchlorate. To our knowledge, no larger military installations that could potentially be the source of perchlorate in the environment were found in the tested area. However, the regions where such objects are located should be taken into account in further studies. A recent study of perchlorate determination in water samples from France has been conducted and concentrations in groundwater (range 0.3–33 µg/L) and in surface water (<0.5–10.2 µg/L) have been measured. Moreover, most of the highly contaminated samples originated from the area near a former military camp from World War II [50]. Despite the fact that the conductometric detector is not as sensitive to low concentrations of ClO4− as the tandem mass spectrometry detector (MS/MS), the IC–MS techniques require advanced and very expensive equipment, which may only be operated by experienced and highly qualified personnel. The LC–ESI–MS/MS techniques allow for quick and accurate determination of ClO4− concentration in water samples [38]. Recently, some novel inductively coupled plasma–tandem mass spectrometry (ICP–MS/MS) methods that allow for quick and rapid determination of low amounts (method detection limit of 0.3 µg/L) of perchlorate was described [51]. In low and middle-income countries, a significant limitation may be the lack of adequate funds to purchase such sophisticated equipment.
4.6. Strengths of the Study
The advantage of the applied IC–CD method is that the apparatus and reagents are relatively inexpensive as well as its operation seems undemanding. IC–CD allows for quick, sensitive, and reliable analysis. Despite the fact, that methods based on MS detection of perchlorate are currently most popular in scientific literature (see Table 2) the conductometric detection is also suitable for determining perchlorate in concentrations that may be hazardous to health [18]. This method may certainly be used for routine environmental analyses for far better availability of the equipment in the environmental monitoring laboratories. Another advantage is the possibility of determination other anions (e.g., chloride, nitrate, and sulfate) within one run. The time of one batch is about 28 min, so the method allows to analyze many samples in a relatively short time. As it seems, the limit of quantification of the method described by us is 1.42 µg/L compared to the DWEL (24.5 µg/L) [23] and TDI (10.5 µg/L) [11] is satisfactory. For comparison, the EPA 314.0 method, that is still in use has a detection limit of 4 µg/L [52].
4.7. Further Observations and Recommendations
Questions that appeared in one of the first publications about the harmful effects of perchlorate in the environment [53] remain open: how does the risk form perchlorate compare with other public risks in drinking water? Although perchlorate is the known chemical compound that most severely disrupts the normal functioning of the thyroid gland, many other environmental factors can also negatively affect the production of thyroid hormones. It seems justified to pay attention to the presence of other goitrogens in drinking waters—in particular nitrates, thiocyanates, and some heavy metals (lead and cadmium) [54]. In order to more accurately estimate the combined effect of the three most potent substances inhibiting iodine uptake into the thyroid gland (perchlorate, thiocyanate, and nitrate), the total perchlorate equivalent concentration (PEC) was proposed [55]. However, the use of PEC to estimate the risk of exposure to goitrogens requires precise knowledge about the concentration of the remaining ions, and at present such data from Poland are not available or are simply incomplete. For example, the study of 18 wells from central Poland, which showed that 39% of NO3− concentration is exceeded [56]. Extending the monitoring of surface waters carried out by CIEP by the concentration of perchlorate and thiocyanate (nitrate monitoring is already carried out, none of the rivers studied in 2018 exceeded the permissible concentration [37]) could provide the necessary data to try to estimate the risk of exposure of the Polish population to goitrogens by using the indicator PEC. The acute toxicity of large doses of perchlorate is currently well understood, but the risk of exposure to subclinical doses is still poorly investigated. Although small amounts of perchlorate in river water were detected, a larger-scale study including surface, ground, and rainwater across the country seems necessary. Such research will create a national database on the presence of perchlorate and other goitrogens in the environment. Furthermore, the analysis of ClO4− content in waters may help to estimate the exposure risk, especially considering their cumulative impact. Our previous study found that 59% of the studies published in 2010–2020 on the health effects of low doses of perchlorate indicated a statistically significant relationship between exposure to ClO4− and the development of thyroid dysfunction. Moreover, we have pointed, that the current NOAEL level (24.5 µg/L) could be out of date, yet it does not include some new data of perchlorate toxicity [2]. The latest studies published by Llorente-Esteban et al. have shown that exposure to perchlorate can be much more dangerous than previously thought [57]. Not only is perchlorate a sodium/iodide symporter (NIS) competitive blocker, but also it can modify the symporter function by allosteric modulation. Further studies on this topic are needed and it seems decisive to better understand NIS function and perchlorate toxicity via its disruption.
Apart from our study, no pollution of the Polish environment with perchlorate has been reported so far, so it seems that issuing regulations at this stage could be premature. Obtaining more data in the course of extensive environmental research could be used to create a comprehensive database and, consequently, it may help to establish perchlorate maximum safety levels. To the best of our knowledge, the present study appears to be the pioneering attempt to assess perchlorate contamination in Polish bottled, tap, surface, and swimming pool waters.
5. Conclusions
A fast, sensitive, and economical method of ion chromatography with suppressed conductivity detection was applied to determine perchlorate levels in various water samples from Poland. For the first time, waters from the rural region of Lubelskie and the industrial area of Upper Silesia were compared. Of the samples that were analyzed, merely two from rivers (each Lubelskie and Śląskie) and three from swimming pools from the Lubelskie region contained low, yet detectable ClO4−. The data indicate that bottled and tap water from Poland do not exceed the NOAEL and TDI levels and they seem unlikely to be an immediate health issue. Our findings are consistent with the reports to date from various parts of the world maintaining that bottled water is a minor source of exposure to perchlorate. On the other hand, the actual problem of perchlorate and other goitrogens in Polish surface and river waters is still vaguely understood and further studies covering the whole territory of the country are needed to assess the risk of perchlorate exposure to the general population.
Supplementary Materials
The following are available online at https://0-www-mdpi-com.brum.beds.ac.uk/article/10.3390/separations8040037/s1, Figure S1: DI water (blank sample) chromatogram. Figure S2: Perchlorate standard solution (5 µg/L) chromatogram. Figure S3: Real sample (river water No 8) chromatogram. Other matrix ions are present (not quantified). Figure S4: Comparison of perchlorate health advisory levels in drinking water with results of determination in water samples. The types of samples are represented by numbers. Table S1: Results of perchlorate determination in water samples (extended), Table S2: Analytical conditions.
Author Contributions
All authors contributed to the study conception and design. Samples were collected by P.N. and J.K. Material preparation, data collection, and analysis were performed by P.N. and P.W. The first draft of the manuscript was written by P.N. and all authors commented on previous versions of the manuscript. A critique was written by R.M. All authors have read and agreed to the published version of the manuscript.
Funding
This research was funded by Medical University of Lublin (funding No. 53/2020).
Institutional Review Board Statement
Not applicable.
Informed Consent Statement
Not applicable.
Data Availability Statement
Not available.
Acknowledgments
The authors would like to thank Anna Błażewicz from the Department of Analytical Chemistry at the Medical University of Lublin, Poland for her comments, suggestions, and critical remarks that allowed us to conduct the study and greatly improve the quality of the manuscript.
Conflicts of Interest
The authors declare no conflict of interest. The funders had no role in the design of the study; in the collection, analyses, or interpretation of data; in the writing of the manuscript, or in the decision to publish the results.
References
- Urbansky, E.T. Perchlorate Chemistry: Implications for Analysis and Remediation. Bioremediat. J. 1998, 2, 81–95. [Google Scholar] [CrossRef]
- Niziński, P.; Błażewicz, A.; Kończyk, J.; Michalski, R. Perchlorate—Properties, toxicity and human health effects: An updated review. Rev. Environ. Health 2020. ahead of print. [Google Scholar] [CrossRef]
- Cao, F.; Jaunat, J.; Sturchio, N.; Cancès, B.; Morvan, X.; Devos, A.; Barbin, V.; Ollivier, P. Worldwide occurrence and origin of perchlorate ion in waters: A review. Sci. Total Environ. 2019, 661, 737–749. [Google Scholar] [CrossRef]
- Vega, M.; Nerenberg, R.; Vargas, I.T. Perchlorate contamination in Chile: Legacy, challenges, and potential solutions. Environ. Res. 2018, 164, 316–326. [Google Scholar] [CrossRef]
- Catling, D.C.; Claire, M.W.; Zahnle, K.J.; Quinn, R.C.; Clark, B.C.; Hecht, M.H.; Kounaves, S. Atmospheric origins of perchlorate on Mars and in the Atacama. J. Geophys. Res. E Planets 2010, 115. [Google Scholar] [CrossRef]
- Fang, Q.; Chen, B. Natural Origins, Formation Mechanisms, and Fate of Environmental Perchlorate. Prog. Chem. 2012, 24, 2040–2053. [Google Scholar]
- European Commission. Commission Recommendation (EU) 2015/682 of 29 April 2015 on Monitoring for the Presence of Perchlorate in Food. 2015. Available online: https://sip.lex.pl/akty-prawne/dzienniki-UE/monitorowanie-obecnosci-nadchloranu-w-zywnosci-68521970 (accessed on 15 November 2020).
- Wolff, J. Perchlorate and the thyroid gland. Pharmacol. Rev. 1998, 50, 89–105. [Google Scholar] [PubMed]
- Eskandari, S.; Loo, D.D.F.; Dai, G.; Levy, O.; Wright, E.M.; Carrasco, N. Thyroid Na+/I- symporter. Mechanism, stoichiometry, and specificity. Biol. Chem. 1997, 272, 27230–27238. [Google Scholar] [CrossRef]
- The CONTAM Panel (EFSA Panel on Contaminants in the Food Chain). Scientific opinion on the public health risks associated with the presence of perchlorate in food, in particular fruit and vegetables. EFSA J. 2014, 12, 3869. [Google Scholar] [CrossRef]
- Szwajkosz, K.; Wawryniuk, A.; Sawicka, K.; Łuczyk, R. Hypothyroidism being caused by chronic autoimmune inflammation of the thyroid gland. J. Educ. Health Sport 2017, 7, 41–54. (In Polish) [Google Scholar] [CrossRef]
- Góra, D. Incidence of thyroid diseases in people aged 0–18 in selected cities of the Silesian Voivodeship. Acta Uroboroi 2018, 1, 81–90. [Google Scholar]
- Michalski, R.; Jabłońska-Czapla, M.; Szopa, S.; Łyko, A. Analysis of commercially available bottled water in Poland. Environ. Eng. Manag. J. 2018, 17, 1667–1677. [Google Scholar] [CrossRef]
- Metrohm, A.G. IC Application Note S-324 Version 1. Available online: https://www.metrohm.com/pl-pl/applications/AN-S-324 (accessed on 1 February 2021).
- National Research Council. Health Implications of Perchlorate Ingestion; National Academies Press: Washington, DC, USA, 2005. [Google Scholar]
- U.S. Environmental Protection Agency. 2012 Edition of the Drinking Water Standards and Health Advisories; U.S. Environmental Protection Agency: Washington, DC, USA, 2012.
- El Aribi, H.; Le Blanc, Y.J.; Antonsen, S.; Sakuma, T. Analysis of perchlorate in foods and beverages by ion chromatography coupled with tandem mass spectrometry (IC-ESI-MS/MS). Anal. Chim. Acta 2006, 567, 39–47. [Google Scholar] [CrossRef] [PubMed]
- Nadaraja, A.V.; Puthiyaveettil, P.G.; Bhaskaran, K. Surveillance of perchlorate in ground water, surface water and bottled water in Kerala, India. J. Environ. Health Sci. Eng. 2015, 13, 1–6. [Google Scholar] [CrossRef] [PubMed]
- Sijimol, M.R.; Mohan, M.; Dineep, D. Perchlorate contamination in bottled and other drinking water sources of Kerala, southwest coast of India. Energy Ecol. Environ. 2016, 1, 148–156. [Google Scholar] [CrossRef]
- Urbansky, E.T.; Gu, B.; Magnuson, M.L.; Brown, G.M.; Kelty, C.A. Survey of bottled waters for perchlorate by electrospray ionization mass spectrometry (ESI-MS) and ion chromatography (IC). J. Sci. Food Agric. 2000, 80, 1798–1804. [Google Scholar] [CrossRef]
- Huber, D.R.; Blount, B.C.; Mage, D.T.; Letkiewicz, F.J.; Kumar, A.; Allen, R.H. Estimating perchlorate exposure from food and tap water based on US biomonitoring and occurrence data. J. Expo. Sci. Environ. Epidemiol. 2010, 21, 395–407. [Google Scholar] [CrossRef] [PubMed]
- Snyder, S.A.; Vanderford, B.J.; Rexing, D.J. Trace Analysis of Bromate, Chlorate, Iodate, and Perchlorate in Natural and Bottled Waters. Environ. Sci. Technol. 2005, 39, 4586–4593. [Google Scholar] [CrossRef]
- Shi, Y.; Zhang, P.; Wang, Y.; Shi, J.; Cai, Y.; Mou, S.; Jiang, G. Perchlorate in sewage sludge, rice, bottled water and milk collected from different areas in China. Environ. Int. 2007, 33, 955–962. [Google Scholar] [CrossRef]
- Tefera, S.; Ehling, S.; Ho, I.P. Trace analysis of perchlorate anion in selected food products by reverse-phase liquid chromatography-tandem mass spectrometry. Food Addit. Contam. 2007, 24, 1203–1208. [Google Scholar] [CrossRef]
- Takatsuki, S.; Watanabe, T.; Sakai, T.; Matsuda, R.; Maitani, T. Surveillance of perchlorate level in leafy vegetables and bottled water. Shokuhin Eiseigaku Zasshi 2009, 50, 184–189. [Google Scholar] [CrossRef]
- Asami, M.; Kosaka, K.; Yoshida, N. Occurrence of Chlorate and Perchlorate in Bottled Beverages in Japan. J. Health Sci. 2009, 55, 549–553. [Google Scholar] [CrossRef]
- Kannan, K.; Praamsma, M.L.; Oldi, J.F.; Kunisue, T.; Sinha, R.K. Occurrence of perchlorate in drinking water, groundwater, surface water and human saliva from India. Chemosphere 2009, 76, 22–26. [Google Scholar] [CrossRef] [PubMed]
- Wu, Q.; Zhang, T.; Sun, H.; Kannan, K. Perchlorate in Tap Water, Groundwater, Surface Waters, and Bottled Water From China and its Association with Other Inorganic Anions and with Disinfection Byproducts. Arch. Environ. Contam. Toxicol. 2010, 58, 543–550. [Google Scholar] [CrossRef]
- Her, N.; Jeong, H.; Kim, J.; Yoon, Y. Occurrence of Perchlorate in Drinking Water and Seawater in South Korea. Arch. Environ. Contam. Toxicol. 2011, 61, 166–172. [Google Scholar] [CrossRef] [PubMed]
- Lin, S.-L.; Lo, C.-Y.; Fuh, M.-R. Quantitative determination of perchlorate in bottled water and tea with online solid phase extraction high-performance liquid chromatography coupled to tandem mass spectrometry. J. Chromatogr. A 2012, 1246, 40–47. [Google Scholar] [CrossRef] [PubMed]
- Iannece, P.; Motta, O.; Tedesco, R.; Carotenuto, M.; Proto, A. Determination of Perchlorate in Bottled Water from Italy. Water 2013, 5, 767–779. [Google Scholar] [CrossRef]
- Alomirah, H.F.; Al-Zenki, S.F.; Alaswad, M.C.; Alruwaih, N.A.; Wu, Q.; Kannan, K. Widespread occurrence of perchlorate in water, foodstuffs and human urine collected from Kuwait and its contribution to human exposure. Food Addit. Contam. Part A 2016, 33, 1016–1025. [Google Scholar] [CrossRef]
- Can, O.; Blount, B.; Valentin-Blasini, L.; Erdemgil, Y.; Uzunoglu, D.; Aksoy, M.; Coskun, A.; Serteser, M.; Unsal, I.; Ozpinar, A. Perchlorate Exposure Through Water and Milk in Istanbul. Bull. Environ. Contam. Toxicol. 2016, 97, 439–445. [Google Scholar] [CrossRef]
- Calderón, R.; Godoy, F.; Escudey, M.; Palma, P. A review of perchlorate (ClO4−) occurrence in fruits and vegetables. Environ. Monit. Assess. 2017, 189, 82. [Google Scholar] [CrossRef]
- Van Stempvoort, D.R.; MacKay, D.R.; Brown, S.J.; Collins, P. Environmental fluxes of perchlorate in rural catchments, Ontario, Canada. Sci. Total Environ. 2020, 720, 137426. [Google Scholar] [CrossRef]
- Calderón, R.; Palma, P.; Eltit, K.; Arancibia-Miranda, N.; Silva-Moreno, E.; Yu, W. Field study on the uptake, accumulation and risk assessment of perchlorate in a soil-chard/spinach system: Impact of agronomic practices and fertilization. Sci. Total Environ. 2020, 719, 137411. [Google Scholar] [CrossRef] [PubMed]
- Chief Inspectorate of Environmental Protection. The State of the Environment in the Lubelskie Voivodeship in 2020; Chief Inspectorate of Environmental Protection Press: Lublin, Poland, 2020. (In Polish)
- Calderon, R.; Rajendiran, K.; Kim, U.J.; Palma, P.; Arancibia-Miranda, N.; Silva-Moreno, E.; Corradini, F. Sources and fates of perchlorate in soils in Chile: A case study of perchlorate dynamics in soil-crop systems using lettuce (Lactuca sativa) fields. Environ. Pollut. 2020, 264, 114682. [Google Scholar] [CrossRef]
- Chief Inspectorate of Environmental Protection. The State of the Environment in the Silesian Voivodeship in 2017; Chief Inspectorate of Environmental Protection Press: Katowice, Poland, 2018. (In Polish)
- Guruge, K.S.; Wu, Q.; Kannan, K. Occurrence and exposure assessment of perchlorate, iodide and nitrate ions from dairy milk and water in Japan and Sri Lanka. J. Environ. Monit. 2011, 13, 2312–2320. [Google Scholar] [CrossRef] [PubMed]
- Sturchio, N.C.; Böhlke, J.K.; Gu, B.; Hatzinger, P.B.; Jackson, W.A. Isotopic Tracing of Perchlorate in the Environment. In Handbook of Environmental Isotope Geochemistry; Advances in Lithium Isotope Geochemistry Series; Baskaran, M., Ed.; Springer: Berlin/Heidelberg, Germany, 2012; pp. 1–951. [Google Scholar]
- Seiler, M.A.; Jensen, D.; Neist, U.; Deister, U.K.; Schmitz, F. Determination of trace perchlorate in water: A simplified method for the identification of potential interferences. Environ. Sci. Eur. 2017, 29, 30. [Google Scholar] [CrossRef]
- Bu, G.; Coates, J.D. Perchlorate: Environmental Occurrence, Interactions and Treatment; Springer: Boston, MA, USA, 2006. [Google Scholar]
- Dufour, A.P.; Behymer, T.D.; Cantú, R.; Magnuson, M.; Wymer, L.J. Ingestion of swimming pool water by recreational swimmers. J. Water Health 2017, 15, 429–437. [Google Scholar] [CrossRef] [PubMed]
- U.S. Environmental Protection Agency. 2018 Edition of the Drinking Water Standards and Health Advisories Tables. 2018. Available online: https://www.epa.gov/sites/production/files/2018-03/documents/dwtable2018.pdf (accessed on 1 February 2021).
- U.S. Environmental Protection Agency. National Primary Drinking Water Regulations: Perchlorate. A Proposed Rule by the Environmental Protection Agency on 06/26/2019. 84 FR 30524. 2019. Available online: https://www.govinfo.gov/content/pkg/FR-2019-06-26/pdf/2019-12773.pdf (accessed on 1 February 2021).
- California Department of Public Health. 2007. Available online: https://www.waterboards.ca.gov/drinking_water/certlic/drinkingwater/documents/perchlorate/AdoptionMemotoWaterSystems-10-2007.pdf (accessed on 1 February 2021).
- Massachussetts Department of Environmental Protection (MassDEP). 2006. Available online: https://www.mass.gov/doc/drinking-water-standard-for-perchlorate/download (accessed on 1 February 2021).
- Act of July 20, 2017—Water Law. Polish Journal of Laws 2017, Item 1566. Available online: https://isap.sejm.gov.pl/isap.nsf/download.xsp/WDU20170001566/U/D20171566Lj.pdf (accessed on 1 February 2021). (In Polish)
- Cao, F.; Jaunat, J.; Ollivier, P.; Cancès, B.; Morvan, H.; Hubé, D.; Devos, A.; Devau, N.; Barbin, V.; Pannet, P. Sources and behavior of perchlorate ions (ClO4−) in chalk aquifer of Champagne—Ardenne, France: Preliminary results. Proc. IAHS 2018, 379, 113–117. [Google Scholar] [CrossRef]
- Lajin, B.; Goessler, W. HPLC-ICPMS/MS shows a significant advantage over HPLC-ICPMS for the determination of perchlorate in ground, tap, and river water. Anal. Chim. Acta 2020, 1094, 11–17. [Google Scholar] [CrossRef]
- Hautman, D.P.; Munch, D.J. Determination of Perchlorate in Drinking Water Using Ion Chromatography; U.S. Environmental Protection Agency: Cincinnati, OH, USA, 1999.
- Urbansky, E.; Schock, M. Issues in managing the risks associated with perchlorate in drinking water. J. Environ. Manag. 1999, 56, 79–95. [Google Scholar] [CrossRef]
- Bajaj, J.K.; Salwan, P.; Salwan, S. Various possible toxicants involved in thyroid dysfunction: A review. J. Clin. Diagn. Res. 2016, 10, FE01–FE03. [Google Scholar] [CrossRef]
- Mortensen, M.E.; Birch, R.; Wong, L.-Y.; Valentin-Blasini, L.; Boyle, E.B.; Caldwell, K.L.; Merrill, L.S.; Moye, J.; Blount, B.C. Thyroid antagonists and thyroid indicators in U.S. pregnant women in the Vanguard Study of the National Children’s Study. Environ. Res. 2016, 149, 179–188. [Google Scholar] [CrossRef] [PubMed]
- Raczuk, J.; Biardzka, E.; Michalczyk, M. Nitrogen compounds in well water in the light of the health risk of the inhabitants of the Wodanie commune. Water Environ. Rural Areas 2009, 1, 87–97. (In Polish) [Google Scholar]
- Llorente-Esteban, A.; Manville, R.W.; Reyna-Neyra, A.; Abbott, G.W.; Amzel, L.M.; Carrasco, N. Allosteric regulation of mammalian Na+/I− symporter activity by perchlorate. Nat. Struct. Mol. Biol. 2020, 27, 533–539. [Google Scholar] [CrossRef] [PubMed]
Figure 1.
Area map outlining the origin of examined bottled waters. The types of sample origin are represented by numbers in bars (see Table 1). The codes of regions are given in square brackets.
Figure 1.
Area map outlining the origin of examined bottled waters. The types of sample origin are represented by numbers in bars (see Table 1). The codes of regions are given in square brackets.

Figure 2.
An overlay chromatogram of: (1) river water sample (sample No 8, other matrix ions are present), (2) standard solution (5 µg/L), and (3) blank (deionized water (DI) water).
Figure 2.
An overlay chromatogram of: (1) river water sample (sample No 8, other matrix ions are present), (2) standard solution (5 µg/L), and (3) blank (deionized water (DI) water).

Table 2.
Occurrence of perchlorate in bottled water in various geographical regions.
| Year | Country | Number of Samples | Perchlorate Concentration Range [µg/L] | Applied Method | Method Detection Limit | References |
|---|---|---|---|---|---|---|
| 2000 | USA | 8 | ND (<5.0) | IC-ESI-MS | 6 µg/L | [20] |
| 2004–2005 | USA | 51 | <0.05 | IC–MS/MS | 4 µg/L | [21] |
| 2005 | USA | 21 | 0.07–0.74 | LC-MS/MS | 21 ng/L | [22] |
| 2006 | Various | 10 | 0.092–5.098 | IC-ESI-MS/MS | 5 ng/L | [17] |
| 2007 | China | 21 | 0.037–2.013 | IC-ESI-MS/MS | 2 ng/L | [23] |
| 2007 | USA | 3 | <1.0 | HPLC-MS/MS | 0.3 µg/L | [24] |
| 2009 | Japan | 36 | <0.1–0.35 | IC–MS/MS | 0.1 µg/L (LOQ) | [25] |
| 2009 | Japan | 10 | <0.1–0.53 | IC–MS/MS | 50 ng/L (LOQ) | [26] |
| 2009 | India | 5 | <0.02 | HPLC-MS/MS | 20 ng/L (LOQ) | [27] |
| 2010 | China | 69 | <0.02–0.64 | HPLC-MS | 20 ng/ L (LOQ) | [28] |
| 2011 | Rep. of Korea | 48 | 0.04–0.29 | LC-MS/MS | 5 ng/L | [29] |
| 2012 | Taiwan | 4 | 0.1-0.2 | SPEHPLC–MS/MS | 10 ng/L | [30] |
| 2013 | Italy | 62 | <0.005–0.075 | LC–ESI–MS/MS | 2 ng/L | [31] |
| 2015 | India | 5 | <2.0 | IC–CD | 2 µg/L | [18] |
| 2016 | India | 68 | 0–1067.89 (mean 84.71) | LC-MS | 2 µg/L | [19] |
| 2016 | Kuwait | 13 | 0.01–0.70 | HPLC-MS/MS | Not given | [32] |
| 2016 | Turkey | 27 | <0.05–0.13 (median <0.05) | IC–MS/MS | 50 ng/L | [33] |
Abbreviations: IC—Ion Chromatography, ESI—Electrospray Ionization, MS—Mass Spectrometry, HPLC—High Performance Liquid Chromatography, LC—Liquid Chromatography, SPE—Solid Phase Extraction, and CD—Conductometric Detection.
Publisher’s Note: MDPI stays neutral with regard to jurisdictional claims in published maps and institutional affiliations. |
© 2021 by the authors. Licensee MDPI, Basel, Switzerland. This article is an open access article distributed under the terms and conditions of the Creative Commons Attribution (CC BY) license (http://creativecommons.org/licenses/by/4.0/).
Share and Cite
MDPI and ACS Style
Niziński, P.; Wiśniewska, P.; Kończyk, J.; Michalski, R. Perchlorate Levels in Polish Water Samples of Various Origin. Separations 2021, 8, 37. https://0-doi-org.brum.beds.ac.uk/10.3390/separations8040037
AMA Style
Niziński P, Wiśniewska P, Kończyk J, Michalski R. Perchlorate Levels in Polish Water Samples of Various Origin. Separations. 2021; 8(4):37. https://0-doi-org.brum.beds.ac.uk/10.3390/separations8040037
Chicago/Turabian StyleNiziński, Przemysław, Patrycja Wiśniewska, Joanna Kończyk, and Rajmund Michalski. 2021. "Perchlorate Levels in Polish Water Samples of Various Origin" Separations 8, no. 4: 37. https://0-doi-org.brum.beds.ac.uk/10.3390/separations8040037
Note that from the first issue of 2016, this journal uses article numbers instead of page numbers. See further details here.