Article

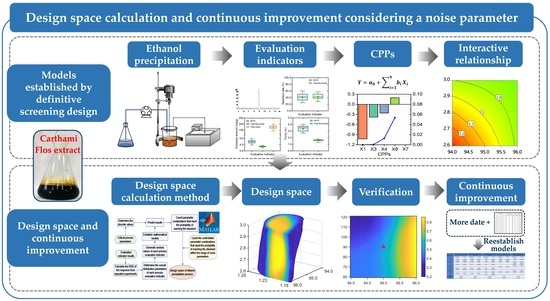
Design Space Calculation and Continuous Improvement Considering a Noise Parameter: A Case Study of Ethanol Precipitation Process Optimization for Carthami Flos Extract

Pharmaceutical Informatics Institute, College of Pharmaceutical Sciences, Zhejiang University, Hangzhou 310058, China
*
Author to whom correspondence should be addressed.
Submission received: 24 March 2021 / Revised: 13 May 2021 / Accepted: 20 May 2021 / Published: 24 May 2021
(This article belongs to the Special Issue Computer-Aided Separation Analysis)

Abstract

:
The optimization of process parameters in the pharmaceutical industry is often carried out according to the Quality by Design (QbD) concept. QbD also emphasizes that continuous improvement should be performed in life cycle management. Process parameters that are difficult to control in actual production can be regarded as noise parameters. In this study, based on the QbD concept, the ethanol precipitation process of Carthami Flos extract was optimized, considering a noise parameter. The density of the concentrated extract, ethanol concentration, the volume ratio of ethanol to concentrated extract, stirring time after ethanol addition, and refrigeration temperature were selected as critical process parameters (CPPs), using a definitive screening design. The mathematical models among CPPs and evaluation indicators were established. Considering that the refrigeration temperature of industrial ethanol precipitation is often difficult to control with seasonal changes, refrigeration temperature was treated as a noise parameter. A calculation method for the design space in the presence of the noise parameter was proposed. The design space was calculated according to the probability of reaching the standards of evaluation indicators. Controlling parameters within the design space was expected to reduce the influence of noise parameter fluctuations on the quality of the ethanol precipitation supernatant. With more data obtained, the design space was updated. In industry, it is also recommended to adopt a similar idea: that is, continuing to collect industrial data and regularly updating mathematical models, which can further update the design space and make it more stable and reliable.

Graphical Abstract

1. Introduction

Ethanol precipitation is a common refinement process in traditional Chinese medicine (TCM) production. By adding ethanol into a concentrated extract, impurities such as proteins, salts, and polysaccharides can be removed while retaining effective ingredients. Because ethanol precipitation has a good impurity removal effect and does not need special equipment, it is widely used in TCM production. The Chinese Pharmacopoeia (2020 Edition) includes 1607 compound preparations and single preparations [1], of which 319 used ethanol precipitation, accounting for approximately 19.8% of the total preparations, and 49% of the liquid preparations contained were prepared using the ethanol precipitation process (EPP), including compound Danshen dripping pills, Huoxiang Zhengqi dripping pills, compound Caoshanhu buccal tablets, and many other varieties of TCMs.
However, many factors affect the ethanol precipitation process, mainly including concentrate characteristics, ethanol characteristics, standing, stirring, equipment, environment, etc. [2]. In recent years, to understand ethanol precipitation, numerous researchers have studied the process, mainly focusing on the optimization of process parameters [3,4,5,6], process monitoring technology [7,8,9], ethanol precipitation equipment [10,11], sediment morphology [12,13], etc. For evaluating the interactions among factors and establishing a robust process operation space, combinations of Quality by Design (QbD) were used to optimize EPP parameters, such as QbD with a design space approach optimizing the EPP of Panax notoginseng for Xuesaitong injection [14] and QbD with membrane dispersion ethanol precipitation equipment optimizing the EPP of Astragali radix [11].
Q8 (R2) [15], issued by ICH in 2009, is the guidance for defining a scientifically based QbD systematic approach for product development. It puts forward six key elements of QbD for drug research and development: (1) Determine the quality target product profile (QTPP); (2) Determine the critical quality attributes (CQAs) of products; (3) Based on risk assessment and experimental research, establish the relationship model among critical material attributes (CMAs) and critical process parameters (CPPs); (4) Develop the design space of the product production process; (5) Develop a control strategy and form the control space; (6) Use product life cycle management and continuous improvement to ensure the stability of quality. In these elements, continuous improvement is the core part of the QbD concept, which is conducive to improving the flexibility of production and reducing the regulatory burden [16]. The continuous improvement driven by larger data sets is promising. Currently, there is a lack of reporting on continuous improvement for investigating the EPP.
In industrial operation, some ethanol precipitation parameters such as refrigeration temperature of the ethanol precipitation system are easily affected by the seasons and are difficult to control and can be regarded as process noise parameters. When establishing the design space, the influence of adjusting the ranges of easily controllable parameters and reducing the noise parameters should be considered [17]. However, there are few studies on the optimization of ethanol precipitation to distinguish easily controllable parameters from noise parameters.
Guhong injection, a sterilized aqueous solution mixed with Acetylglutamide and Carthami Flos extract, is clinically used to treat cerebrovascular diseases [18] and orthopedic diseases [19] including cerebral insufficiency, cerebral thrombosis, coronary heart disease, fracture healing, etc. Carthami Flos, widely known as “Hong-Hua” in China, is the dried flower of Carthamus tinctorius L. It is a representative medicine for promoting blood circulation and removing blood stasis. Carthami Flos extract is obtained from the concentrated solution by ethanol precipitation, potassium removal, and filtration. The EPP is a quite important link in the production of Guhong injection, and the process quality directly affects the quality of the finished products. Only accurately optimizing and controlling the CPPs affecting the EPP can improve the quality of the extract.
Hydroxysafflor yellow A (HSYA) in Carthami Flos extract is a critical component in the treatment of cerebrovascular diseases, and it has anti-ischemic reperfusion injury [20], neuroprotective [21], antioxidant [22], and anti-inflammatory [23] effects, among others. The Chinese Pharmacopoeia (2020 Edition) also uses HSYA as one of the quality evaluation indicators of Carthami Flos. Flavonoids are the main active components of Carthami Flos and play an important role in the treatment of cerebrovascular diseases [24]. The total solids amount can be used to characterize the ability to remove impurities after the EPP. Studies have reported [25,26] that the retention rate of index components has been used as the evaluation indicator for the EPP. Because the retention rate can be calculated from the total solid content and the purity of the index components, the retention rate was not included in the evaluation indicators in this study. Therefore, the extracted amount of HSYA, extracted amount of total flavonoids, extracted amount of total solids, HSYA purity, and purity of total flavonoids were regarded as evaluation indicators for the EPP in this study.
This study was aimed at establishing the design space according to the QbD concept and providing a continuous improvement case considering a noise parameter. Based on the QbD concept, the identification of the CPPs of Carthami Flos ethanol precipitation was carried out using the definitive screening design. The advantage of this design method is the ability to study the influence of multiple parameters with a small number of experiments [27]. The factors that have the greatest impact on the response can be identified by the definitive screening design. The mathematical relationship among CPPs and EPP evaluation indicators was established by the quadratic multiple regression model. In the process of ethanol precipitation, the level of easily controllable parameters was controlled, the sensitivity of noise parameters was reduced, and the stability of ethanol precipitation was improved. This study presented a design space method based on the probability of reaching the standard for calculating the range of easily controllable parameters by self-programming. The design space was continuously improved based on more data from verification experiments to obtain a more reliable design space, which provided a reference method for improving the robustness of the process and the implementation of continuous improvement in the pharmaceutical industry.

2. Materials and Methods

2.1. Chemicals and Reagents

A concentrated extract of Carthami Flos (batch number 20200918) was provided by Tonghua Guhong Pharmaceutical Co., Ltd. (Jilin, China), with a density of 1.23 g/cm3, 1 g concentrated extract equivalent to 1.11 g Carthami Flos. Anhydrous aluminum chloride (batch number 20170824) was purchased from Sinopharm Chemical Reagent Co, Ltd. (Shanghai, China). HSYA (batch number R03J10F77660) and kaempferol (batch number 180705) were purchased from Shanghai Yuanye Biotechnology Co., Ltd. (Shanghai, China), and their purity was greater than 98%. Acetonitrile, methanol, glacial acetic acid, and triethylamine for chromatographic analysis were purchased from Merck (Darmstadt, Germany). Ultrahigh-purity water was produced using a water purification system (Milli-Q, Millipore, Burlington, MA, USA).

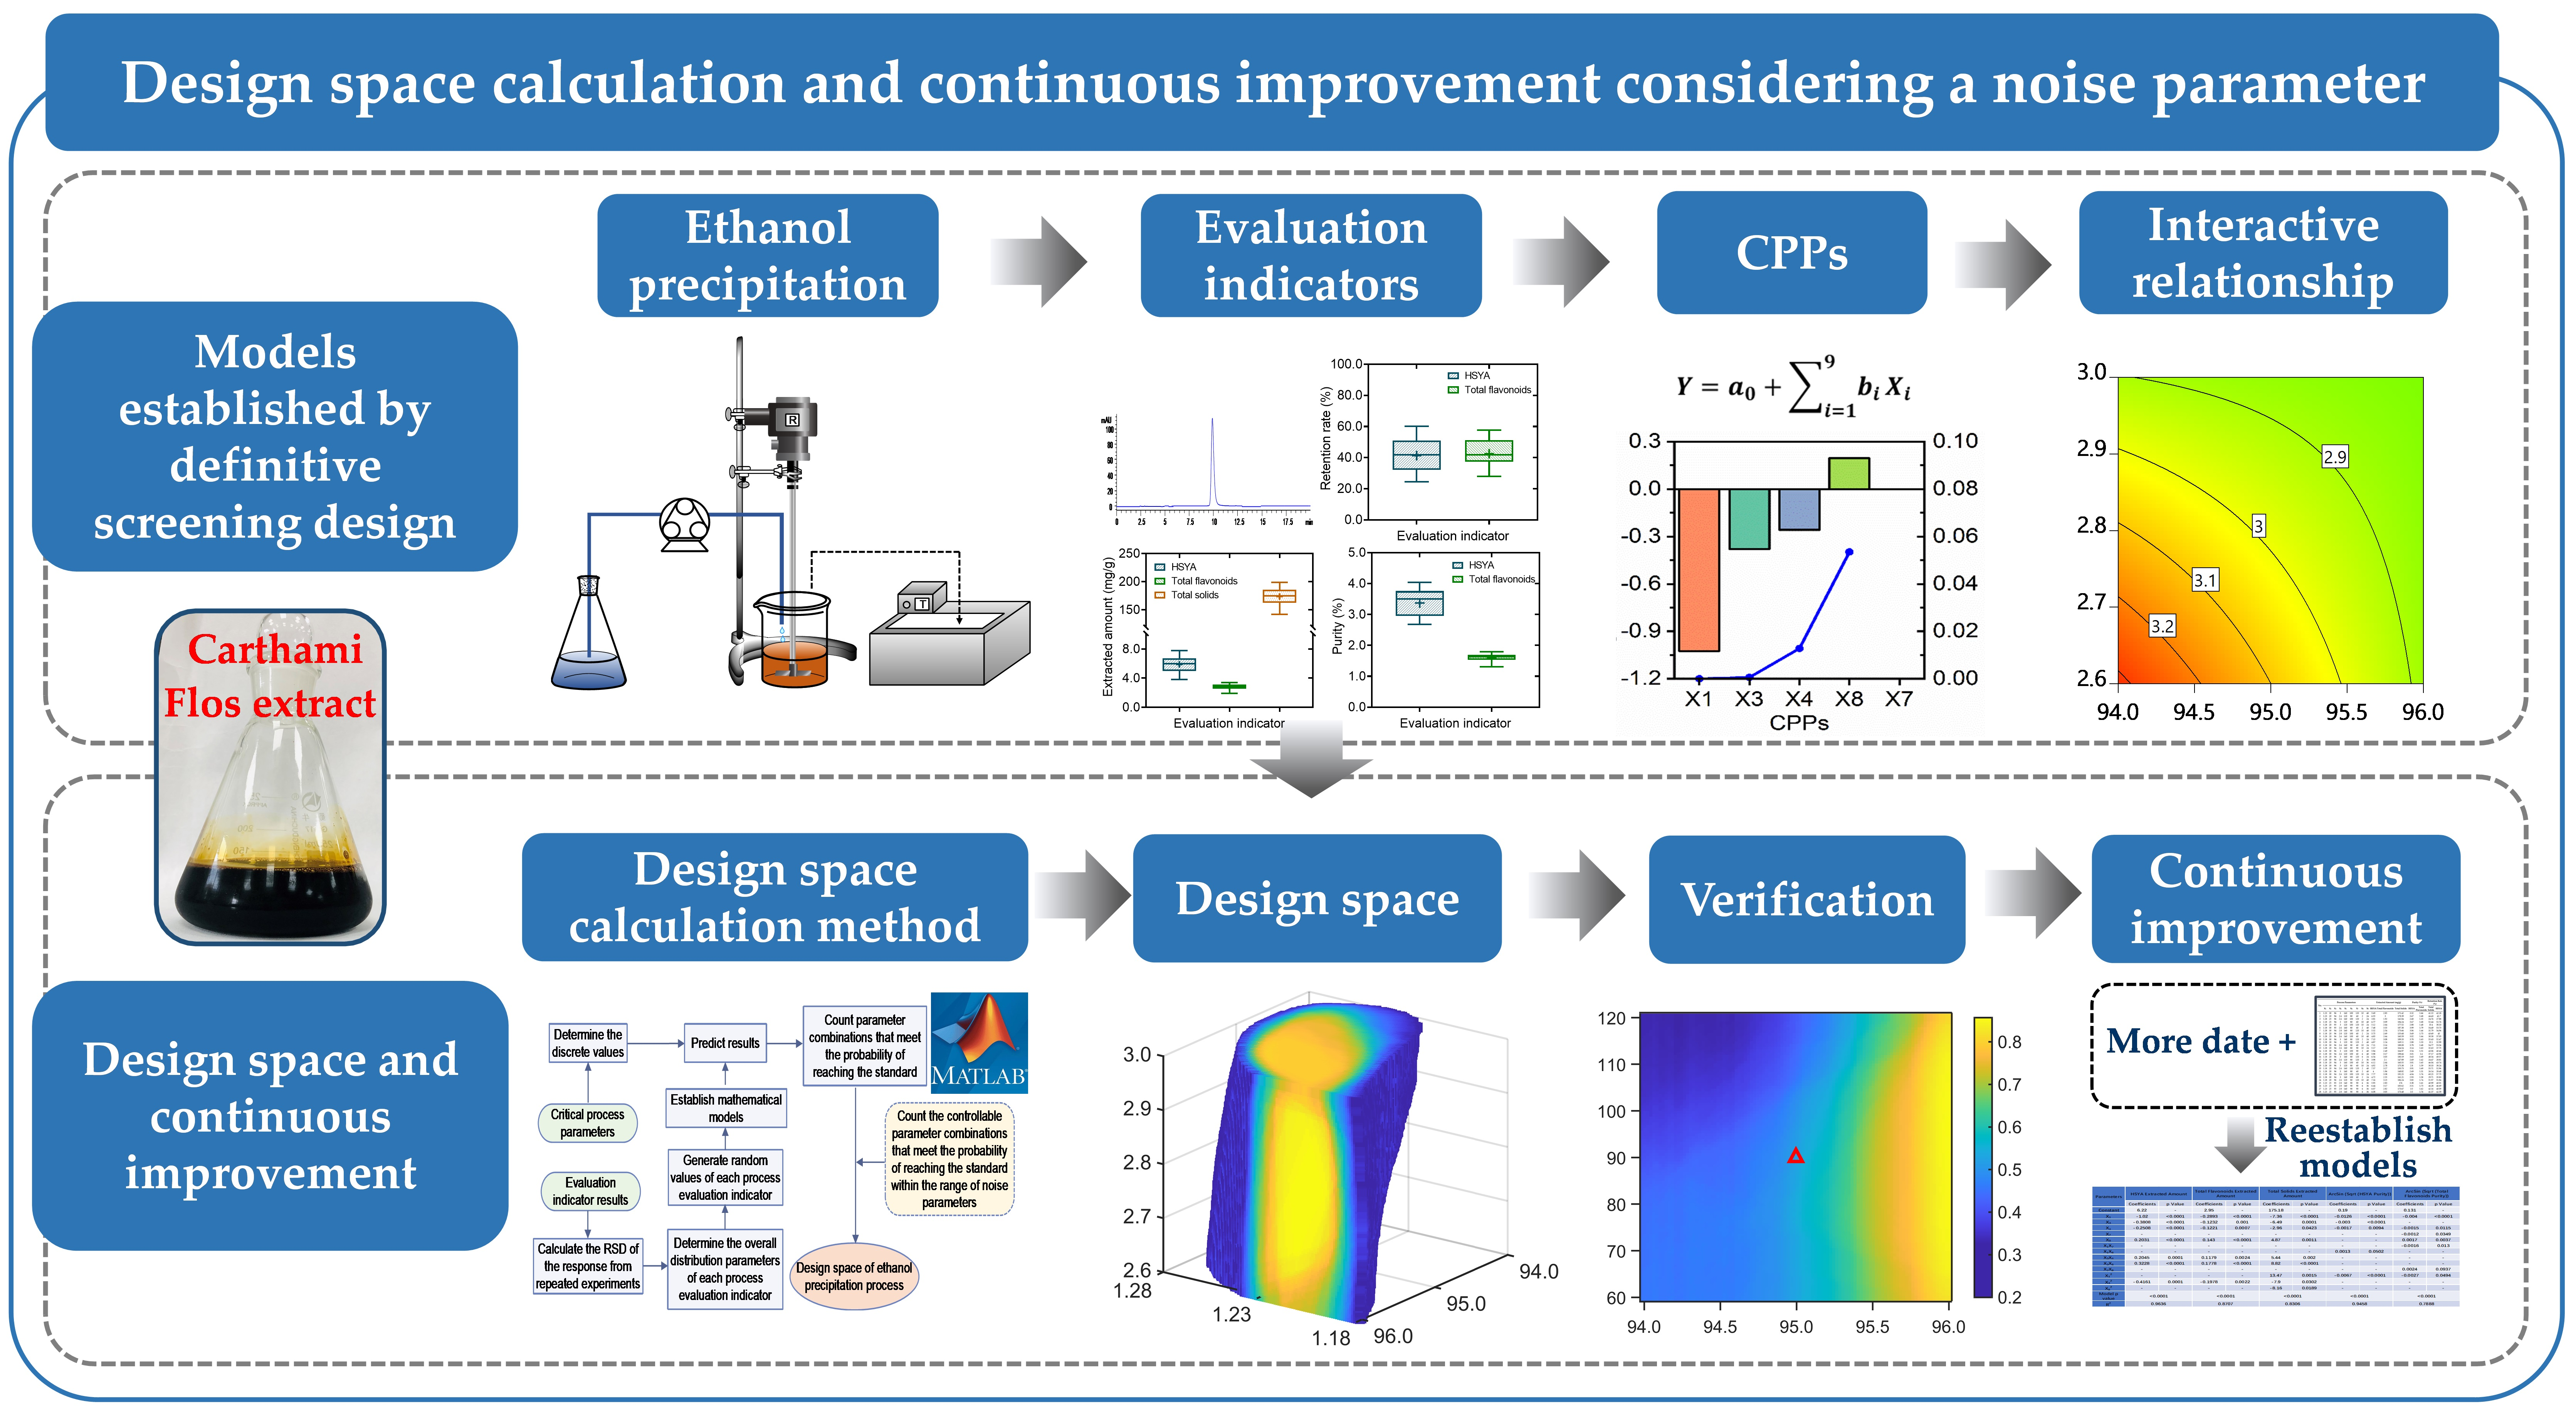
2.2. Ethanol Precipitation

The concentrated extract of Carthami Flos was diluted with ultrahigh-purity water or concentrated to obtain concentrates with densities of 1.18 g/cm3 and 1.28 g/cm3, respectively, which was accomplished with a density tester (DMA5000M, Anton Paar, Graz, Austria) and a rotary evaporator (V-100, BUCHI Labortechnik AG, Flawil, Switzerland). Compared to ethanol precipitation equipment in industrial production, reduced equipment proportions are used when conducting ethanol precipitation experiments in the laboratory. The schematic diagram of the experimental setup is shown in Figure 1. One hundred mL concentrated extract was placed into a beaker at a certain temperature. Ethanol solution was pumped into the beaker with a peristaltic pump (BT300-2J, Changzhou Runhua Electric Co., Ltd., Changzhou, China). After adding ethanol solution, the mixture was continuously stirred by a digital speed-measuring electric stirrer (JJ-IA, Changzhou Yunhua Electrical Appliance Co., Ltd., Changzhou, China) for a certain period. Next, the beaker was placed in a low-temperature thermostat bath (THYD-1030W, Ningbo Tianheng Instrument Factory, Ningbo, China) for standing. The flux for ethanol was determined by the volume ratio of ethanol and concentrate (ECR) and time of ethanol addition. The flux for ethanol was controlled by the peristaltic pump. The supernatants were collected by vacuum filtration.

2.3. Experimental Design

In this study, the definitive screening design for nine factors was selected to estimate the mathematical relationship among the process parameters and evaluation indicators. The selection of factors that might affect the supernatant quality was based on the experience accumulated in EPP of the Guhong injection in industrial production. It should be noted that input data of coded values referred to the industrial production conditions. The coding level and factor level of the definitive screening design are shown in Table 1. Two virtual factors were added in the experimental design, and the center point was repeated 3 times. The experimental design can be seen in Appendix B, Table A1.

2.4. Analytical Method

The content of HSYA was determined by an HPLC method [28]. An HPLC system (1100, Agilent Technologies, Santa Clara, CA, USA) equipped with a variable wavelength detector (G1314C), a quaternary pump (G1311A), a column thermostat (G1316A), an automatic liquid sampler (G1313A), and a degasser (G1322A) was used for all measurements. The components were all from Agilent Technologies, Santa Clara, CA, USA. Chromatographic separation was carried out at 30 °C on an Agilent Extend SB-C18 column (250 mm × 4.6 mm, 5 μm). A mobile phase containing acetonitrile (B) and 1.0% glacial acetic acid solution containing 0.5% triethylamine was used. The isocratic elution program was set as follows: (A): 91–91% A for 0 to 20 min. The injection volume was 10 μL, and the detection wavelength was fixed at 403 nm. After each run, the chromatographic system was set to 85% B for 8 min and balanced for 6 min with a flow rate of 1.0 mL/min. Representative HPLC chromatograms of the Carthami Flos sample and the reference standard sample are presented in Appendix B, Figure A1. The ethanol precipitation supernatant was diluted 25 times with ultrahigh-purity water, and the concentrated extract was diluted 50 times with ultrahigh-purity water.
The detailed determination method of the total flavonoid content in the supernatant was as described in the National Drug Standard for Guhong Injection [28], and the total flavonoid content was determined by a UV-Vis spectrophotometer (Cary 60, Agilent Technologies, Santa Clara, CA, USA). The total solid content was determined using a gravimetric method. The supernatant or concentrated extract was placed into a weighing bottle that had been dried to a constant mass, the solution was dried to a constant mass at 105 °C, its mass was weighed, and the total solid content in the supernatant or the concentrated extract was calculated.

2.5. Evaluation of Experimental Data

The extracted amount refers to the amount of a certain type of ingredient extracted per unit mass of Carthami Flos. Equations (1) and (2) were used to calculate the extracted amount of the index components and total solids in the supernatant, respectively.
Extracted   amount   of   index   components = M s × A C i M m
Extracted   amount   of   total   solids = M s × D M M m
where M refers to the quality, and the subscripts s and m represent the supernatant and Carthami Flos, respectively. A C refers to the contents of the index components in the supernatant, and the subscript i represents HSYA, or total flavonoids. D M refers to the total solid content in the supernatant. Equations (3) and (4) were used to calculate the retention rate and purity of the index components in the supernatant, respectively.
Retention   rate   of   index   components = M s × A C i M c × C i
Purity   of   index   compositions   = A C i D M
where M c refers to the quality of the concentrated extract, C refers to the content of the index components in the concentrated extract, and the subscript i represents HSYA, or total flavonoids.
Design Expert 11.0.0 software (Stat-Ease, Inc., Minneapolis, MN, USA) was used to analyze the results of the definitive screening design, and a multiple linear regression model, as in Equation (5), was chosen and fitted to model the process parameters and evaluation indicators.
Y = a 0 + i = 1 9 b i X i
where Y refers to an evaluation indicator, X i (i = 1–9) is a process parameter, a 0 is a constant, and b i is the regression coefficient of the process parameter. The backward elimination method was used to simplify the model, and the significance level was set to 0.10. Any remaining terms in the model were considered to be a CPP.
To describe the mathematical relationship among the CPPs and the evaluation indicators of the EPP, the mathematical model calculated by Design Expert 11.0.0 software (Stat-Ease, Inc.) as Equation (6) was built by the quadratic multiple regression model.
Y Y = b 0 + i = 1 n b i X i + i = 1 n b i i X i 2 + i = 1 n 1 j = i + 1 n b i j X i X j
where b 0 is a constant term, n is the number of CPPs, b i , b i i , and b i j are the regression coefficients of the first, quadratic, and interaction terms, respectively, and X i and X j are the CPPs. The above method adopted stepwise regression, and the significance levels of adding terms and removing terms were both set to 0.10. Our previous work showed that the larger the p value, the larger the coefficient of determination (R2); that is, more variation could be explained. However, if the p value was too large, overfitting occurred when too many terms were included in the models [29]. Therefore, the significance levels of the multiple linear regression model and quadratic multiple regression model were both 0.10.

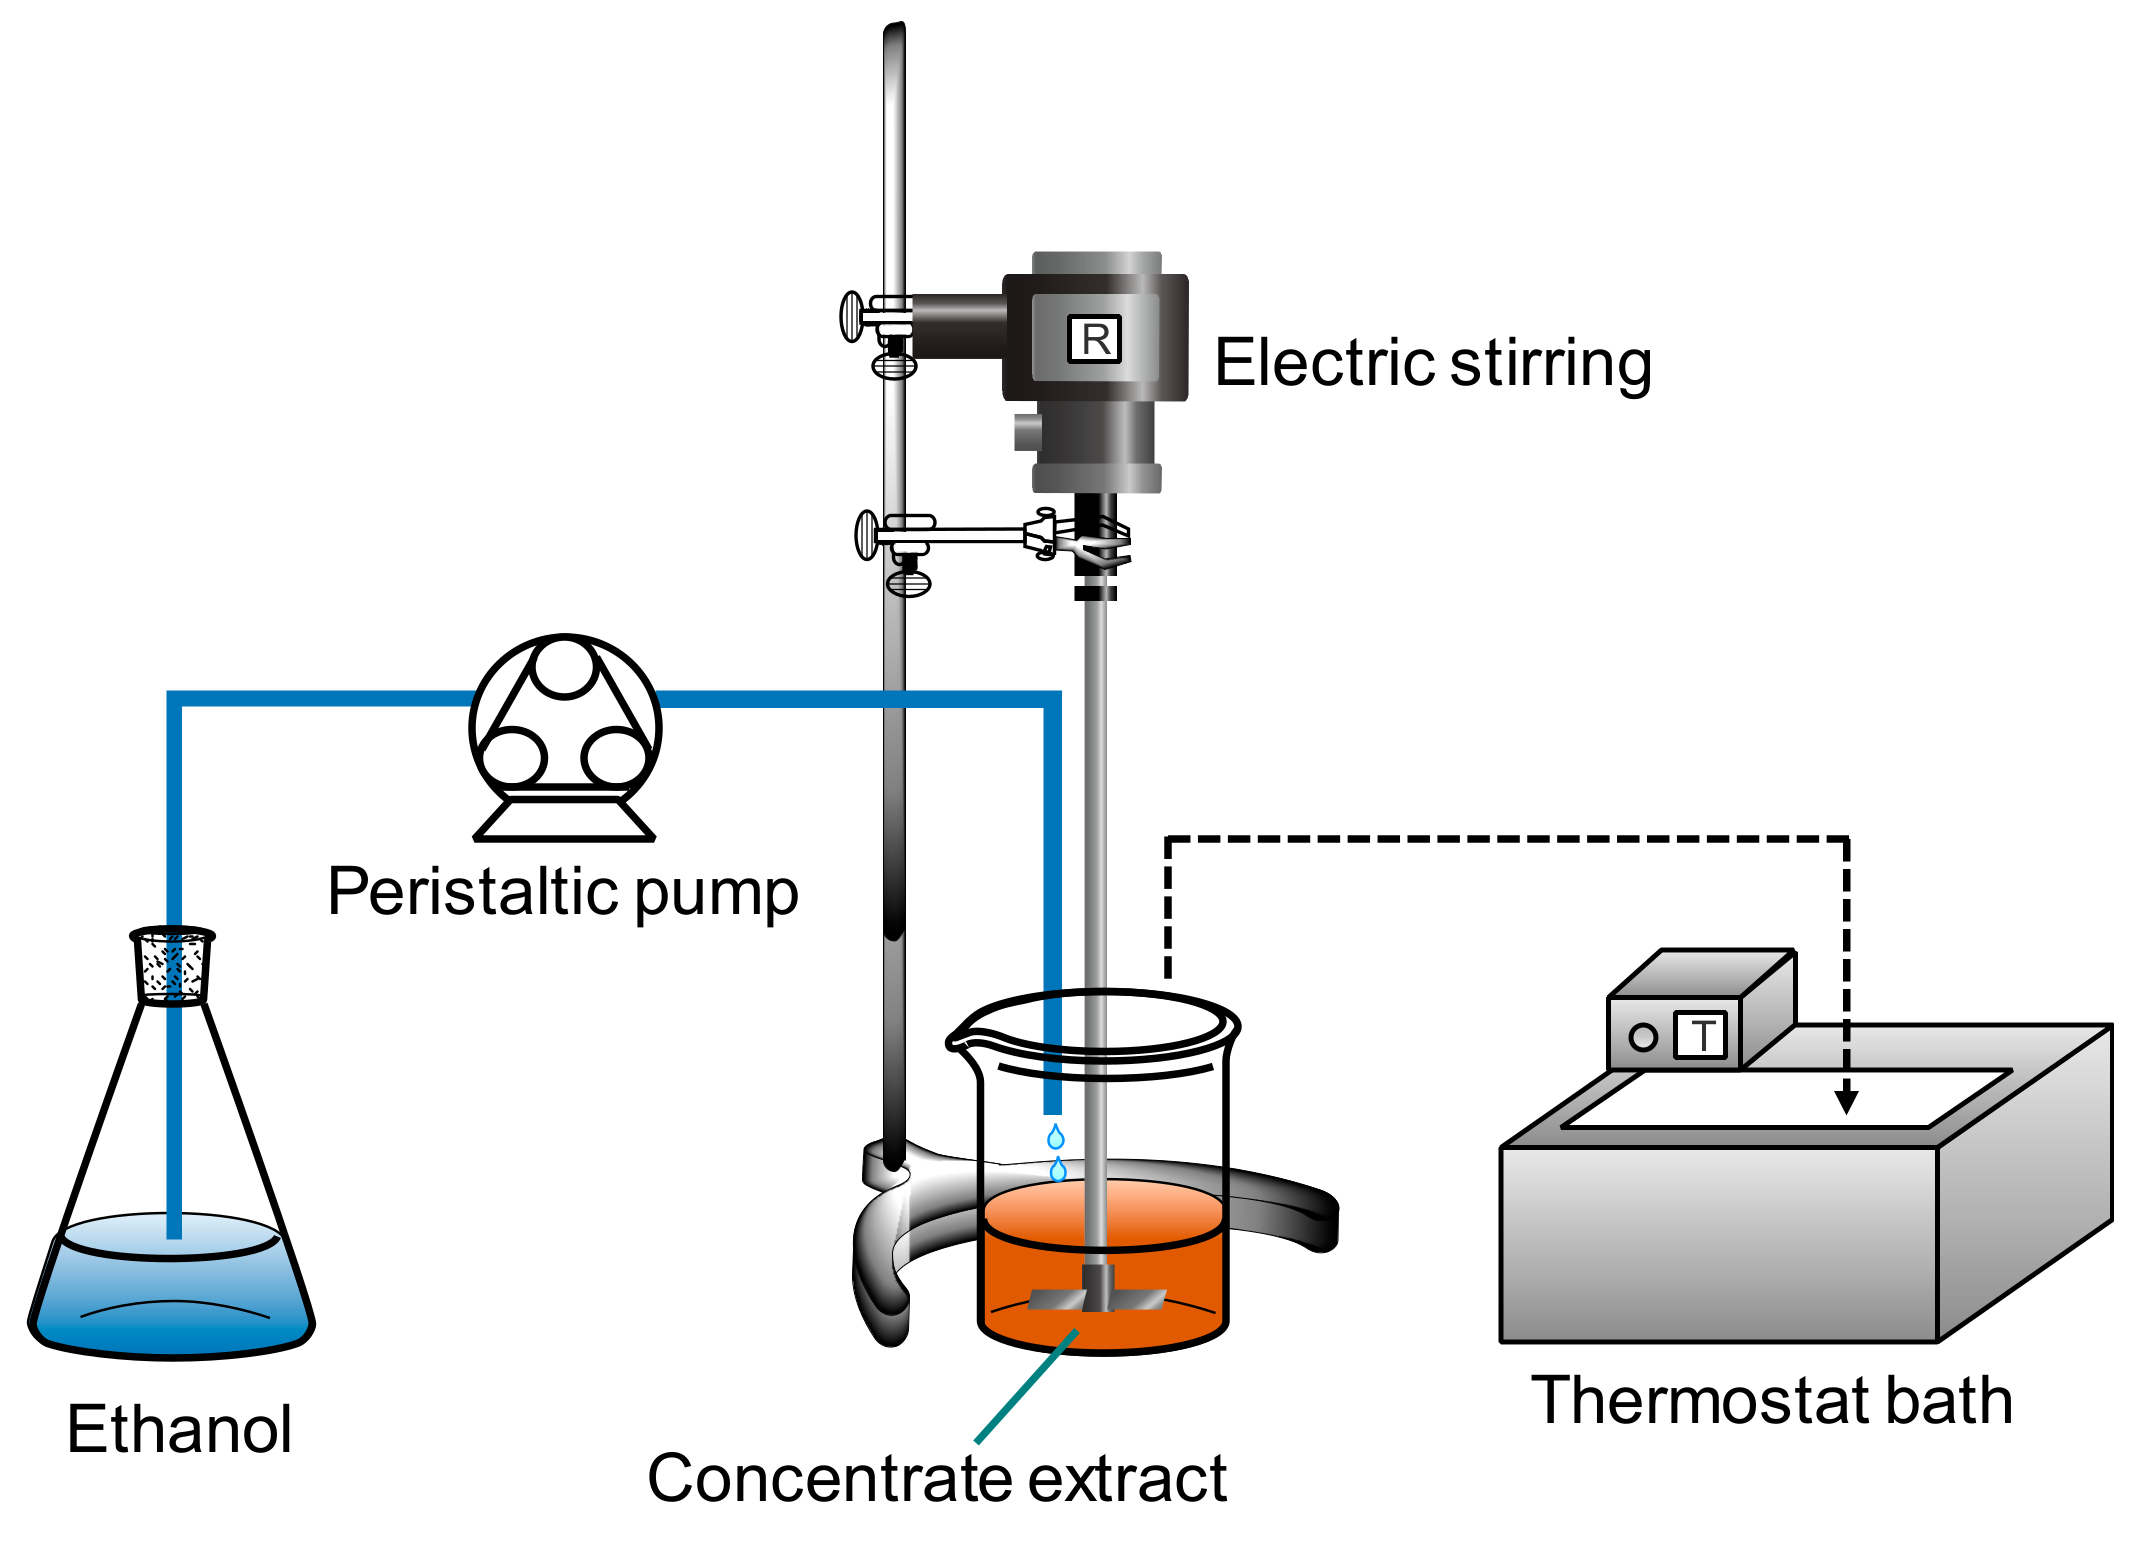
2.6. Calculation of the Design Space

The design space was calculated using the probability of reaching the standard method, which was based on an exhaustive search-Monte Carlo method (Figure 2). The detailed calculation procedure is described in Appendix A. The calculation steps of the density of the concentrated extract, ethanol concentration, ECR, stirring time after ethanol addition, and refrigeration temperature were 0.20, 0.20, 0.20, 0.16, and 0.20, respectively. The acceptable probability of the design space was set as 0.80, the simulation that was performed 5000 times to calculate reliable probability values. The simulation was based on the assumption that all experiment results were a sample of the normal population. All calculations were carried out using MATLAB (R2020a, Version 9.8, MathWorks Inc., Natick, MA, USA).

3. Results and Discussion

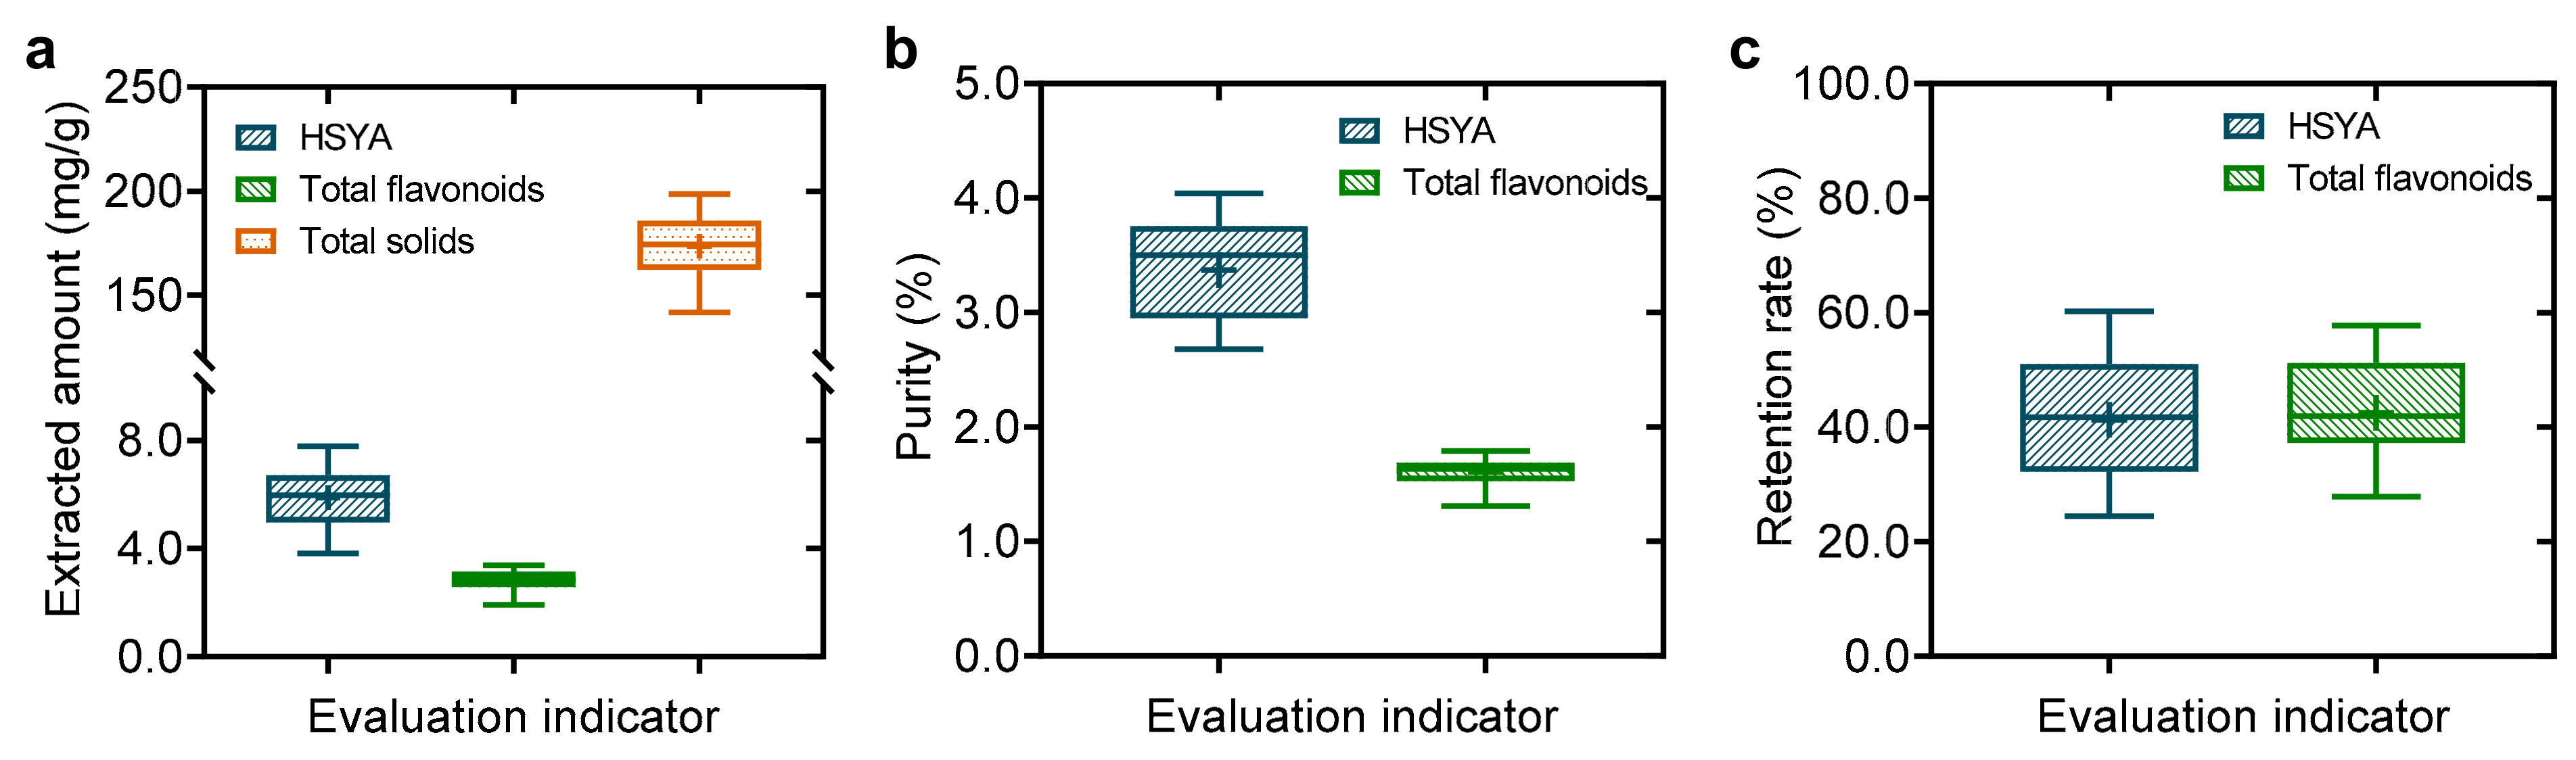
3.1. Experimental Results of the EPP

The relative standard deviation of evaluation indicators in the repeated experiment at the central point of the experimental design was less than 5.7%. The extracted amount of HSYA was 3.81–7.77 mg/g, that of total flavonoids was 1.92–3.38 mg/g, and that of total solids was 141.84–198.66 mg/g (Appendix B, Table A1 and Figure 3). The purity of HSYA in the supernatant was 2.68–4.04%, which was significantly improved compared with the 1.43–1.85% purity of the concentrated extract before ethanol precipitation. The purity of the total flavonoids in the supernatant was 1.31–1.79%, which was higher than the 0.65–0.83% total flavonoid purity before ethanol precipitation, showing that while removing impurities after ethanol precipitation, the effective components of the supernatant were enriched. In terms of ingredient retention, the retention rates of HSYA and total flavonoids were 24.5–60.3% and 27.9–57.8%, respectively, which were equivalent. After ethanol precipitation, the HSYA component was lost, possibly because HSYA solubility in the supernatant was small.

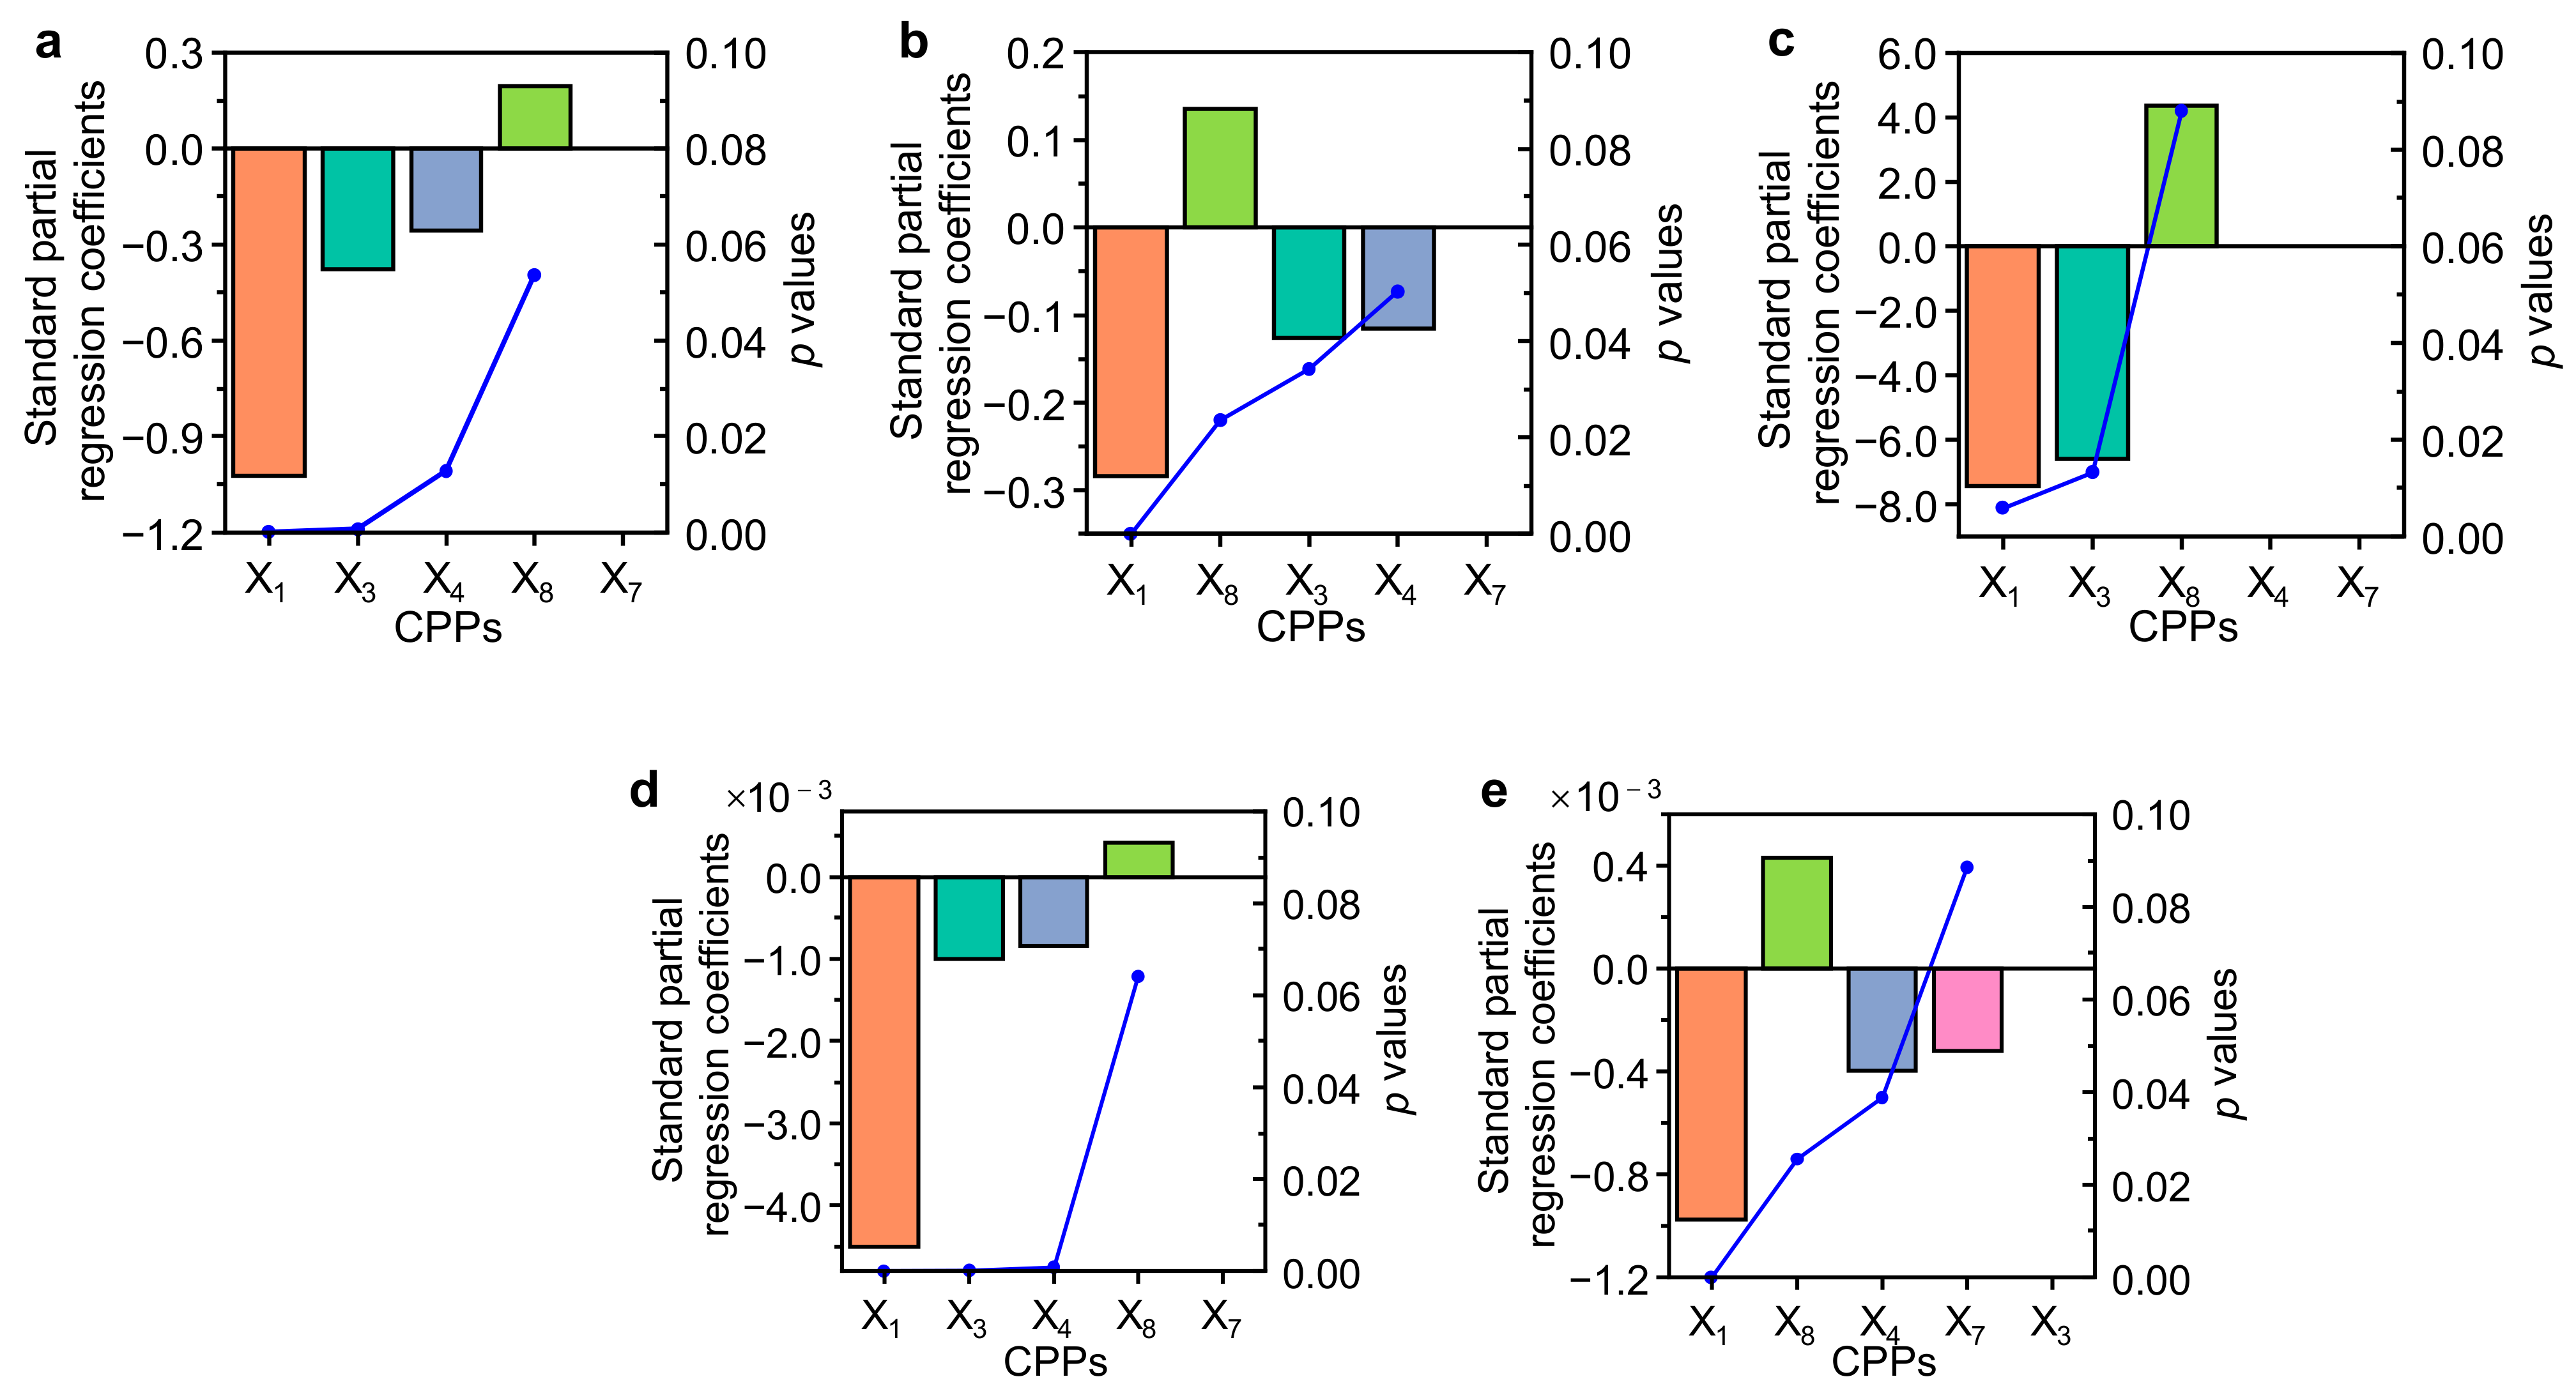
3.2. The Identification of CPPs

To comprehensively study the influence of process parameters on the evaluation indicators of the EPP, the CPPs were identified by establishing a multiple linear regression model conducted with Equation (5). The standard partial regression coefficients and p values of the multiple linear regression model are shown in Figure 4. Refrigeration temperature is a noise parameter and a CPP, which affects the evaluation indicators of ethanol precipitation and has a positive relationship; that is, as the refrigeration temperature increases, the index value of each evaluation indicator increases. Conversely, the evaluation indicators decreased with the increase in ECR and the concentrated extract density. The HSYA extraction amount, total flavonoids extraction amount, total solids extraction amount, HSYA purity decreased with increasing ethanol concentration. Therefore, through multiple linear regression analysis, the density of the concentrated extract, ethanol concentration, ECR, stirring time after ethanol addition, and refrigeration temperature were the CPPs, and the temperature of the concentrated extract, stirring speed, time of ethanol addition, and refrigeration time after ethanol precipitation were less important process parameters.

3.3. Process Modeling of Ethanol Precipitation

The mathematical relationship among the CPPs and the evaluation indicators was built by the quadratic multiple regression analysis conducted with Equation (6). Before establishing mathematical models among CPPs and evaluation indicators, the purity of HSYA and total flavonoids was subjected to square root arcsine transformation. The significance level p value of all models was less than 0.0001 (Appendix B, Table A2), indicating that the models were significant. The coefficient of determination of each fitted model was greater than 0.81, which meant that most of the data variation could be explained by these models.
In the literature, commercial software such as MODDE [30], Minitab [31], and Design Expert [32] was used to calculate the design space. In this work, self-programming was used to calculate the effects of noise parameters on building the design space. The exhaustive search-Monte Carlo method was used to calculate the design space, which required a lot of computation. To improve the convenience of data calculation, software that can consider noise parameters should be developed for calculating design space in the future. The mathematical models among the CPPs and evaluation indicators were established with the quadratic models. However, the determination coefficients of some models were not large enough: for example, less than 0.90. Recently, some machine learning models such as convolution neural networks were used in the research of TCMs [33,34]. These models can also be considered for the optimization of pharmaceutical process parameters.
Based on the regression model, the influence of CPPs on evaluation indicators was evaluated. The relationship among independent variables and dependent variables was expressed by contour plots. In addition to the two parameters examined in each 2-D contour map, the other parameter levels were fixed as the center point level. Reducing the ethanol concentration, reducing ECR, and allowing the solution to stand at a higher temperature helped increase the extracted amount of HSYA in the supernatant (Figure 5). The lower the concentration of ethanol, the smaller the ECR and the higher the total flavonoid content in the supernatant (Figure 6). Increasing the ethanol concentration and lowering the refrigeration temperature was beneficial to the precipitation of solid impurities (Figure 7). As the density of the concentrated extract increased, and the refrigeration temperature decreased, the purity of HSYA decreased (Figure 8). The higher the density of the concentrated extract, the lower the total flavonoid purity in the supernatant (Figure 9).

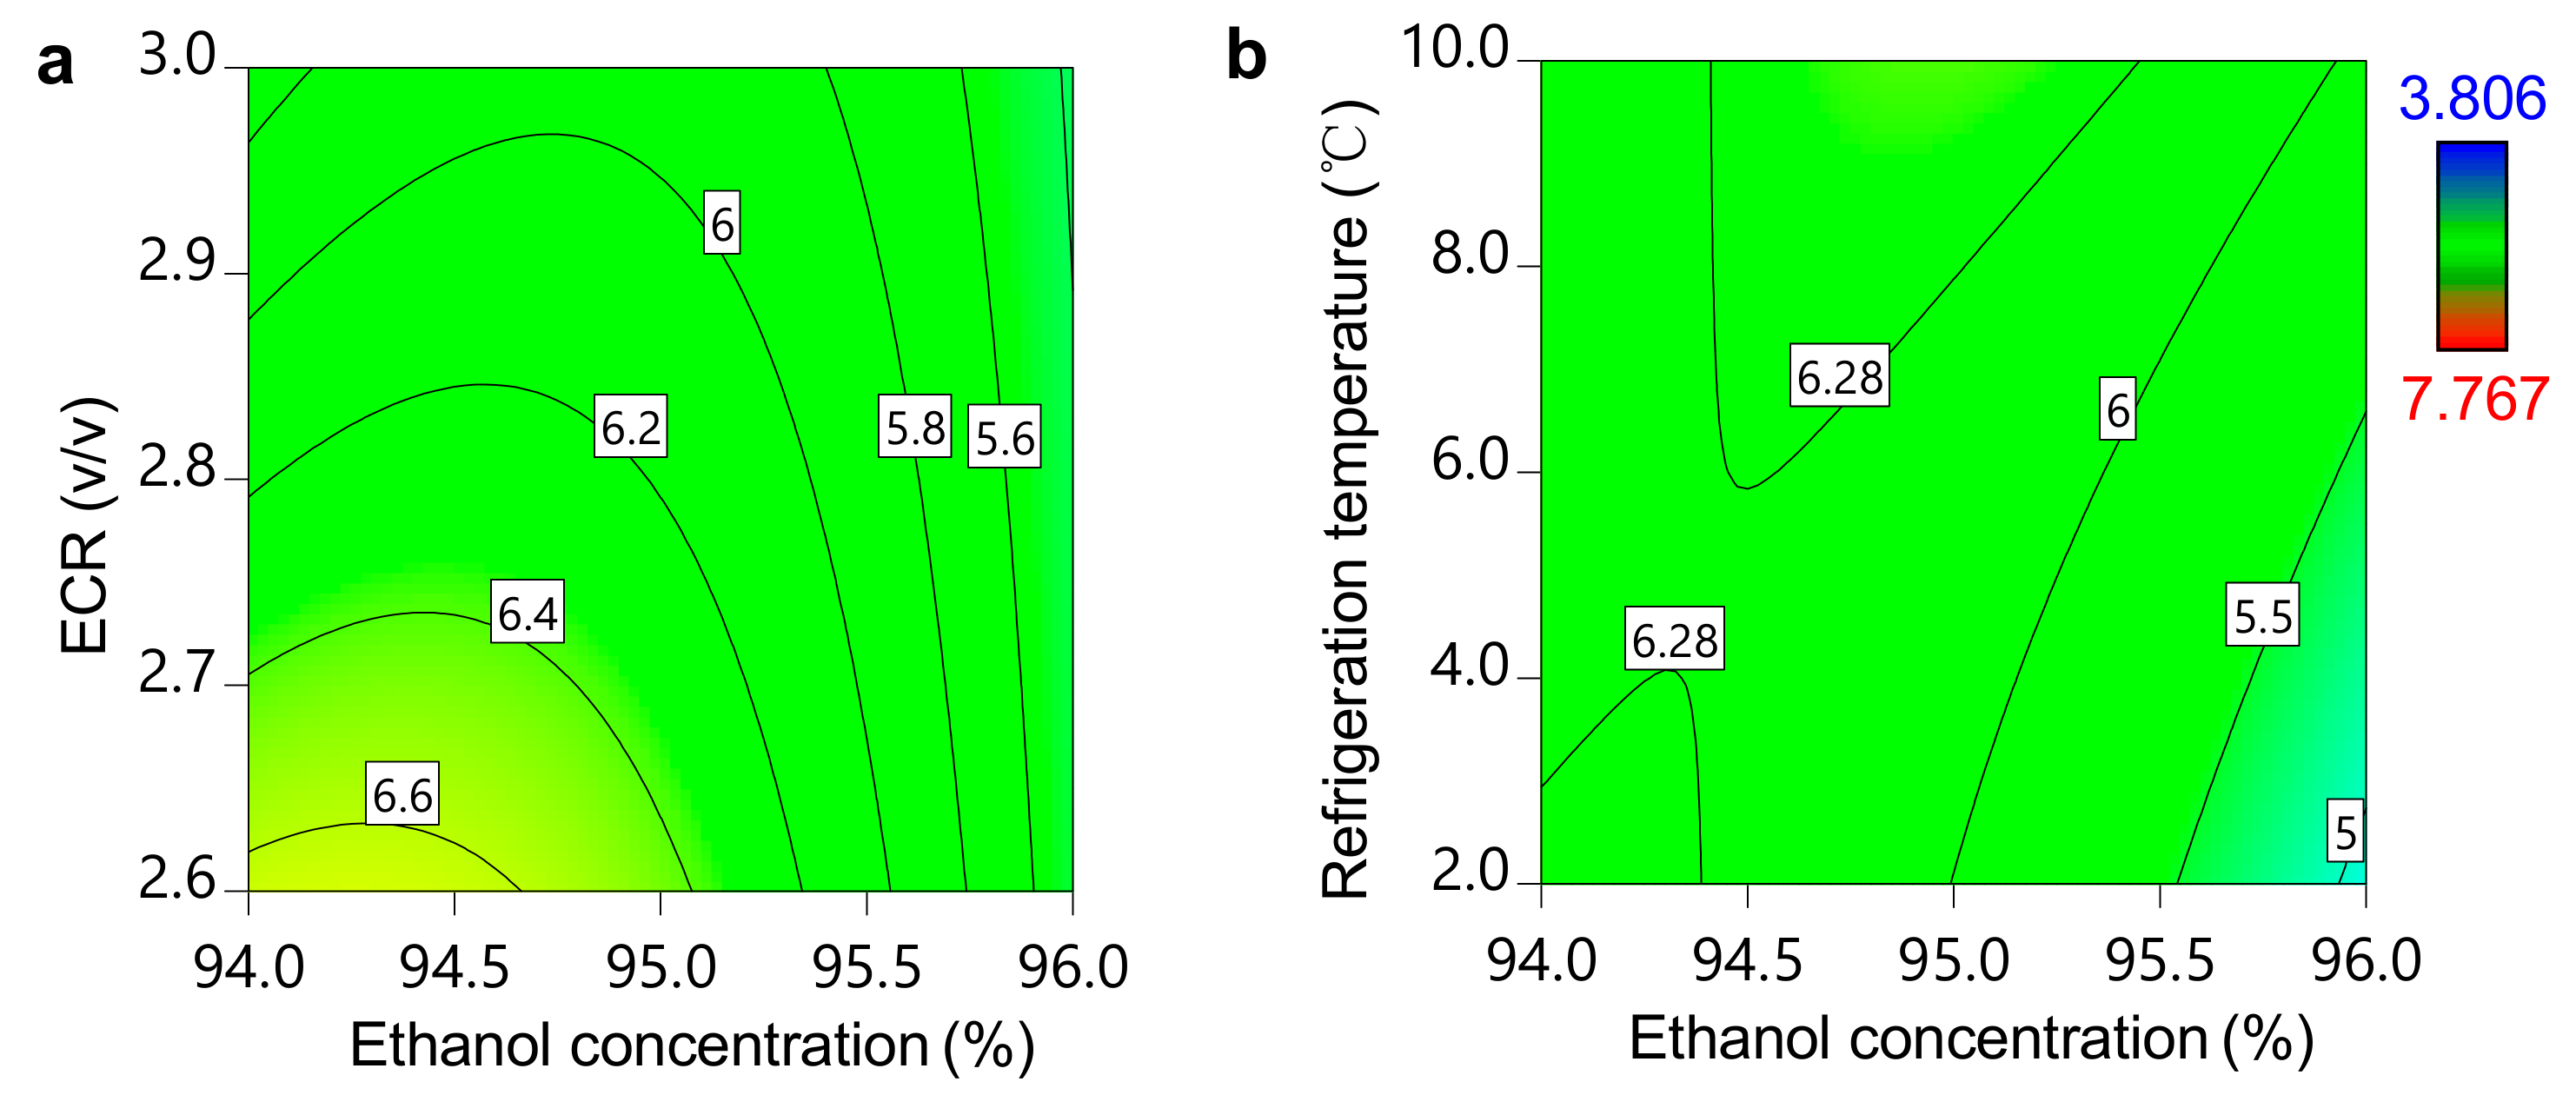
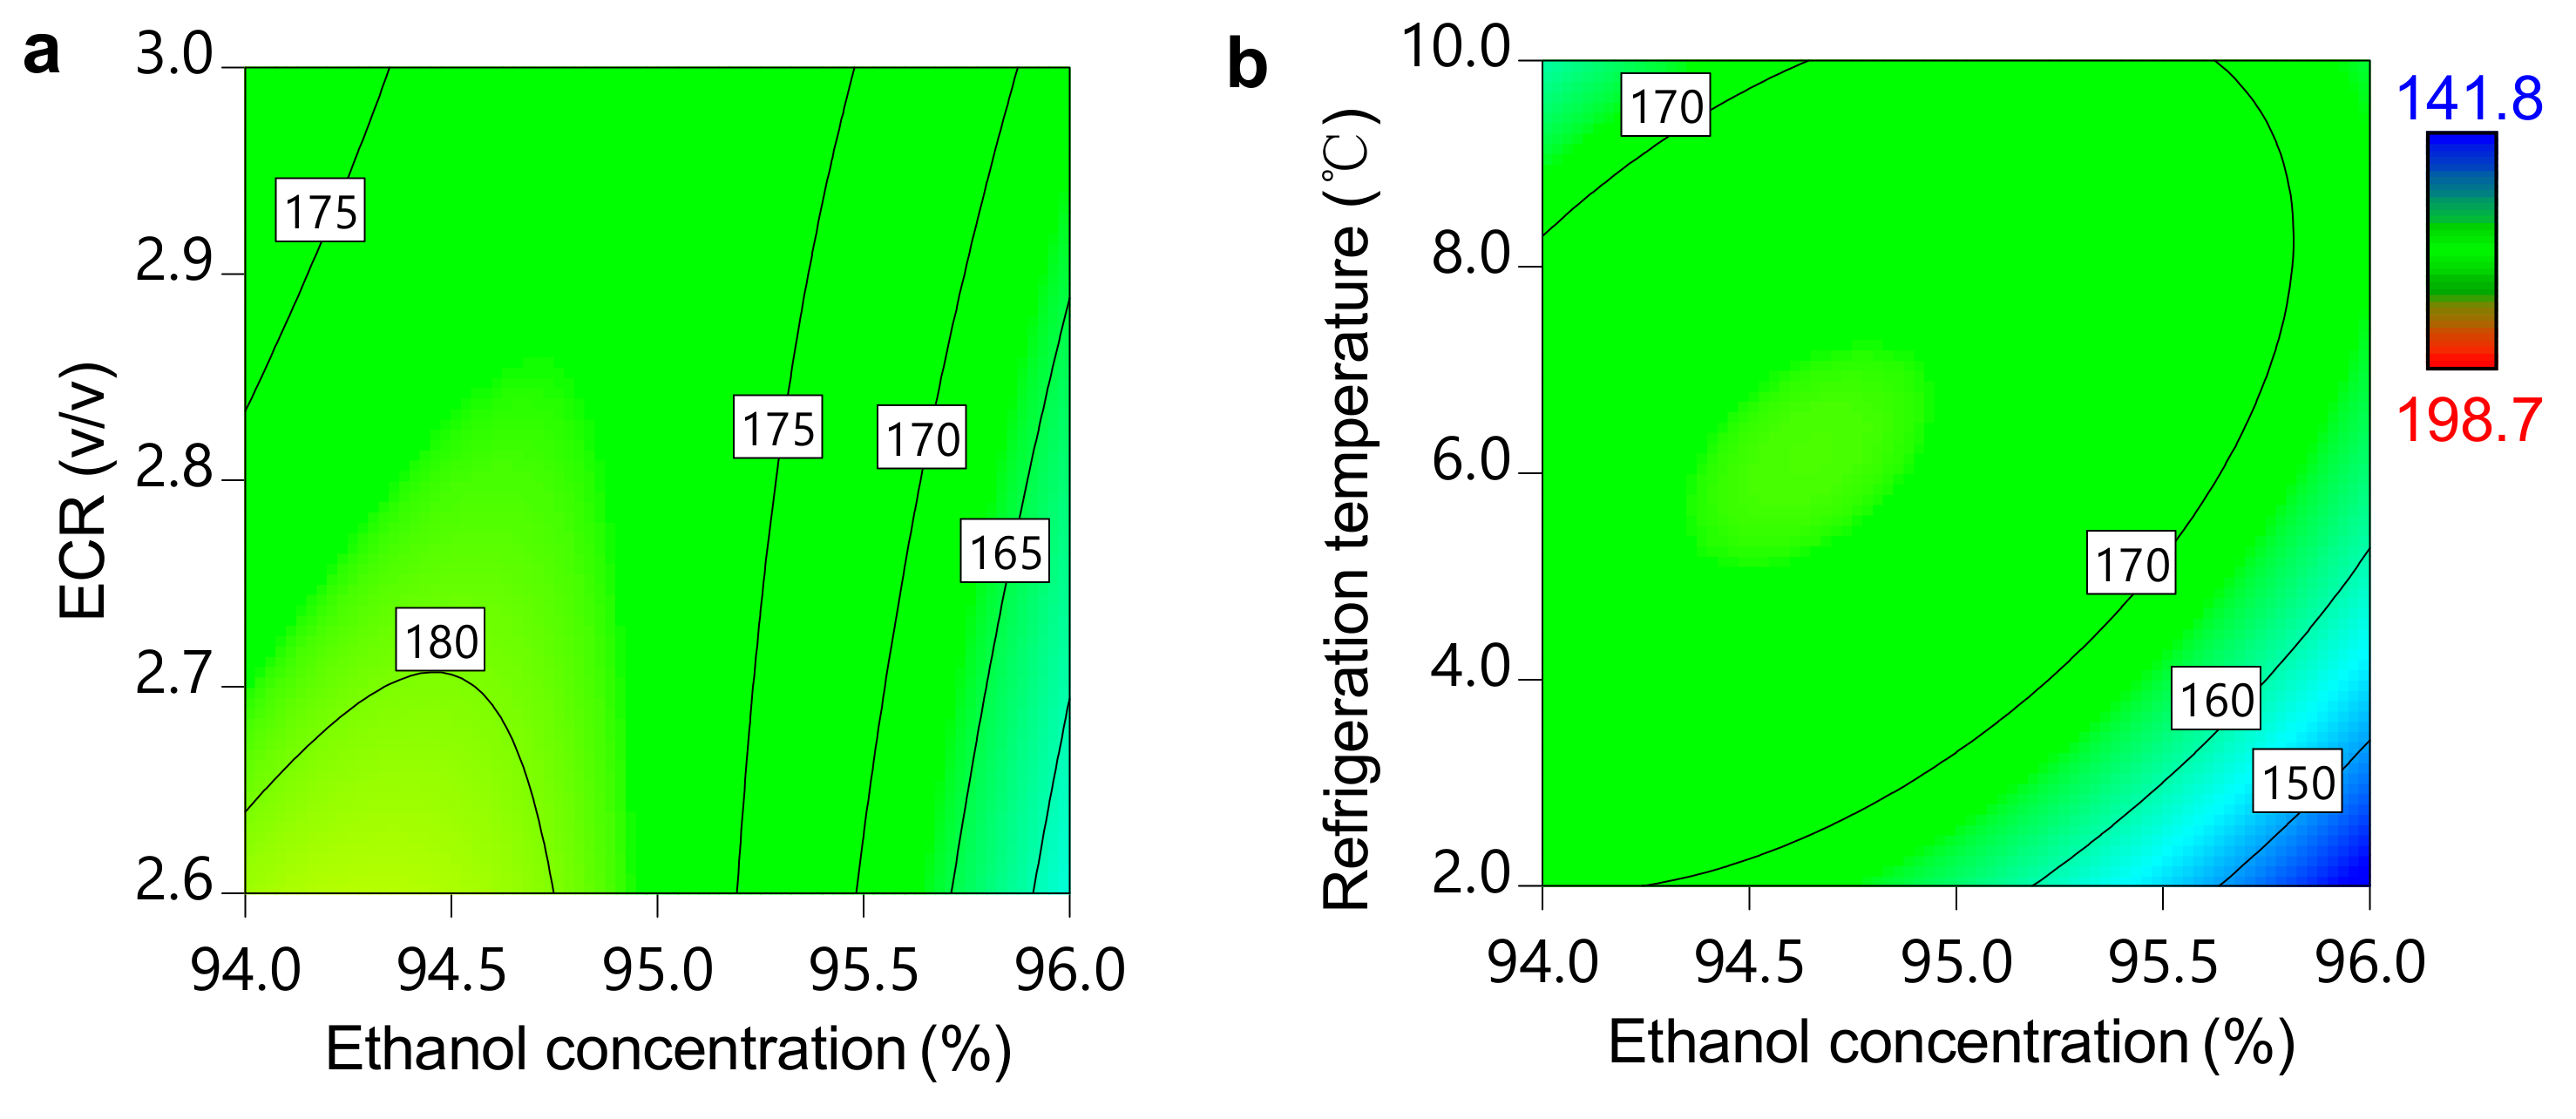
3.4. Design Space Development and Verification

The extracted amount of total solids in the supernatant could reflect the impurity removal effect of the EPP, so the upper limit of the extracted amount of total solids was set at 185 mg/g. HSYA and total flavonoids were the effective ingredients of Carthami Flos, and their extracted amounts and purities were set at lower limits. Therefore, the lower limits of the extracted amounts of HSYA and total flavonoids were 5.0 mg/g and 2.3 mg/g, respectively, and the lower limits of the purity of HSYA and total flavonoids were 2.8% and 1.4%, respectively. According to the design space calculation method, based on the probability of reaching the standard proposed in this work, the parameter combination with a probability of reaching the standard exceeding 80% belonged to the design space (Figure 10). The easily controllable CPP combinations and the probability of reaching the standard in the design space were obtained.
Refrigeration temperature was regarded as a noise parameter in this work. To study the influence of other parameters on ethanol precipitation indicators within the range of noise parameter fluctuation (2–10 °C), one point inside and one point outside the design space were selected for the verification of the design space. Three experiments with different refrigeration temperatures were performed for each verification point. If the ethanol precipitation indicators still came up to the standard in the design space, it could indicate that the calculated design space could reduce the influence of noise parameter fluctuation on the quality of ethanol precipitation supernatant. The calculation formula of the average relative deviation (ARD) value is as follows:
ARD = EV PV EV × 100 %
where EV and PV refer to the experimental value and the predicted value, respectively. The experimental value and the predicted value were basically in agreement (Table 2 and Table 3), indicating that the predictive performance of the models was good. Carrying out Carthami Flos ethanol precipitation in the design space could make the evaluation indicators meet the limit regulations. At the verification point outside the design space, the extracted amount of the total solid content obtained from experiment V6 did not reach 185 mg/g. The above results showed that the operation in the design space could ensure a better process quality of ethanol precipitation.
The operation space for the production process was also calculated, and the optimized ranges of CPPs were as follows: The density of the concentrated extract was 1.20–1.26 g/cm3, ethanol concentration was 94.6–95.8%, ECR was controlled at 2.64–2.84 v/v, and stirring time after ethanol addition was 60–120 min. The refrigeration temperature was used as a noise parameter, and its allowable range was from 2–10 °C. The allowable range of other process parameters was the entire experimental research range; that is, the temperature of the concentrated extract was 20–30 °C, stirring speed was 120–160 rpm, time of ethanol addition was 80–100 min, and refrigeration time was 24–48 h.

3.5. Continuous Improvement Strategy

ICH Q8 (R2) [15] encourages continuous improvement of the drug production process and continuous improvement of process performance and product quality. In this work, with the collection of production data, the mathematical model and design space were updated, making the design space more reliable. In this work, the models were rebuilt by combining the 6 sets of data from the previous verification experiment with the 28 sets of data in a definitive screening design. As for the experimental point N, the CPP conditions were X1 = 1.23 g/cm3, X3 = 94.0%, X4 = 2.6 v/v, X7 = 60 min, and X8 = 10.0 °C. The calculated probability of reaching the standard was 77.0%, which was lower than the design space threshold of 80%. After rebuilding the models, it was found that the probability of reaching test point N was 85.7%, which exceeded 80%. The regression coefficients and variance analysis of the regression model after continuous improvement are shown in Table 4. Next, a set of validation tests was performed (Table 5), and all of the evaluation indicators complied with the limits. This finding showed that the recalculated probability value was more reliable after obtaining new data. Therefore, we reupdated the combination of easily controllable parameters in the design space, the easily controllable parameters can be listed in Supplementary Materials Table S1. Compared with the design space before continuous improvement, more easily controllable parameter combinations were obtained. It is thus recommended to continuously collect new process data during daily production, continuously improve the model based on the data, and regularly update and maintain the design space to improve its reliability.

4. Conclusions

In this work, a design space calculation method in the presence of noise parameters was proposed and the models and design space were updated based on new data. Optimization of the Carthami Flos EPP was studied based on the QbD concept. The extracted amount of HSYA, extracted amount of total flavonoids, extracted amount of total solids, purity of HSYA, and the purity of total flavonoids were regarded as evaluation indicators. The density of the concentrated extract, ethanol concentration, ECR, stirring time after ethanol addition, and refrigeration temperature were identified as CPPs, using a definitive screening design. Quantitative models among the CPPs and evaluation indicators were developed, and the determination coefficients were higher than 0.81. Decreasing the density of the concentrated extract and ethanol concentration could increase the extraction amount of total flavonoids and total solids and the purity of HSYA. Next, the refrigeration temperature was considered as the noise parameter because it was easily affected by the seasons, a design space considering a noise parameter was calculated and verified, and a combination of easily controllable CPPs in the design space was obtained. The calculated operation space of the EPP was as follows: The density of the concentrated extract was 1.20–1.26 g/cm3, the temperature of the concentrated extract was 20–30 °C, ethanol concentration was 94.6–95.8%, ECR was controlled at 2.64–2.84 v/v, stirring speed was 120–160 rpm, time of ethanol addition was 80–100 min, stirring time after ethanol addition was 60–120 min, the allowable ranges of refrigeration temperature were from 2 to 10 °C, and refrigeration time was 24–48 h. In this operating space, the quality of the supernatant could be guaranteed. According to the data from the new batches from the verification experiment, the models and design space were updated, the calculated probabilities of the model built with more data were more accurate and robust, and the design space was more reliable. The methods provided in this work can similarly be used for the continuous improvement of industrial production.

Supplementary Materials

The following are available online at https://0-www-mdpi-com.brum.beds.ac.uk/article/10.3390/separations8060074/s1, Table S1: The combination of easily controllable parameters in the design space and their calculated probability after continuous improvement.

Author Contributions

Conceptualization, X.G.; methodology, X.G. and Y.T.; software, Y.T.; data curation, X.G.; writing—original draft preparation, Y.T.; writing—review and editing, X.G. and Y.T.; supervision, X.G. and H.Q.; funding acquisition, X.G. and H.Q. All authors have read and agreed to the published version of the manuscript.

Funding

This research was funded by the National S&T Major Project of China (2018ZX09201011-002), the Basic Public Welfare Research Program of Zhejiang Province (LGG18H280001), and the National Project for Standardization of Chinese Materia Medica (ZYBZH-C-GD-04).

Data Availability Statement

All data generated or analyzed during this study are included in this published article and its supplementary materials.

Conflicts of Interest

The authors declare no conflict of interest.

Abbreviations

QbD: Quality by Design; CPPs: critical process parameters; TCM: traditional Chinese medicine; EPP: ethanol precipitation process; QTPP: quality target product profile; CQAs: critical quality attributes; CMAs: critical material attributes; HSYA: hydroxysafflor yellow A; ECR: volume ratio of ethanol and concentrate.

Appendix A

The first step was to calculate and determine the relative standard deviation (RSD) of each process evaluation indicator obtained from repeated experiments. These values were recorded as RSD 1 ,   RSD 2 ,   ,   RSD n ,   ,   RSD N , ..., where N in RSD N was the number of process evaluation indicators, n = 1, …, N.
The second step was to determine the overall distribution parameters corresponding to each process evaluation indicator in each experiment. Assuming that the experimental values of all process evaluation indicators were a sample from the normal distribution population A, the average value of the normal distribution population A was the experimentally determined value DR n , j of the process evaluation indicators, where j = 1, …, J, and J were the total number of experiments. A normally distributed population A was assumed to be a variance ( DR n , j   ×   RSD n ) 2 and then, the overall distribution parameters corresponding to each process evaluation indicator could be determined.
The third step was to generate random values for each process evaluation indicator. According to the parameters of the normal distribution A, the random value DM n , j , k of each evaluation indicator was generated by random simulation, where k = 1, …, K, and K were the random simulation times. Each process evaluation indicator in all experiments simulated the generation of K random values and generated a total of N   ×   J   ×   K random values.
The fourth step was to establish mathematical models. When each process evaluation indicator in all experiments generates one random value, N models can be established. When there were K random simulations, a total of N   ×   K models were established.
The fifth step was to predict the results using the obtained models. Exhaustive research was used to predict the results of the evaluation indicators. Discrete values within the research range of process parameters were taken, and the number of discrete values was determined by the calculation steps. Assuming that there were 3 process parameters in total and that discrete values of P, Q, and R were taken, there were P   ×   Q   ×   R process parameter combinations after pairwise matching. A specific combination of process parameters was ( p ,   q ,   r ), where p = 1, …, P; q = 1, …, Q; r = 1, …, R. Substituting each specific combination ( p ,   q ,   r ) into N   ×   K models for calculation, a total of N   ×   K prediction results for N process evaluation indicators were obtained.
The sixth step was to count the probability value. For a certain combination of process parameters ( p ,   q ,   r ), when substituting the N models obtained from the kth random simulation, the predicted values of all N process evaluation indicators might meet the limits of all process evaluation indicators, and they might be partially compliant, or not at all. Counting the number of times m that the combination ( p ,   q ,   r ) can meet the limit of all process evaluation indicators in all K random simulations, m     K must hold. The probability Prob p , q , r = m/K of reaching the standard corresponding to the combination ( p ,   q ,   r ) was calculated, and the value of Prob was in the interval [0, 1].
The seventh step was to count the parameter combinations that met the probability of reaching the standard. The threshold T of the probability of reaching the standard was set and generally, T     0 . 80 . If Prob p , q , r     T , then the combination of the process parameters ( p ,   q ,   r ) was the parameter combination that met the probability of reaching the standard. All the process parameter combinations that satisfied Prob p , q , r     T were counted, and the parameter combination that met the probability of reaching the standard was obtained.
The eighth step was to count the easily controllable CPP combinations that met the probability of reaching the standard within the variation range of the noise parameter and to calculate the design space. If there were 3 easily controllable CPPs, the combination was ( x ,   y ,   z ) . From the parameter combinations that met the probability of reaching the standard, it was calculated that the easily controllable CPP combinations satisfied the parameter combination of x = x ,   y = y ,   z = z within the variation range of the noise parameter. Then, the easily controllable CPP combinations within the variation range of the noise parameter were obtained, and the design space was calculated.

Appendix B

Figure A1. Typical HPLC chromatogram of the reference standard and the Carthami Flos sample. (a) HPLC chromatogram of the HSYA. (b) HPLC chromatogram of the ethanol precipitation supernatant. (c) HPLC chromatogram of the concentrated extract.
Separations 08 00074 g0a1
Table A1. The results of the definitive screening design.
No.Process ParametersExtracted Amount (mg/g)Purity (%)Retention Rate (%)
X1X2X3X4X5X6X7X8X9HSYATotal FlavonoidsTotal SolidsHSYATotal FlavonoidsTotal SolidsHSYA
11.2330963.016010012010.0485.692.85171.423.321.6641.1542.18
21.2320942.612080602.0246.553.00178.393.671.6844.4341.70
31.2825962.61601001202.0243.811.92141.842.681.3524.7627.88
41.1825943.0120806010.0486.773.09184.243.671.6852.4452.76
51.2820953.012010012010.0245.122.64177.522.881.4833.4038.33
61.1830952.616080602.0487.483.35187.383.991.7954.4953.73
71.2830942.81608012010.0485.322.54173.663.061.4632.7934.96
81.1820962.8120100602.0245.752.69155.683.691.7343.6945.00
91.2820962.61401006010.0484.852.64160.593.021.6430.5837.05
101.1830943.0140801202.0247.153.08189.333.781.6355.4352.47
111.2820943.0120901202.0484.872.24169.112.881.3332.1032.99
121.1830962.6160906010.0247.113.16188.083.781.6854.7753.56
131.2820942.6160809010.0245.172.68164.543.141.6332.6337.75
141.1830963.0120100902.0485.842.49164.973.541.5143.0640.46
151.2830942.6120100606.0485.983.17198.663.011.6037.1743.96
161.1820963.0160801206.0246.543.05180.193.631.6948.3449.57
171.2830962.6120801202.0363.982.10147.892.691.4224.4728.81
181.1820943.01601006010.0366.122.64160.553.811.6546.0443.74
191.2830963.0120806010.0244.922.78175.382.801.5930.3338.24
201.1820942.61601001202.0487.573.27193.733.911.6955.7152.96
211.2820963.016080602.0484.001.96148.822.691.3126.1428.48
221.1830942.612010012010.0247.773.38192.254.041.7660.2557.75
231.2830943.0160100602.0244.722.55161.212.931.5829.7135.83
241.1820962.61208012010.0487.163.25186.243.851.7451.9751.84
251.2325952.814090906.0365.952.83176.003.381.6140.9940.01
261.2325952.814090906.0366.443.17183.623.511.7346.2846.69
271.2325952.814090906.0366.072.82173.673.501.6242.1640.09
281.2325952.814090906.0366.083.05173.483.501.7641.3742.59
Table A2. Regression coefficients and variance analysis of the quadratic multiple regression model.
ParametersHSYA Extracted AmountTotal Flavonoids Extracted AmountTotal Solids Extracted AmountArcSin (Sqrt (HSYA Purity))ArcSin (Sqrt (Total Flavonoids Purity))
Coefficientsp ValueCoefficientsp ValueCoefficientsp ValueCoefficientsp ValueCoefficientsp Value
Constant6.189-2.985-177.6-0.1879-0.1298-
X1−1.0238<0.0001−0.2838<0.0001−7.42830.0002−0.0126<0.0001−0.0039<0.0001
X3−0.3784<0.0001−0.12610.0016−6.57120.0006−0.0028<0.0001--
X4−0.2576<0.0001−0.11570.0033--−0.0022<0.0001−0.00160.0128
X7--------−0.00130.0346
X80.19420.00140.13580.00084.36870.01290.00130.00170.00180.0058
X1X4------0.00100.0120
X1X7--------−0.00120.0572
X1X8------0.00140.00100.00120.0599
X3X40.20680.00130.09150.02355.15390.0091----
X3X80.3248<0.00010.17470.00018.7882<0.0001----
X4X8------−0.00090.0354--
X12----13.20920.0128−0.0046<0.0001−0.00360.0098
X32−0.38710.0027--−8.27730.0915----
X82--−0.23480.0060−10.09610.0409----
Model p value<0.0001<0.0001<0.0001<0.0001<0.0001
R20.96370.88030.81650.98740.8102
R2 represents the coefficient of determination, ArcSin (Sqrt (HSYA Purity)) represents the purity of HSYA and was subjected to square root arcsine transformation. ArcSin (Sqrt (Total Flavonoids Purity)) represents the purity of total flavonoids and was subjected to square root arcsine transformation.

References

  1. State Pharmacopoeia Commission. Pharmacopoeia of the People’s Republic of China; China Medical Science and Technology Press: Beijing, China, 2020; Volume 1. [Google Scholar]
  2. Tai, Y.; Shen, J.; Luo, Y.; Qu, H.; Gong, X. Research progress on the ethanol precipitation process of traditional Chinese medicine. Chin. Med. 2020, 15, 84. [Google Scholar] [CrossRef]
  3. Zhang, L.; Gong, X.; Qu, H. Optimizing the alcohol precipitation of Danshen by response surface methodology. Sep. Purif. Technol. 2013, 48, 977–983. [Google Scholar] [CrossRef]
  4. Zhang, L.; Yan, B.; Gong, X.; Yu, L.; Qu, H. Application of quality by design to the process development of botanical drug products: A case study. AAPS PharmSciTech 2013, 14, 277–286. [Google Scholar] [CrossRef] [PubMed] [Green Version]
  5. Gong, X.; Yan, A.; Qu, H. Optimization for the ethanol precipitation process of botanical injection: Indicator selection and factor influences. Sep. Purif. Technol. 2014, 49, 619–626. [Google Scholar] [CrossRef]
  6. Sun, M.; Yang, J.; Cao, W.; Shao, J.; Wang, G.; Qu, H.; Huang, W.; Gong, X. Critical process parameter identification of manufacturing processes of Astragali Radix extract with a weighted determination coefficient method. Chin. Herb. Med. 2020, 12, 125–132. [Google Scholar] [CrossRef]
  7. Luo, Y.; Li, W.; Huang, W.; Liu, X.; Song, Y.; Qu, H. Rapid quantification of multi-components in alcohol precipitation liquid of Codonopsis Radix using near infrared spectroscopy (NIRS). J. Zhejiang Univ. SC B 2017, 18, 383–392. [Google Scholar] [CrossRef] [PubMed] [Green Version]
  8. Huang, H.; Qu, H. In-situ monitoring of saccharides removal of alcohol precipitation using near-infrared spectroscopy. J. Innov. Opt. Heal. Sci. 2018, 11, 1850027. [Google Scholar] [CrossRef] [Green Version]
  9. Ma, L.; Liu, D.; Du, C.; Lin, L.; Zhu, J.; Huang, X.; Liao, Y.; Wu, Z. Novel NIR modeling design and assignment in process quality control of Honeysuckle flower by QbD. Spectrochim. Acta A Mol. Biomol. Spectrosc. 2020, 242, 118740. [Google Scholar] [CrossRef]
  10. Pan, J.; Shao, J.; Qu, H.; Gong, X. Ethanol precipitation of Codonopsis Radix concentrate with a membrane dispersion micromixer. J. Clean Prod. 2020, 251, 119633. [Google Scholar] [CrossRef]
  11. Pan, J.; Tai, Y.; Qu, H.; Gong, X. Optimization of membrane dispersion ethanol precipitation process with a set of temperature control improved equipment. Sci. Rep. 2020, 10, 19010. [Google Scholar] [CrossRef]
  12. Shao, F.; Yu, M.; Jiang, M.; Shang, Y.; Yang, M.; Liu, R. Effect of Stirring Speed on Fractal Dimension of Ethanol Precipitation of Astragalus Granules and Alcohol Precipitation Effect. J. Chin. Med. Mater. 2019, 42, 612–616. [Google Scholar]
  13. Meilin, J.; Zhang, X.; Shao, F.; Shang, Y.; Yang, M.; Liu, R.; Mei, H. Effect of ethanol to material ratio on ethanol precipitation and sediment morphology of Shuanghuanglian preparation. Chin. Tradit. Herb Drugs 2020, 51, 4954–4959. [Google Scholar]
  14. Pan, J.; He, S.; Zheng, J.; Shao, J.; Li, N.; Gong, Y.; Gong, X. The development of an herbal material quality control strategy considering the effects of manufacturing processes. Chin. Med. 2019, 14, 38. [Google Scholar] [CrossRef] [Green Version]
  15. ICH Guidelines. ICH Q8 (R2) International Conference on Harmonisation of Technical Requirements for Registration of Pharmaceuticals for Human Use. Available online: https://database.ich.org/sites/default/files/Q8_R2_Guideline.pdf (accessed on 24 March 2021).
  16. Watson, T.; Nosal, R.; Lepore, J.; Montgomery, F. Misunderstanding Design Space: A Robust Drug Product Control Strategy Is the Key to Quality Assurance. J. Pharm. Innov. 2018, 13, 283–285. [Google Scholar] [CrossRef]
  17. Hersleth, M.; Mevik, B.; Naes, T.; Guinard, J. Effect of contextual factors on liking for wine—Use of robust design methodology. Food Qual. Prefer. 2003, 14, 615–622. [Google Scholar] [CrossRef]
  18. Zhuang, J.; Liu, S.; Cai, H.; Dai, X.; Chen, Y.; Jin, Z.; Chen, B. Efficacy and safety of Guhong injection for treating coronary microvascular disease: Study protocol for a randomized controlled trial. Trials 2020, 21, 75. [Google Scholar]
  19. Sun, Z.; Jin, H.; Zhou, H.; Yu, L.; Wan, H.; He, Y. Guhong Injection promotes fracture healing by activating Wnt/beta-catenin signaling pathway in vivo and in vitro. Biomed. Pharmacother. 2019, 120, 109436. [Google Scholar] [CrossRef]
  20. Ai, J.; Wan, H.; Shu, M.; Zhou, H.; Zhao, T.; Fu, W.; He, Y. Guhong injection protects against focal cerebral ischemia–reperfusion injury via anti-inflammatory effects in rats. Arch. Pharm. Res. 2017, 40, 610–622. [Google Scholar] [CrossRef]
  21. Yang, X.; Li, Y.; Chen, L.; Xu, M.; Wu, J.; Zhang, P.; Nel, D.; Sun, B. Protective effect of hydroxysafflor yellow A on dopaminergic neurons against 6-hydroxydopamine, activating anti-apoptotic and anti-neuroinflammatory pathways. Pharm. Biol. 2020, 58, 686–694. [Google Scholar] [CrossRef]
  22. Bai, X.; Wang, W.; Fu, R.; Yue, S.; Gao, H.; Chen, Y.; Tang, Y. Therapeutic Potential of Hydroxysafflor Yellow A on Cardio-Cerebrovascular Diseases. Front. Pharmacol. 2020, 11, 01265. [Google Scholar] [CrossRef]
  23. Han, D.; Wei, J.; Zhang, R.; Ma, W.; Shen, C.; Feng, Y.; Xia, N.; Xu, D.; Cai, D.; Li, Y.; et al. Hydroxysafflor yellow A alleviates myocardial ischemia/reperfusion in hyperlipidemic animals through the suppression of TLR4 signaling. Sci. Rep. 2016, 6, 35319. [Google Scholar] [CrossRef] [PubMed]
  24. Meng, Y.; Du, Z.; Li, Y.; Gao, P.; Song, J.; Lu, Y.; Tu, P.; Jiang, Y.; Guo, X. The synergistic mechanism of total saponins and flavonoids in Notoginseng-Safflower pair against myocardial ischemia uncovered by an integrated metabolomics strategy. Biomed. Pharmacother. 2020, 130, 110574. [Google Scholar] [CrossRef] [PubMed]
  25. Gong, X.; Wang, S.; Li, Y.; Qu, H. Separation characteristics of ethanol precipitation for the purification of the water extract of medicinal plants. Sep. Purif. Technol. 2013, 107, 273–280. [Google Scholar] [CrossRef]
  26. Gong, X.; Chen, H.; Chen, T.; Qu, H. Unit operation optimization for the manufacturing of botanical injections using a design space approach: A case study of water precipitation. PLoS ONE 2014, 9, e104493. [Google Scholar] [CrossRef] [PubMed] [Green Version]
  27. Zhao, J.; Li, W.; Qu, H.; Tian, G.; Wei, Y. Application of definitive screening design to quantify the effects of process parameters on key granule characteristics and optimize operating parameters in pulsed-spray fluid-bed granulation. Particuology 2019, 43, 56–65. [Google Scholar] [CrossRef]
  28. WS-10001-(HD-1506)-2004-2012; Guhong Injection; National Food and Drug Administration National Drug Standards: Shanxi, China, 2012.
  29. Gong, X.; Li, Y.; Chen, H.; Qu, H. Design Space Development for the Extraction Process of Danhong Injection Using a Monte Carlo Simulation Method. PLoS ONE 2015, 10, e0128236. [Google Scholar] [CrossRef] [Green Version]
  30. Dahmash, E.Z.; Al-Khattawi, A.; Iyire, A.; Al-Yami, H.; Dennison, T.J.; Mohammed, A.R. Quality by Design (QbD) based process optimisation to develop functionalised particles with modified release properties using novel dry particle coating technique. PLoS ONE 2018, 13, e0206651. [Google Scholar] [CrossRef] [Green Version]
  31. Lee, J.; Kim, J.-E. Application of Open Source Based DoE R Program for the Development of QbD. Yakhak Hoeji 2019, 63, 274–281. [Google Scholar] [CrossRef]
  32. Shao, J.; Cao, W.; Qu, H.; Pan, J.; Gong, X. A novel quality by design approach for developing an HPLC method to analyze herbal extracts: A case study of sugar content analysis. PLoS ONE 2018, 13, e0198515. [Google Scholar] [CrossRef] [Green Version]
  33. Yan, X.; Fu, H.; Zhang, S.; Qu, H. Combining convolutional neural networks and in-line near-infrared spectroscopy for real-time monitoring of the chromatographic elution process in commercial production of notoginseng total saponins. J. Sep. Sci. 2020, 43, 663–670. [Google Scholar] [CrossRef]
  34. Yan, X.; Zhang, S.; Fu, H.; Qu, H. Combining convolutional neural networks and on-line Raman spectroscopy for monitoring the Cornu Caprae Hircus hydrolysis process. Spectrochim. Acta A Mol. Biomol. Spectrosc. 2020, 226, 117589. [Google Scholar] [CrossRef]
Figure 1. The schematic diagram of the experimental setup.
Separations 08 00074 g001
Figure 2. Design space calculation process when considering a noise parameter.
Separations 08 00074 g002
Figure 3. Box diagram of extracted amount (a), purity (b), retention rate (c). Data were from Table A1, n = 28. The upper and lower parts of the box are the 25% and 75% percentiles, respectively, the “+” represents the mean value, and error lines represent the maximum and minimum values of the 28 experiments.
Separations 08 00074 g003
Figure 4. The standard partial regression coefficients and p values of the multiple linear regression model. Blue dotted lines are p values; columns represent standard partial regression coefficients. (a) HSYA extracted amount; (b) total flavonoids extracted amount; (c) total solids extracted amount; (d) HSYA purity; (e) total flavonoid purity; X1: density of the concentrated extract; X3: ethanol concentration; X4: ECR; X7: stirring time after ethanol addition; X8: refrigeration temperature.
Separations 08 00074 g004
Figure 5. Contour plot of the extracted amount of HSYA. (a) Density of concentrated extract was 1.23 g/cm3, stirring time after ethanol addition was 90 min, refrigeration temperature was 6 °C. (b) Density of concentrated extract was 1.23 g/cm3, ECR was 2.8 v/v, stirring time after ethanol addition was 90 min.
Separations 08 00074 g005
Figure 6. Contour plot of the extracted amount of total flavonoids. (a) Density of concentrated extract was 1.23 g/cm3, stirring time after ethanol addition was 90 min, refrigeration temperature was 6 °C. (b) Density of concentrated extract was 1.23 g/cm3, ECR was 2.8 v/v, stirring time after ethanol addition was 90 min.
Separations 08 00074 g006
Figure 7. Contour plot of the extracted amount of total solids. (a) Density of concentrated extract was 1.23 g/cm3, stirring time after ethanol addition was 90 min, refrigeration temperature was 6 °C. (b) Density of concentrated extract was 1.23 g/cm3, ECR was 2.8 v/v, stirring time after ethanol addition was 90 min.
Separations 08 00074 g007
Figure 8. Contour plot of the purity of HSYA. (a) Ethanol concentration was 95%, stirring time after ethanol addition was 90 min, refrigeration temperature was 6 °C. (b) Ethanol concentration was 95%, ECR = 2.8 v/v, stirring time after ethanol addition was 90 min. (c) Density of concentrated extract was 1.23 g/cm3, ethanol concentration was 95%, stirring time after ethanol addition was 90 min.
Separations 08 00074 g008
Figure 9. Contour plot of the purity of total flavonoids. (a) Ethanol concentration was 95%, ECR was 2.8 v/v, refrigeration temperature was 6 °C. (b) Ethanol concentration was 95%, ECR was 2.8 v/v, stirring time after ethanol addition was 90 min.
Separations 08 00074 g009
Figure 10. Design space and verification points. (a) Stirring time after ethanol addition was 90 min; refrigeration temperature was 6 °C. (b) ECR was 2.8 v/v; refrigeration temperature was 6 °C. (c) Density of the concentrated extract was 1.23 g/cm3; refrigeration temperature was 6 °C. (d) ECR was 2.96 v/v; stirring time after ethanol addition was 120 min. (e) Density of the concentrated extract was 1.19 g/cm3; ECR was 2.96 v/v. ○ represents the verification points in the design space. △ represents the verification points outside the design space.
Separations 08 00074 g010
Table 1. The level of experimental design.
FactorsSymbolsCoded Values
−101
Density of the concentrated extract (g/cm3)X11.181.231.28
Temperature of the concentrated extract (°C)X2202530
Ethanol concentration (%)X3949596
ECR (v/v)X42.62.83.0
Stirring speed (rpm)X5120140160
Time of ethanol addition (min)X68090100
Stirring time after ethanol addition (min)X76090120
Refrigeration temperature (°C)X82.06.010.0
Refrigeration time (h)X9243648
Table 2. The CPPs of the verification experiments. X1: density of the concentrated extract; X3: ethanol concentration; X4: ECR; X7: stirring time after ethanol addition; X8: refrigeration temperature.
CPPsInside the Design SpaceOutside the Design Space
V1V2V3V4V5V6
X1 (g/cm3)1.231.231.231.191.191.19
X3 (%)94.894.894.895.095.095.0
X4 (v/v)2.962.962.962.962.962.96
X7 (min)120120120909090
X8 (°C)2.06.010.02.06.010.0
Calculated probability(%)93.194.096.097.052.076.0
Table 3. The evaluation indicator results of the verification experiments.
Evaluation IndicatorsValue TypesV1V2V3V4V5V6
HSYA extracted amountPV (mg/g)5.886.016.146.616.87
EV (mg/g)5.946.076.396.516.986.94
ARD (%)0.980.923.951.52.560.86
Total flavonoids extracted amountPV (mg/g)2.572.92.772.753.123.02
EV (mg/g)2.682.72.852.943.023.43
ARD (%)4.117.472.766.673.2312.02
Total solids extracted amountPV (mg/g)163.3178.4168.9173.1189.1181.8
EV (mg/g)160.8164.2169.1170.8183.6189.7
ARD (%)1.578.650.131.373.014.17
HSYA purityPV (mg/g)3.423.443.473.683.643.72
EV (mg/g)3.693.693.783.813.83.66
ARD (%)7.346.778.173.424.261.75
Total flavonoids purityPV (mg/g)1.571.611.661.651.671.69
EV (mg/g)1.671.641.681.721.651.81
ARD (%)5.921.961.664.531.246.79
Table 4. Regression coefficients and variance analysis of regression model after continuous improvement.
ParametersHSYA Extracted AmountTotal Flavonoids Extracted AmountTotal Solids Extracted AmountArcSin (Sqrt (HSYA Purity))ArcSin (Sqrt (Total Flavonoids Purity))
Coefficientsp ValueCoefficientsp ValueCoefficientsp ValueCoefficientsp ValueCoefficientsp Value
Constant6.22-2.95-175.18-0.19-0.131-
X1−1.02<0.0001−0.2893<0.0001−7.36<0.0001−0.0126<0.0001−0.004<0.0001
X3−0.3808<0.0001−0.12320.0010−6.490.0001−0.003<0.0001--
X4−0.2508<0.0001−0.12210.0007−2.960.0423−0.00170.0094−0.00150.0115
X7--------−0.00120.0349
X80.2031<0.00010.143<0.00014.870.0011--0.00170.0037
X1X7--------−0.00160.0130
X1X8------0.00130.0502--
X3X40.20450.00010.11790.00245.440.0020----
X3X80.3228<0.00010.1778<0.00018.82<0.0001----
X7X8--------0.00240.0937
X12----13.470.0015−0.0067<0.0001−0.00270.0494
X32−0.41610.0001−0.19780.0022−7.90.0302----
X82----−8.160.0189----
Model p value<0.0001<0.0001<0.0001<0.0001<0.0001
R20.96360.87070.83060.94580.7888
R2 represents the coefficients of determination, ArcSin (Sqrt (HSYA Purity)) represents the HSYA and was subjected to square root arcsine transformation. ArcSin (Sqrt (Total Flavonoids Purity)) represents the purity of total flavonoids and was subjected to square root arcsine transformation.
Table 5. The results of experimental point N.
Value TypesExtracted Amount (mg/g)Purity (%)
HSYATotal FlavonoidsTotal SolidsHSYATotal Flavonoids
PV (mg/g)6.523.08170.13.751.75
EV (mg/g)6.632.68173.33.821.54
ARD (%)1.6614.931.851.8313.64
Publisher’s Note: MDPI stays neutral with regard to jurisdictional claims in published maps and institutional affiliations.

