
Particle Motion Characteristics in W-Shaped Hydrocyclones


College of Mechanical & Electronic Engineering, Shandong University of Science and Technology, Qingdao 266590, China
*
Author to whom correspondence should be addressed.
Separations 2021, 8(8), 121; https://0-doi-org.brum.beds.ac.uk/10.3390/separations8080121
Submission received: 7 July 2021
/
Revised: 11 August 2021
/
Accepted: 12 August 2021
/
Published: 17 August 2021
(This article belongs to the Section Materials in Separation Science)
Abstract
:To investigate the multiphase flow characteristics and improve the classification mechanism of a W-shaped hydrocyclone, this paper adopts the numerical simulation method to evaluate the effects of the particle size and density on the separation characteristics and motion behavior of particles. Forces, such as the centrifugal inertia force, pressure gradient force and fluid drag force, which control particle motion, are analyzed, and the classification mechanism of W-shaped hydrocyclones is examined in terms of the particle distribution and separation efficiency. The results indicate that the radial centrifugal inertia and pressure gradient forces in W-shaped hydrocyclones are hundreds of times the gravity force, which is the main driver of radial motion. Particle density and size changes greatly impact the movement and distribution of coarse particles, but no notable change occurs in fine particles. With increasing particle density, the cut size decreases, and the fractionation accuracy increases.
1. Introduction
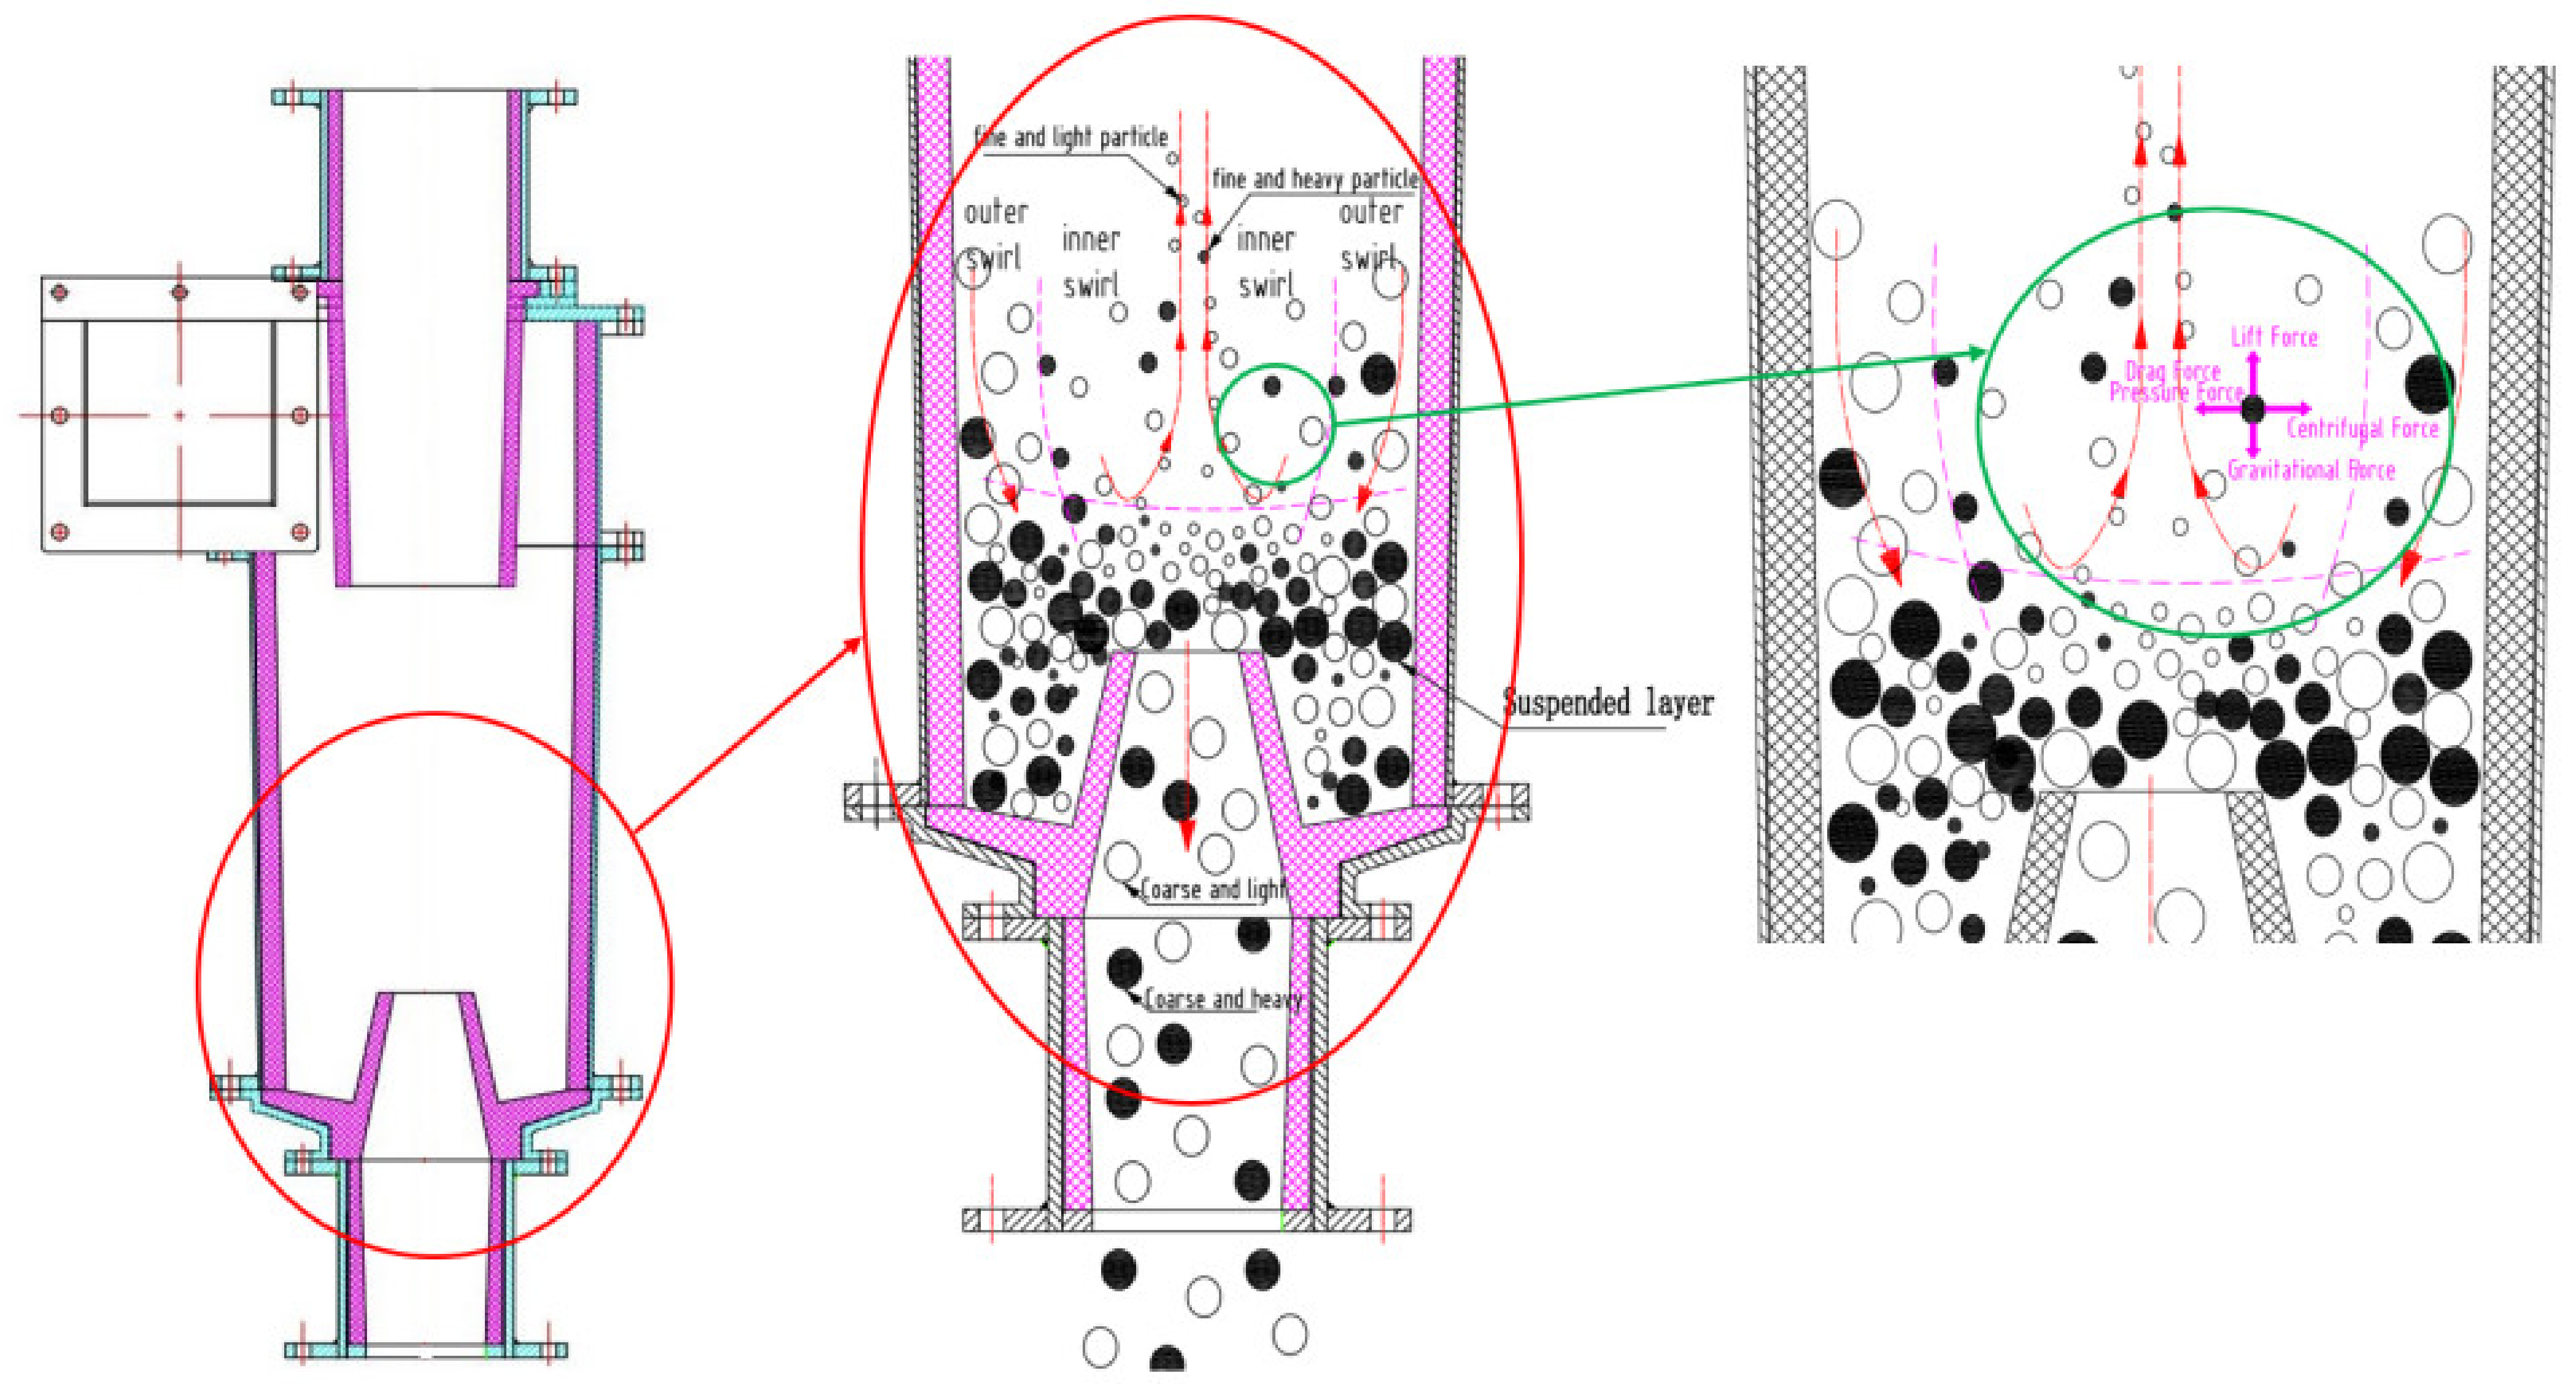
A hydrocyclone is an effective multiphase separation equipment based on the principle of centrifugal sedimentation. Because of its advantages of a simple structure, convenient operation, and high handling capacity and separation efficiency, it has been widely applied in classification, desliming, concentration, and other operations [1,2,3]. Solid particles are separated according to the particle size and density differences in a high-speed centrifugal field. Coarse particles are subjected to a high centrifugal force, which overcomes the drag force of fluid on these particles, moves them towards the sidewall of the hydrocyclone and then discharges from the underflow. Fine particles are affected by a low centrifugal force, and it is difficult to overcome the liquid flow resistance, which indicates that fine particles are only passively separated under fluid promotion and finally discharged from the overflow [4,5,6]. The principle of equal-settling speed classification of hydrocyclones determines the occurrence of the anti-enrichment phenomenon, which indicates that the undertow product contains excess fine particles, and the overflow product carries excess coarse particles [7,8,9]. In a previous study, the authors proposed a W-shaped hydrocyclone based on the loose classification theory [10], as shown in Figure 1, which is a full-column section structure instead of the traditional column cone form, and the apex is inserted backwards into the inner chamber of the hydrocyclone to form a W-shaped structure. A combination of numerical simulation and experimental research was applied to achieve both flow field regulation inside the hydrocyclone and the purpose of underflow entrainment reduction [11,12]. However, to examine the multiphase flow characteristics of the W-shaped hydrocyclone and improve its classification mechanism, it is necessary to analyze the evolution of its internal flow field and assess internal particle motion characteristics.
In regard to the study of the particle motion and distribution characteristics of cyclonic fields, the commonly applied methods are gamma ray tomography (GRT), electrical resistance tomography (ERT), and electrical impedance tomography (EIT) [13,14,15]. Recent experimental studies have focused on individual particle tracking within hydrocyclones with a high-speed motion analyzer [16] and a positron emission particle tracking (PEPT) instrument [17,18] to analyze the irregular flow patterns of particles within cyclones. Chang [19], Sovechles [20], and Hoffmann [21] adopted the PEPT technique to analyze the particle flow within a high-speed rotating flow field. However, although experimental methods accurately measure the flow field parameters within a hydrocyclone, there are also limitations. In particular, it is difficult to determine the microscopic motion characteristics of the entire particle population within a turbulent field rotating at high speeds.
With the rapid development of the computational fluid dynamics (CFD) technique, numerical studies involving CFD simulation have increasingly offered the possibility of studying a wide range of changes in the design of W-shaped hydrocyclones [22,23]. Zhang et al. [24] employed the Reynolds stress model (RSM) to describe the turbulence characteristics of gas–liquid two-phase flow, simulated particle motion with the DPM, determined the forces on particles and analyzed their spatial and statistical distributions. Daza [25] implemented the CFD method to model a 75 mm hydrocyclone, and they coupled the RSM and Eulerian model to address the interaction between solid and liquid phases, while the particle flow kinetic theory (KTGF) was adopted to describe the particle phase. The working characteristics of two different materials at distinct flow rates in this hydrocyclone were studied, and the model validity was verified via a comparison to experimental data. Jiang [26] used a two-fluid model (TFM) to conduct numerical simulations of a two-stage hydrocyclone and obtained its internal flow field distribution and particle classification performance. Patra [27] applied the CFD technique and a three-dimensional double-precision separation steady-state solution tool based on the Reynolds-averaged Navier–Stokes method to study the complex flow characteristics inside a hydrocyclone with a spiral rib and found that the total pressure drop of the hydrocyclone was smaller than that of a conventional one. Padhi [28] modified the mixture model by considering the effects of additional shear lift, hindered settling drag law and solid particle content on the slurry viscosity, which better predicted the separation performance at different ratios of silica and magnetite particles of a 75 mm hydrocyclone, and their simulation results were close to experimental results. In recent years, the CFD-discrete element method (DEM) approach has emerged to simulate the particle motion characteristics of hydrocyclones. Chu et al. [29] applied the CFD method to solve the continuous phase and the DEM to solve the discrete phase and combined these two methods to investigate the effect of the particle density on the hydrocyclone separation performance. Wang et al. [30] combined a hydrodynamic model with a particle dynamics model and studied the motion behavior of multiple types of particles with a hybrid TFM-DEM model and analyzed the flow characteristics of different discrete particles and continuous solid phases, thereby predicting the effects of the drag model and recovery and friction coefficients on the flow characteristics.
Therefore, this paper intends to implement the numerical simulation method to examine the effect of the particle size and density on the radial and axial forces of particles based on the force, distribution and motion state of particles in a W-shaped hydrocyclone and focuses on the analysis of the distribution and motion law of the particle population in a W-shaped hydrocyclone.
2. Materials and Methods
2.1. Geometrical Structures
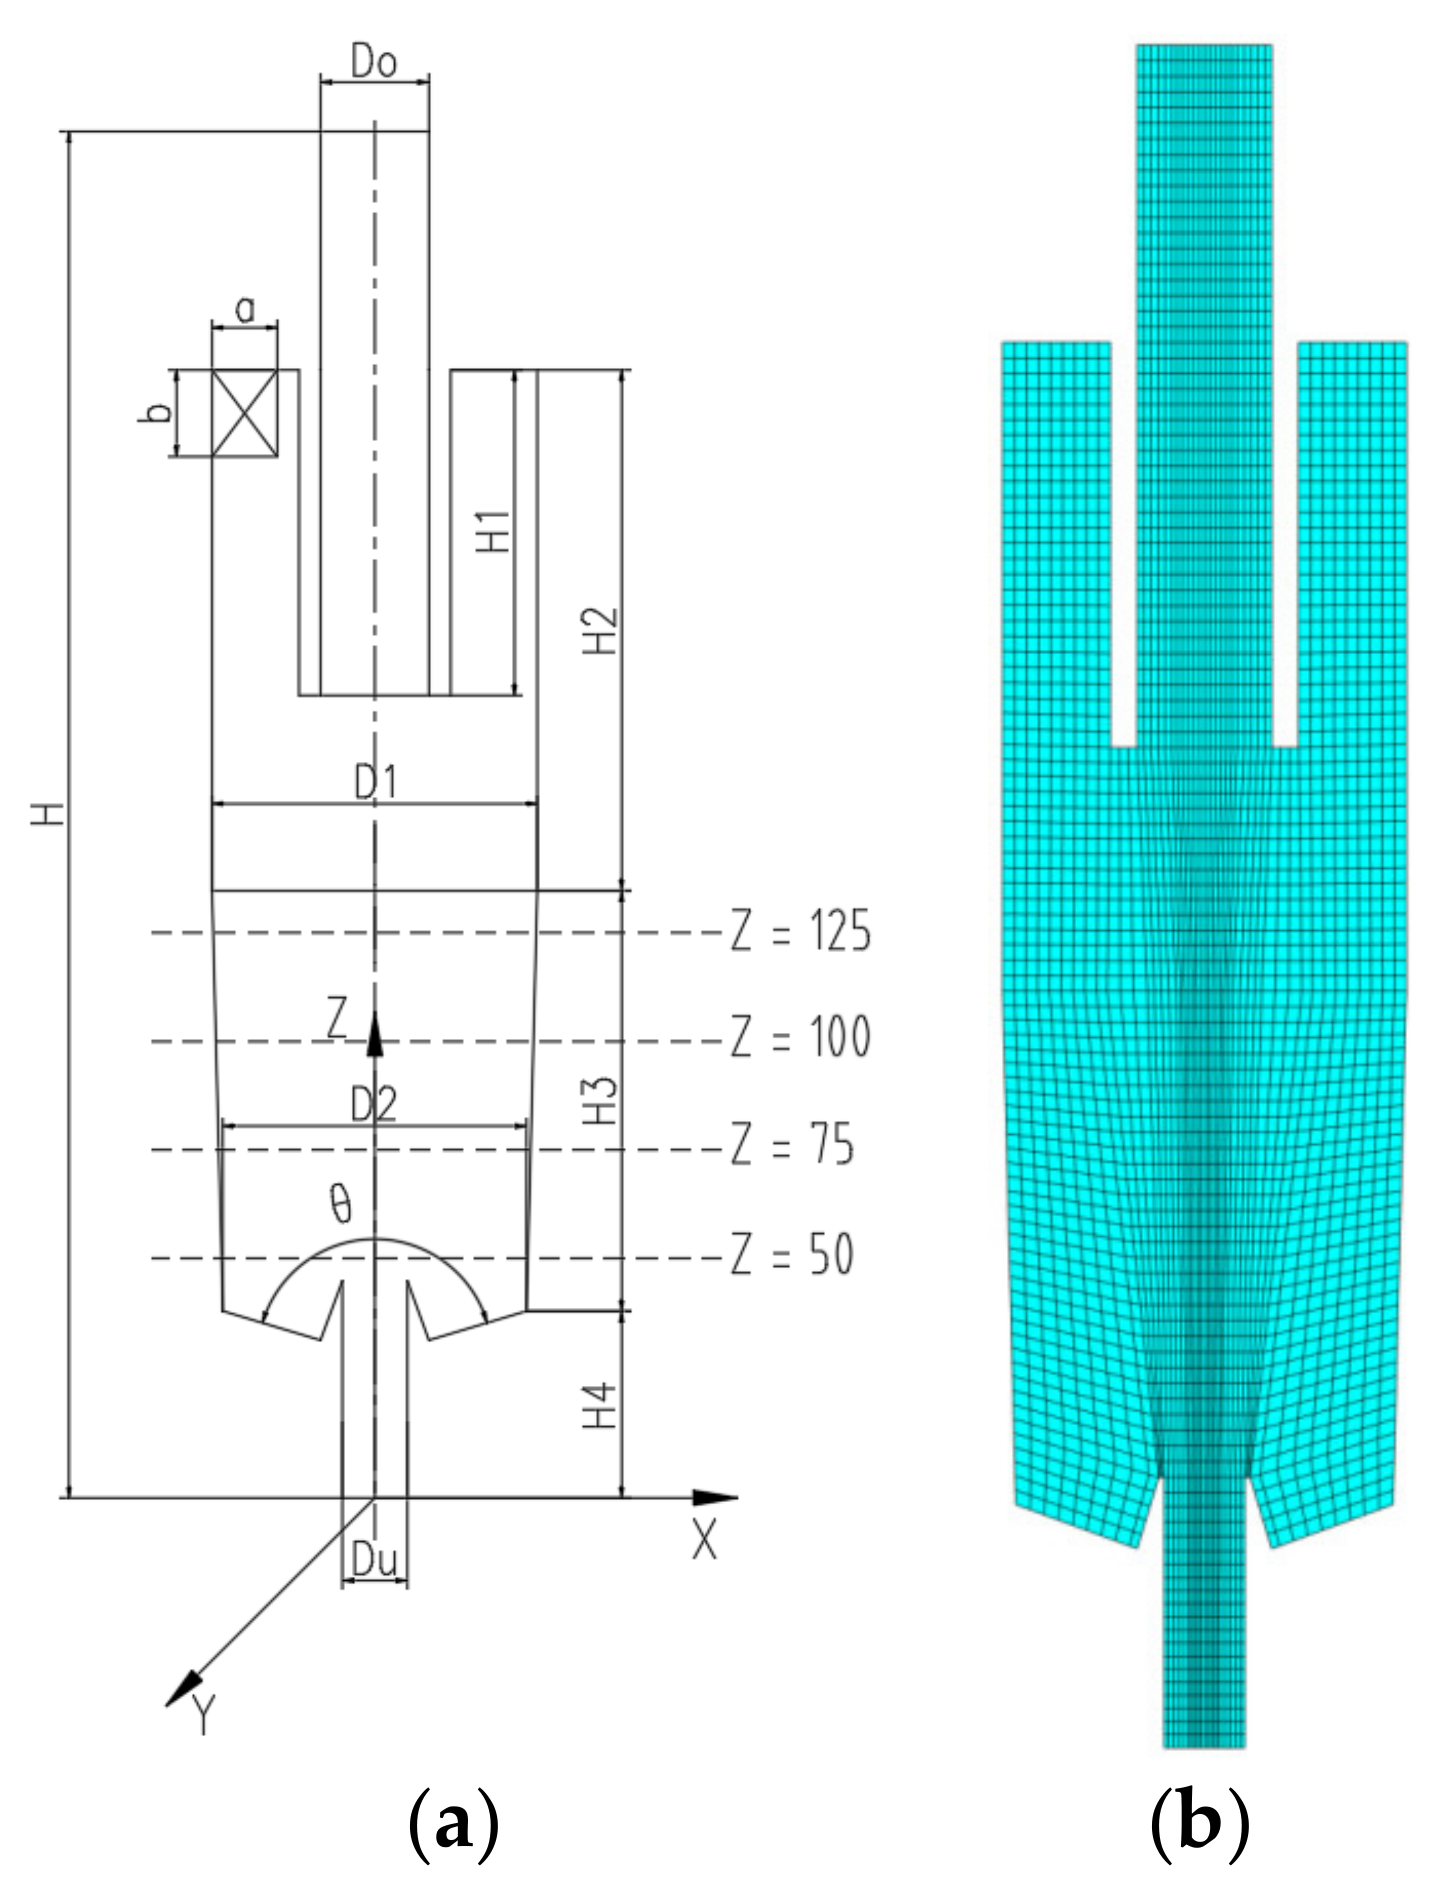
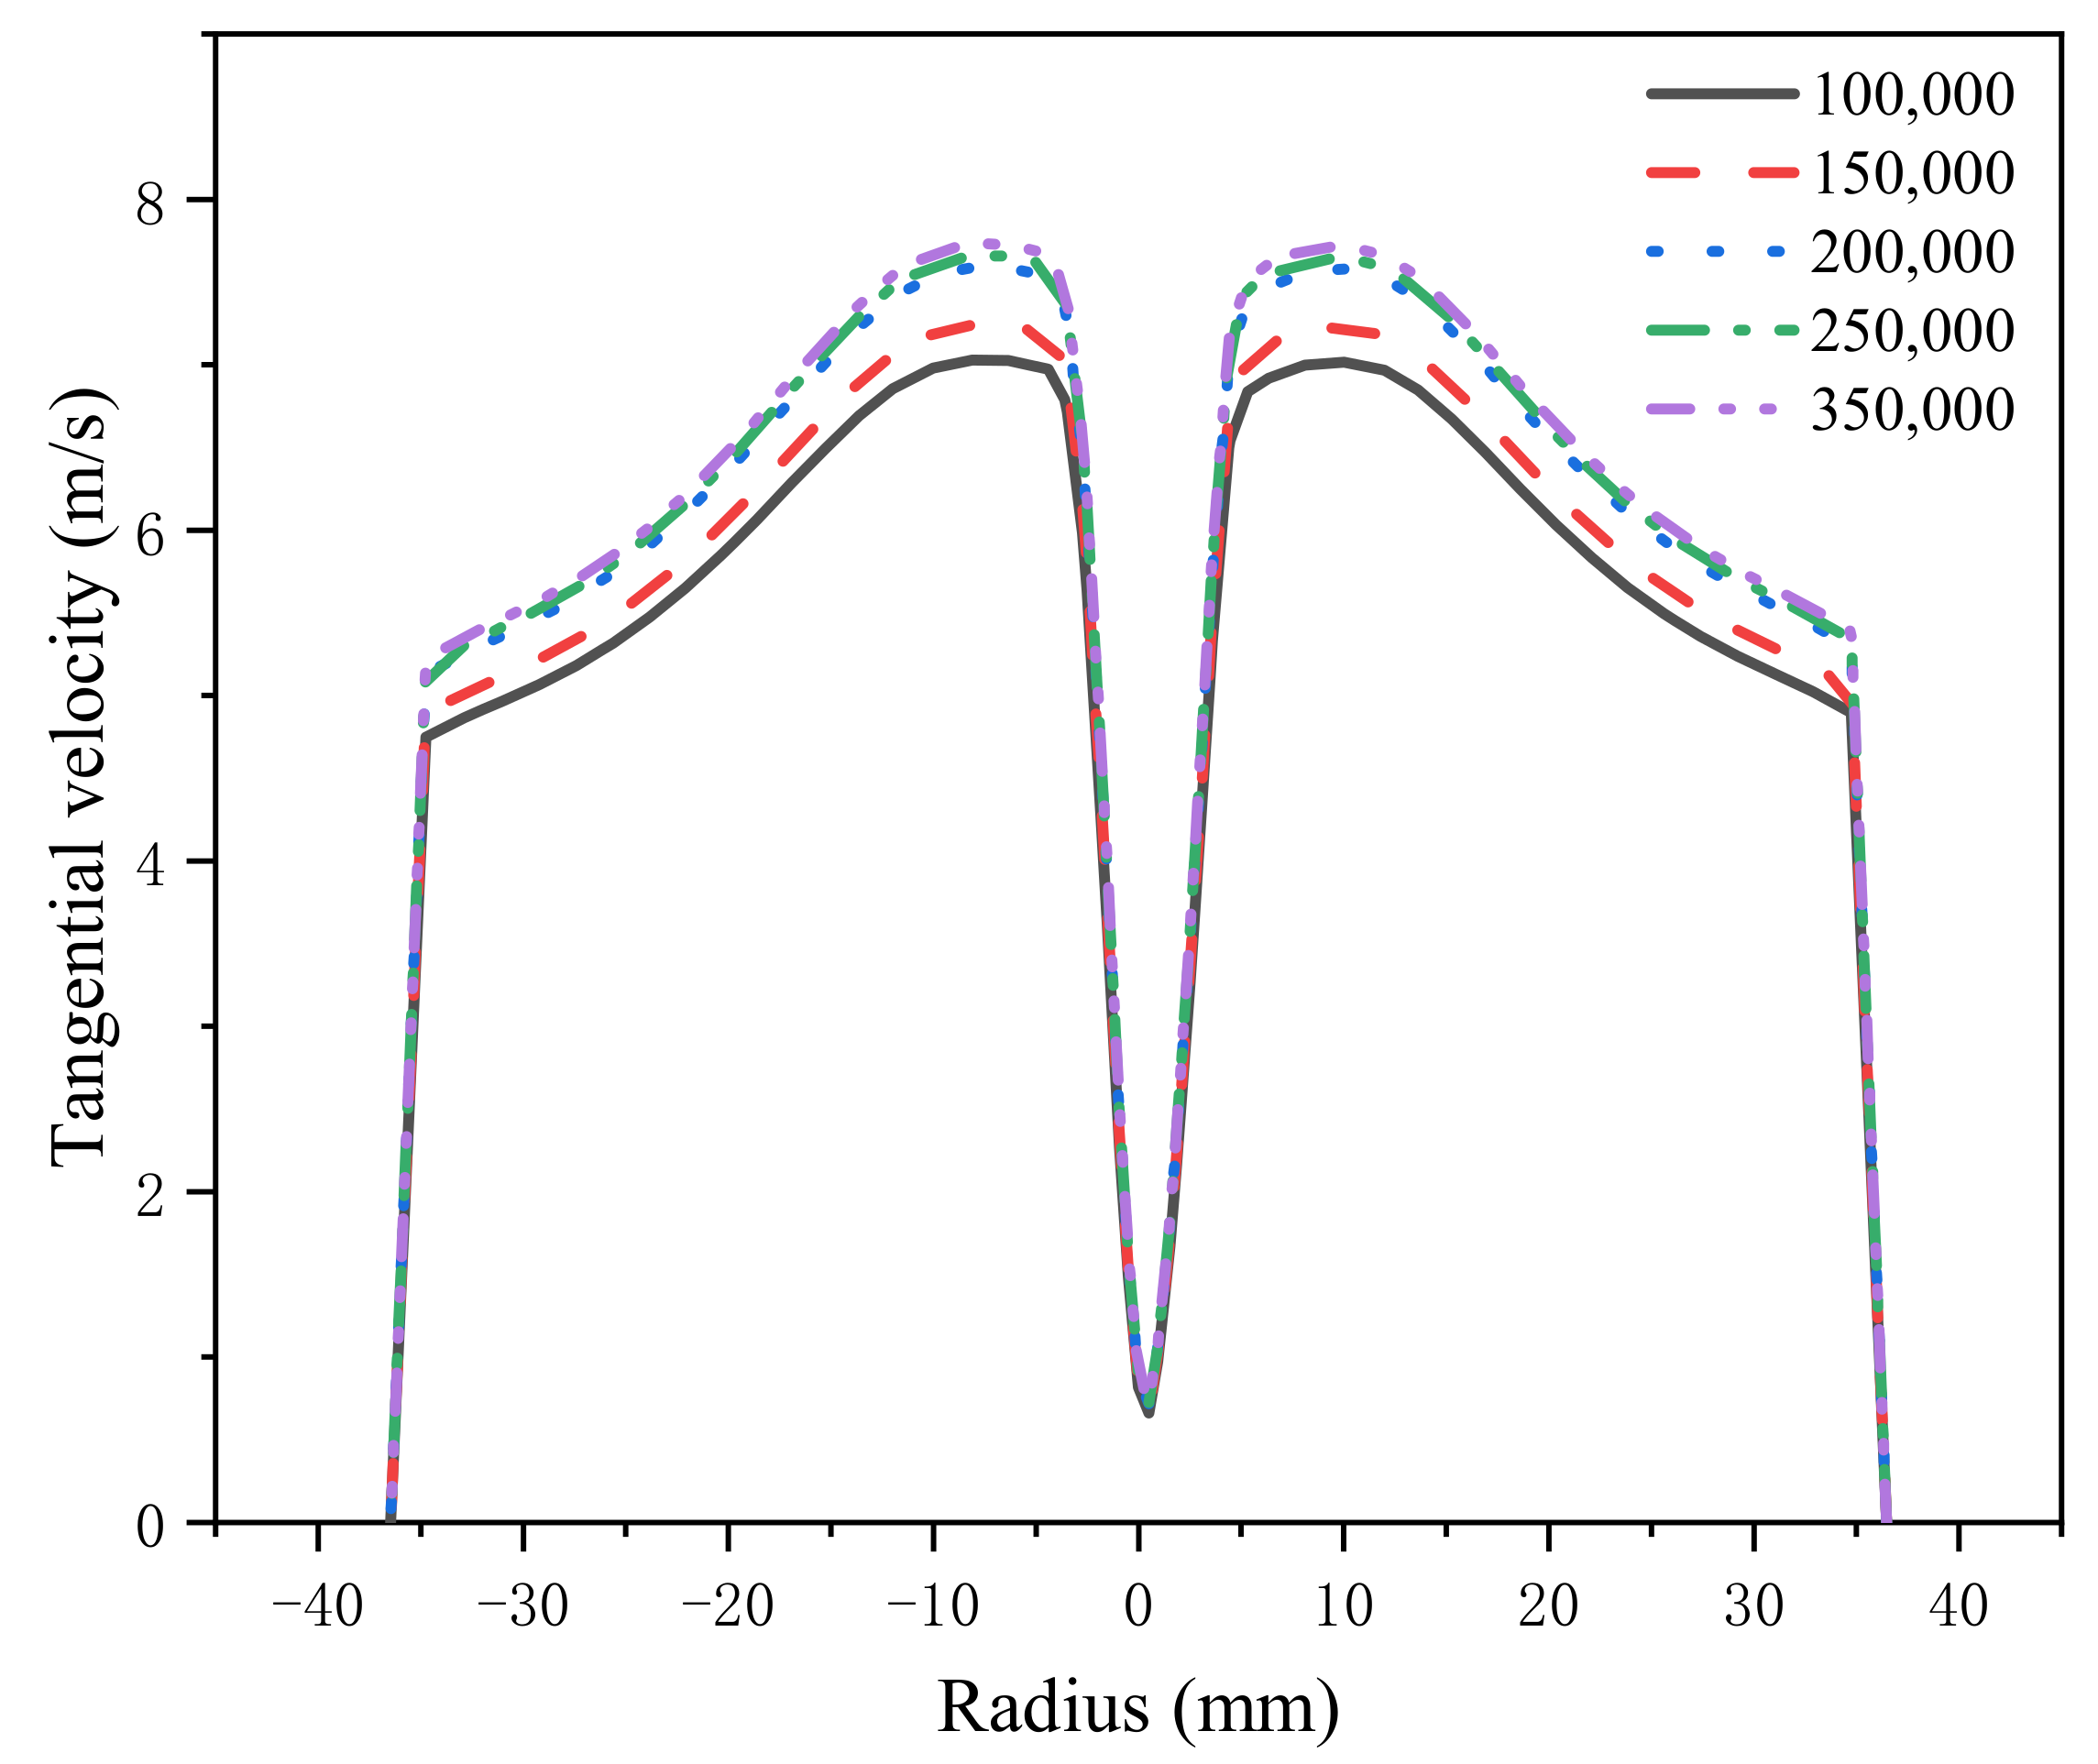
The structure of the W-shaped hydrocyclone is shown in Figure 2a, and the structural parameters are listed in Table 1. A Cartesian coordinate system was applied in the numerical simulation with its origin defined as the center of the apex. The X-axis pointed in the direction of the feed, and the Z-axis followed the direction of the vortex finder. The numerical models and meshes adopted in this simulation study are shown in Figure 2b. Meshing is the most vital step in the pre-processing of numerical simulations. To achieve a certain calculation accuracy and enhance the calculation efficiency, a grid-independence test was carried out. Tangential velocity is an important performance index of hydrocyclone, so the influence of grid on simulation precision is evaluated by the change of tangential velocity, and the results are shown in Figure 3. When the number of meshes is greater than 200,000, the tangential velocity of the hydrocyclone is basically unchanged with the increase of the number of meshes, so the final number of meshes is selected to be about 250,000 [31]. To facilitate flow field analysis, characteristic sections Z = 75, Z = 100, Z = 125, and Z = 175 were chosen.
2.2. Model Description
2.2.1. Turbulence Model
The fluid movement in the hydrocyclone is a high-speed rotating turbulent movement, which is a highly nonlinear complex flow. At present, researchers simulate turbulence by numerical methods, and the results are in good agreement with the actual situation. Considering the fluid rotating flow in the hydrocyclone and the change in the flow direction curvature, the RSM model can accurately take into account the influence of various anisotropic effects, such as the buoyancy effect, rotation effect and near-wall effect. Therefore, in this study, the RSM model was selected to simulate the hydrocyclone, and its stress transport equation is
where is the turbulent energy diffusion, is the molecular viscous diffusion, is the shear stress generation, is the buoyancy generation, is the pressure strain, is the viscous discrete term, and is the system rotation generation. The equations are
In this paper, the internal flow field of the hydrocyclone is numerically simulated using Fluent software, and the turbulent energy diffusion , stress–strain , buoyancy generation , and dissipative tensor , used in Fluent are
In the equations, , =0.82, is the slow term, is the fast term, is the wall reflection, and , where is the Mach number.
2.2.2. TFM Model
For the TFM model, the continuous phase and the discrete phase are regarded as interpenetrating continua, and the particles with different density or size are treated as one phase, and the phase averaged continuity and momentum equation of each phase are solved. To facilitate the tracking and description of particles with different densities and granularity in the hydrocyclone, the TFM was selected for simulation. The phase averaged continuity and momentum equations for the phase n are given by
where is the mixed phase density, is the mass transfer, and is the average velocity of the mixed phase.
The mixed phase density is
The average velocity of the mixed phase is
where is the volume fraction of the kth phase, is the density of the kth phase and is the velocity of the kth phase.
The momentum conservation equation is
where is the total number of phases, is the viscosity of the mixed phase, is the pressure, is the density of the kth phase, is the volume force, is the relative slip velocity of the kth phase and the mixed phase.
Considering the effect of turbulent diffusion, and described by the Gidaspow et al. model, the relative sliding velocity is
where is the particle diameter of the kth phase, is the drag coefficient, is the relative sliding velocity between the phase and the phase .
2.3. Simulation Conditions
The internal flow field dynamics of the W-shaped hydrocyclone were determined with the RSM and TFM. In all the simulations, the velocity-inlet boundary condition was applied at the hydrocyclone inlet, and the velocities of water and particles were both 5 m/s. The pressure-outlet boundary condition was applied at the outlet. The solid particles in the TFM were SiO2 particles with a density of 2650 kg/m3. The particle size distribution is summarized in Table 2. The total solid volume fraction in the feed was 5%. A no-slip boundary condition was applied to the hydrocyclone walls. The SIMPLE algorithm was adopted for pressure-velocity coupling. The PRESTO discretization scheme was employed for the pressure equations, and the QUICK discretization scheme was applied to the other control equations. The time-averaged equilibrium of the flow rate of each phase at both the inlet and outlet was regarded as the convergence criterion, and the maximum convergence error was 2.5%. The time step of each calculation was 1.0 × 10⁻⁴ s, and the residual convergence of the equation was 1.0 × 10⁻⁵ in all cases.
3. Results and Discussion
3.1. Forces Acting on the Particles in the W-Shaped Hydrocyclone
The essence of particle motion is that the particles are subjected to unbalanced forces in the axial and radial directions. However, forces such as centrifugal inertia, fluid drag, pressure gradient, and other forces are affected by changes in the flow field. Moreover, particles of varying sizes and densities located at different positions are subject to different forces, so the effects of the particle size and density on the radial and axial forces are first evaluated in this paper.
3.1.1. Effect of the Particle Size on the Forces Acting on the Particles
The radial force imbalance among particles is the main driving force to complete their radial separation motion, so the centrifugal inertia, pressure gradient and fluid drag forces on the particles in the radial direction are first analyzed. First, it should be noted that in regard to the radial force, a positive value along the positive half-axis is directed towards the wall and a negative value is directed towards the center, while a negative value along the negative half-axis is directed towards the wall and a positive value is directed towards the center. In terms of the axial force, a positive value points to the vortex finder, and a negative value points to the apex. Additionally, for comparison purposes, the forces on the particles per unit mass are expressed in the form of acceleration.
- (1)
- Effect of the Particle Size on the Radial Force
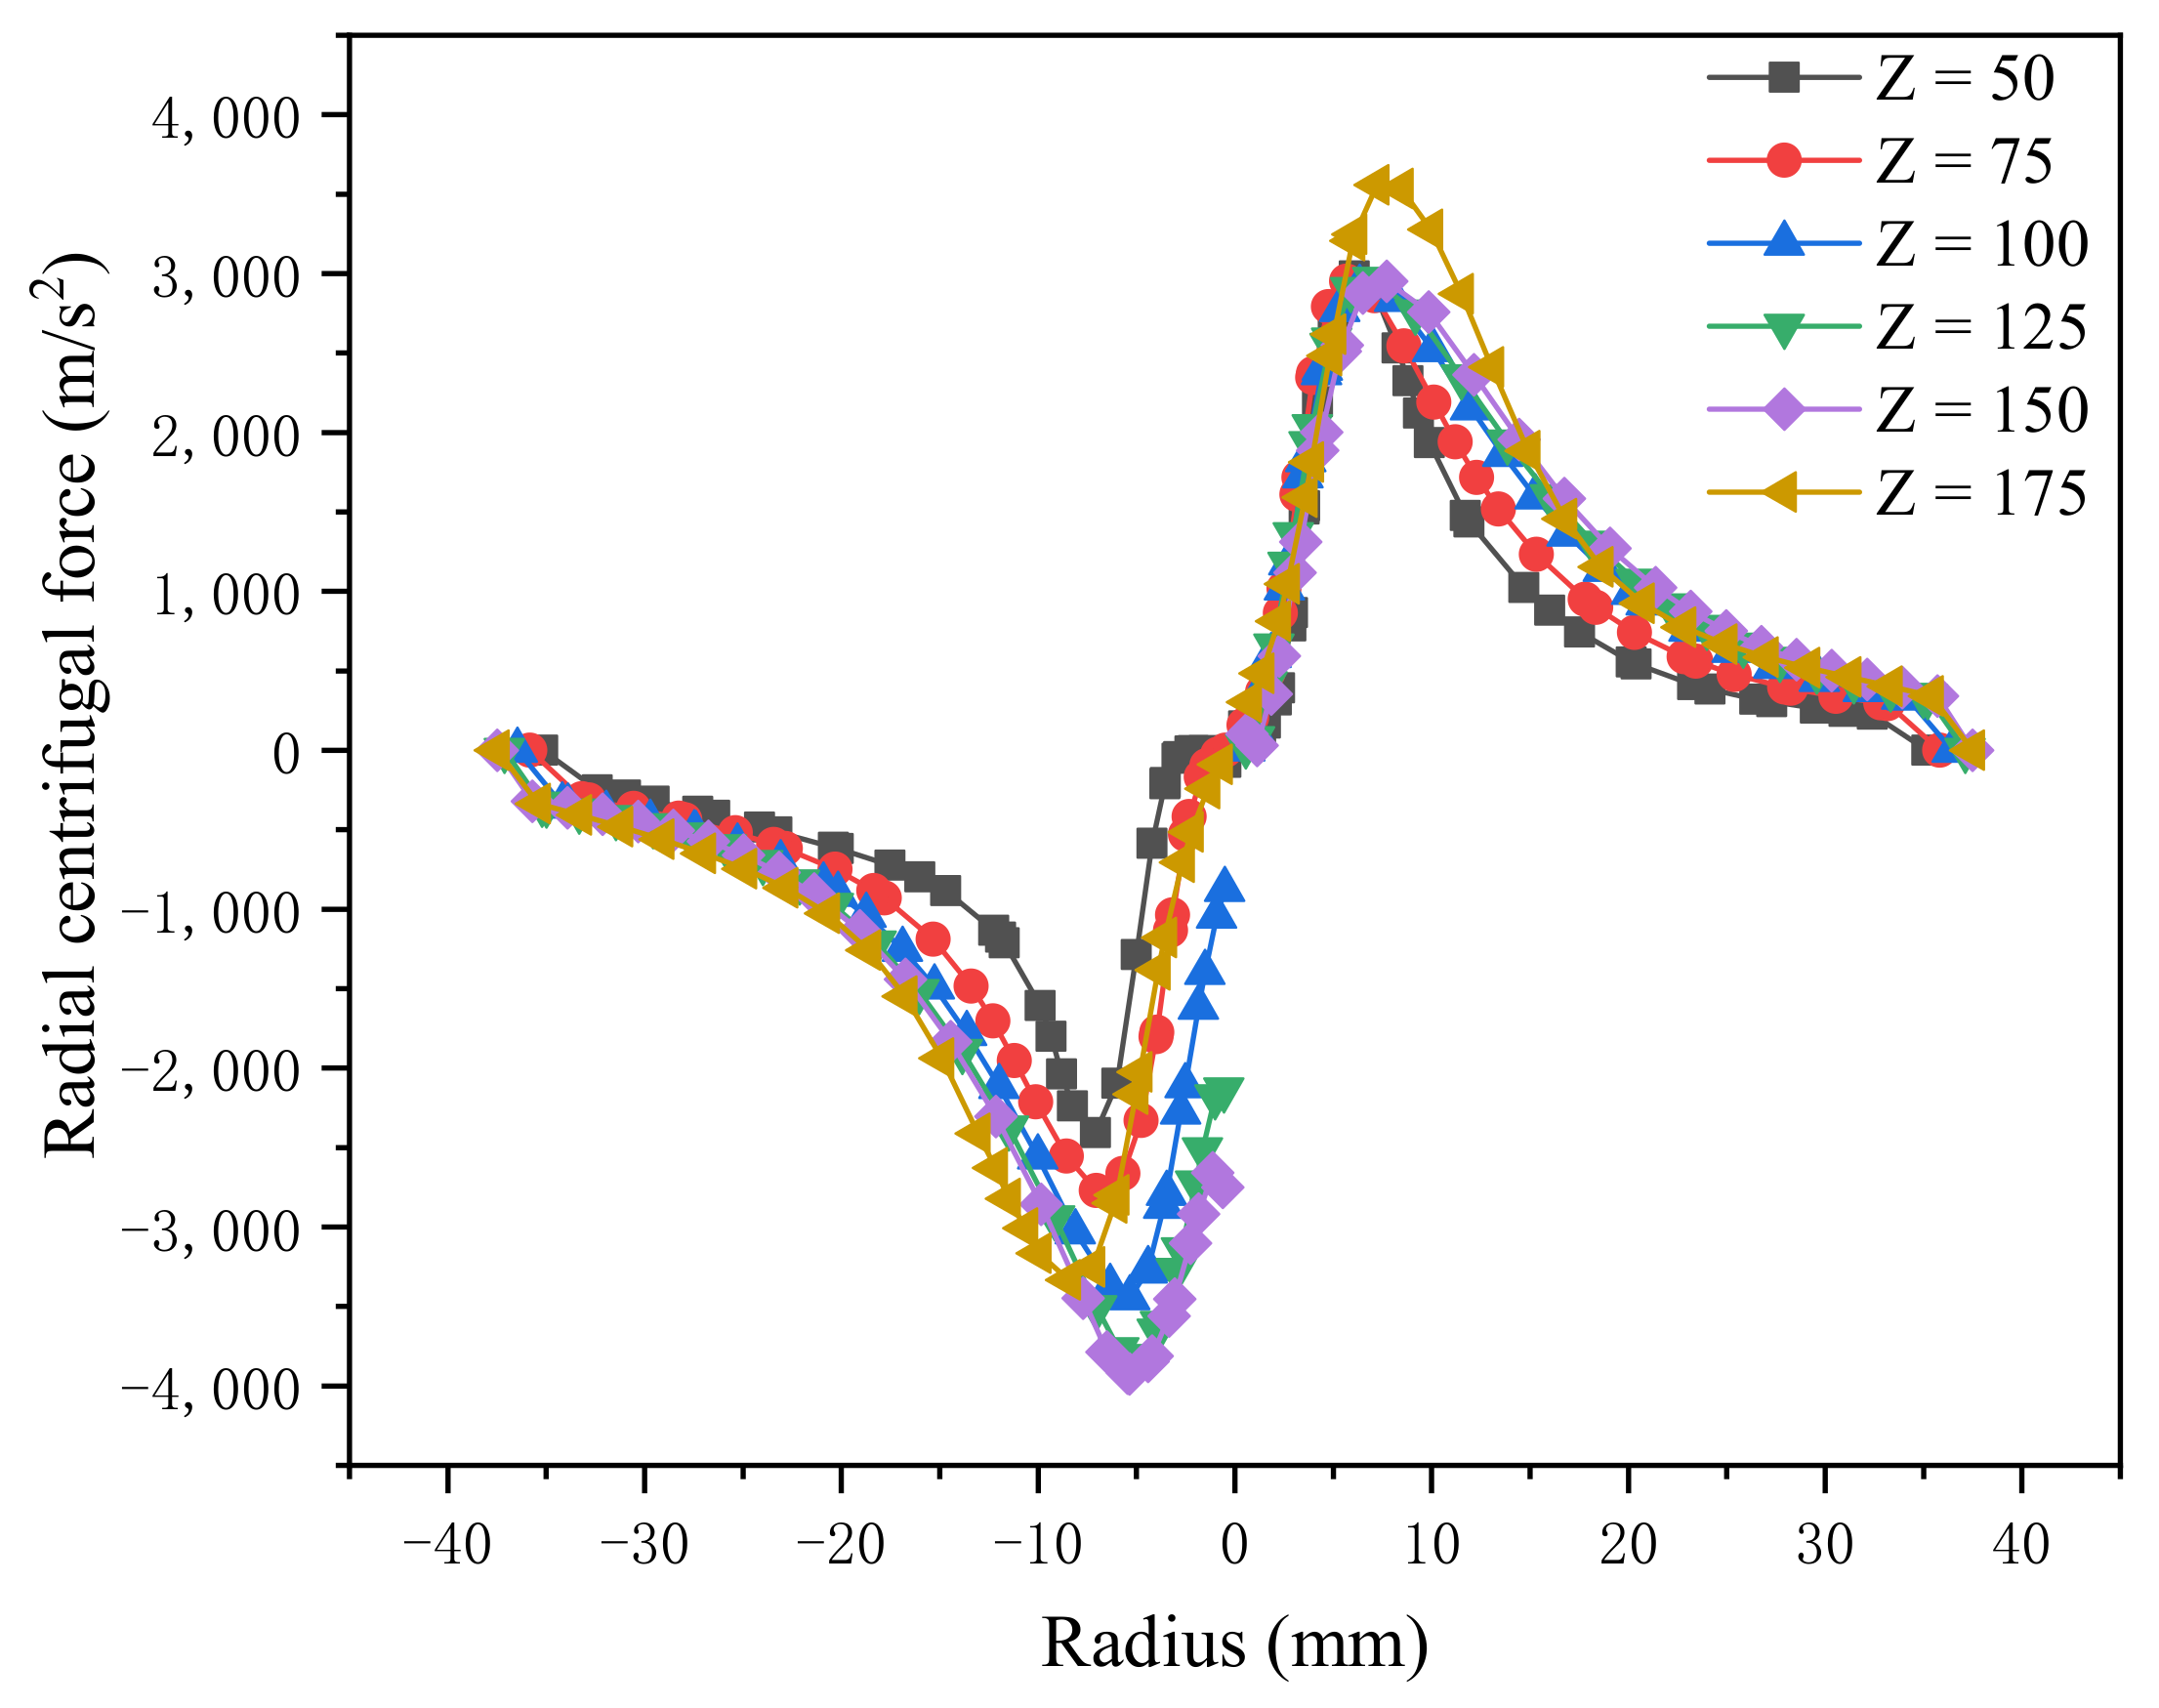
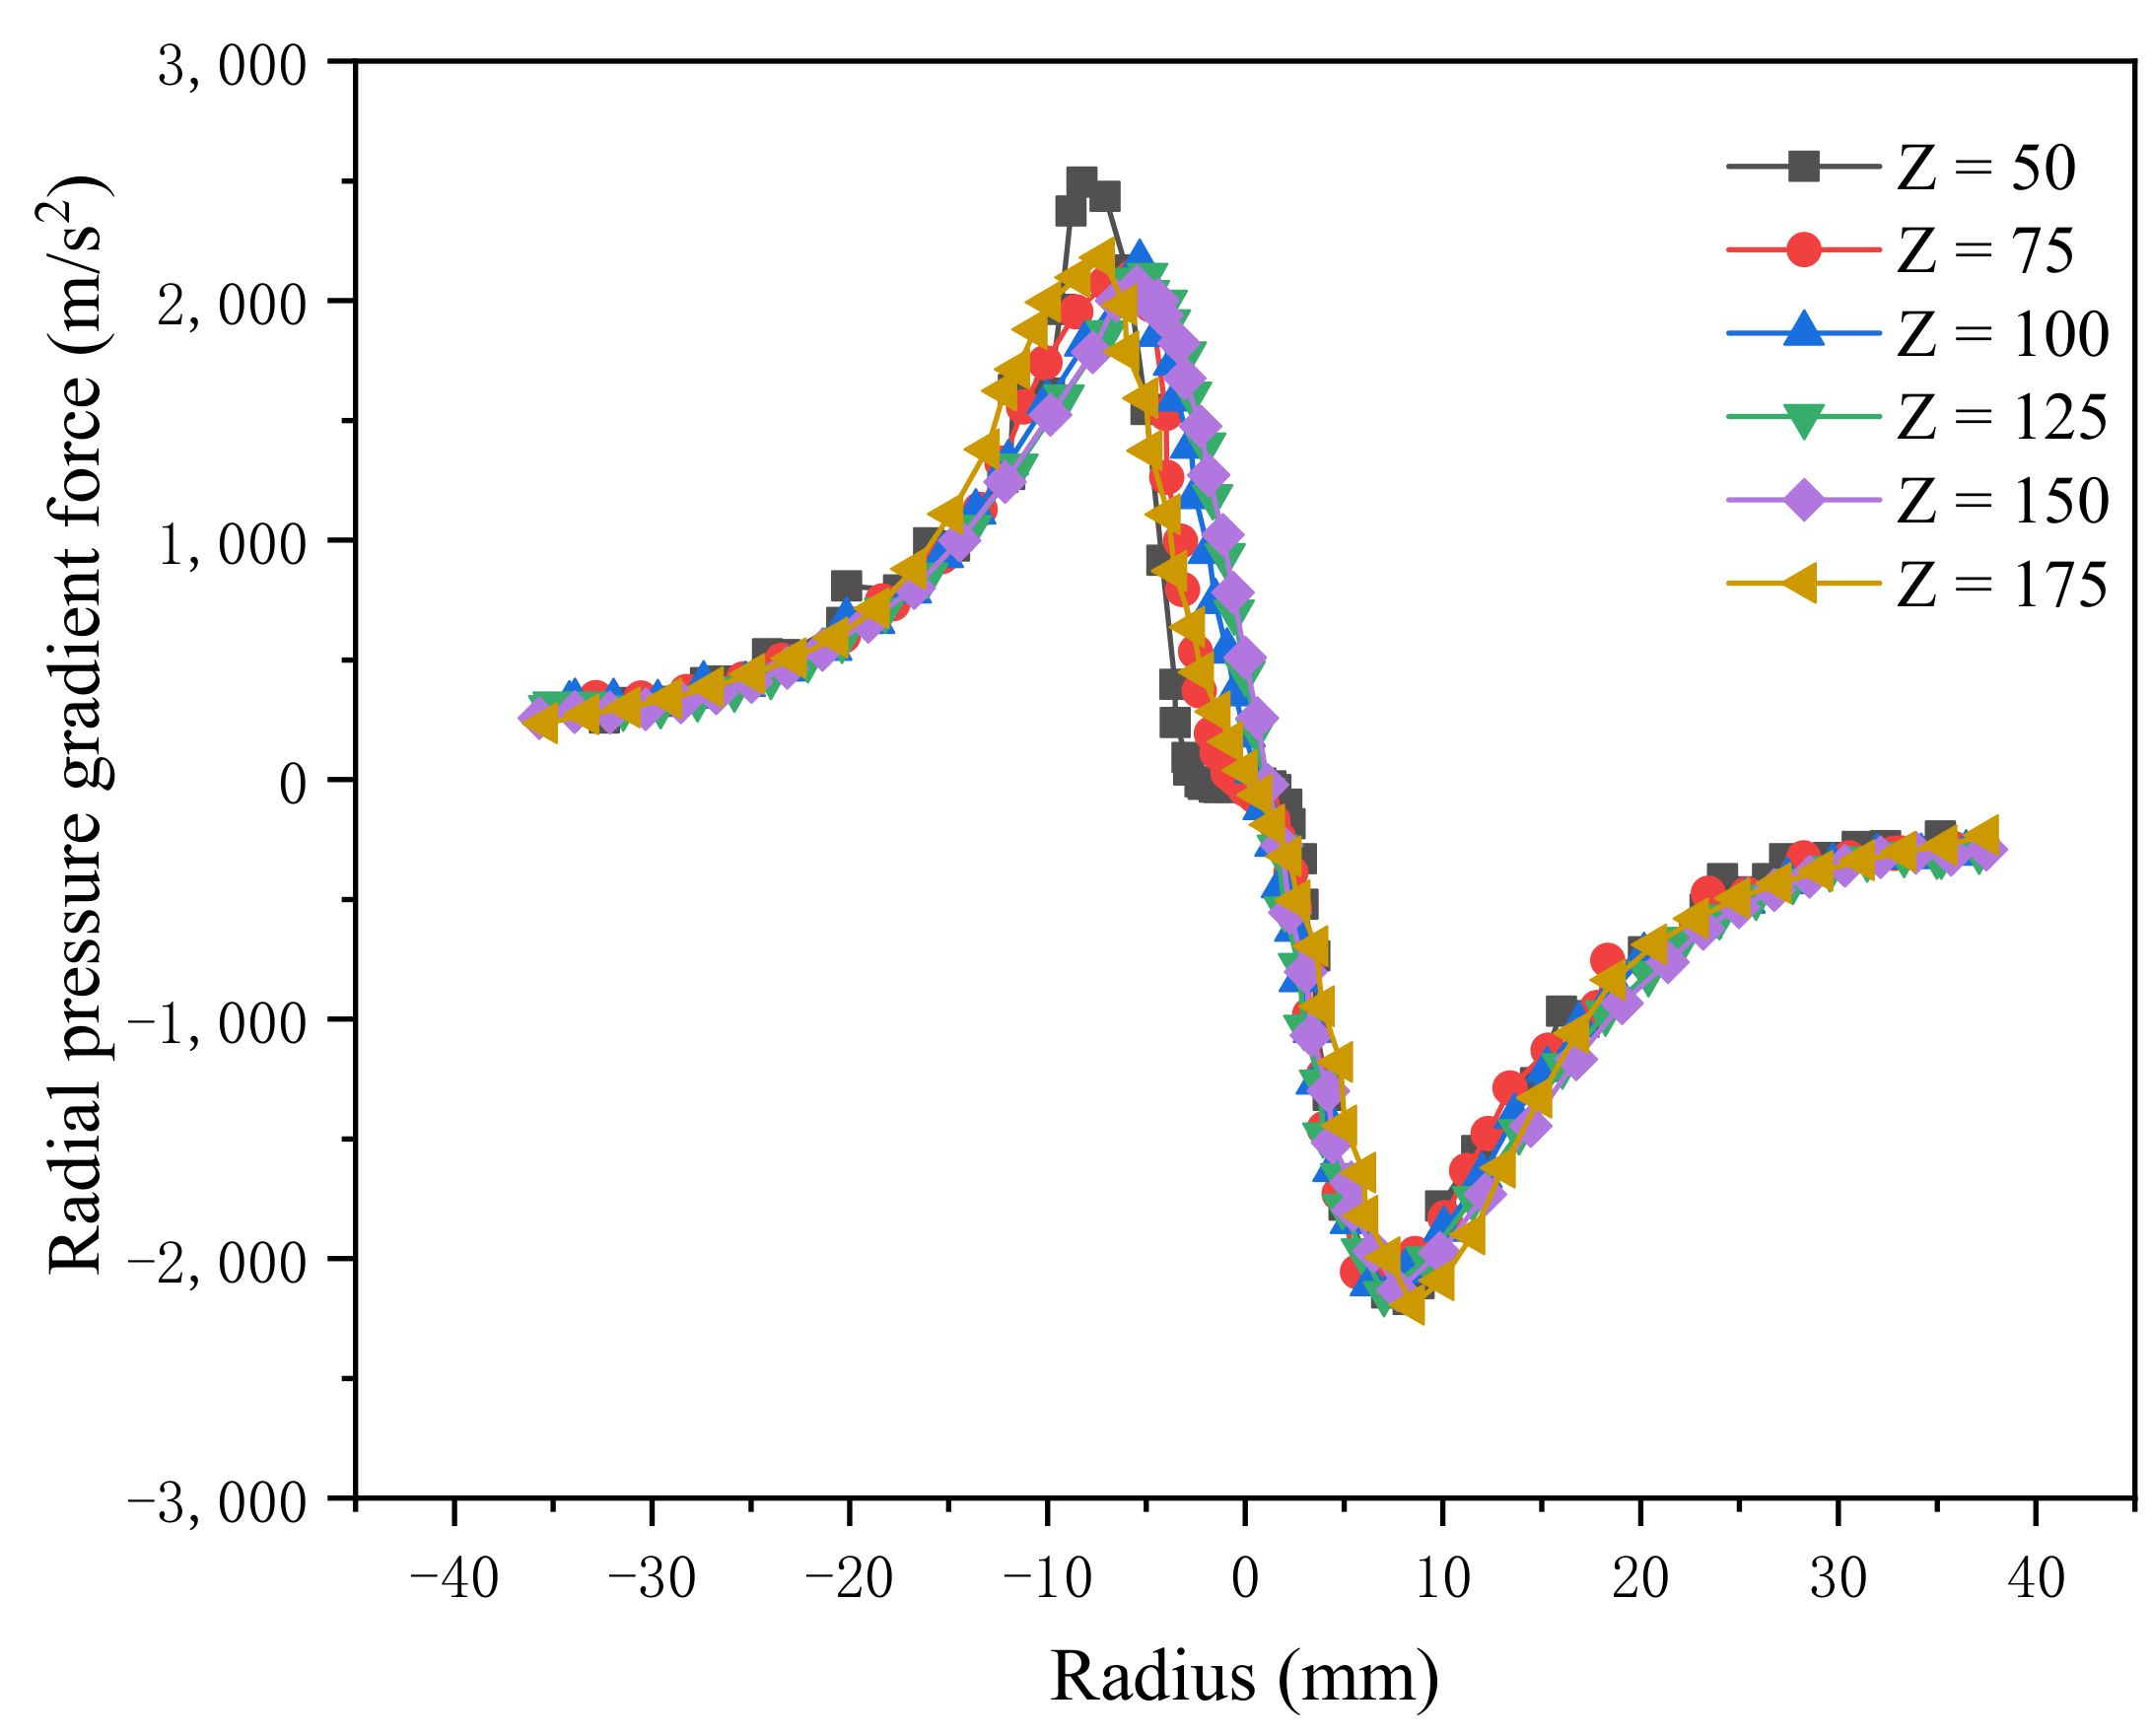
The radial centrifugal inertial acceleration is only related to the radial position and the tangential velocity at that position. The results are shown in Figure 4, where the centrifugal inertia force on the particle is directed from the center towards the wall and tends to increase and then decrease with decreasing radius. The centrifugal inertia force at the transition position between the quasi-free and combined vortices is the highest, up to 400 times the gravitational force. It is also found that with decreasing axial position, the centrifugal inertia force on the particles gradually decreases, which may be related to energy dissipation in the hydrocyclone. Figure 5 shows the radial pressure gradient force distribution of the particles. A radial pressure gradient force direction from the wall towards the center of the hydrocyclone is observed. With decreasing radius, its value exhibits a trend of increasing and then decreasing, and the maximum pressure gradient force reaches more than 200 times the gravity. Moreover, it is found that the pressure gradient force on the particles does not notable change with decreasing axial position.
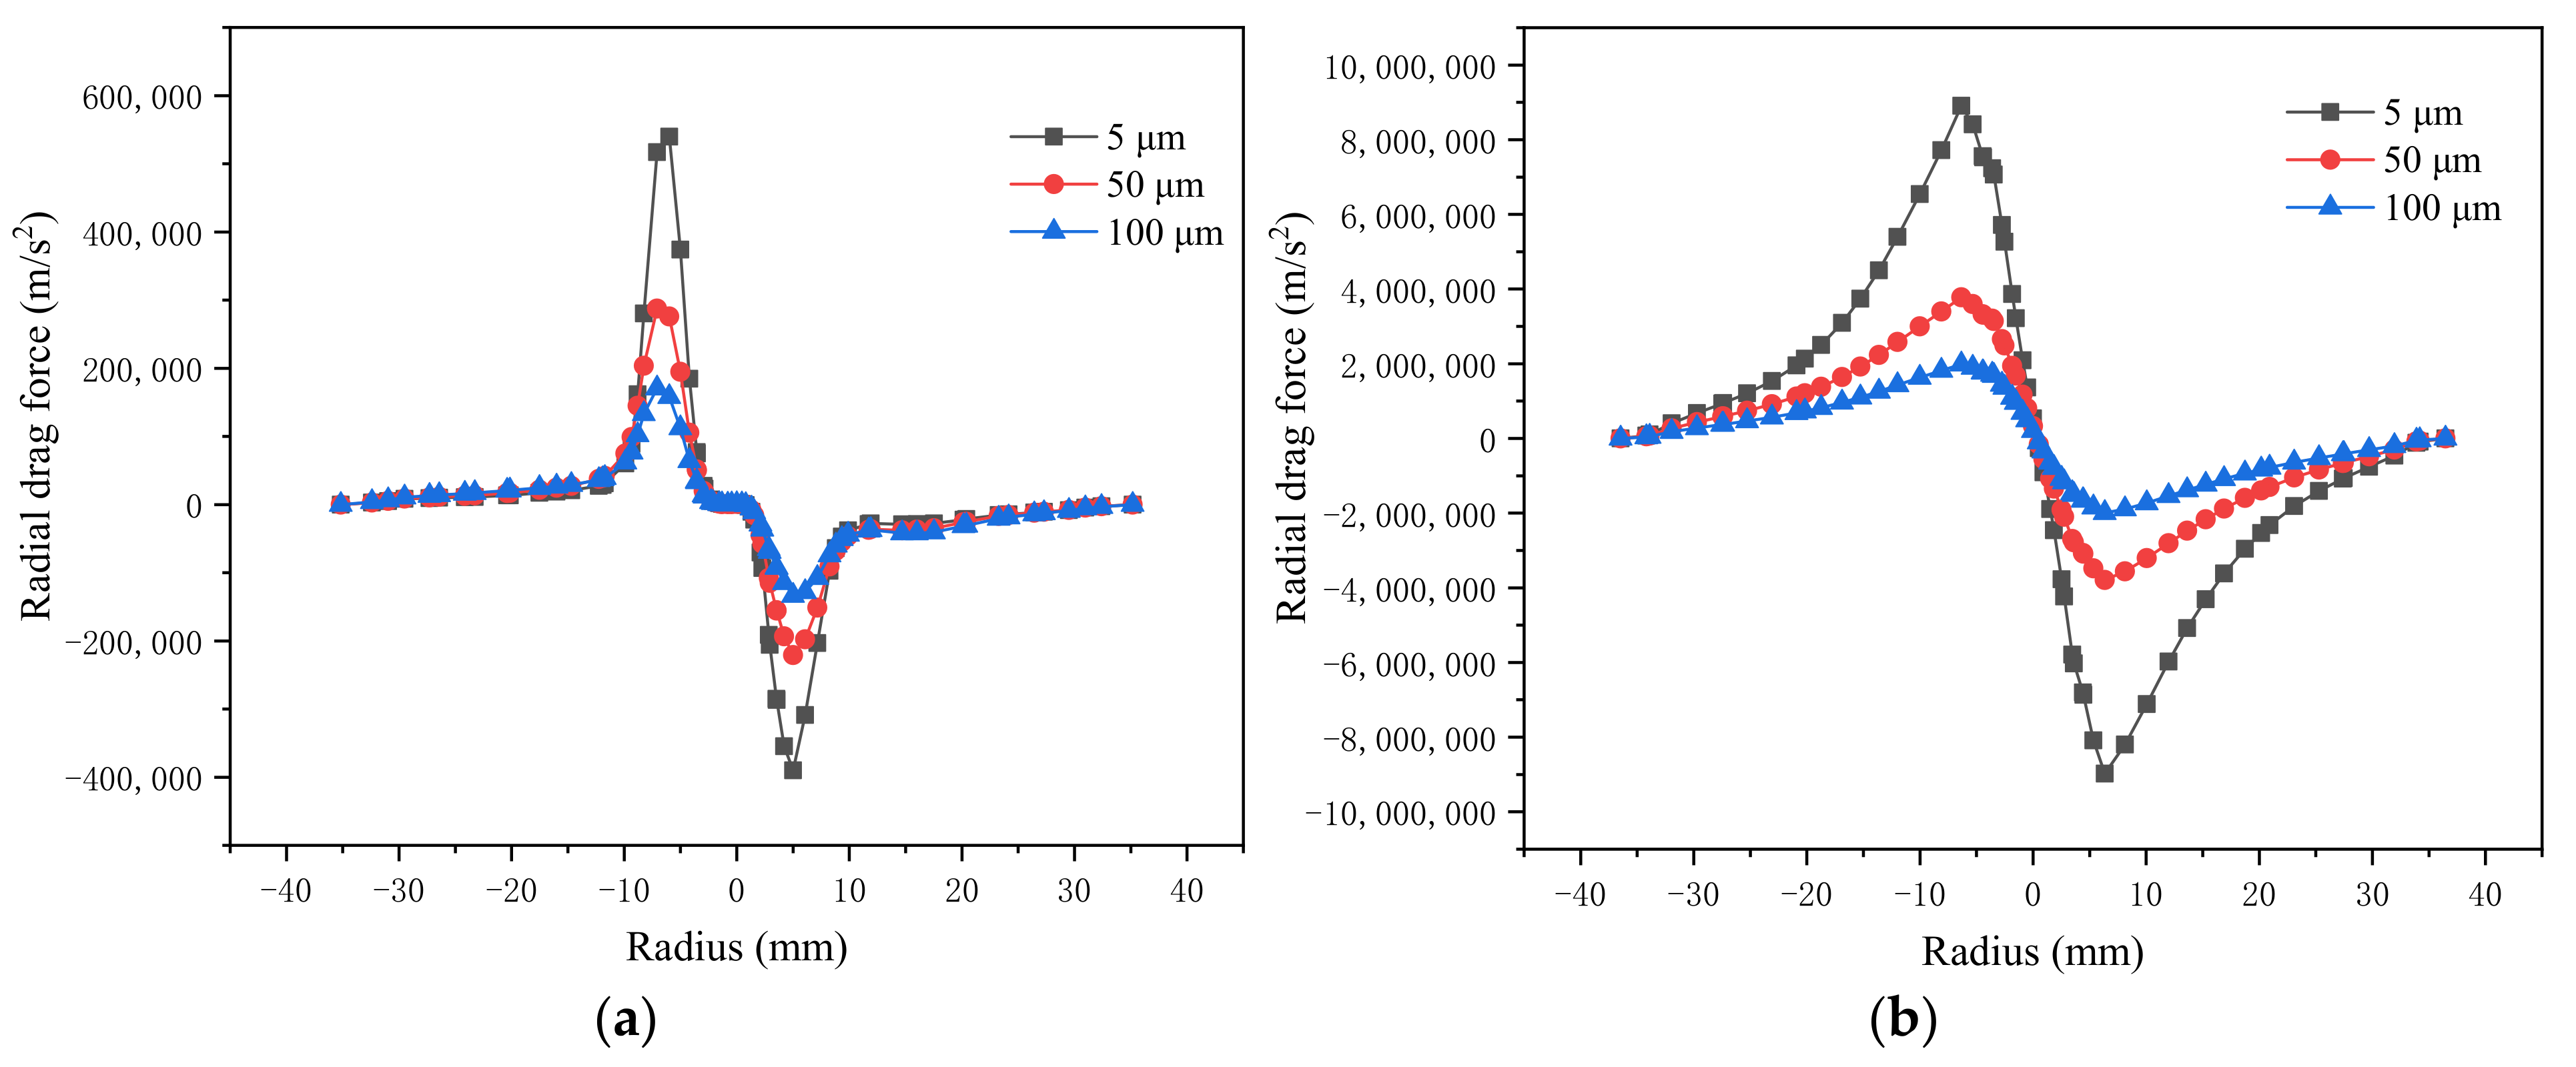
Figure 6 shows the distribution of the radial drag force on the particles. Comparing the forces at Z = 50 mm and Z = 100 mm, it is observed that the radial drag force reaches an order of magnitude of up to 106, and it is up to 8.9 × 10⁵ times the gravity, while its effect on the particles is much larger than that of the centrifugal inertia and pressure gradient forces. In addition, it is found that the radial drag force of the particles exponentially decreases with increasing particle size. At the axial position of Z = 100 mm, the radial drag force of the 5 μm particles reaches 8.9 × 10⁶ m/s2, and as the particle size increases to 100 μm, the radial drag force decreases to 1.9 × 10⁶ m/s2. The radial drag force of the particles gradually decreases with decreasing axial position.
Combined with the centrifugal inertia, radial drag and pressure gradient forces, it is observed that the particles are mainly dominated by the fluid drag force along the radial direction. At the axial position of Z = 100 mm, the combined forces on the various particle sizes are notably different along the radial direction, which is the main force driving particle motion according to the particle size classification and is the main region of particle separation motion, while at the axial position of Z = 50 mm, except for the central region, the forces on the different particle sizes do not vary much, and the radial separation motion of the particles is weakened at this position.
- (2)
- Effect of the Particle Size on the Axial Force
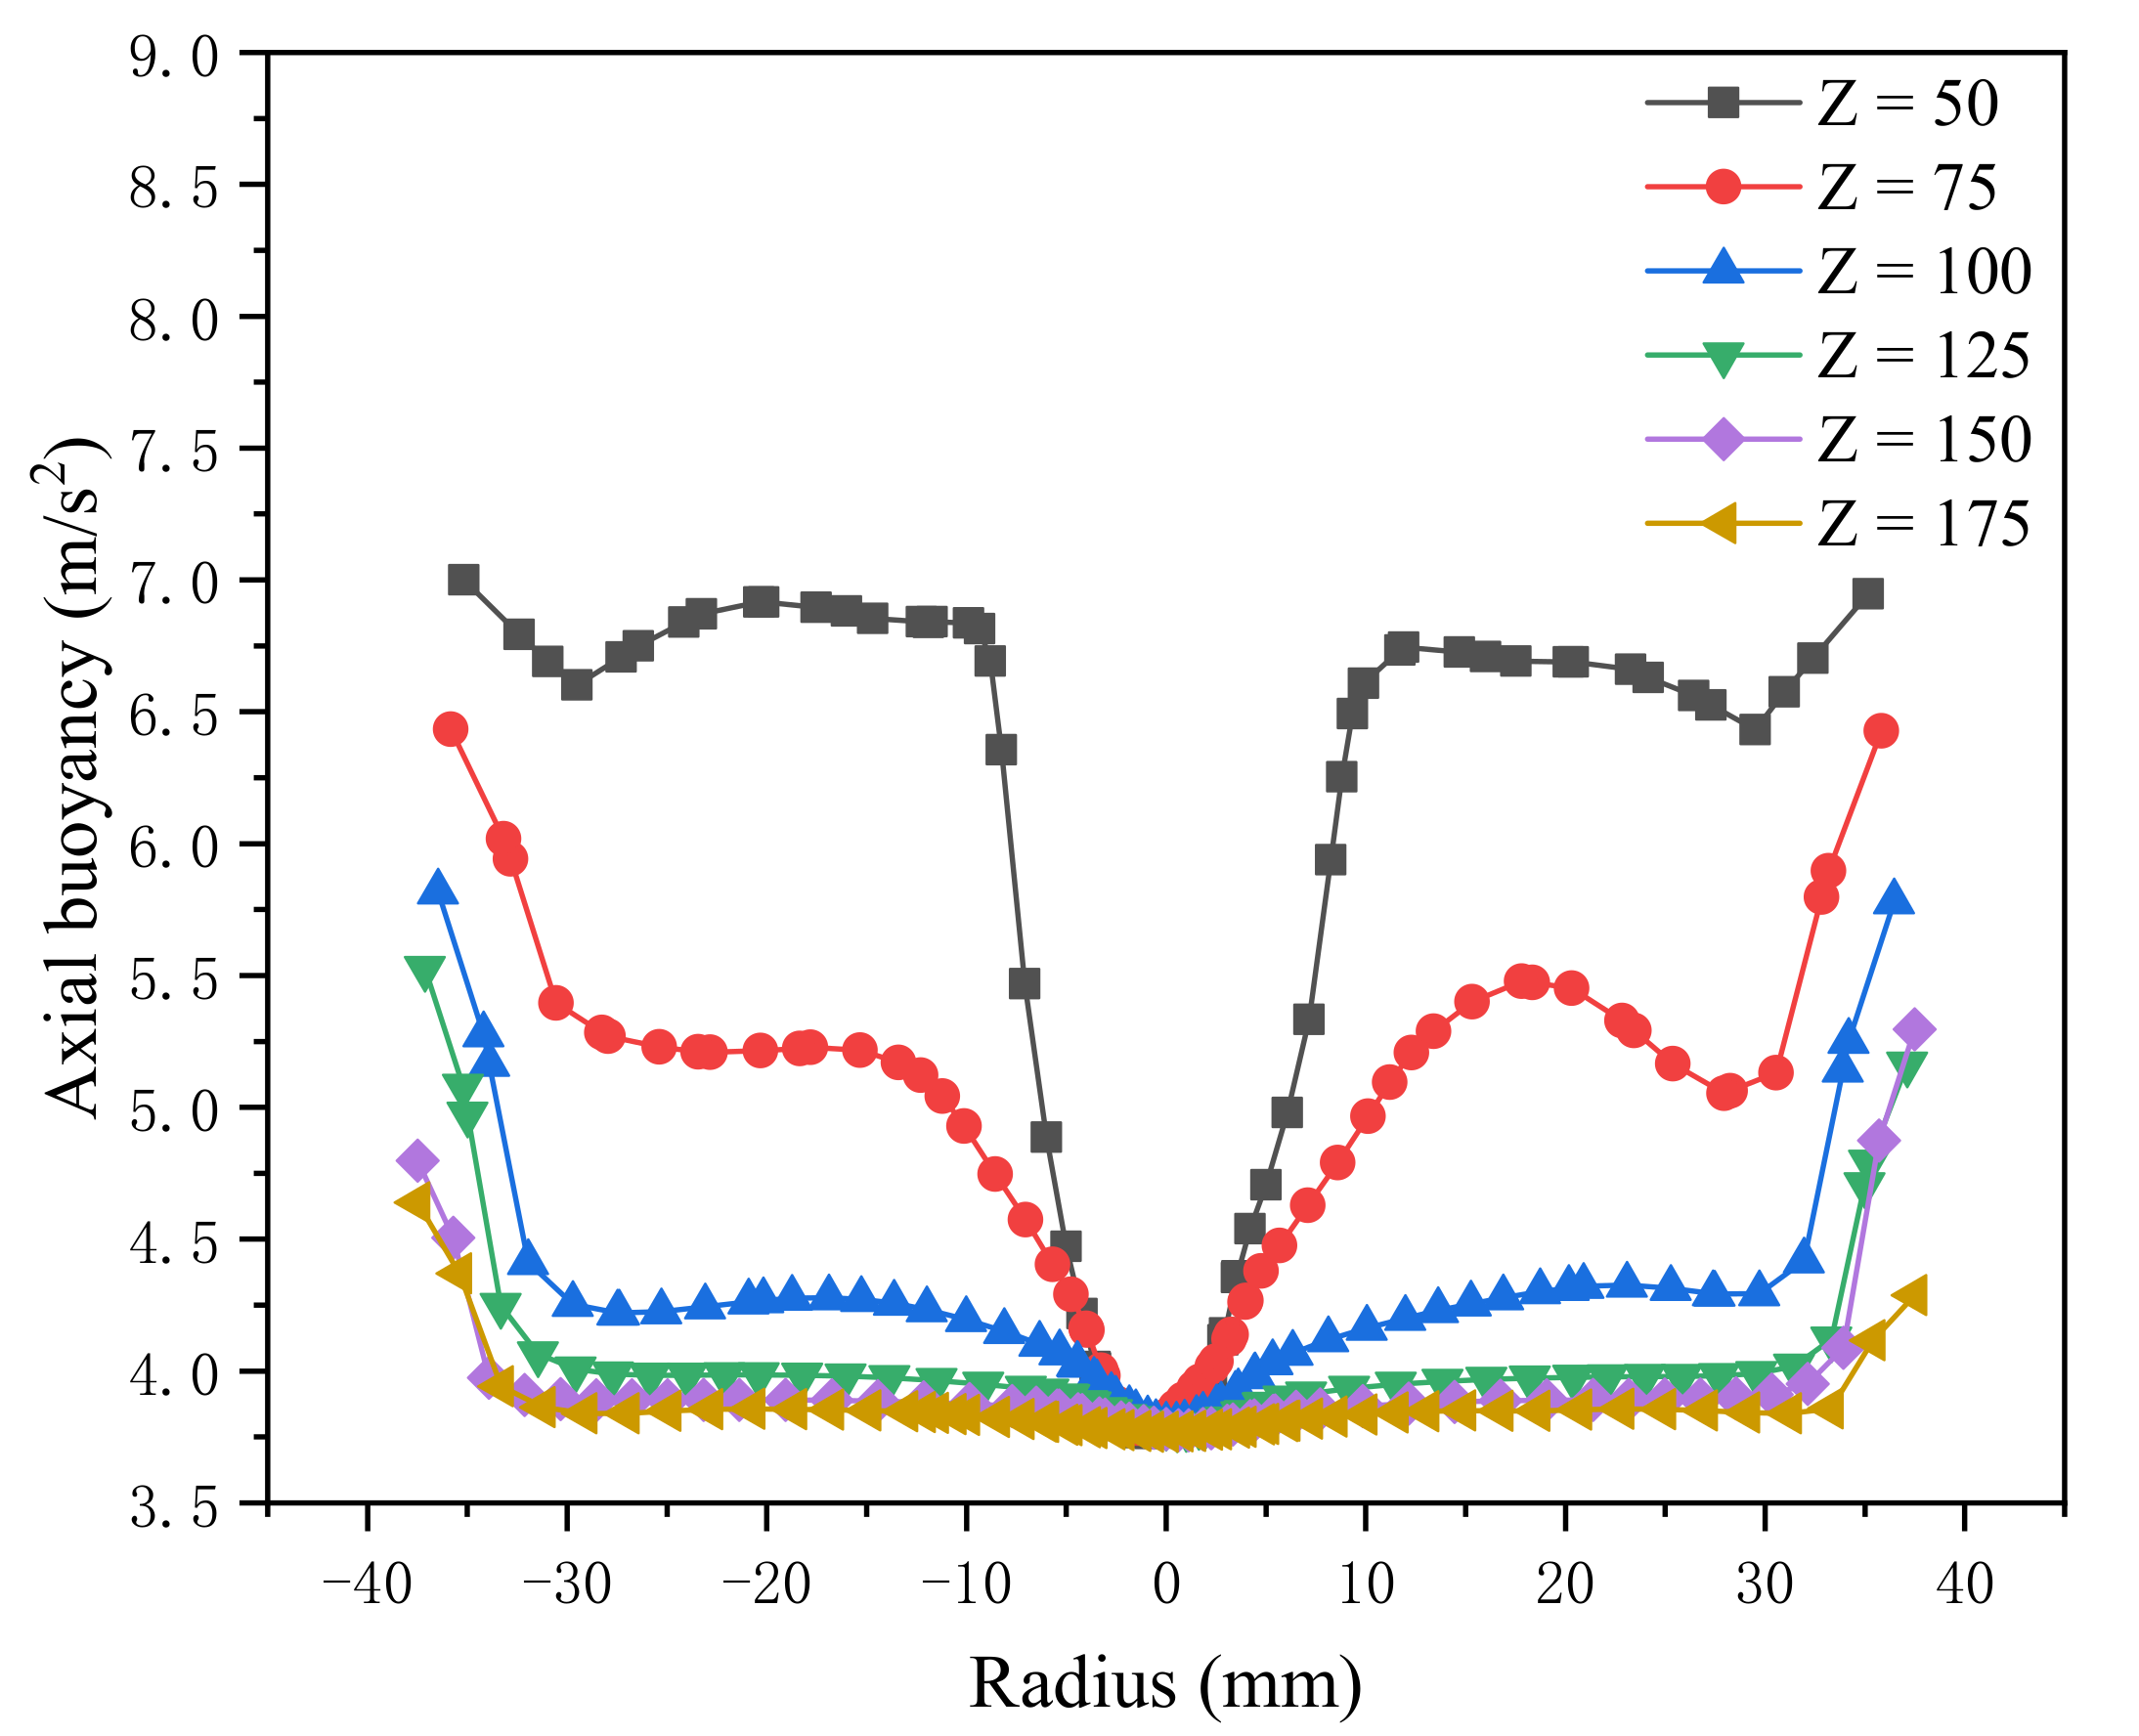
The solid particles along the axial direction are mainly affected by the gravity, buoyancy and fluid drag forces, and the axial variation in the pressure is very small, as revealed in a previous paper [10], so the axial pressure gradient force may be basically neglected. The buoyancy force on the particles is analyzed, and the results are shown in Figure 7. The buoyancy acceleration is not highly related to the particle size but is mainly affected by the slurry density at a given location and the particle density. It is found that the buoyancy force gradually increases along the axial direction with decreasing axial position and gradually decreases along the radial direction with decreasing radius. This is related to the aggregation state of the particles inside the W-shaped hydrocyclone, and most of the particles move towards the sidewall and apex. Especially near the apex, due to the W-shaped structure, the buoyancy force on the particles tends to decrease first, then increase and finally decrease.
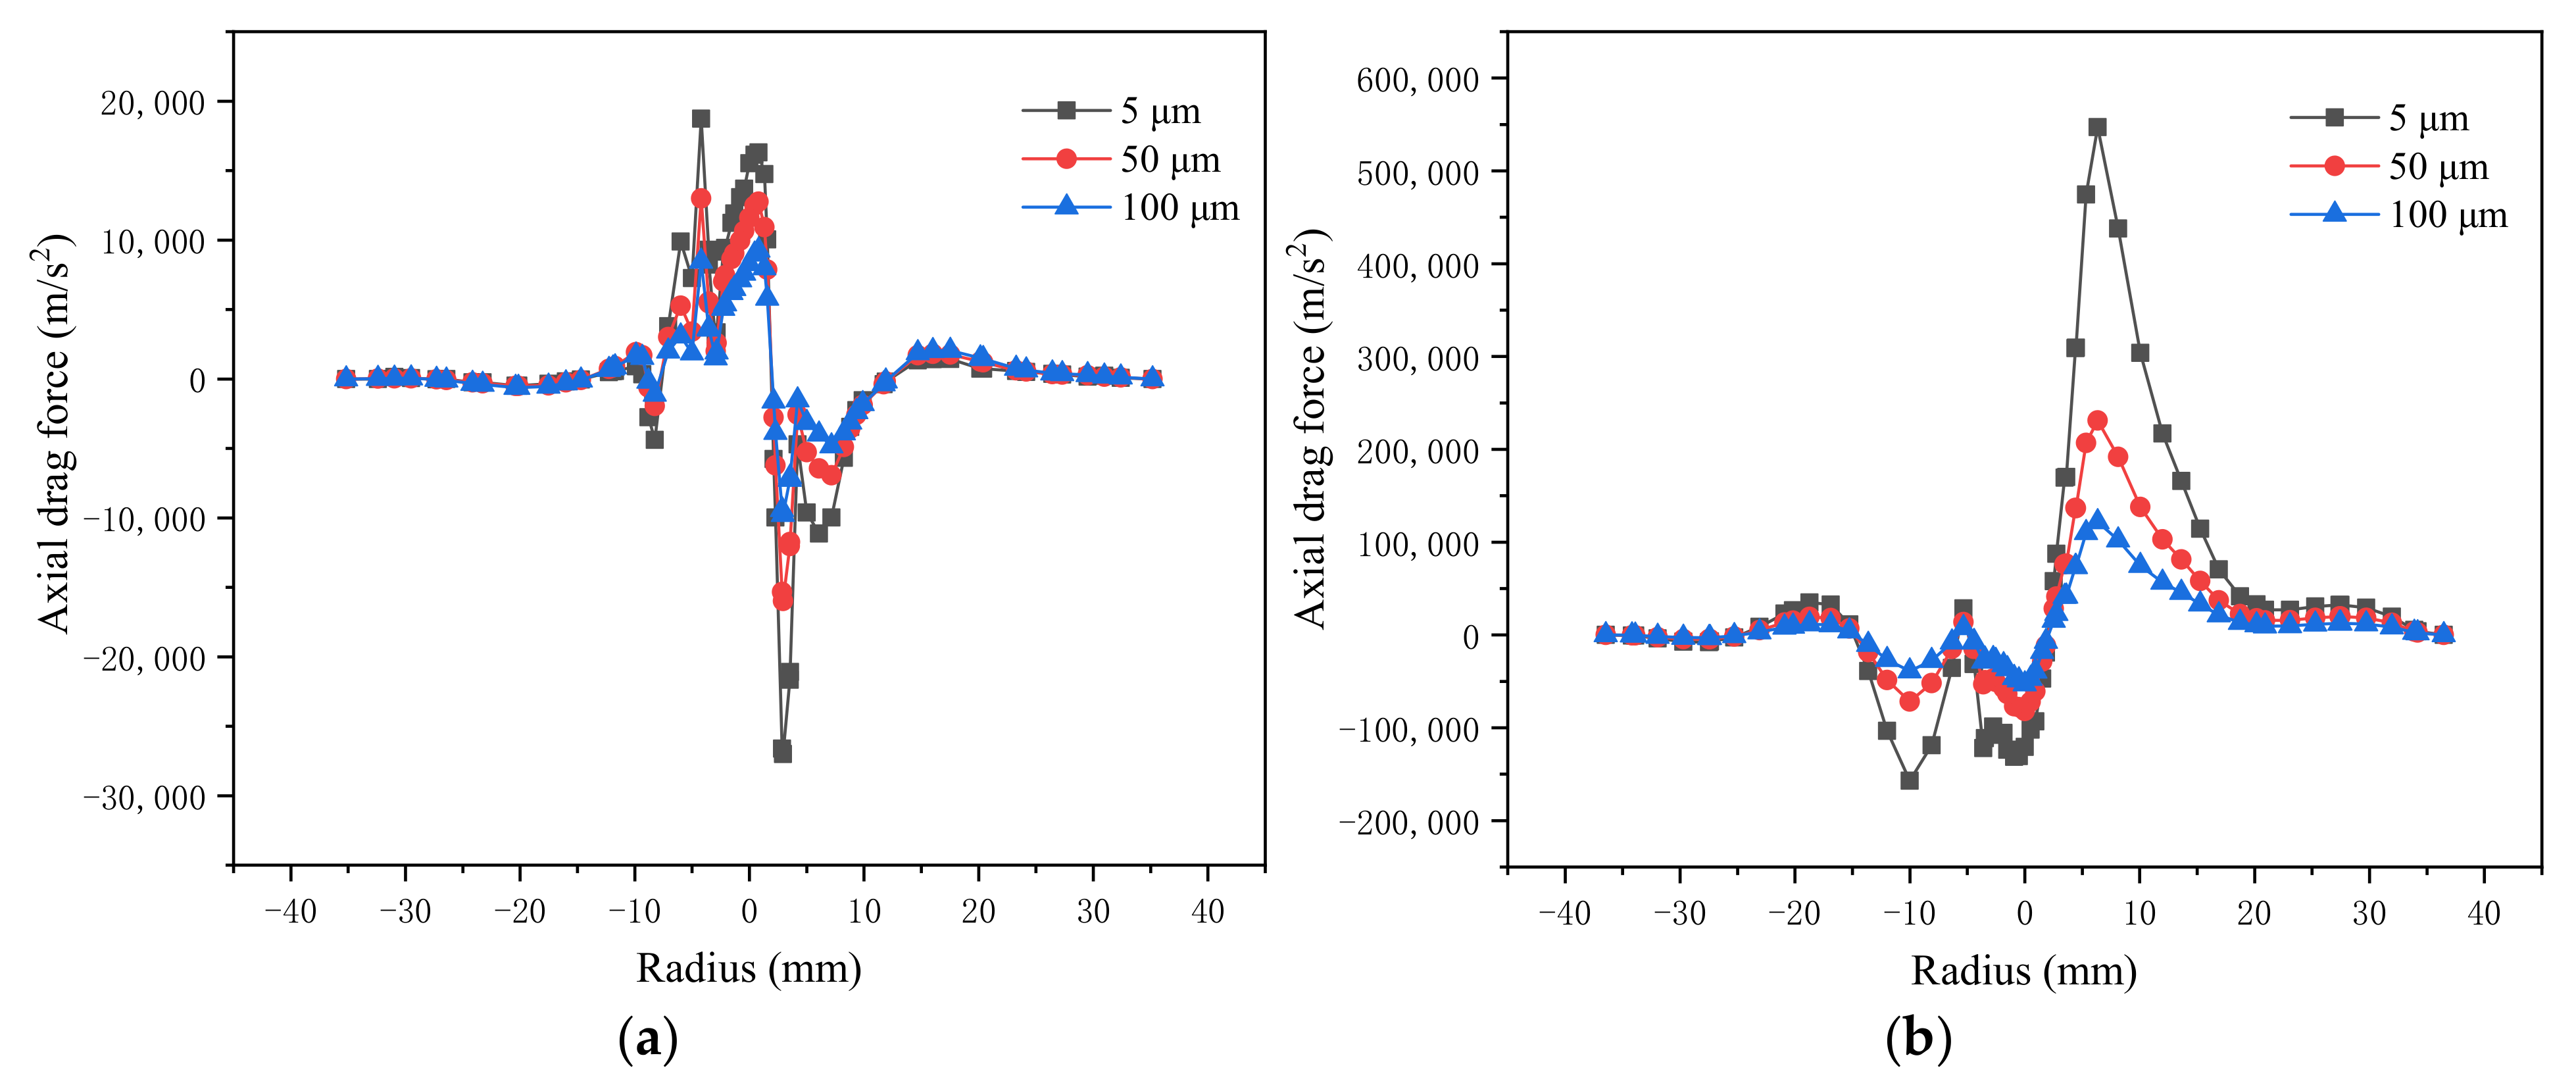
Figure 8 shows the effect of the particle size on the axial drag force. The particles are subjected to positive and negative axial drag forces, and the order of magnitude reaches 105, which is much larger than that of the buoyancy and gravity forces of the particles. Therefore, the particles are mainly subjected to the action of fluid drag in the axial direction. Moreover, similar to the radial drag force, the axial drag force acting on the particles also greatly decreases with increasing particle size. With decreasing axial position, the axial drag force acting on the particles gradually decreases, and at the axial position of Z = 50 mm, the axial drag force decreases to an order of magnitude of 102, at which time the buoyancy and gravity forces of the particles gradually increase. Here, the sign of the axial drag force value changes frequently, and multiple zero points occur, which demonstrates that the axial movement of the particles at this position is intense. Under the action of the W-shaped structure, the particles at this position are repeatedly eluted, thus reducing the amount of fine particles trapped in the underflow.
3.1.2. Effect of the Particle Density on the Forces Acting on the Particles
- (1)
- Effect of the Particle Density on the Radial Force
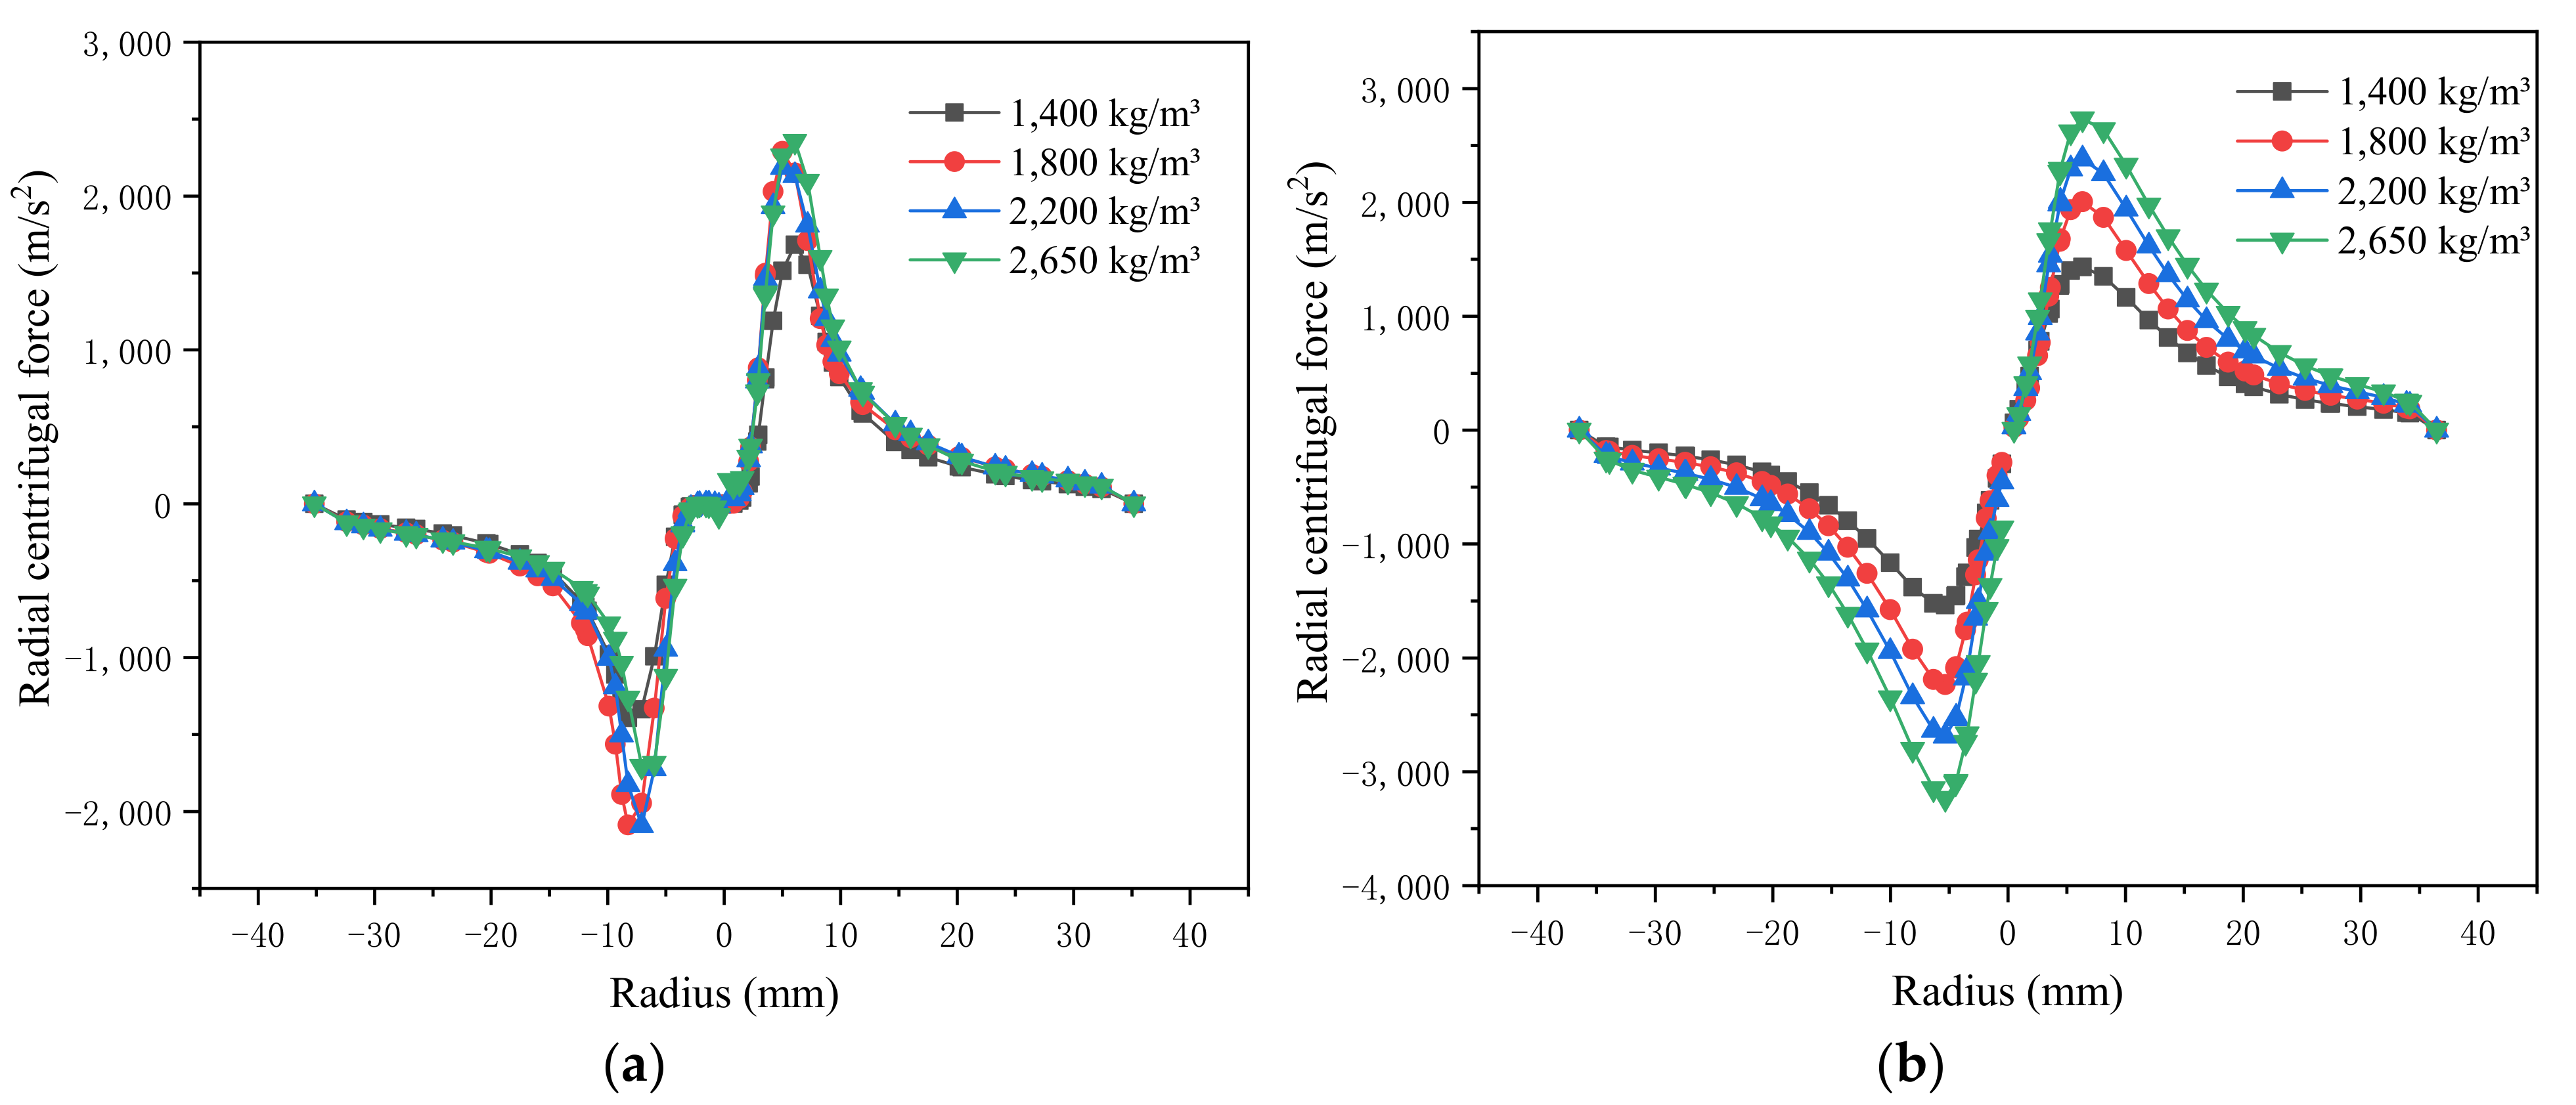
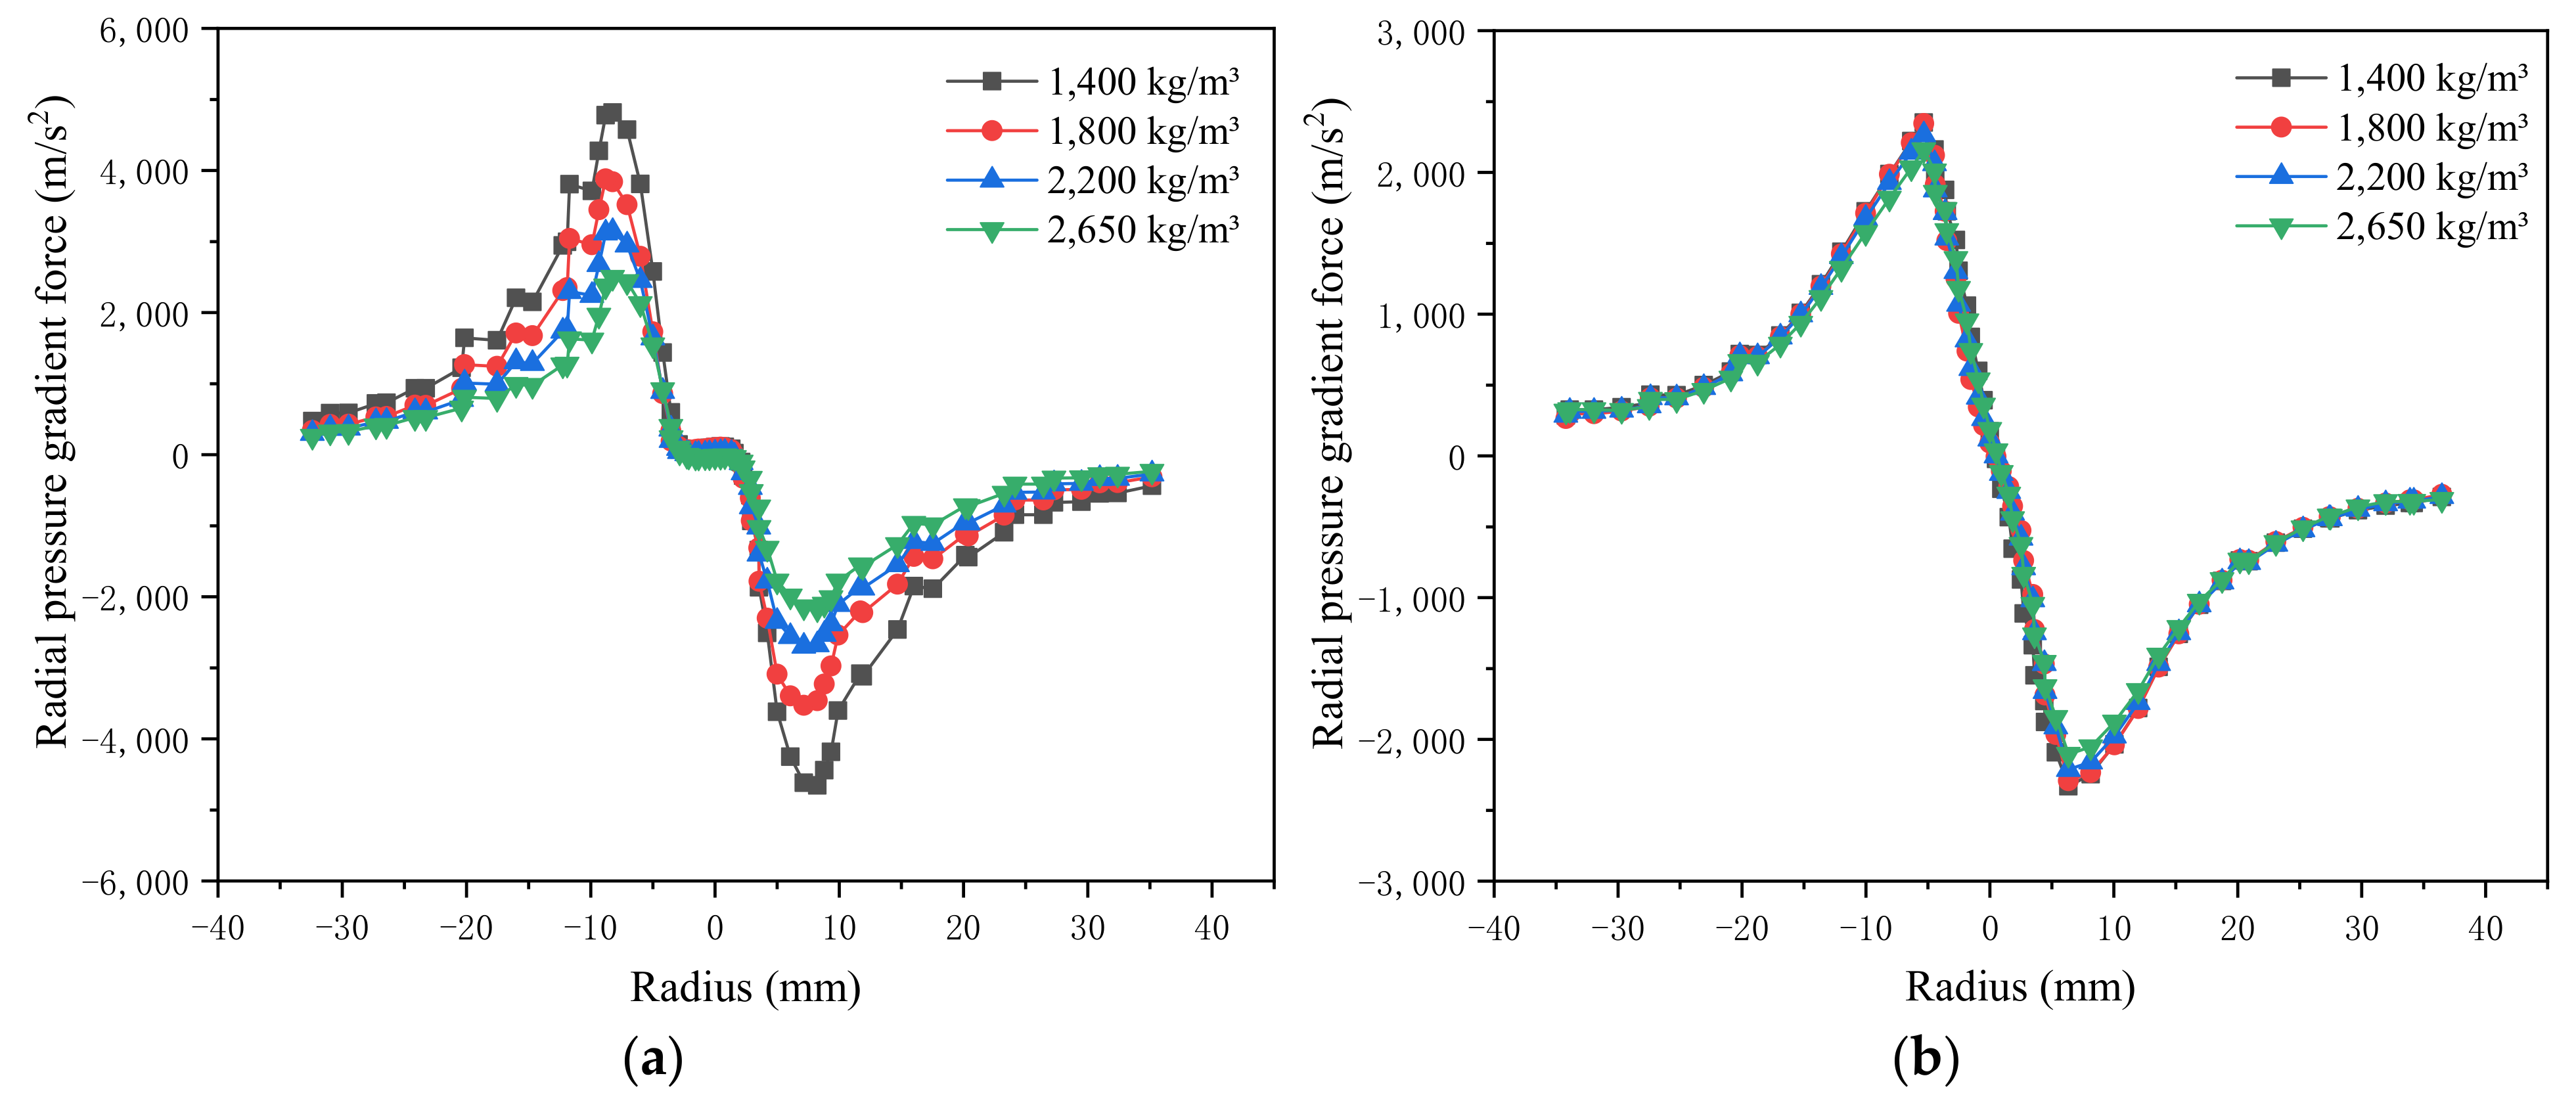
Figure 9 shows the effect of the particle density on the radial centrifugal force of the particles, and it is found that the radial centrifugal force reaches an order of magnitude of 103. The radial centrifugal force at the axial position of Z = 100 mm gradually increases with increasing particle density, and its numerical distribution interval decreases from (250, 2750) to (150, 1450) as the particle density decreases from 2650 to 1400 kg/m3. At the axial position of Z = 50 mm, the particle density variation does not impose a major effect on the radial centrifugal inertia force. As shown in Figure 10, the pressure gradient force on the particles also reaches an order of magnitude of 103, but in contrast to the centrifugal inertia force, the pressure gradient force at Z = 100 mm is basically unaffected by the change in particle density. At Z = 50 mm, it gradually decreases with increasing particle density, and the distribution interval of the force values decreases from (450, 4850) to (250, 2200) as the particle density increases from 1400 to 2650 kg/m³.
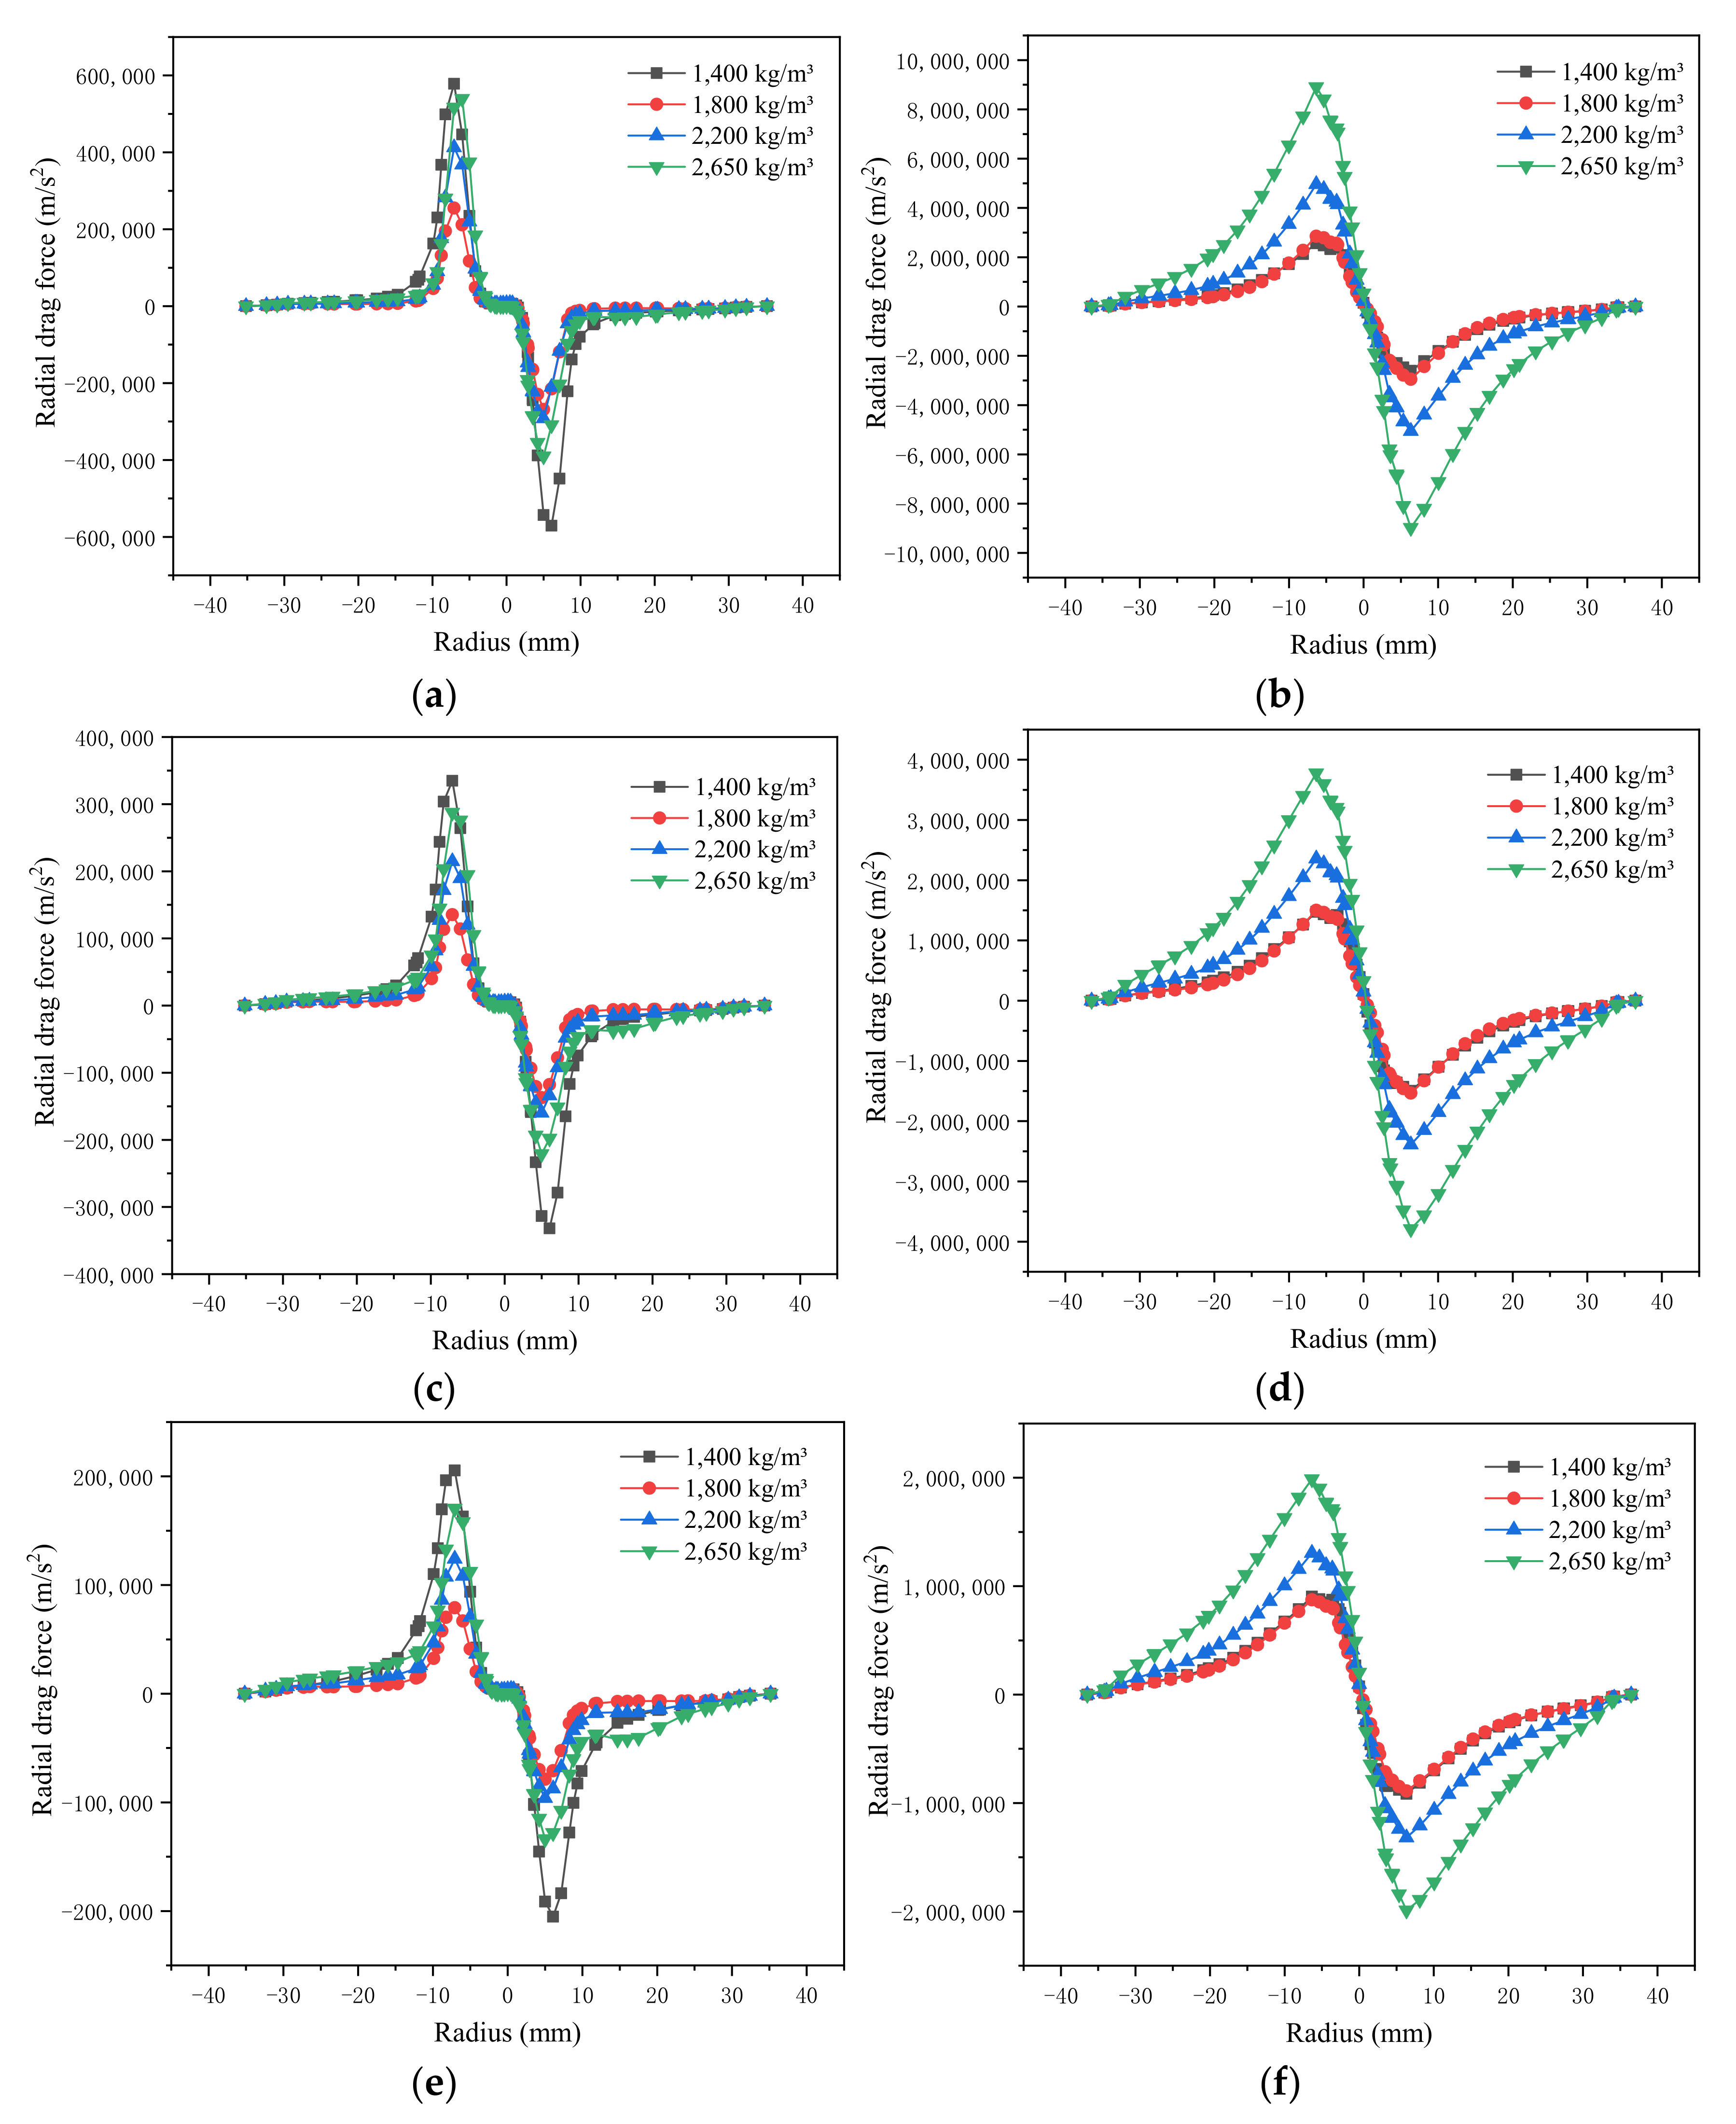
Figure 11a,b shows the distribution of the radial drag force for the 5 μm particles of the different densities, and it is observed that the maximum radial drag force reaches an order of magnitude of 106. At the position of Z = 100 mm, the distribution area of the radial drag force values basically is (3 × 10⁶, 9 × 10⁶), and the radial drag force values are much higher than the centrifugal inertia and pressure gradient forces, while the 5 μm fine particles are mainly subjected to fluid drag forces. With increasing particle density, the radial drag force gradually increases. However, at Z = 50 mm, the radial drag force decreases rapidly, and its value is only of an order of magnitude of 103. Moreover, the fluid drag force weakens, and the pressure gradient and centrifugal inertia forces become increasingly notable.
Figure 11c,d shows the radial drag force distribution of the 50 μm particles for the different densities, and the distribution pattern is basically the same as that of the 5 μm particles, while the radial drag force of the 50 μm particles gradually decreases with decreasing particle density. At the Z = 100 mm position, the value distribution decreases from (6 × 10⁴, 4 × 10⁶) to (2 × 10⁴, 1.5 × 10⁶), and the radial drag force of the 50 μm particles is much lower than that of the 5 μm particles. At Z = 50 mm, the radial drag force of the 50 μm particles also decreases to an order of magnitude of 103. The radial drag force distribution is obviously different between the different densities, and it also gradually decreases with decreasing particle density. The radial drag force of the 100 μm particles further decreases, as shown in Figure 11e,f, and the corresponding value distribution interval is (5 × 10⁴, 2 × 10⁶) at the Z = 100 mm position, while the main distribution interval is (3 × 10³, 2 × 10⁴) at the Z = 50 mm position. Moreover, the effect of the particle density on the radial drag force becomes more obvious at the Z = 50 mm position.
- (2)
- Effect of the Particle Density on the Axial Force
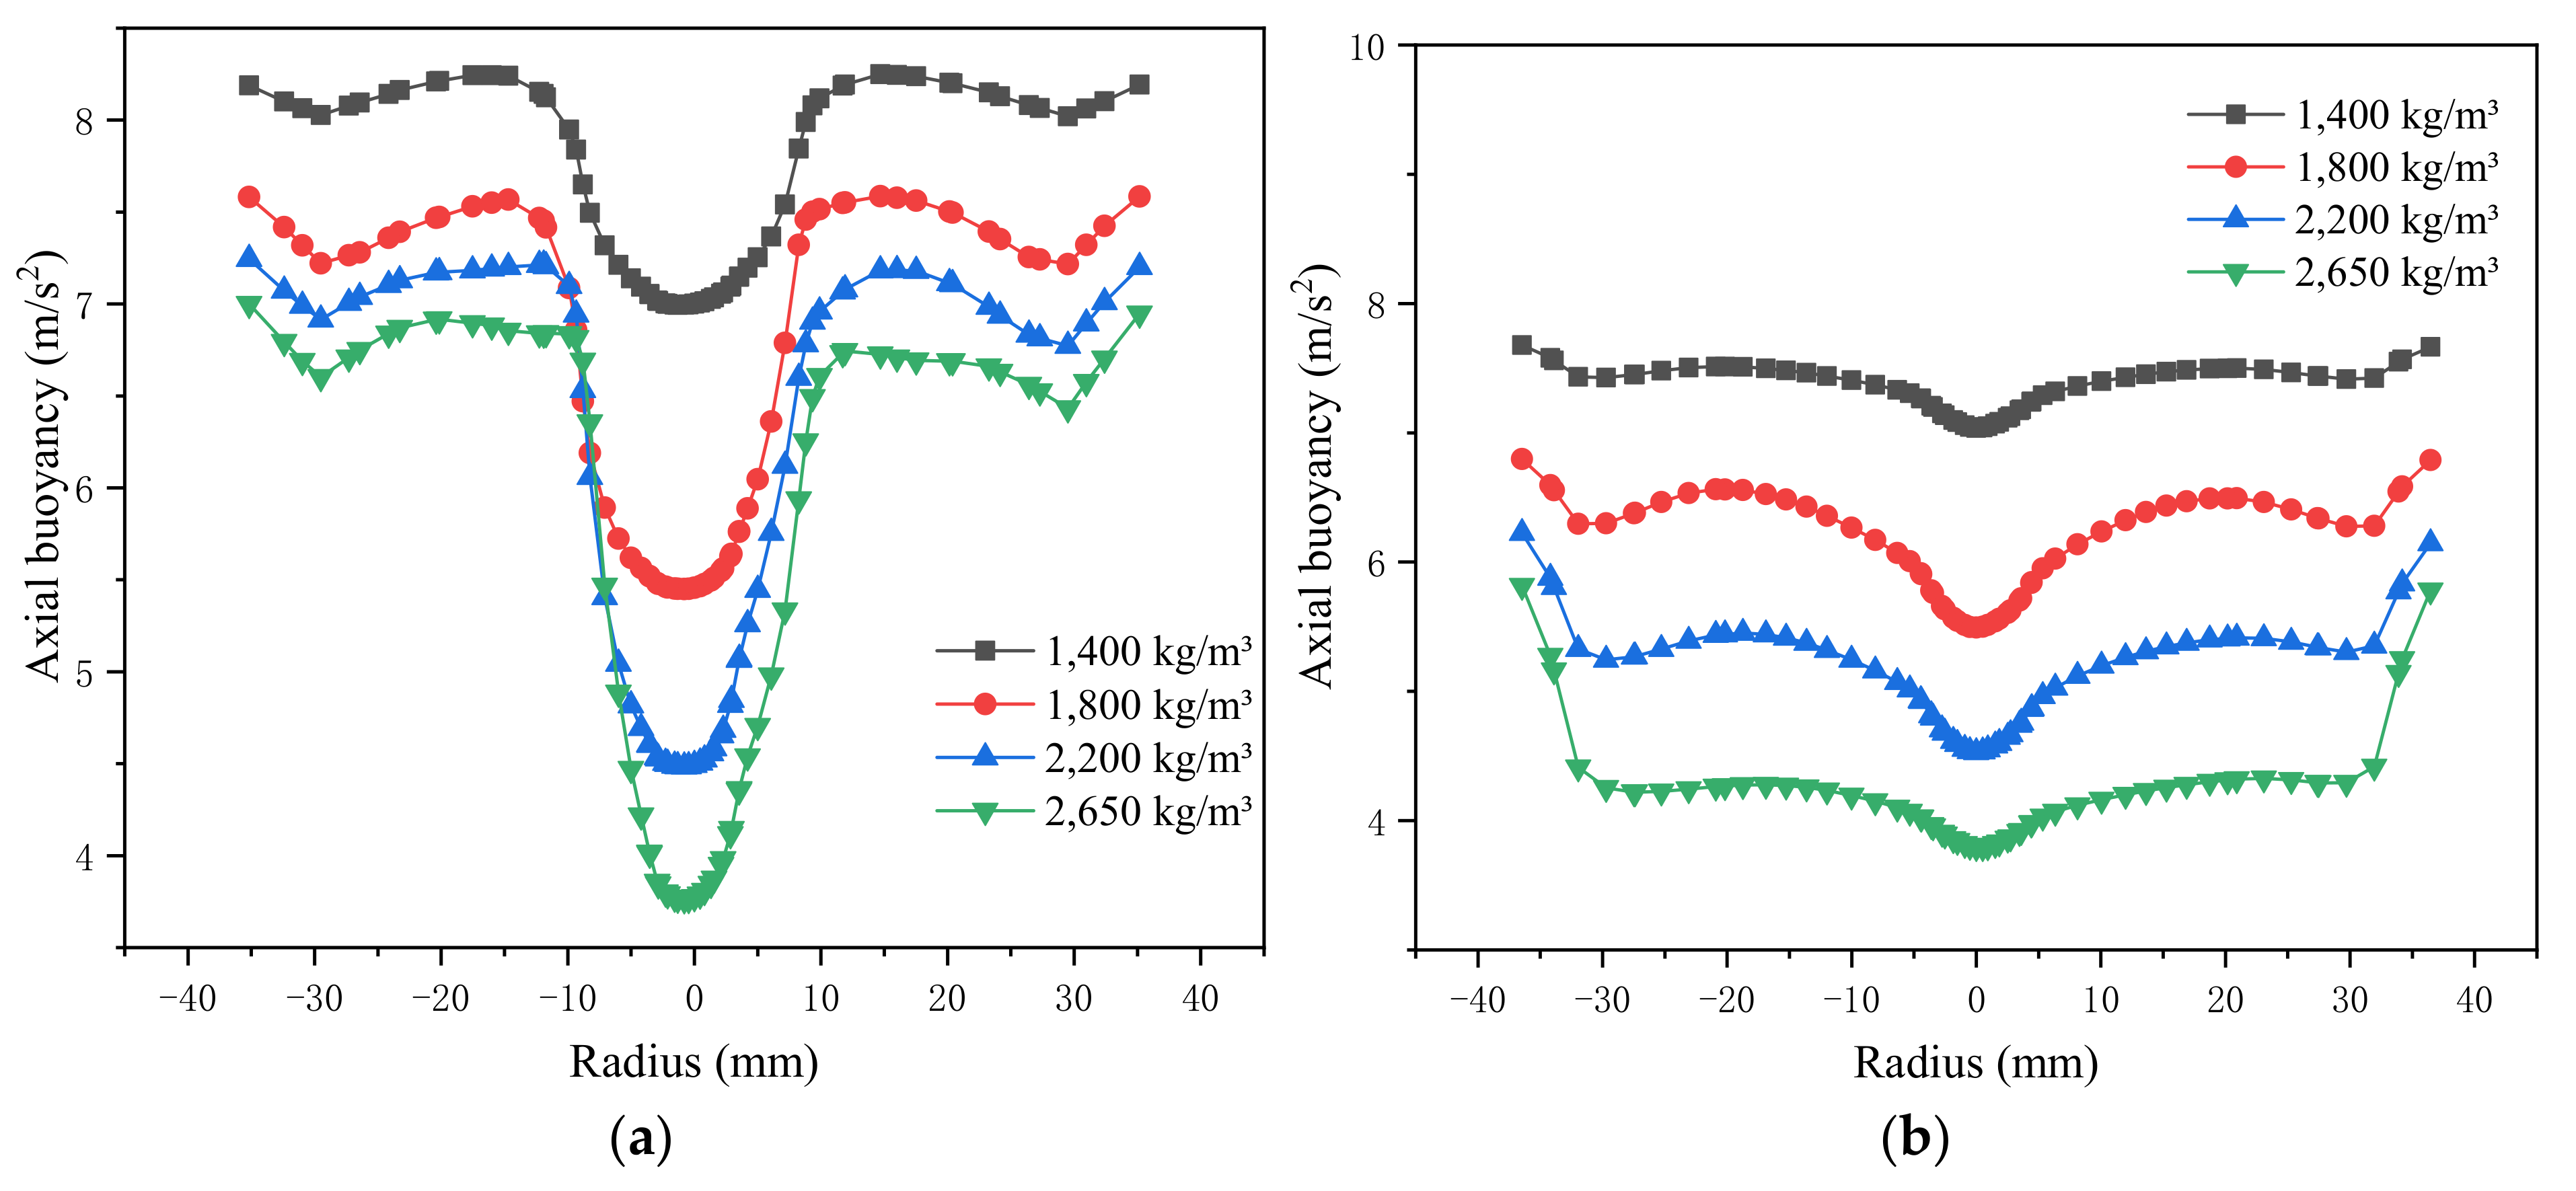
Figure 12 shows the effect of the different particle densities on the axial buoyancy acceleration. It is found that the lower the particle density is, the higher the buoyancy acceleration of the particles. At the axial position of Z = 100 mm, the axial buoyancy force gradually decreases with decreasing radius, but the change is small. At Z = 50 mm, the variation in the axial buoyancy force is large in the radial direction. Comparing the Z = 100 mm and Z = 50 mm positions, it is observed that the axial buoyancy of the particles of the same density sharply rises with decreasing axial position, and this change is related to the change in the slurry density at the position of these particles. When the solid- and liquid-phase densities are known, the density of the slurry composed of both phases is related to their content ratio, and the slurry density is directly related to the liquid–solid ratio of the slurry. The slurry density distribution in a conventional column cone hydrocyclone is a V-shaped distribution, with a low center and high sidewalls. Under the action of the unique W-shaped structure, the slurry density distribution in the W-shaped hydrocyclone first decreases and then increases along the radial direction towards the center and finally sharply decreases at the center of the hydrocyclone.
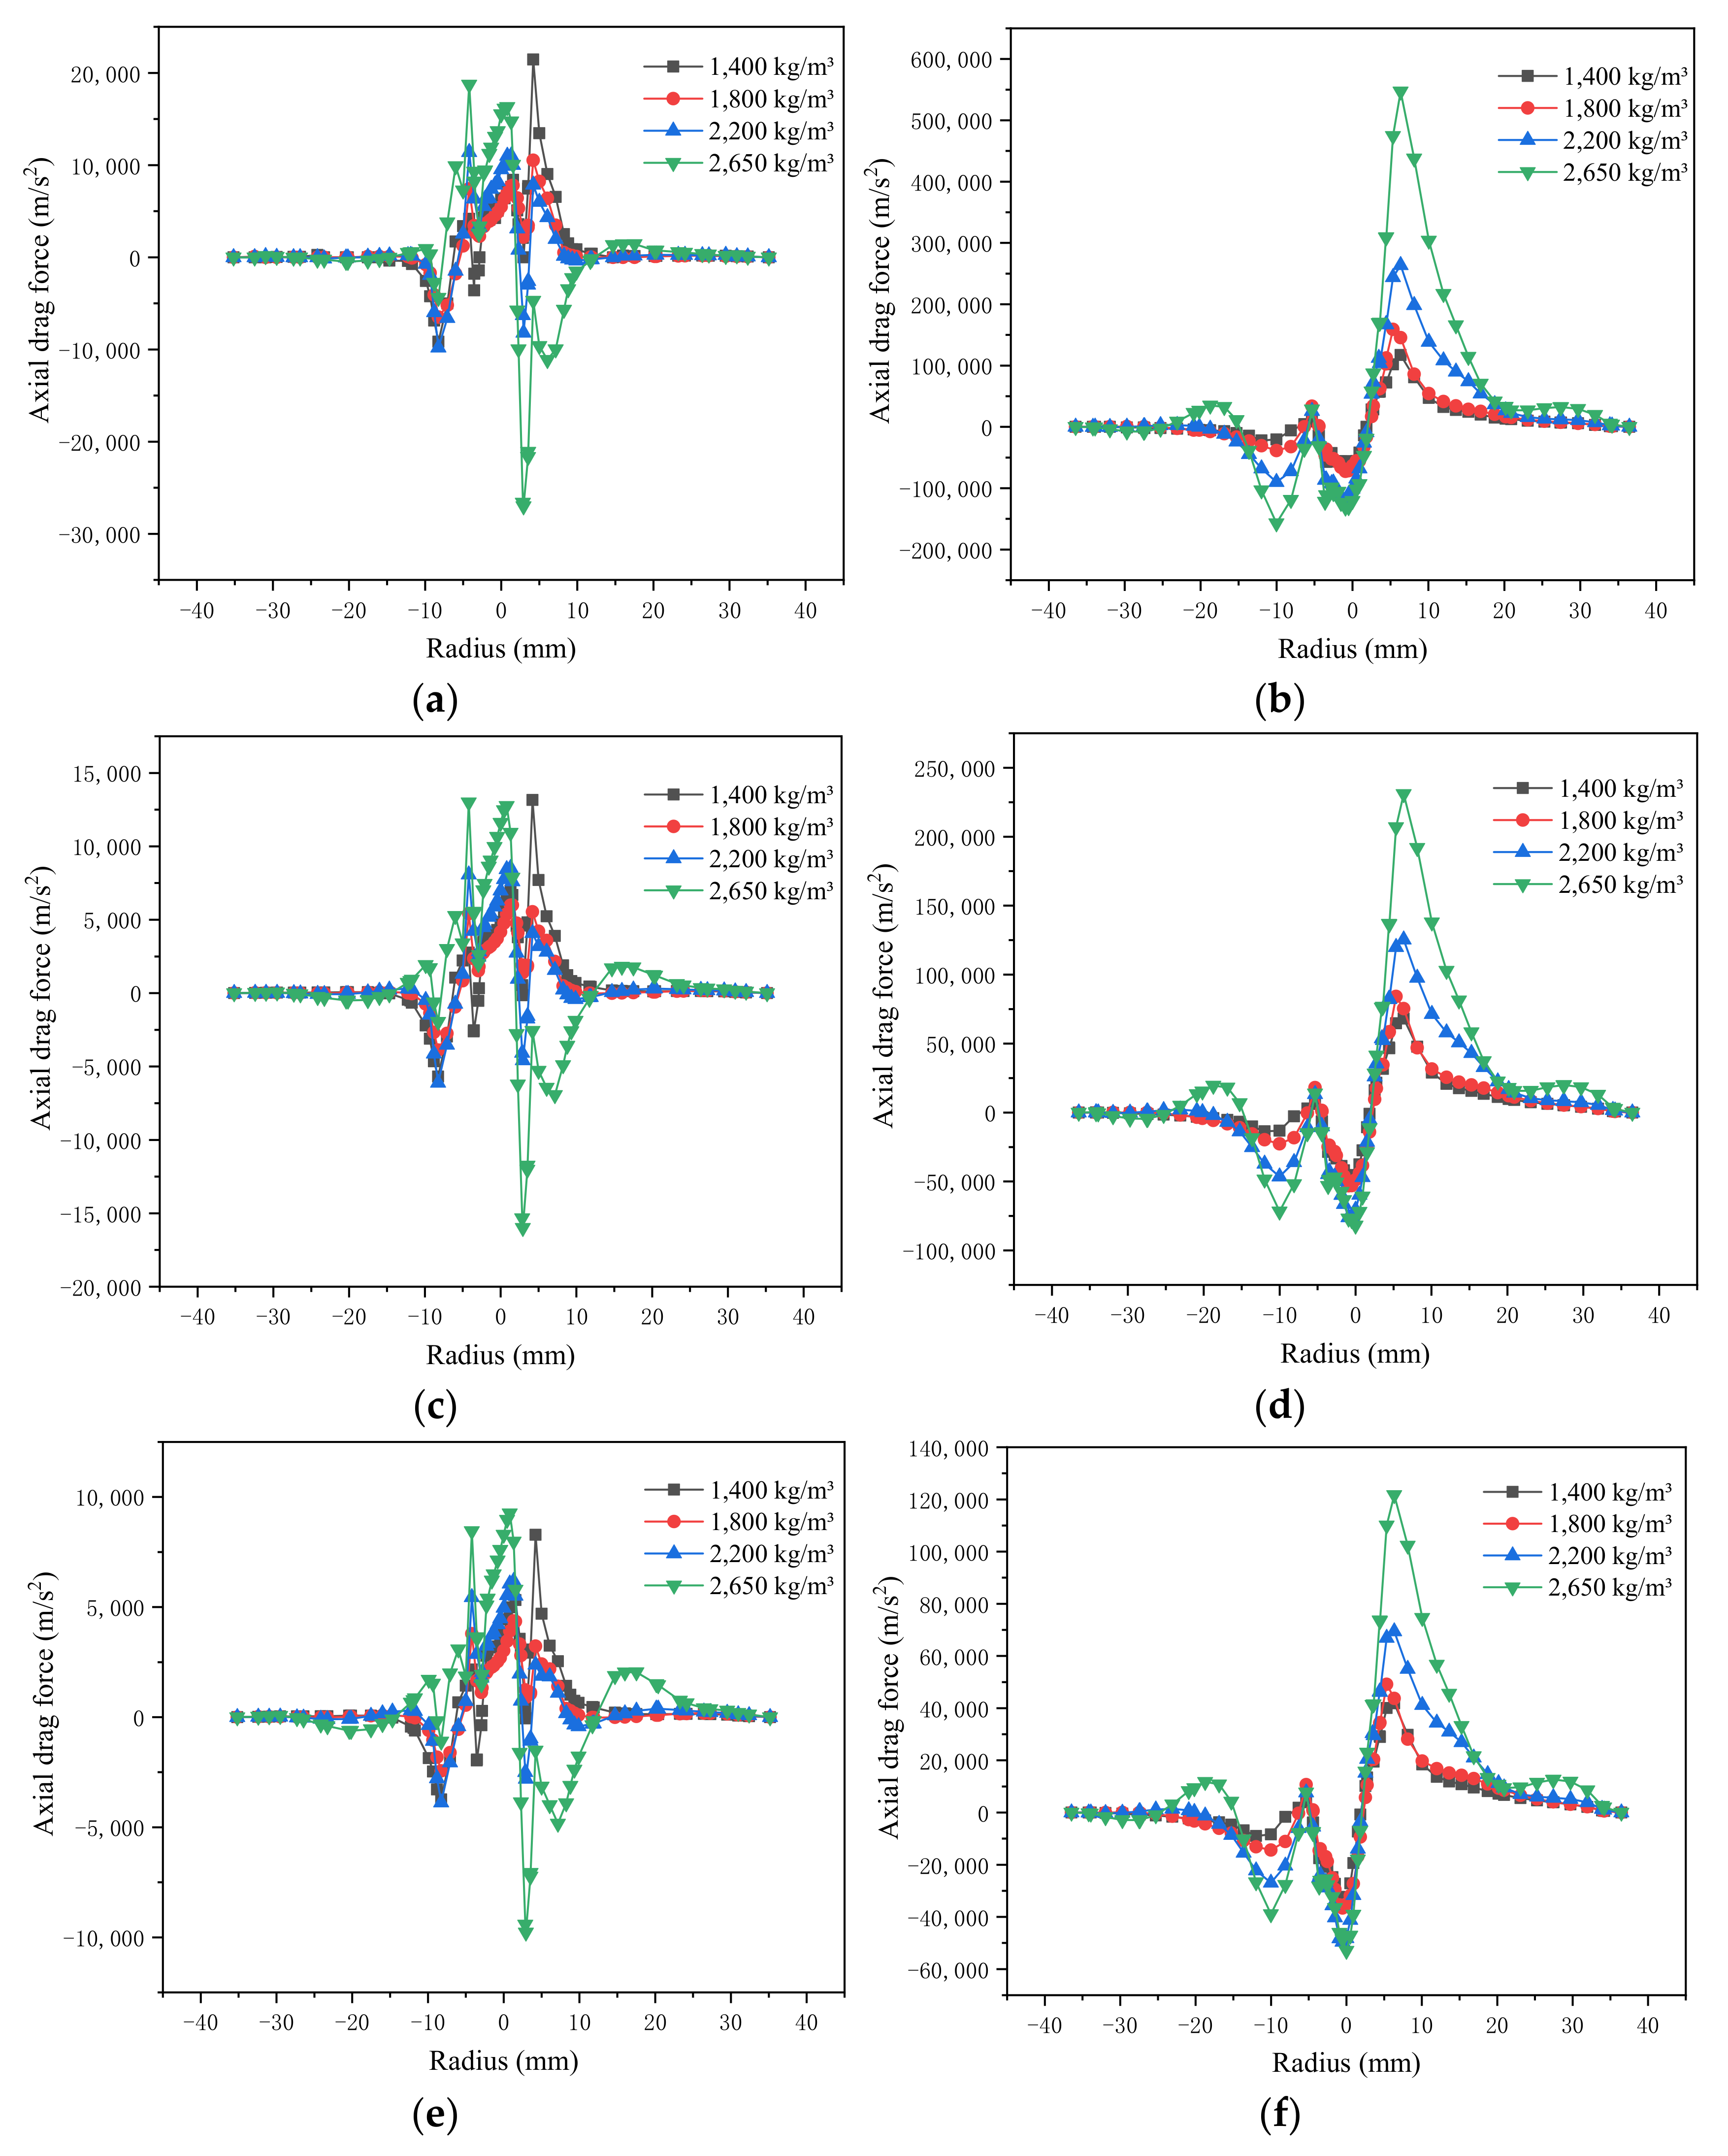
Figure 13 shows the effect of the axial drag force on the particles for the different densities. In regard to the 5 μm particles, the axial drag force is lower than the radial drag force, and the magnitude only reaches 105 at Z = 100 mm, which is 10 times smaller than that of the radial drag force. Moreover, it is found that the particle axial drag force increases with increasing particle density. When the particle density is 2650 kg/m³, the axial drag force is high, and the values are mainly distributed in (3 × 10⁴, 5.5 × 10⁶). When the particle density decreases to 1400 kg/m³, the axial drag force substantially decreases, and the values are mainly distributed in (7 × 10³, 1 × 10⁶). In particular, at a particle density of 1400 kg/m³, the difference between the particle force and that at 1800 kg/m³ is very small. This indicates that when the particle density is low, the difference in the fluid drag forces on the particles between the different densities is small, and separation becomes more difficult. At the Z = 50 mm cross-sectional position, it is determined that the axial drag force acting on the particles rapidly decreases, and the magnitude of its value in the region near the sidewall only reaches 102, indicating that the fluid motion decelerates at this position, a dynamic particle suspension layer is gradually formed, and gravitational and buoyancy effects on the particles occur. With decreasing distance from a particle to the center, the axial drag force of the particle exponentially increases, the maximum magnitude reaches 105, and the fluctuation is large. The sign of the force changes frequently, which indicates that the particle moves highly violently at this position, and this phenomenon is more obvious for coarse particles such as the 50 and 100 μm particles. This occurs because the fluid is guided by the W-shaped structure, turning upward, so that some of the particles also move upward to re-enter the internal cyclonic flow, while the contained coarse particles again move downward under the action of gravity, thereby forming a multiple recurrent circular flow. This multiple recurrent circulation flow within the particle suspension layer plays a washing role in the particle distribution, forcing any fine particles flowing into the apex area to return to the inner cyclone, thus reducing the entrainment of fine particles in the underflow.
3.2. Particle Movement Behaviour in the W-Shaped Hydrocyclone
The essence of particle movement is force imbalance, and the previous analysis reveals that the forces of the particles at the different radial and axial positions are also different, which inevitably leads to an unbalanced distribution of the particles inside the cyclone.
3.2.1. Effect of the Particle Size on Particle Movement Behavior
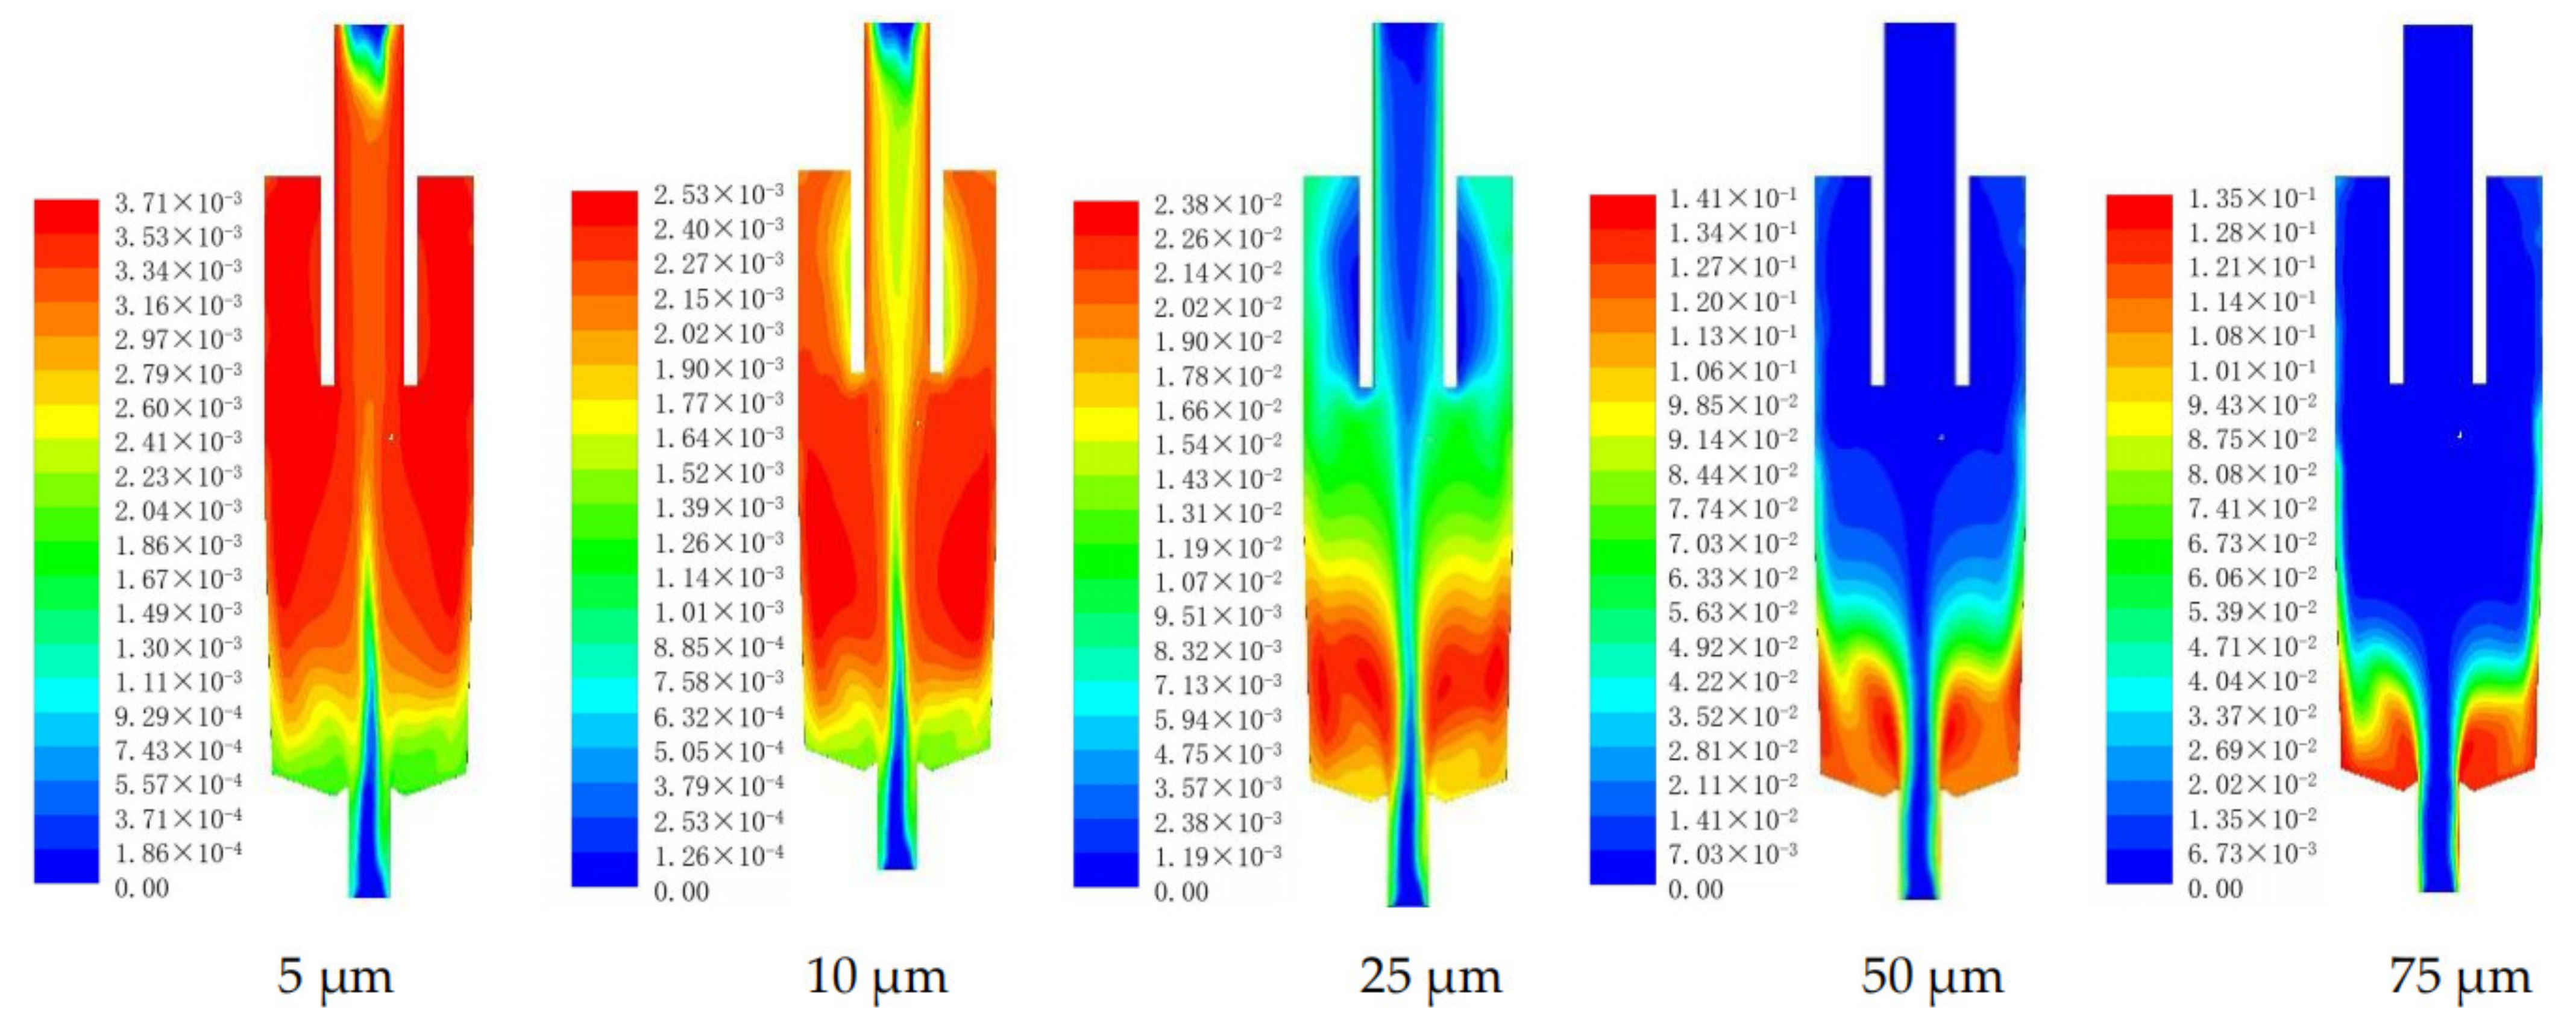
Figure 14 shows the distribution of the different particle sizes inside the W-shaped hydrocyclone, and because the total volume fraction of each particle size entering the hydrocyclone does not remain constant, a unified coordinate system comparison no longer applies, where red indicates particle aggregation and blue indicates particle sparseness. It is found that the 5 μm particles are the most widely distributed inside the hydrocyclone, mainly concentrated in the area away from the apex. Compared to the 5 μm particles, the 10-μm particles move downward and occur in the whole column section area. The 25 μm and 50 μm particles are largely concentrated in the lower area of the column section, and their distribution status is unique. In addition, a particle gathering area occurs at the center of the hydrocyclone, while the 75 μm particles are distributed at the bottom of the hydrocyclone, and the distribution pattern is similar to a W-shaped pattern.
The distribution of the particles with different sizes in the hydrocyclone along the axial and radial directions was determined, and the results are shown in Figure 15. The volume fraction distribution patterns of the 1 μm and 5 μm particles are relatively consistent, both gradually decreasing with decreasing axial position, but the change in volume distribution along the radial direction is not obvious. As demonstrated in the previous section, fine particles are subject to an extremely high fluid drag force, indicating that it is difficult for these fine particles to overcome the fluid resistance and freely move. In contrast, they are forced to only follow the fluid movement, so there is no obvious separation in the radial direction. At the axial positions of Z = 100–175 mm, the volume fraction of the fine particles tends to decrease with decreasing axial position, but this phenomenon is not obvious. At axial positions Z = 75 mm and Z = 50 mm, the content of fine particles considerably decreases, which indicates that the unique effect of the W-shaped structure ensures that the fine particles move away from the apex, thus reducing the probability of fine particles entering the underflow. The volume content of the 10 μm particles in the axial direction first slowly increases with decreasing axial position and then sharply decreases near the middle of the column section, while the volume fraction of the 25 μm particles gradually increases with decreasing axial position and then decreases at the position near the apex. The 50 μm and 75 μm particles gather in large quantities at the bottom of the hydrocyclone, and their content is low at the position of Z = 100 mm and above.
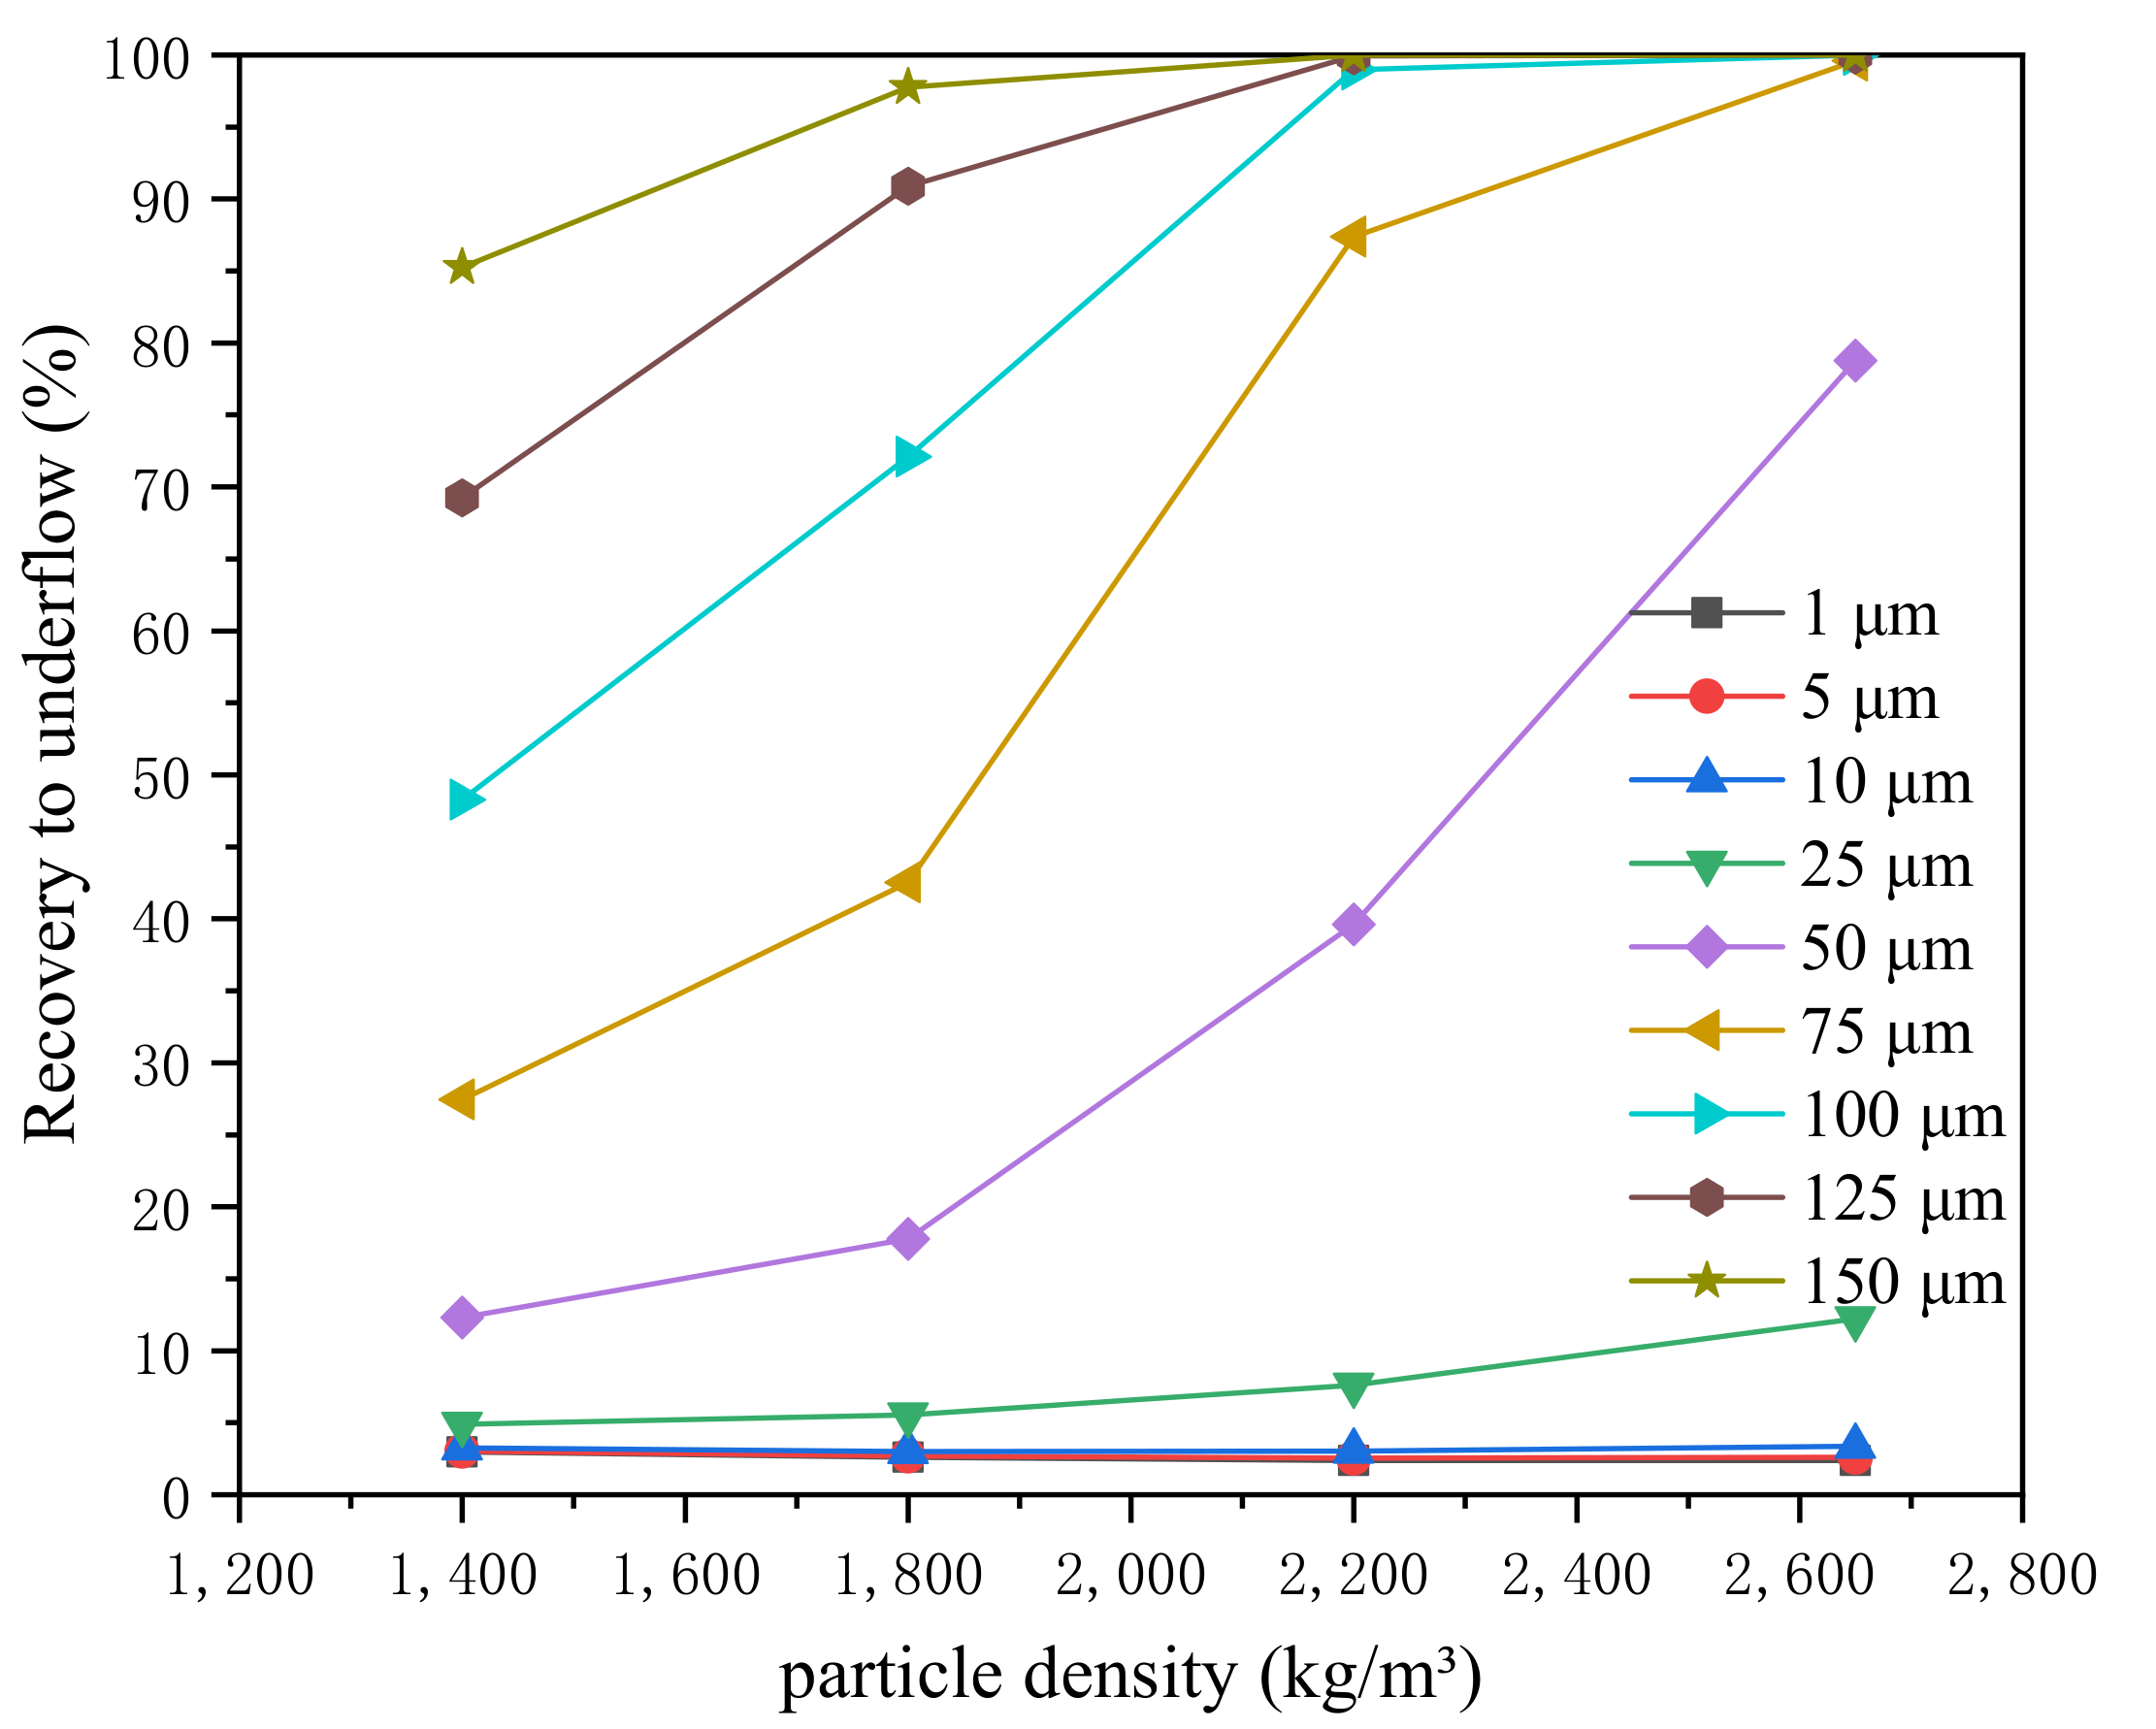
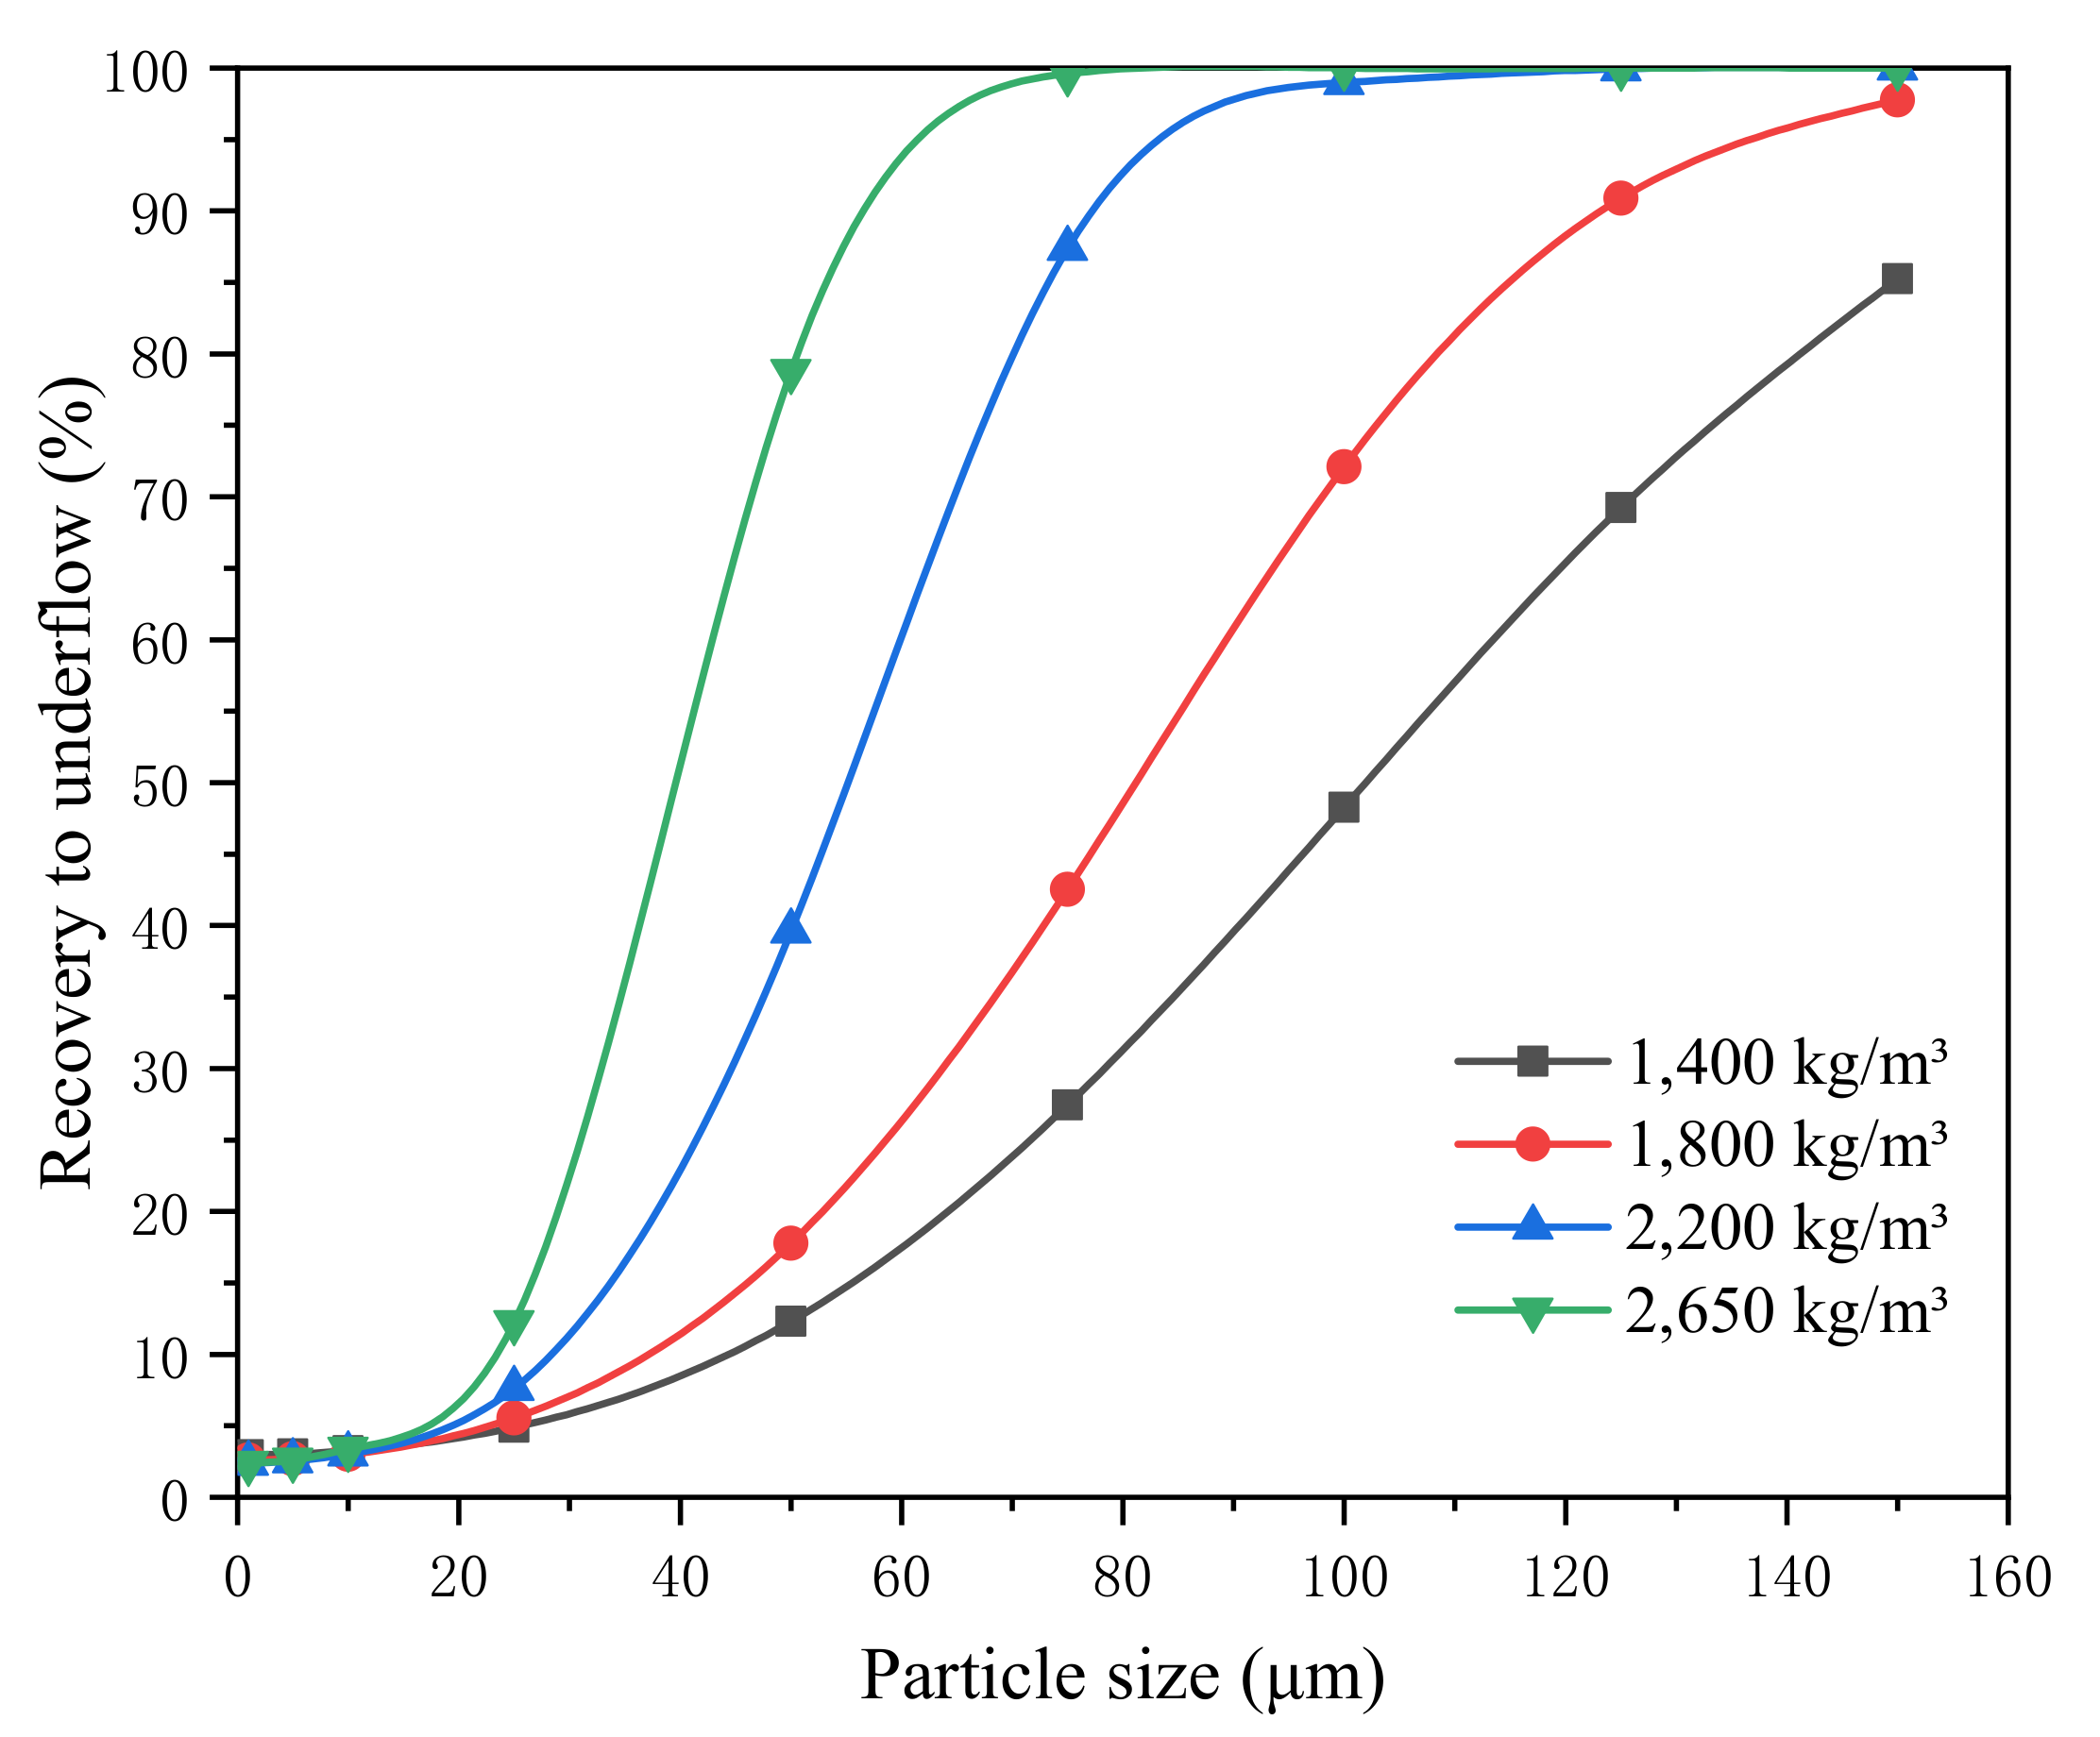
There are upward inner swirls and downward outer swirls occur in the hydrocyclone. When the aggregation position of the particles changes, the probability of particles entering the over- or underflow varies. Figure 16 shows the recovery to the underflow for the different particle sizes. In general, the larger the particle size, the easier it is for the particles to overcome the fluid drag force to enter the underflow and the higher the underflow recovery rate is. When the particle size is smaller than 25 μm, the fluid drag force is high, the particle size difference is difficult to detect, and the recovery rate does not change with the particle size. When the particle density changes, the recovery of all particles larger than 25 μm increases with increasing particle density, while the recovery of particles smaller than 25 μm remains basically unchanged. When the particle density reaches 2650 kg/m³, most of the particles larger than 50 μm enter the underflow, and the classification effect is obvious. However, when the particle density is low (1400 kg/m³), the recovery to the underflow for each particle size gradually increases with increasing particle size, and the classification effect is not obvious.
3.2.2. Effect of the Particle Density on the Particle Movement Behavior
Figure 17 shows the slurry density distribution inside the W-shaped hydrocyclone, and it is observed that the slurry density gradually increases with increasing particle density, and the density distribution inside the hydrocyclone exhibits a decreasing trend from the vortex finder to the apex. In the bottom area of the column section, a high-slurry density aggregation area occurs, and the suspension layer becomes more notable with increasing particle density.
Figure 18 shows the axial and radial slurry density distributions in the hydrocyclone. It is found that at axial positions Z = 100 mm and Z = 125 mm, the slurry density is only high near the wall, while no notable change is observed at the other radial positions, and the effect of the particles of the different densities on the slurry density is not notable. This occurs because in this region, the particles have completed most of the separation process, and the particles quickly settle towards the wall, resulting in a high particle concentration near the wall. In contrast, the particle concentration is low in the more inward region, resulting in a non-notable difference in the particle density. At axial positions Z = 50 mm and Z = 75 mm, which occur close to the W-shaped structure, the particle concentration is highly affected by the flow field of the W-shaped structure. In addition, the particle concentration here is high, resulting in the variation in particle density greatly impacting the slurry density. In the Z = 50 mm section along the radial direction towards the center, the slurry concentration gradually decreases with decreasing radius and then gradually increases and remains relatively stable at approximately 0.1 D from the wall. Finally, the slurry concentration sharply decreases at the center of the hydrocyclone, and this distribution characteristic obviously exhibits the characteristics of a W-shaped structure.
Figure 19 shows the effect of the particle density on the particle distribution. When the particle size is small (5 μm), the particle density change does not impose a major effect on the particle distribution in the hydrocyclone. With increasing particle size, a density difference gradually occurs. When the particle size reaches 25 μm, with increasing particle density, the particle group gradually moves to the apex. With increasing particle size, the particles gradually gather near the W-shaped structure at the bottom of the column section.
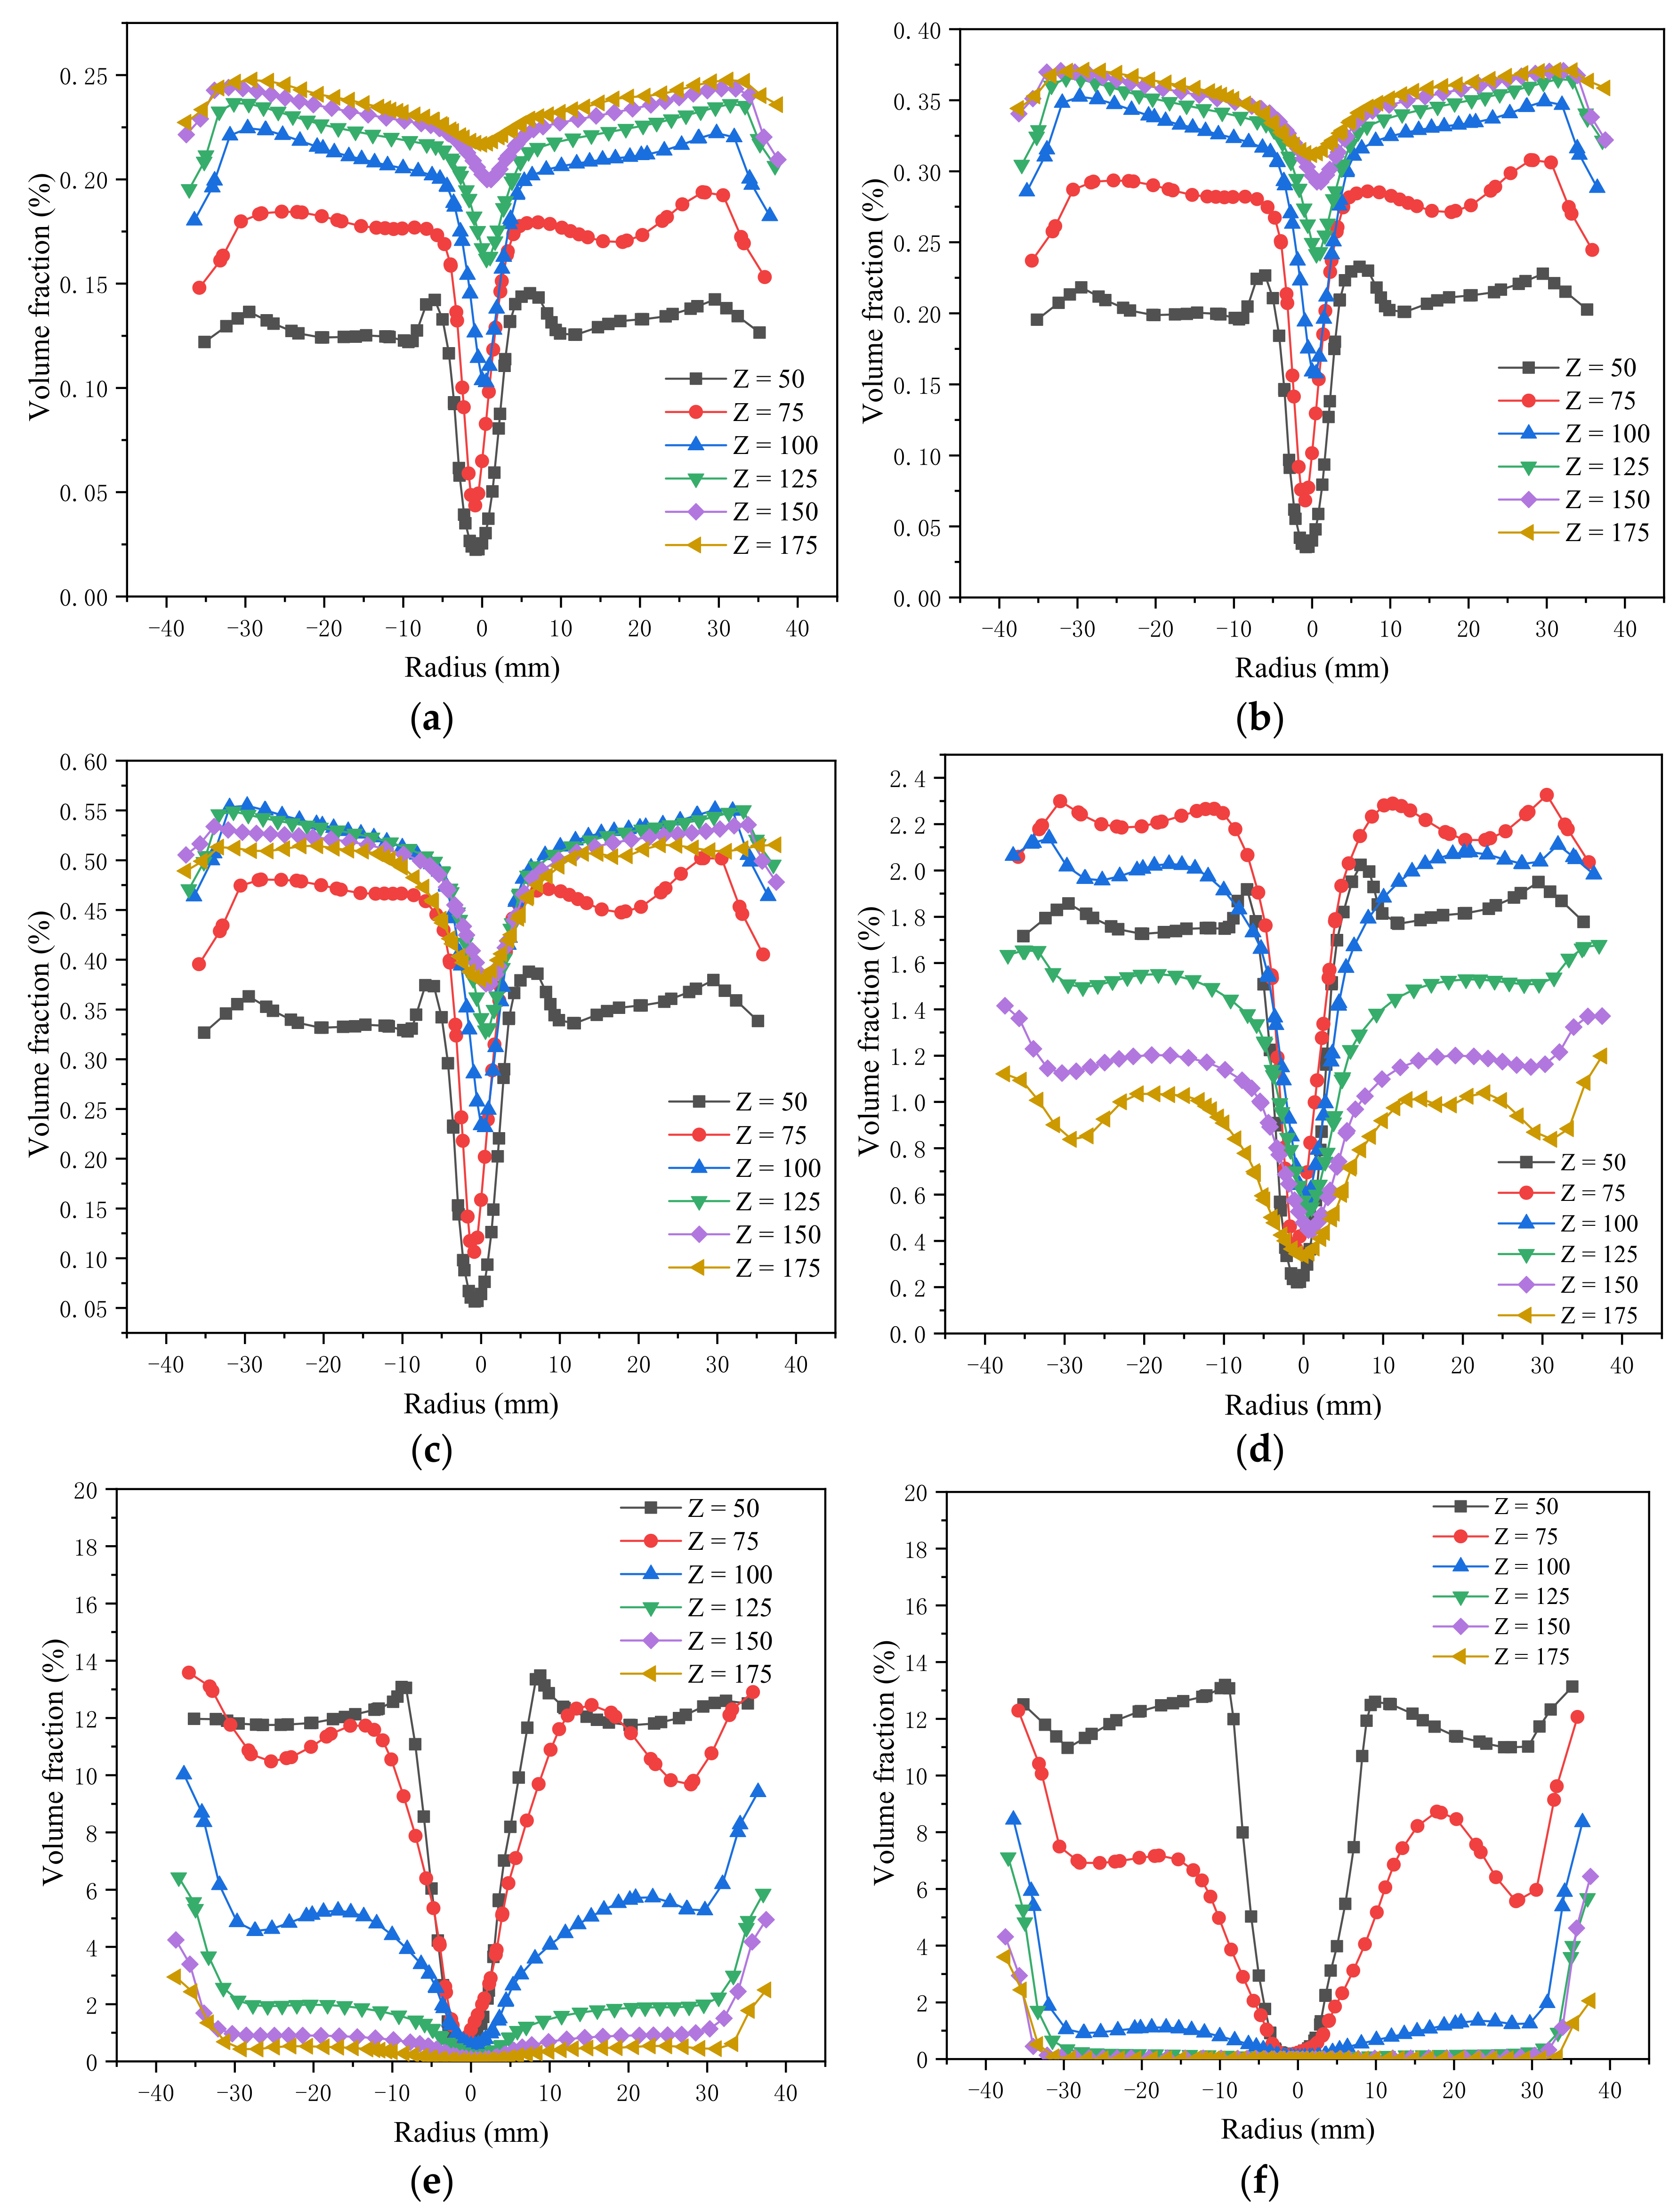
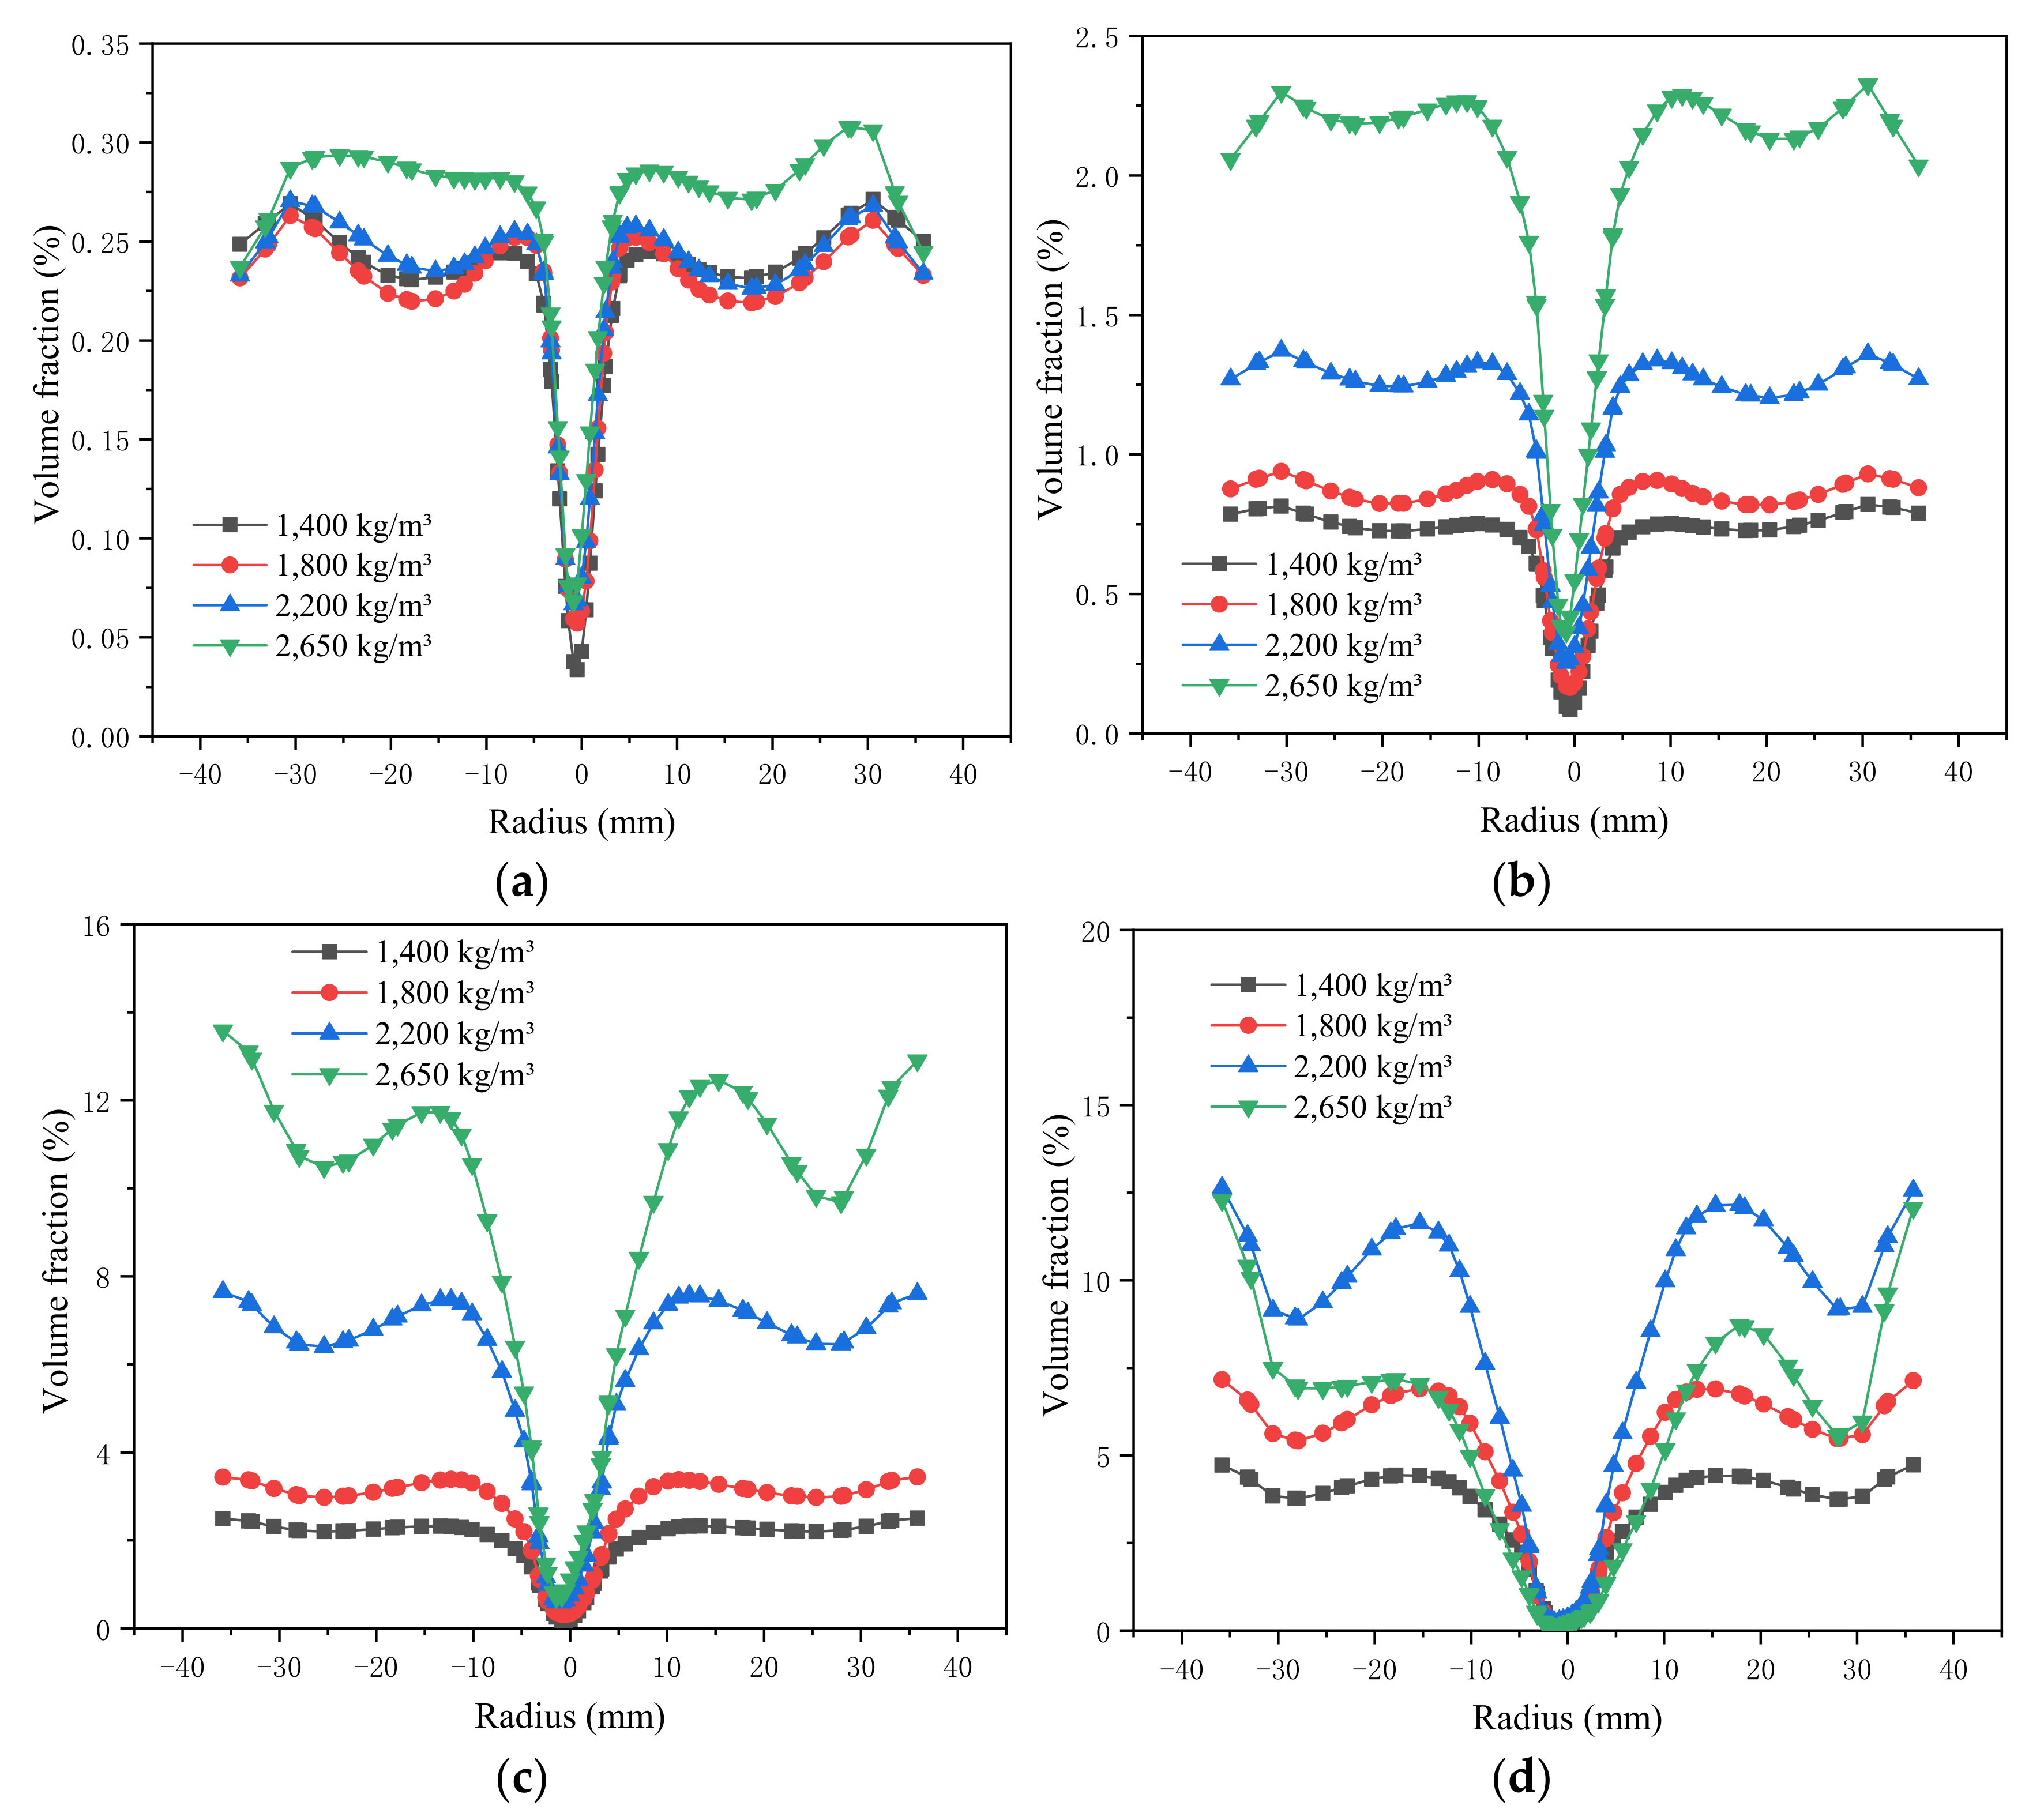
The distribution of the particles within the suspended layer at the bottom of the column segment was determined, and the results are shown in Figure 20 and Figure 21. The volume fraction of the 5 μm particles is small at the bottom of the suspended layer area (Z = 50 mm position) of the W-shaped structure, and the volume fraction gradually decreases with increasing particle density. Regarding the particles larger than 25 μm in the suspension layer, the volume fraction gradually increases with increasing particle density. Especially when the particle size is large, the density exceeds 1800 kg/m³, and the density change imposes no obvious effect on the particle volume distribution. Combined with the particle distribution in the upper part of the particle suspension layer (Z = 75 mm), it is found that the particles with a high particle density and large particle size easily cross the suspension layer and enter the underflow, while the particles with a low density and small particle size hardly cross the suspension layer.
Then, the recovery to the underflow for each particle size and density was visualized with the efficiency curve, as shown in Figure 22. It is observed that with increasing particle density, the classification efficiency curve shifts towards the left and the cut size decreases, while the slope of the curve and the classification accuracy increase. This verifies that the higher the particle density, the easier the particles are separated for the same particle size composition.
4. Conclusions
- (1)
- The radial centrifugal inertia and pressure gradient forces in the W-shaped hydrocyclone are hundreds of times the gravity force, and the radial drag force reaches an order of magnitude of 106, which is the main driver of radial motion. Moreover, with increasing particle size, the radial drag force acting on the particles exponentially decreases.
- (2)
- In the main separation region, the magnitude of the axial drag force reaches an order of magnitude of 105, but with decreasing axial position, the axial drag force on the particles gradually weakens. In the bottom region of the hydrocyclone, the order of magnitude of the axial drag force decreases to 102, and the buoyancy and gravitational effects on the particles gradually increase.
- (3)
- In the main separation region, the radial centrifugal force gradually increases with increasing particle density, while the pressure gradient force is basically unaffected by the particle density. However, at the bottom of the hydrocyclone, the change in particle density imposes no obvious effect on the radial centrifugal force, while the pressure gradient force decreases with increasing particle density.
- (4)
- With increasing particle size, the aggregation position of the particle population gradually approaches the apex, the easier the particles enter the underflow and the higher the recovery rate to the underflow is.
- (5)
- Particle density and size changes greatly impact the movement and distribution of coarse particles, but no significant change occurs in fine particles. With increasing particle density, the cut size decreases, and the fractionation accuracy increases.
Author Contributions
Conceptualization, P.L. and L.J.; Methodology, L.J.; Software, X.Y. and X.L.; Validation, Y.Z. (Yuekan Zhang), X.L. and Y.Z. (Yulong Zhang); Formal analysis, Y.Z. (Yulong Zhang); Investigation, L.J.; Resources, P.L.; Data curation, X.Y.; Writing—original draft preparation, L.J.; Writing—review and editing, L.J. and Y.Z. (Yuekan Zhang); Visualization, H.W.; Supervision, P.L.; Project administration, L.J.; Funding acquisition, P.L. All authors have read and agreed to the published version of the manuscript.
Funding
This work was supported by the Natural Science Foundation of Shandong Province, China (grant numbers: ZR2020EEM105), Shandong Provincial Key Research and Development Program, China (grant number: 2019GSF109030) and Qingdao Science and Technology Program, China (grant numbers: 21-1-4-sf-10-nsh).
Institutional Review Board Statement
Not applicable.
Informed Consent Statement
Not applicable.
Data Availability Statement
Not applicable.
Conflicts of Interest
The authors declare no conflict of interest.
References
- Li, S.-H.; Liu, Z.-M.; Chang, Y.-L.; Li, J.-P.; Hu, J.-K.; Shen, Q.-S.; Wang, H.-L. Removal of coke powders in coking wastewater using a hydrocyclone optimized by n-value. Sci. Total Environ. 2021, 752, 141887. [Google Scholar] [CrossRef]
- Jokovic, V.; Morrison, R.; Alexander, D. Can the performance of semi-inverted hydrocyclones be similar to fine screening? Miner. Eng. 2019, 146, 106147. [Google Scholar] [CrossRef]
- Song, T.; Tian, J.; Ni, L.; Shen, C.; Yao, Y. Experimental study on liquid flow fields in de-foulant hydrocyclones with reflux ejector using particle image velocimetry. Sep. Purif. Technol. 2020, 240, 116555. [Google Scholar] [CrossRef]
- Li, F.; Liu, P.; Yang, X.; Zhang, Y.; Zhao, Y. Effects of inlet concentration on the hydrocyclone separation performance with different inlet velocity. Powder Technol. 2020, 375, 337–351. [Google Scholar] [CrossRef]
- Song, T.; Tian, J.; Ni, L.; Shen, C.; Yao, Y. Experimental study of de-foulant hydrocyclone performance with a conical surface. Powder Technol. 2020, 366, 283–292. [Google Scholar] [CrossRef]
- Wang, C.; Cui, G. Study on the flow field and improved separation performance of a three-stage cone water-only cyclone. Miner. Eng. 2020, 159, 106637. [Google Scholar] [CrossRef]
- Guimarães, A.A.; Klein, T.S.; Medronho, R.D.A. Fish-hook effect in granulometric efficiency curves of hydrocyclones: A misuse of laser diffraction particle size analysers. Powder Technol. 2020, 374, 185–189. [Google Scholar] [CrossRef]
- Huang, Y.; Wang, H.-L.; Tian, J.; Li, J.; Fu, P.; He, F. Theoretical study on centrifugal coupling characteristics of self-rotation and revolution of particles in hydrocyclones. Sep. Purif. Technol. 2020, 244, 116552. [Google Scholar] [CrossRef]
- Ye, J.; Xu, Y.; Song, X.; Yu, J. Numerical modelling and multi-objective optimization of the novel hydrocyclone for ultra-fine particles classification. Chem. Eng. Sci. 2019, 207, 1072–1084. [Google Scholar] [CrossRef]
- Jiang, L.; Liu, P.; Zhang, Y.; Yang, X.; Wang, H.; Gui, X. Design boundary layer structure for improving the particle separation performance of a hydrocyclone. Powder Technol. 2019, 350, 1–14. [Google Scholar] [CrossRef]
- Jiang, L.; Liu, P.; Yang, X.; Zhang, Y.; Li, X.; Zhang, Y.; Wang, H. Effect of overflow pipe on the internal flow fields and separation performance of w-shaped hydrocyclones. Minerals 2020, 10, 329. [Google Scholar] [CrossRef] [Green Version]
- Jiang, L.; Liu, P.; Yang, X.; Zhang, Y.; Li, X.; Zhang, Y.; Wang, H. Experimental research on the separation performance of W-shaped hydrocyclone. Powder Technol. 2020, 372, 532–541. [Google Scholar] [CrossRef]
- Williams, R.; Jia, X.; West, R.; Wang, M.; Cullivan, J.; Bond, J.; Faulks, I.; Dyakowski, T.; Wang, S.; Climpson, N.; et al. Industrial monitoring of hydrocyclone operation using electrical resistance tomography. Miner. Eng. 1999, 12, 1245–1252. [Google Scholar] [CrossRef]
- Wang, M.; Dickin, F.; Williams, R. A study on cyclonic separators using electrical impedance tomography. Multiph. Flow 1995, 1995, 771–780. [Google Scholar] [CrossRef]
- Gutiérrez, J.; Dyakowski, T.; Beck, M.; Williams, R. Using electrical impedance tomography for controlling hydrocyclone underflow discharge. Powder Technol. 2000, 108, 180–184. [Google Scholar] [CrossRef]
- Wang, Z.-B.; Chu, L.-Y.; Chen, W.-M.; Wang, S.-G. Experimental investigation of the motion trajectory of solid particles inside the hydrocyclone by a Lagrange method. Chem. Eng. J. 2008, 138, 1–9. [Google Scholar] [CrossRef]
- Middha, P.; Balakin, B.V.; Leirvaag, L.; Hoffmann, A.C.; Kosinski, P. PEPT—A novel tool for investigation of pneumatic conveying. Powder Technol. 2013, 237, 87–96. [Google Scholar] [CrossRef]
- Mesa, D.; Cole, K.; Heerden, M.R.; Parada, P.R.B. Hydrodynamic characterisation of flotation impeller designs using Positron Emission Particle Tracking (PEPT). Sep. Purif. Technol. 2021, 276, 119316. [Google Scholar] [CrossRef]
- Chang, Y.-F.; Ilea, C.; Aasen, Ø.L.; Hoffmann, A.C. Particle flow in a hydrocyclone investigated by positron emission particle tracking. Chem. Eng. Sci. 2011, 66, 4203–4211. [Google Scholar] [CrossRef]
- Sovechles, J.M.; Boucher, D.; Pax, R.; Leadbeater, T.; Sasmito, A.P.; E Waters, K. Performance analysis of a new positron camera geometry for high speed, fine particle tracking. Meas. Sci. Technol. 2017, 28, 095402. [Google Scholar] [CrossRef]
- Hoffmann, A.C.; Skorpen, Å.; Chang, Y.-F. Positron emission particle tracking and CFD investigation of hydrocyclones acting on liquids of varying viscosity. Chem. Eng. Sci. 2019, 200, 310–319. [Google Scholar] [CrossRef]
- Razmi, H.; Goharrizi, A.S.; Mohebbi, A. CFD simulation of an industrial hydrocyclone based on multiphase particle in cell (MPPIC) method. Sep. Purif. Technol. 2019, 209, 851–862. [Google Scholar] [CrossRef]
- Vega-Garcia, D.; Cilliers, J.; Brito-Parada, P. CFD modelling of particle classification in mini-hydrocyclones. Sep. Purif. Technol. 2020, 251, 117253. [Google Scholar] [CrossRef]
- Zhang, Y.; Cai, P.; Jiang, F.; Dong, K.; Jiang, Y.; Wang, B. Understanding the separation of particles in a hydrocyclone by force analysis. Powder Technol. 2017, 322, 471–489. [Google Scholar] [CrossRef]
- Daza, J.; Cornejo, P.; Rodriguez, C.; Betancourt, F.; Concha, F. Influence of the feed particle size distribution on roping in hydrocyclones. Miner. Eng. 2020, 157, 106583. [Google Scholar] [CrossRef]
- Jiang, L.; Liu, P.; Zhang, Y.; Yang, X.; Wang, H. The effect of inlet velocity on the separation performance of a two-stage hydrocyclone. Minerals 2019, 9, 209. [Google Scholar] [CrossRef] [Green Version]
- Patra, G.; Velpuri, B.; Chakraborty, S.; Meikap, B. Performance evaluation of a hydrocyclone with a spiral rib for separation of particles. Adv. Powder Technol. 2017, 28, 3222–3232. [Google Scholar] [CrossRef]
- Padhi, M.; Mangadoddy, N.; Sreenivas, T.; Vakamalla, T.R.; Mainza, A. Study on multi-component particle behaviour in a hydrocyclone classifier using experimental and computational fluid dynamics techniques. Sep. Purif. Technol. 2019, 229, 115698. [Google Scholar] [CrossRef]
- Chu, K.; Wang, B.; Yu, A.; Vince, A. CFD-DEM modelling of multiphase flow in dense medium cyclones. Powder Technol. 2009, 193, 235–247. [Google Scholar] [CrossRef]
- Wang, X.; Wang, S.; Tian, R.; Wang, R.; Liu, L.; Sun, Q.; Fan, J. Numerical study on flow behavior of multi-component particles in a fluidized bed using a TFM-DEM hybrid model. Powder Technol. 2018, 338, 795–805. [Google Scholar] [CrossRef]
- Jiang, L.; Liu, P.; Yang, X.; Zhang, Y.; Wang, H. Designing W-shaped apex for improving the separation efficiency of a full-column hydrocyclone. Sep. Sci. Technol. 2020, 55, 1724–1740. [Google Scholar] [CrossRef]
Figure 1.
W-shaped hydrocyclone.

Figure 2.
Structure and mesh. (a) Structural parameters. (b) Mesh.

Figure 3.
Mesh independence detection.

Figure 4.
Radial centrifugal force.

Figure 5.
Radial pressure gradient force.

Figure 6.
Effect of the particle size on the radial drag force. (a) section Z = 50 mm. (b) section Z = 100 mm.
Figure 6.
Effect of the particle size on the radial drag force. (a) section Z = 50 mm. (b) section Z = 100 mm.

Figure 7.
Axial buoyancy acting on the particles.

Figure 8.
Effect of the particle size on the axial drag force. (a) section Z = 50 mm. (b) section Z = 100 mm.
Figure 8.
Effect of the particle size on the axial drag force. (a) section Z = 50 mm. (b) section Z = 100 mm.

Figure 9.
Effect of the particle density on the radial centrifugal force. (a) section Z = 50 mm. (b) section Z = 100 mm.
Figure 9.
Effect of the particle density on the radial centrifugal force. (a) section Z = 50 mm. (b) section Z = 100 mm.

Figure 10.
Effect of the particle density on the radial pressure gradient force. (a) section Z = 50 mm. (b) section Z = 100 mm.
Figure 10.
Effect of the particle density on the radial pressure gradient force. (a) section Z = 50 mm. (b) section Z = 100 mm.

Figure 11.
Effect of the particle density on the radial drag force. (a) 5 μm particles at Z = 50 mm. (b) 5 μm particles at Z = 100 mm. (c) 50 μm particles at Z = 50 mm. (d) 50 μm particles at Z = 100 mm. (e) 100 μm particles at Z = 50 mm. (f) 100 μm particles at Z = 100 mm.
Figure 11.
Effect of the particle density on the radial drag force. (a) 5 μm particles at Z = 50 mm. (b) 5 μm particles at Z = 100 mm. (c) 50 μm particles at Z = 50 mm. (d) 50 μm particles at Z = 100 mm. (e) 100 μm particles at Z = 50 mm. (f) 100 μm particles at Z = 100 mm.

Figure 12.
Effect of the particle density on the axial buoyancy force. (a) section Z = 50 mm. (b) section Z = 100 mm.
Figure 12.
Effect of the particle density on the axial buoyancy force. (a) section Z = 50 mm. (b) section Z = 100 mm.

Figure 13.
Effect of the particle density on the axial drag force. (a) 5 μm particles at Z = 50 mm. (b) 5 μm particles at Z = 100 mm. (c) 50 μm particles at Z = 50 mm. (d) 50 μm particles at Z = 100 mm. (e) 100 μm particles at Z = 50 mm. (f) 100 μm particles at Z = 100 mm.
Figure 13.
Effect of the particle density on the axial drag force. (a) 5 μm particles at Z = 50 mm. (b) 5 μm particles at Z = 100 mm. (c) 50 μm particles at Z = 50 mm. (d) 50 μm particles at Z = 100 mm. (e) 100 μm particles at Z = 50 mm. (f) 100 μm particles at Z = 100 mm.

Figure 14.
Distribution of the different sizes of particles in the W-shaped hydrocyclone.

Figure 15.
Distribution comparison of the particle with different sizes. (a) 1 μm particles. (b) 5 μm particles. (c) 10 μm particles. (d) 25 μm particles. (e) 50 μm particles. (f) 75 μm particles.
Figure 15.
Distribution comparison of the particle with different sizes. (a) 1 μm particles. (b) 5 μm particles. (c) 10 μm particles. (d) 25 μm particles. (e) 50 μm particles. (f) 75 μm particles.

Figure 16.
Effect of the particle size on the efficiency curve.

Figure 17.
Effect of the particle density on the slurry density.

Figure 18.
Effect of the particle density on the slurry density distribution. (a) section Z = 50 mm. (b) section Z = 75 mm. (c) section Z = 100 mm. (d) section Z = 125 mm.
Figure 18.
Effect of the particle density on the slurry density distribution. (a) section Z = 50 mm. (b) section Z = 75 mm. (c) section Z = 100 mm. (d) section Z = 125 mm.

Figure 19.
Volume distribution of the different particles for the different densities. (a) Volume distribution of 5 μm particles. (b) Volume distribution of 25 μm particles. (c) Volume distribution of 50 μm particles. (d) Volume distribution of 75 μm particles.
Figure 19.
Volume distribution of the different particles for the different densities. (a) Volume distribution of 5 μm particles. (b) Volume distribution of 25 μm particles. (c) Volume distribution of 50 μm particles. (d) Volume distribution of 75 μm particles.

Figure 20.
Effect of the particle density on the particle volume distribution at Z = 50 mm. (a) 5 μm particles. (b) 25 μm particles. (c) 50 μm particles. (d) 75 μm particles.
Figure 20.
Effect of the particle density on the particle volume distribution at Z = 50 mm. (a) 5 μm particles. (b) 25 μm particles. (c) 50 μm particles. (d) 75 μm particles.

Figure 21.
Effect of the particle density on the particle volume distribution at Z = 75 mm. (a) 5 μm particles. (b) 25 μm particles. (c) 50 μm particles. (d) 75 μm particles.
Figure 21.
Effect of the particle density on the particle volume distribution at Z = 75 mm. (a) 5 μm particles. (b) 25 μm particles. (c) 50 μm particles. (d) 75 μm particles.

Figure 22.
Effect of the particle density on the efficiency curve.


Table 1.
Structural parameters of the hydrocyclone.
| Structural Parameters | Size |
|---|---|
| Diameter of upper cylinder section D1 (mm) | 75 |
| Diameter of under cylinder section D2 (mm) | 70 |
| Height of body H (mm) | 315 |
| Diameter of inlet a∗b (mm) | 15∗20 |
| Diameter of underflow Du (mm) | 15 |
| Diameter of vortex finder Do (mm) | 25 |
| Height of vortex finder H1 (mm) | 75 |
| Height of upper cylinder section H2 (mm) | 120 |
| Height of under cylinder section H3 (mm) | 97 |
| Height of underflow H4 (mm) | 43 |
| Cone angle θ (°) | 150 |
Table 2.
Size distribution of the particles in the feed.
| Size Interval/μm | Mean Size/μm | Yield/% | Volume Fraction/% |
|---|---|---|---|
| 0–5 | 1 | 4.88 | 0.2440 |
| 5–10 | 5 | 7.21 | 0.3605 |
| 10–25 | 10 | 9.55 | 0.4775 |
| 25–50 | 25 | 15.33 | 0.7665 |
| 50–75 | 50 | 20.88 | 1.0440 |
| 75–100 | 75 | 16.59 | 0.8295 |
| 100–125 | 100 | 11.38 | 0.5690 |
| 125–150 | 125 | 8.31 | 0.4155 |
| 150–200 | 150 | 5.87 | 0.2935 |
Publisher’s Note: MDPI stays neutral with regard to jurisdictional claims in published maps and institutional affiliations. |
© 2021 by the authors. Licensee MDPI, Basel, Switzerland. This article is an open access article distributed under the terms and conditions of the Creative Commons Attribution (CC BY) license (https://creativecommons.org/licenses/by/4.0/).
Share and Cite
MDPI and ACS Style
Jiang, L.; Liu, P.; Zhang, Y.; Yang, X.; Li, X.; Zhang, Y.; Wang, H. Particle Motion Characteristics in W-Shaped Hydrocyclones. Separations 2021, 8, 121. https://0-doi-org.brum.beds.ac.uk/10.3390/separations8080121
AMA Style
Jiang L, Liu P, Zhang Y, Yang X, Li X, Zhang Y, Wang H. Particle Motion Characteristics in W-Shaped Hydrocyclones. Separations. 2021; 8(8):121. https://0-doi-org.brum.beds.ac.uk/10.3390/separations8080121
Chicago/Turabian StyleJiang, Lanyue, Peikun Liu, Yuekan Zhang, Xinghua Yang, Xiaoyu Li, Yulong Zhang, and Hui Wang. 2021. "Particle Motion Characteristics in W-Shaped Hydrocyclones" Separations 8, no. 8: 121. https://0-doi-org.brum.beds.ac.uk/10.3390/separations8080121
Note that from the first issue of 2016, this journal uses article numbers instead of page numbers. See further details here.