Article

Fluorescent Characteristics and Metal Binding Properties of Different Molecular Weight Fractions in Stratified Extracellular Polymeric Substances of Activated Sludge

1
College of Life and Environmental Science, Wenzhou University, Wenzhou 325035, China
2
National and Local Joint Engineering Research Center of Ecological Treatment Technology for Urban Water Pollution, Department of Environmental Science, Wenzhou University, Wenzhou 325035, China
*
Author to whom correspondence should be addressed.
Submission received: 12 July 2021 / Revised: 2 August 2021 / Accepted: 11 August 2021 / Published: 16 August 2021
(This article belongs to the Section Environmental Separations)

Abstract

:
The combination of heavy metals and extracellular polymeric substances (EPSs) affects the distribution of heavy metals in microbial aggregates, soil, and aquatic systems. This paper aimed to explore the binding mechanisms of EPSs of different molecular weights in activated sludge with heavy metals. We extracted the stratification components of activated sludge EPSs and divided the components into five fractions of different molecular weight ranges. In the three-dimensional fluorescence analysis of each fraction, the EPSs of activated sludge had two peaks, peak A (representing low-excitation tryptophan) and peak B (representing high-excitation tryptophan), and static quenching was the main reason for the fluorescence quenching between the compounds attributable to peak A in activated sludge EPSs and Pb2+ and Cu2+. Further exploration suggested that the EPSs of activated sludge interacted with Cd2+, Pb2+, Cu2+, and Zn2+ to form new substances. The quenching effect of the EPSs with the highest molecular weight (100 kDa–0.7 μm) was more significant, and the binding ability was more stable. This study implies that the application of EPSs from activated sludge is promising. While effectively binding heavy metals, it can also reduce the volume of the excess activated sludge.

1. Introduction

In recent centuries, with the massive industrialization and economic growth, heavy metal pollution in aquatic ecosystems has intensified, and has become one of the most significant global environmental problems [1,2]. Heavy metals can be defined as any metal with a density greater than 5 g/cm3; examples include cadmium (Cd), lead (Pb), copper (Cu), zinc (Zn), etc. Tons of heavy metals are being discharged into the environment, poisoning water bodies, soil, and more [3,4] through the course of wastewater irrigation, sludge application, solid waste disposal, automobile exhaust, and industrial waste dumping. Heavy-metal-polluted water bodies have suffered a calamitous loss of aquatic biodiversity due to the toxicity, persistence, bioaccumulation, and undegradability of heavy metals. In addition, the potential effects of metal-contaminated drinking water on human health are of concern [5,6,7]. We cannot neglect to intervene. However, conventional methods of wastewater treatment have some disadvantages, such as low removal rate of metal ions, the formation of a large amount of sludge that is difficult to treat, and high operating costs [8]. In recent years, a widely used approach has been to add chemical agents, removing noxious heavy metals by converting their dissolved form into insoluble sediments. However, this method inevitably results in complex sediments that are costly to treat. Due to their nonbiodegradable characteristics, heavy metals are always adsorbed and removed from wastewater along with the wasted sludge [9,10].
Extracellular polymeric substances (EPSs) are a major component of activated sludge flocs, biofilms, and microbial granules [11]. EPSs mainly contain substances secreted by microbial cells, produced by cell autolysis, or exfoliated from the cell surface, such as polysaccharides, proteins, nucleic acids, phospholipids, humins and humic acids; among these, polysaccharides and proteins are the main components [12,13,14]. According to the degree of combination of organic matter and cell phase, the sludge extracellular polymeric substances can be classified into three types: slime EPSs (S-EPSs), loosely bound EPSs (LB-EPSs), and tightly bound EPSs (TB-EPSs) [15,16,17]. EPSs generally exist in or at the surface of activated sludge flocs, and include plentiful negatively charged functional groups such as carboxyl groups, phosphoric groups, and hydroxyl groups. These functional groups have been shown to be capable of efficiently complexing heavy metal ions via electrostatic attraction, ion exchange, surface precipitation, and other types of interaction [18,19,20,21]. This study aimed to gain a further understanding of the interaction mechanisms between EPSs and heavy metals.
Traditionally, the characterization of EPSs obtained from sewage treatment plants has been assessed by the determination of protein and polysaccharide concentration; however, this is laborious and yields limited information. Fluorescence spectroscopy, a rapid, nondestructive, sensitive, and low-cost measurement and characterization method, enables researchers to quickly evaluate the dynamic characteristics of EPSs in sewage treatment facilities [22]. A combination of ultrafiltration fractionation, fluorescence excitation–emission matrix quenching, and parallel factor analysis (PARAFAC) is employed by Wu Jun et al. [23] to show the fluorescence characteristics of individual molecular weight components of dissolved organic matter in landfill leachate, and to evaluate the practical value of this combined method in the characterization of components separated based on molecular weight. Previous studies attempted to explore the relationships between EPSs and heavy metals. Through evaluating the instability of metal-bound EPSs, Bhaskar et al. [24] provided a preliminary assessment of the role of bacterial EPSs in the binding of heavy metals (i.e., Cu and Pb). Jin Wang et al. [25] applied Fourier transform infrared spectroscopy and demonstrated that the EPSs extracted from Desulfovibrio desulfuricans bind Zn2+ more strongly than Cu2+. Much of the available literature deals with the binding mechanisms between the EPSs of activated sludge and heavy metals. However, few studies have attempted to use three-dimensional fluorescence spectroscopy to tackle this problem. Three-dimensional excitation–emission matrix (EEM) fluorescence spectroscopy is a rapid, selective, and sensitive technique that provides information regarding the fluorescence characteristics of compounds by altering the excitation and emission wavelengths simultaneously [26].
The specific objectives of the study were (1) to separate extracellular polymeric substances from activated sludge and classify according to their molecular weight, (2) to conduct fluorescence quenching experiments using three-dimensional fluorescence and in this way analyze the binding process of extracellular polymeric substances and different heavy metals, and (3) to explore the mechanisms by which activated sludge extracellular polymers with different molecular weights bind with different heavy metals in order to provide valuable insight for the treatment of heavy metal pollution in soils and watersheds.

2. Materials and Methods

2.1. Sludge Samples

In this study, the activated sludge was collected from the oxidation ditch of a sewage treatment plant located in Wenzhou (Wenzhou, China) during the plant’s stable operation. The collected samples were transported to a laboratory within 30 min following sampling and refrigerated in a 4 °C refrigerator for further analysis.

2.2. Reagents and Instruments

In the experiment, the used Pb(NO3)2, Cd(NO3)2, Cu(NO3)2, Zn(NO3)2, NaH2PO4, Na3PO4, NaCl, and KCl were analytically pure. The collected bottom sediments were re-suspended to their original volume in a pH 7 buffer solution consisting of 1.3 mmol/L Na3PO4, 2.7 mmol/L NaH2PO4, 6 mmol/L NaCl, and 0.7 mmol/L KCl [26].
All the glassware was rinsed and dried in a constant-temperature oven (DGG-9420, Science and Technology Co., Ltd., Ningbo, China). Ultrafiltration cups (MSC300, Mosu Scientific Equipment Co., Ltd., Shanghai, China) and ultrafiltration membranes (1 kDa, 5 kDa, 10 kDa, 100 kDa, Mosu Scientific Equipment Co., Ltd., Shanghai, China) were required during the experiment. An electronic balance (AL204, Mettler-Toledo Instrument Co., Ltd., Zurich, Switzerland) and a suction filter (SHZ-D11, Qiuzuo Instrument Equipment Co., Ltd., Henan, China) were also required. In addition, we used an ultrasonic cleaning machine (SB-800DTS, Xinzhi Biological Technology Co., Ltd., Ningbo, China) and ultra-speed refrigerating centrifuge (CT15RT, Tianmei Scientific Instruments, Peking, China). A fluorescence spectrometer (F-4600, Hitachi, Tokyo, Japan) was used in the experiment.

2.3. Experimental Method

2.3.1. The Extraction of EPSs

High-speed centrifugation was used in the extraction of EPSs. It is worth noting that the following conditions must be met when extracting EPSs: firstly, EPSs should be separated from the cell surface without damaging the cell itself; secondly, all EPS polymers should be extracted; thirdly, the structure and properties of the EPSs should not be destroyed [27,28].
The extraction methods used in the experiment were as follows: (1) For the extraction of slime we took 100 mL of activated sludge and poured it into a beaker, and let it stand for a period of time; then, the supernatant was removed and the bottom sludge was transferred into a 200 mL centrifuge tube for centrifugation (centrifugal conditions 2000× g, 4 °C, 15 min); after centrifugation, the supernatant was filtered with a 0.7 μm filter membrane and the filtrate was the slime solution [28,29,30]. (2) For the extraction of LB-EPSs, buffer solution was added to the residual sludge from (1) until the sludge returned to its original volume, then the mixture was moved to a 200 mL centrifuge tube for centrifugation (5000× g, 4 °C, 15 min); after centrifugation, the supernatant was filtered by a 0.7 μm filter membrane and the filtrate was the LB-EPS solution. (3) For the extraction of TB-EPSs, we prepared a suspension with volume of 100 mL by adding buffer solution to the remains in (2); after the ultrasonic treatment (20 kHz and 480 W for 10 min) the suspension was centrifuged in a 200 mL centrifuge tube (20,000× g, 4 °C, 20 min) and the supernatant was filtered through a 0.7 μm membrane; the filtrate was the TB-EPS solution [31]. The extraction process revealed that LB-EPSs were more closely related to sludge flocculation and sedimentation, and TB-EPSs had a greater contribution to cell adhesion [32].

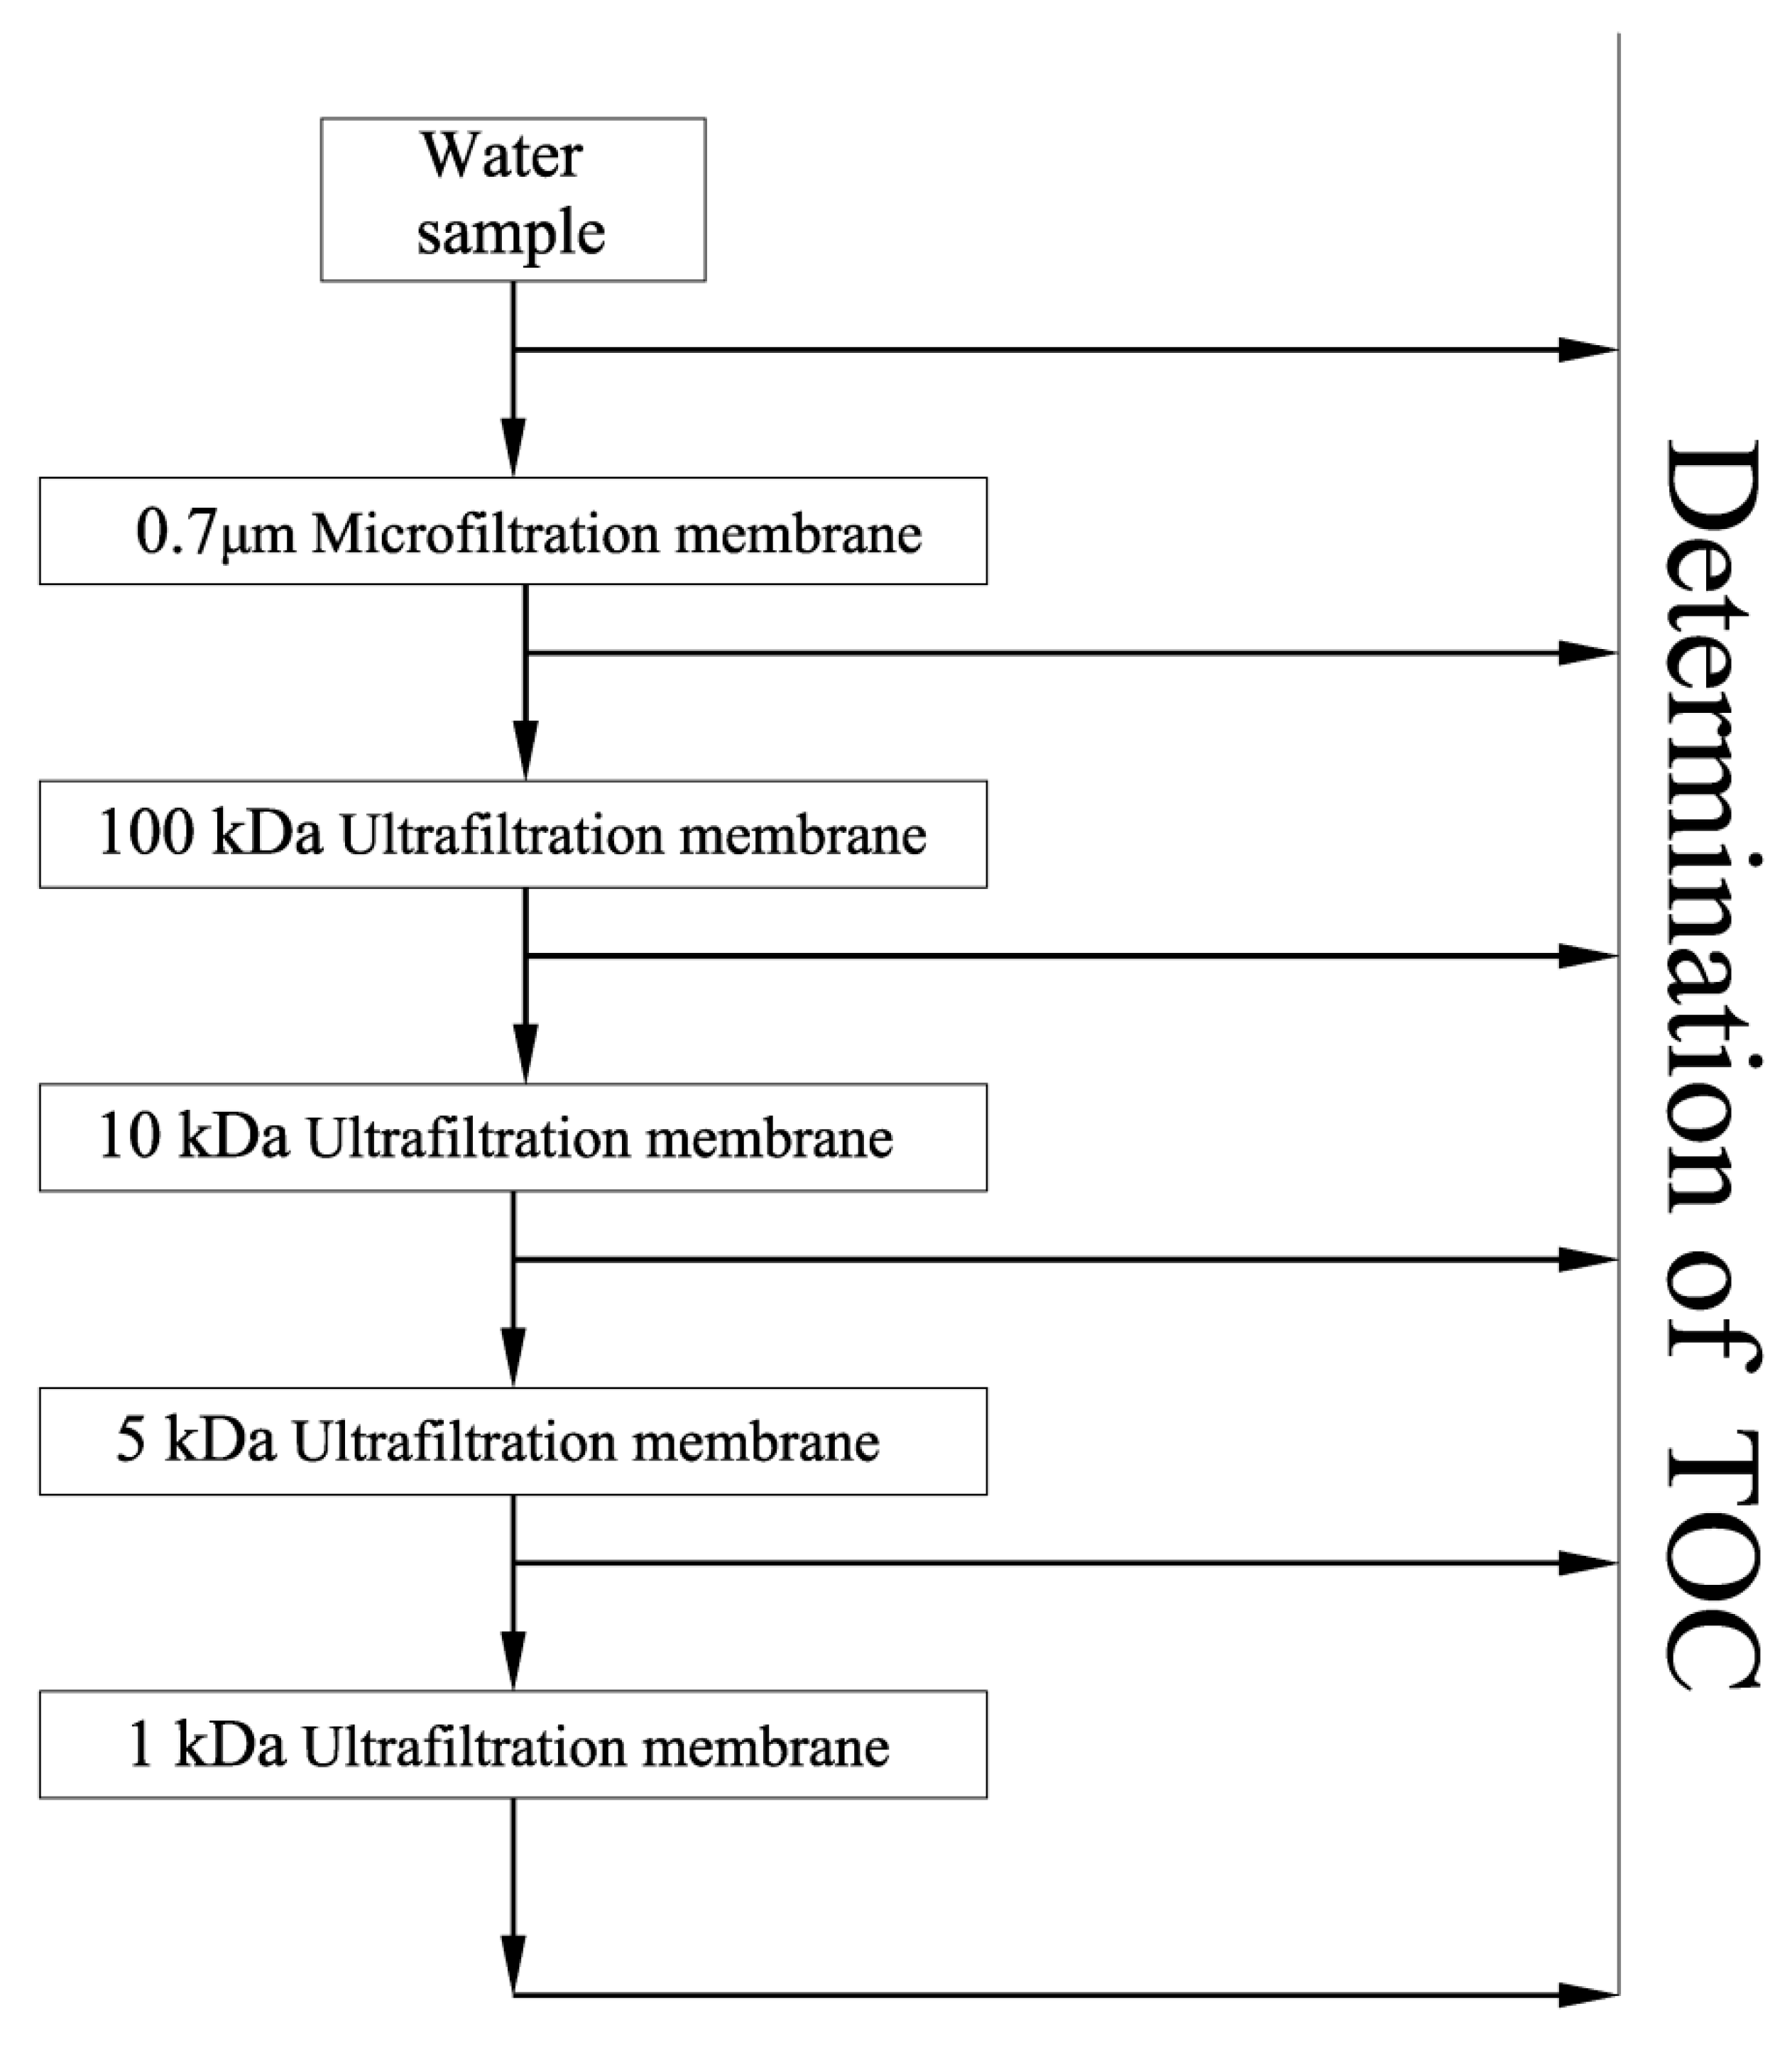
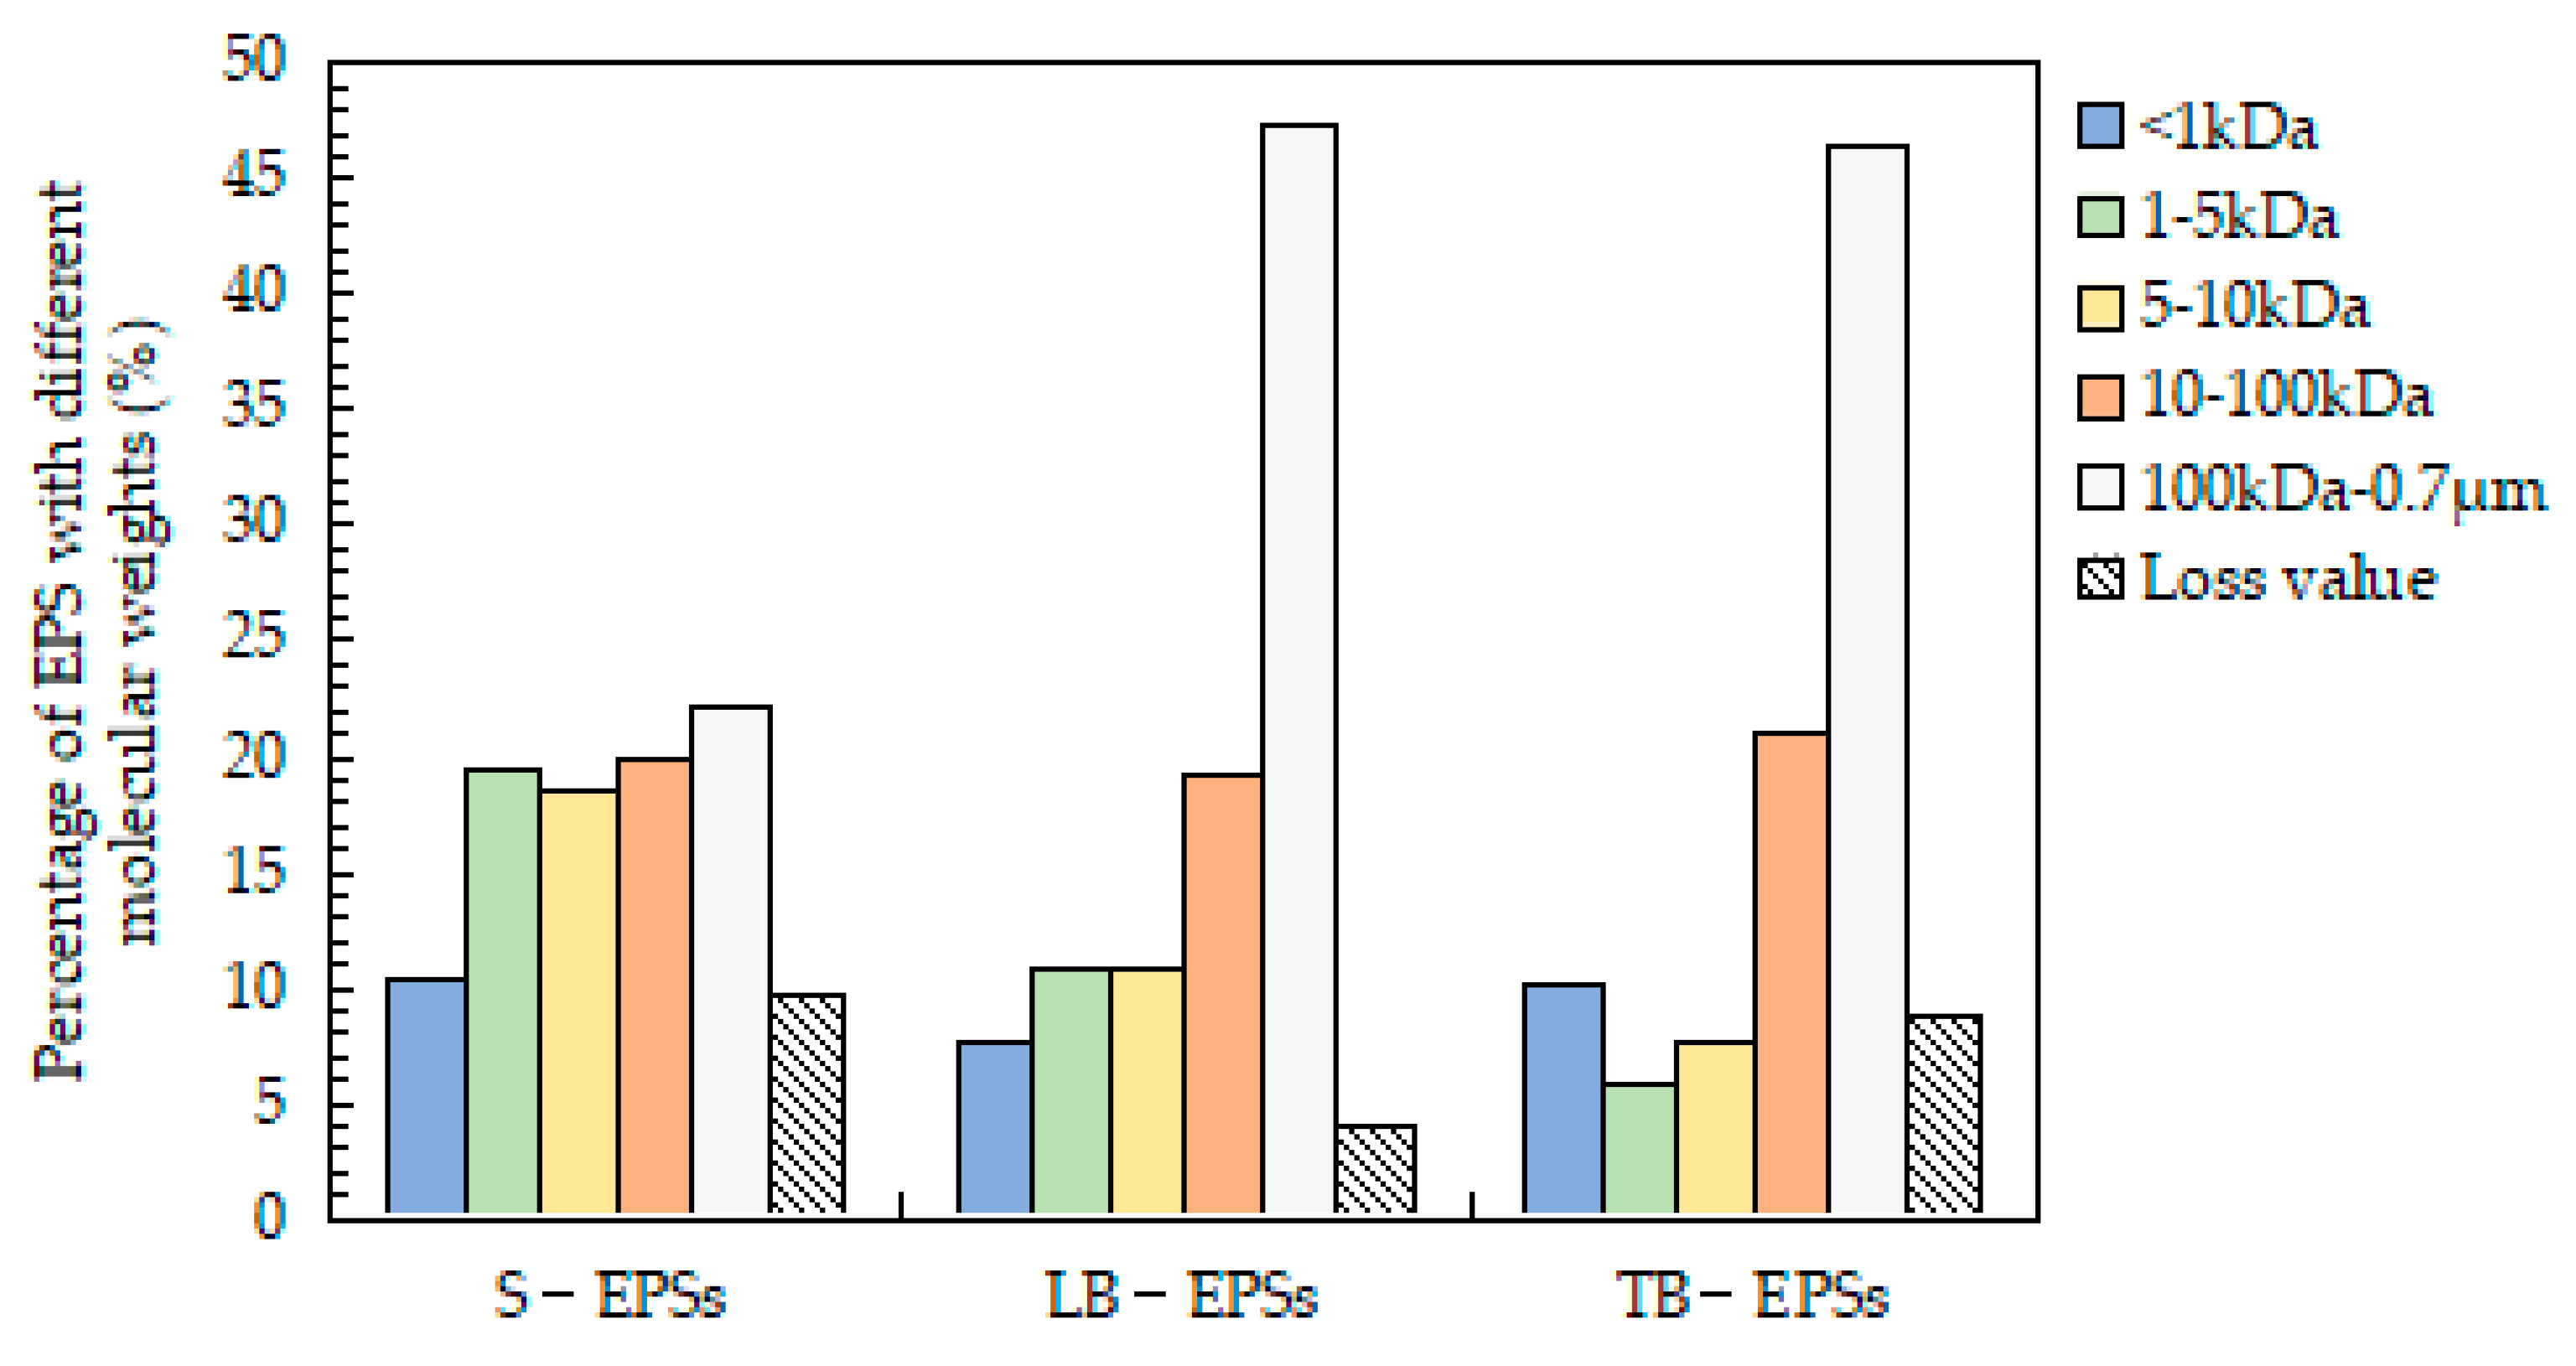
2.3.2. Molecular Weight Classification of EPSs

The ultrafiltration membrane method was applied to classify the EPSs according to molecular weight. The ultrafiltration membrane required treatment before use. The pretreatment method was as follows [33]: the new membrane was soaked in ultrapure water (the water resistivity was 18.2 MΩ-cm) for 8–12 h, then filtered with ultrapure water for 2–3 h. The used membrane was treated with 0.2 mol/L NaOH solution for 30 min, washed with water until it was neutral, and then stored in 20% ethanol solution until use.
Water samples (slime solution, LB-EPSs solution, and TB-EPSs solution) were added to suction filters equipped with different ultrafiltration membranes (100 kDa, 10 kDa, 5 kDa, and 1 kDa). The filtrates were collected to determine the total organic carbon (TOC), and further filtered into different molecular weights. The process for obtaining the molecular weight distribution of organic matter in the water samples is shown in Figure 1. The slime solution that could filter through the 0.7 μm microfiltration membrane but not the 100 kDa ultrafiltration membrane was recorded as Slime1 (100 kDa–0.7 μm); the EPSs were divided into different molecular weights, recorded as Slime2 (10–100 kDa), Slime3 (5–10 kDa), Slime4 (1–5 kDa), and Slime5 (<1 kDa). The molecular weights of LB-EPSs and TB-EPSs were separated in the same way as the slime samples. After the EPSs were divided into five fractions of different molecular weight ranges, the loss of TOC was controlled within 10%. The above experiments were repeated three times.

2.3.3. Spectral Conditions

The fluorescence spectrum of the EPSs was measured by an F-4600 fluorescence spectrometer (Hitachi, Ltd., Tokyo, Japan). A xenon lamp was the excitation source. The excitation wavelength ranged from 200 to 500 nm, increasing by 5 nm each time. The emission wavelength ranged from 250 to 600 nm, increasing by 2 nm each time [34,35].

2.3.4. Fluorescence Quenching Experiment of Pb2+, Cu2+, Cd2+, and Zn2+

Taking the fluorescence quenching experiment of Pb2+ as an example, ultrapure water was used as a blank control, and 0.01, 0.02, 0.03, 0.04, 0.05, 0.06, 0.07, 0.08, 0.09, and 0.1 mmol/L lead nitrate were added into the EPSs of activated sludge with different molecular weights. The other heavy metal fluorescence quenching measurement steps were the same as those for heavy metal Pb2+, replacing lead nitrate can be changed into cadmium nitrate, copper nitrate, and zinc nitrate, for example. All experiments were repeated three times.
The potential mechanism for quenching rate constants and quenching can be fitted using the Stern–Volmer equation [36].
F 0 F = 1 + K sv [ Q ] = 1 + K q τ 0 [ Q ]
where F0 and F are the fluorescence intensity of the fluorophore in the absence and presence of heavy metals, Ksv is the Stern–Volmer quenching rate constant, [Q] is the concentration of the heavy metal (mmol/L), Kq is the quenching rate constant of biological macromolecules, τ0 is the fluorescence lifetime of the molecule, and the average lifetime of the biological macromolecule is generally about 10−8 s.
The complexation constant (Kb) and the number of binding sites (n) for the binding of the two substances can be calculated using the modified Hill equation [37].
log   [ F 0 F F ] = logK b + nlog [ Q ]
where F0 and F are the fluorescence intensity of the fluorophore in the presence and absence of the quencher, Kb is the binding constant, n is the number of binding sites, and Q is the concentration of quencher (mmol/L).

2.3.5. Parallel Factor Analysis (PARAFAC)

In order to analyze different fluorescence components, parallel factor analysis was used to process three-dimensional fluorescence data. PARAFAC is a trilinear model based on alternating least squares, and decomposes a three-dimensional array X composed of multiple EEM data (I × J × K) into three load matrices A, B, and C. The elements included are aif, bjf, ckf. Then, the three load matrices are calculated by minimizing the residual sum of squares. Each column vector corresponds to the score, excitation spectrum, and emission spectrum respectively. The mathematical expression for the PARAFAC can be given as [23,38]:
X ijk = f = 1 F a if b jf c kf + e ijk   i = 1 , , I ;   j = 1 , , J ;   k = 1 , , K
where Xijk, aif, bjf, and ckf are the elements of matrices X, A, B, and C, respectively, and eijk is the residual of the fitting model.

3. Results and Discussion

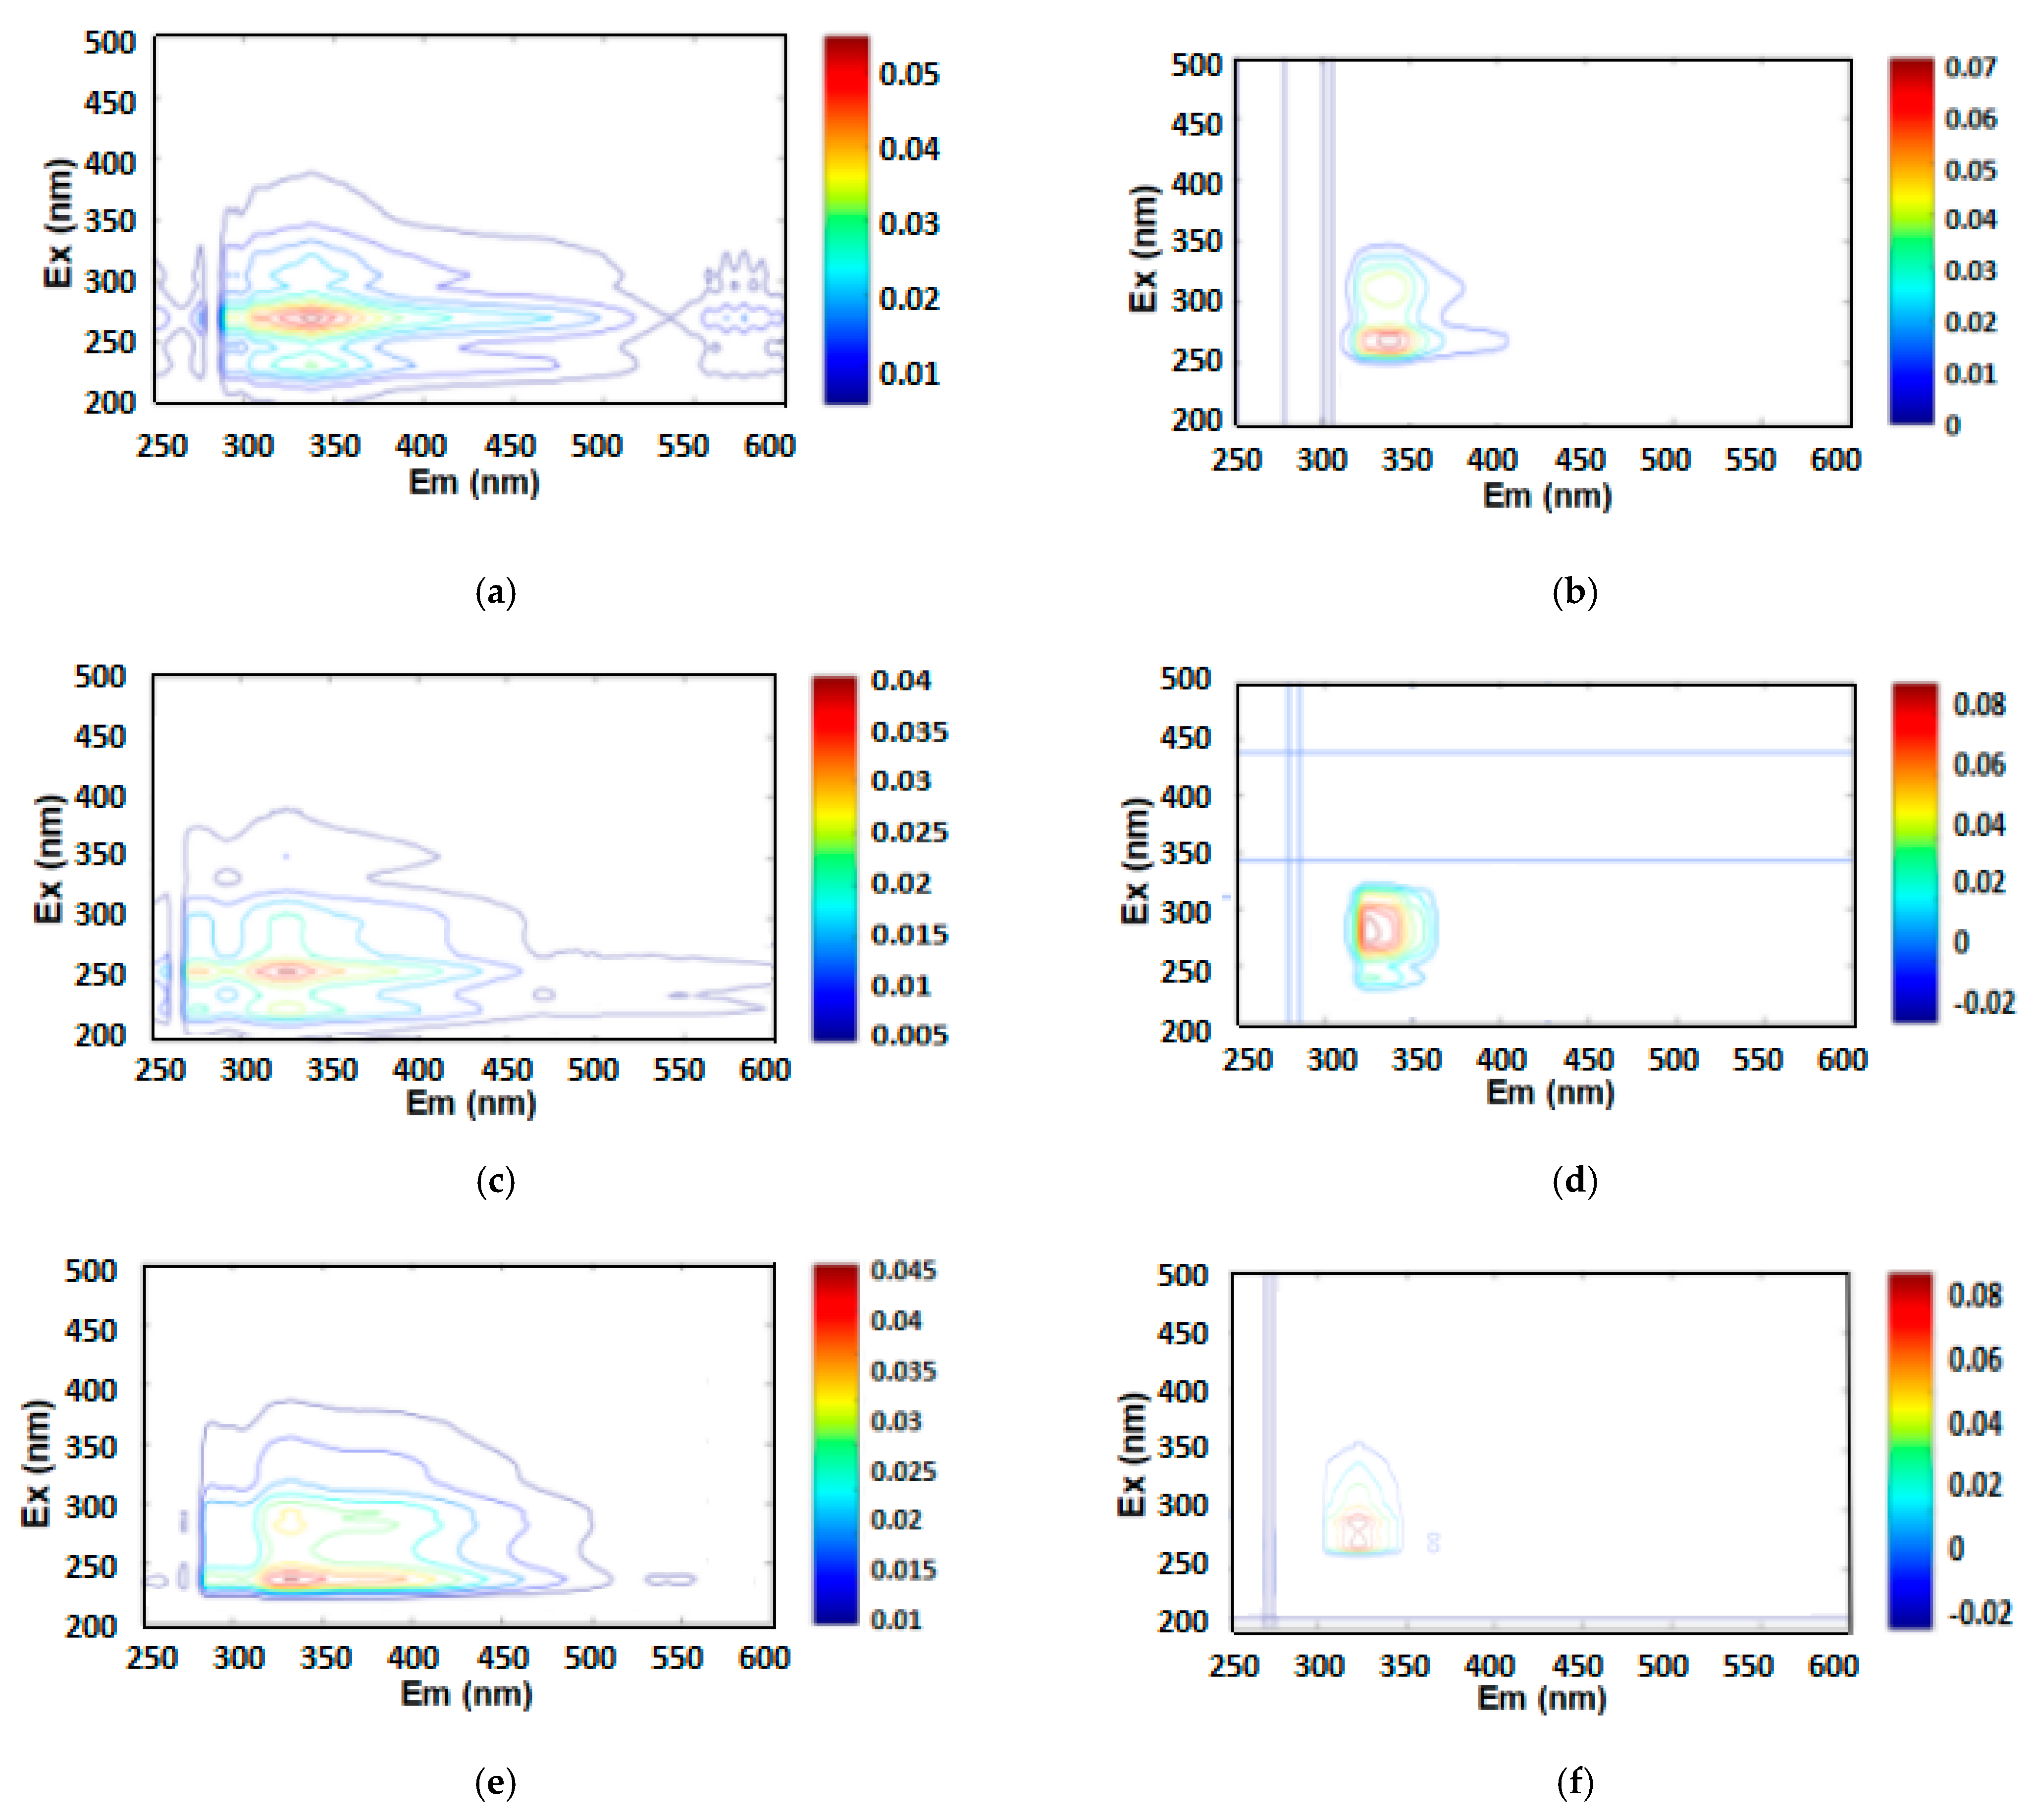
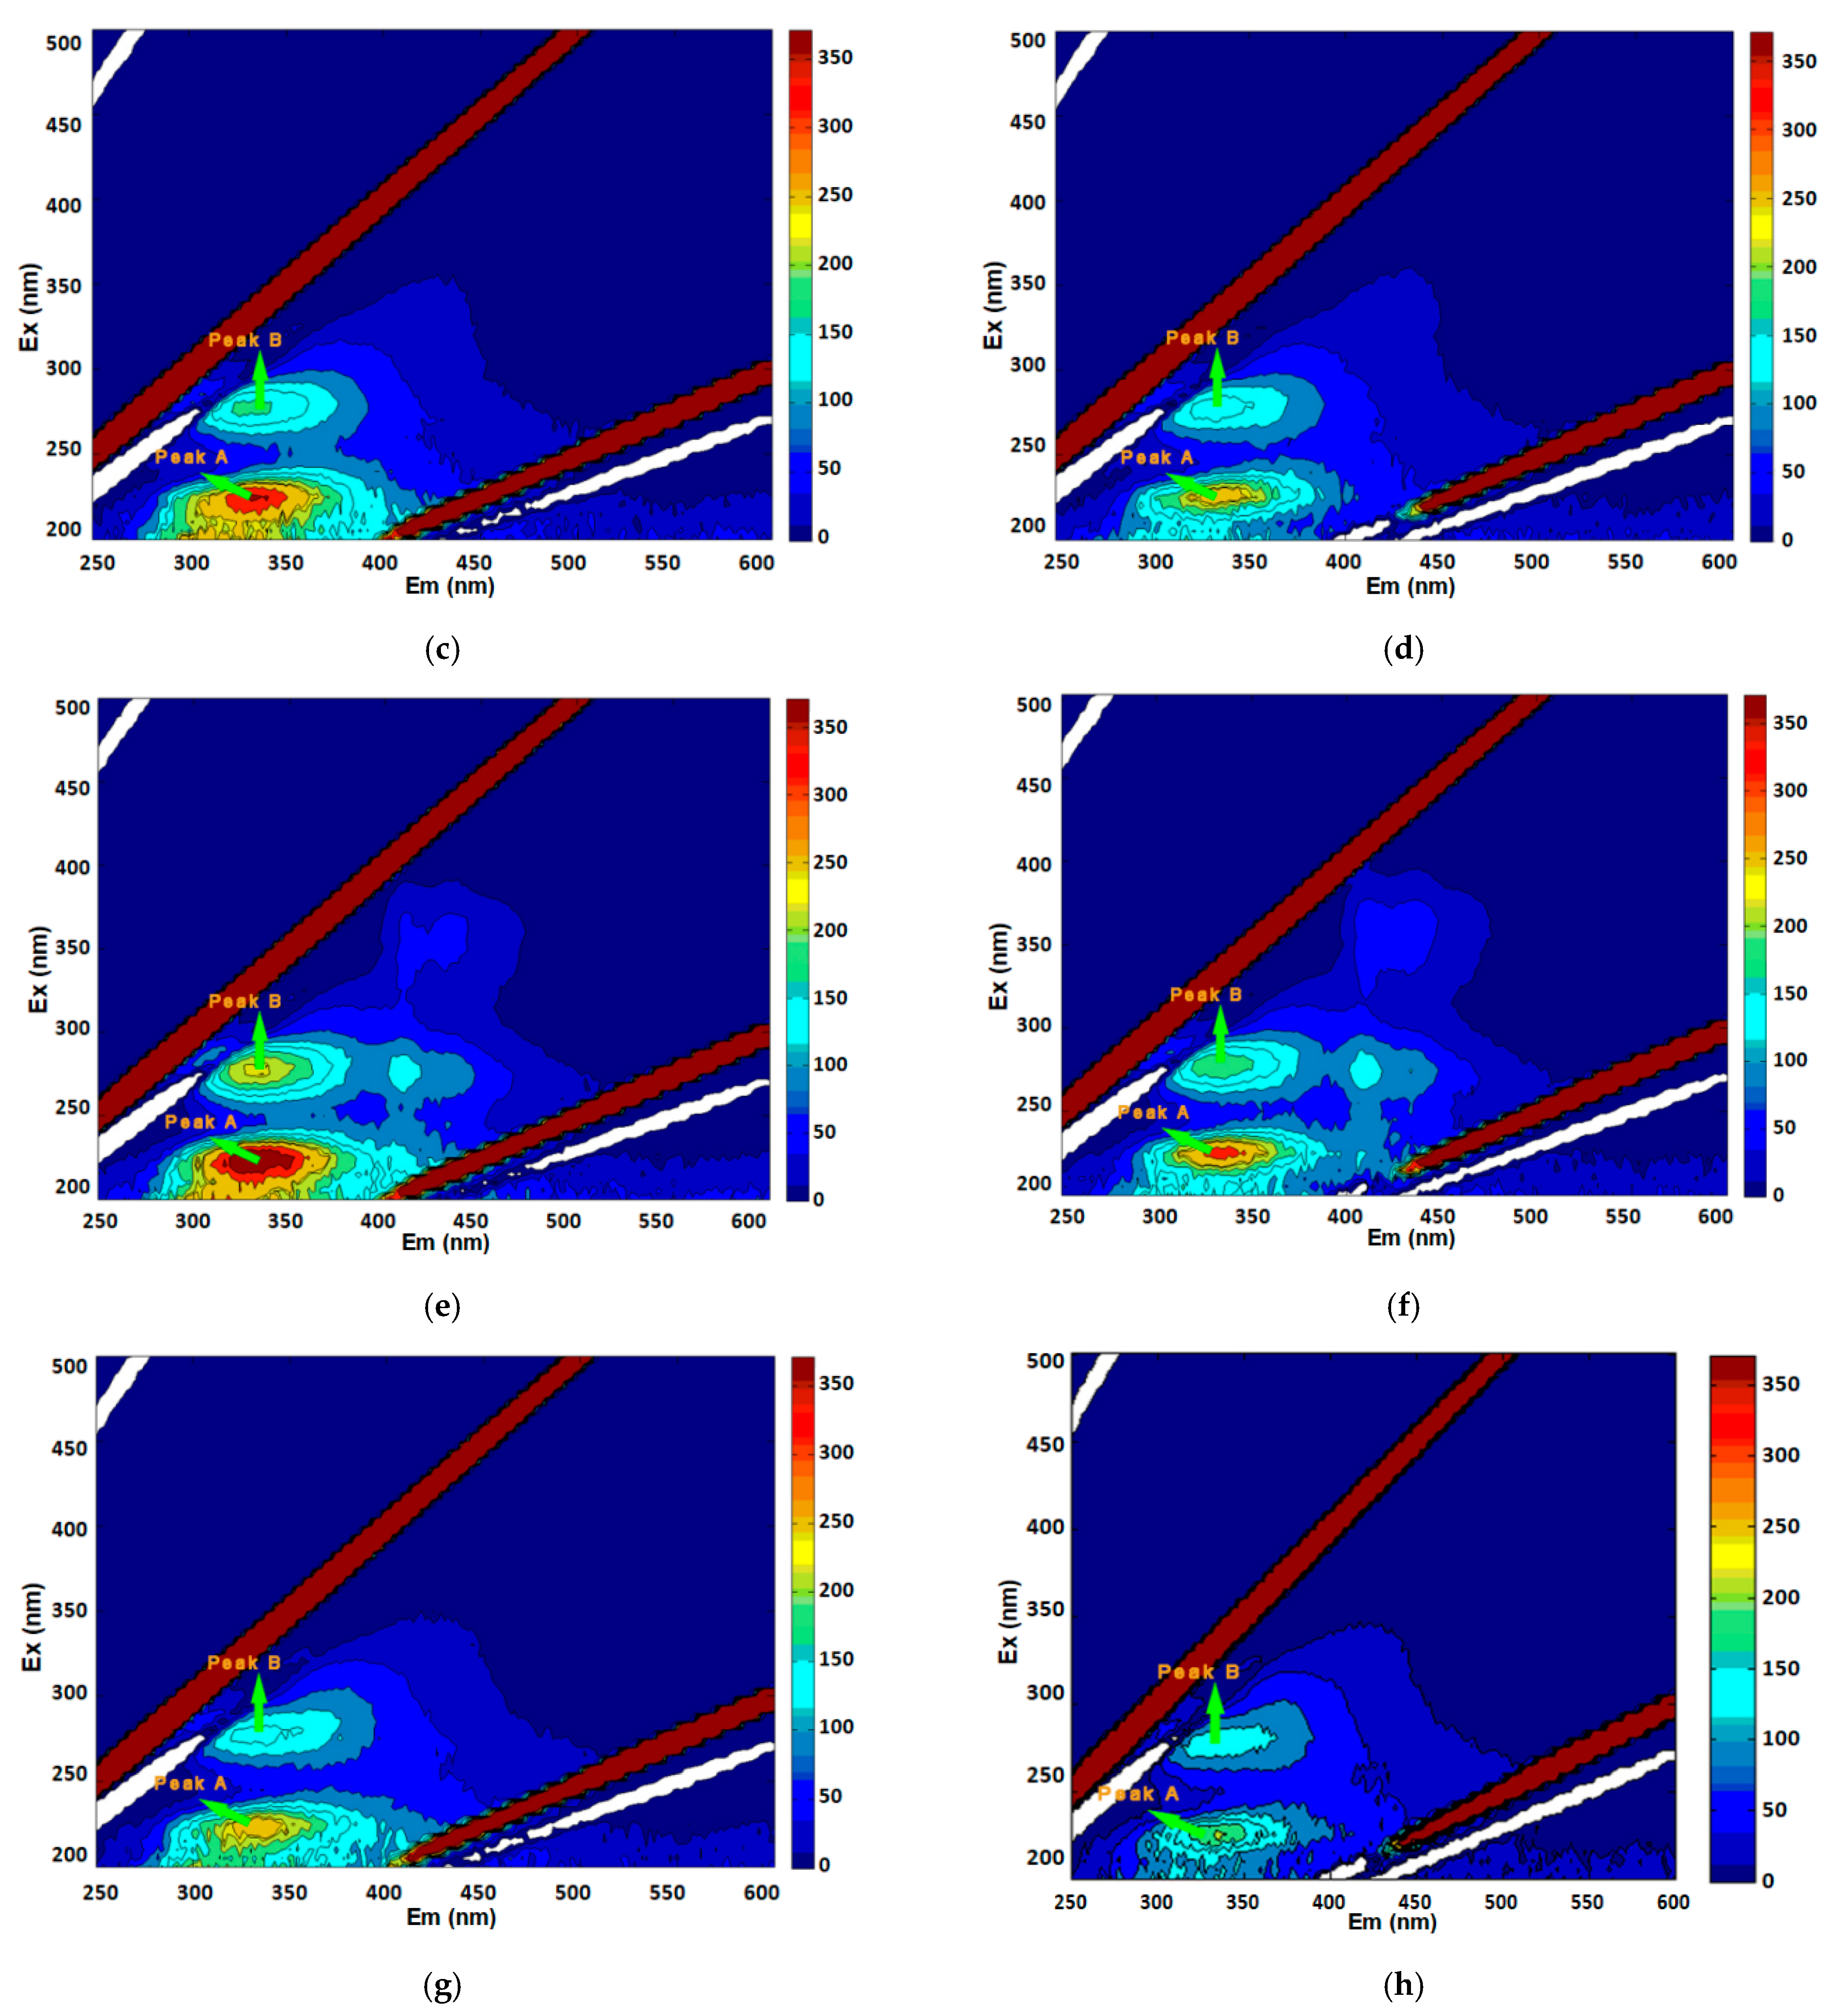
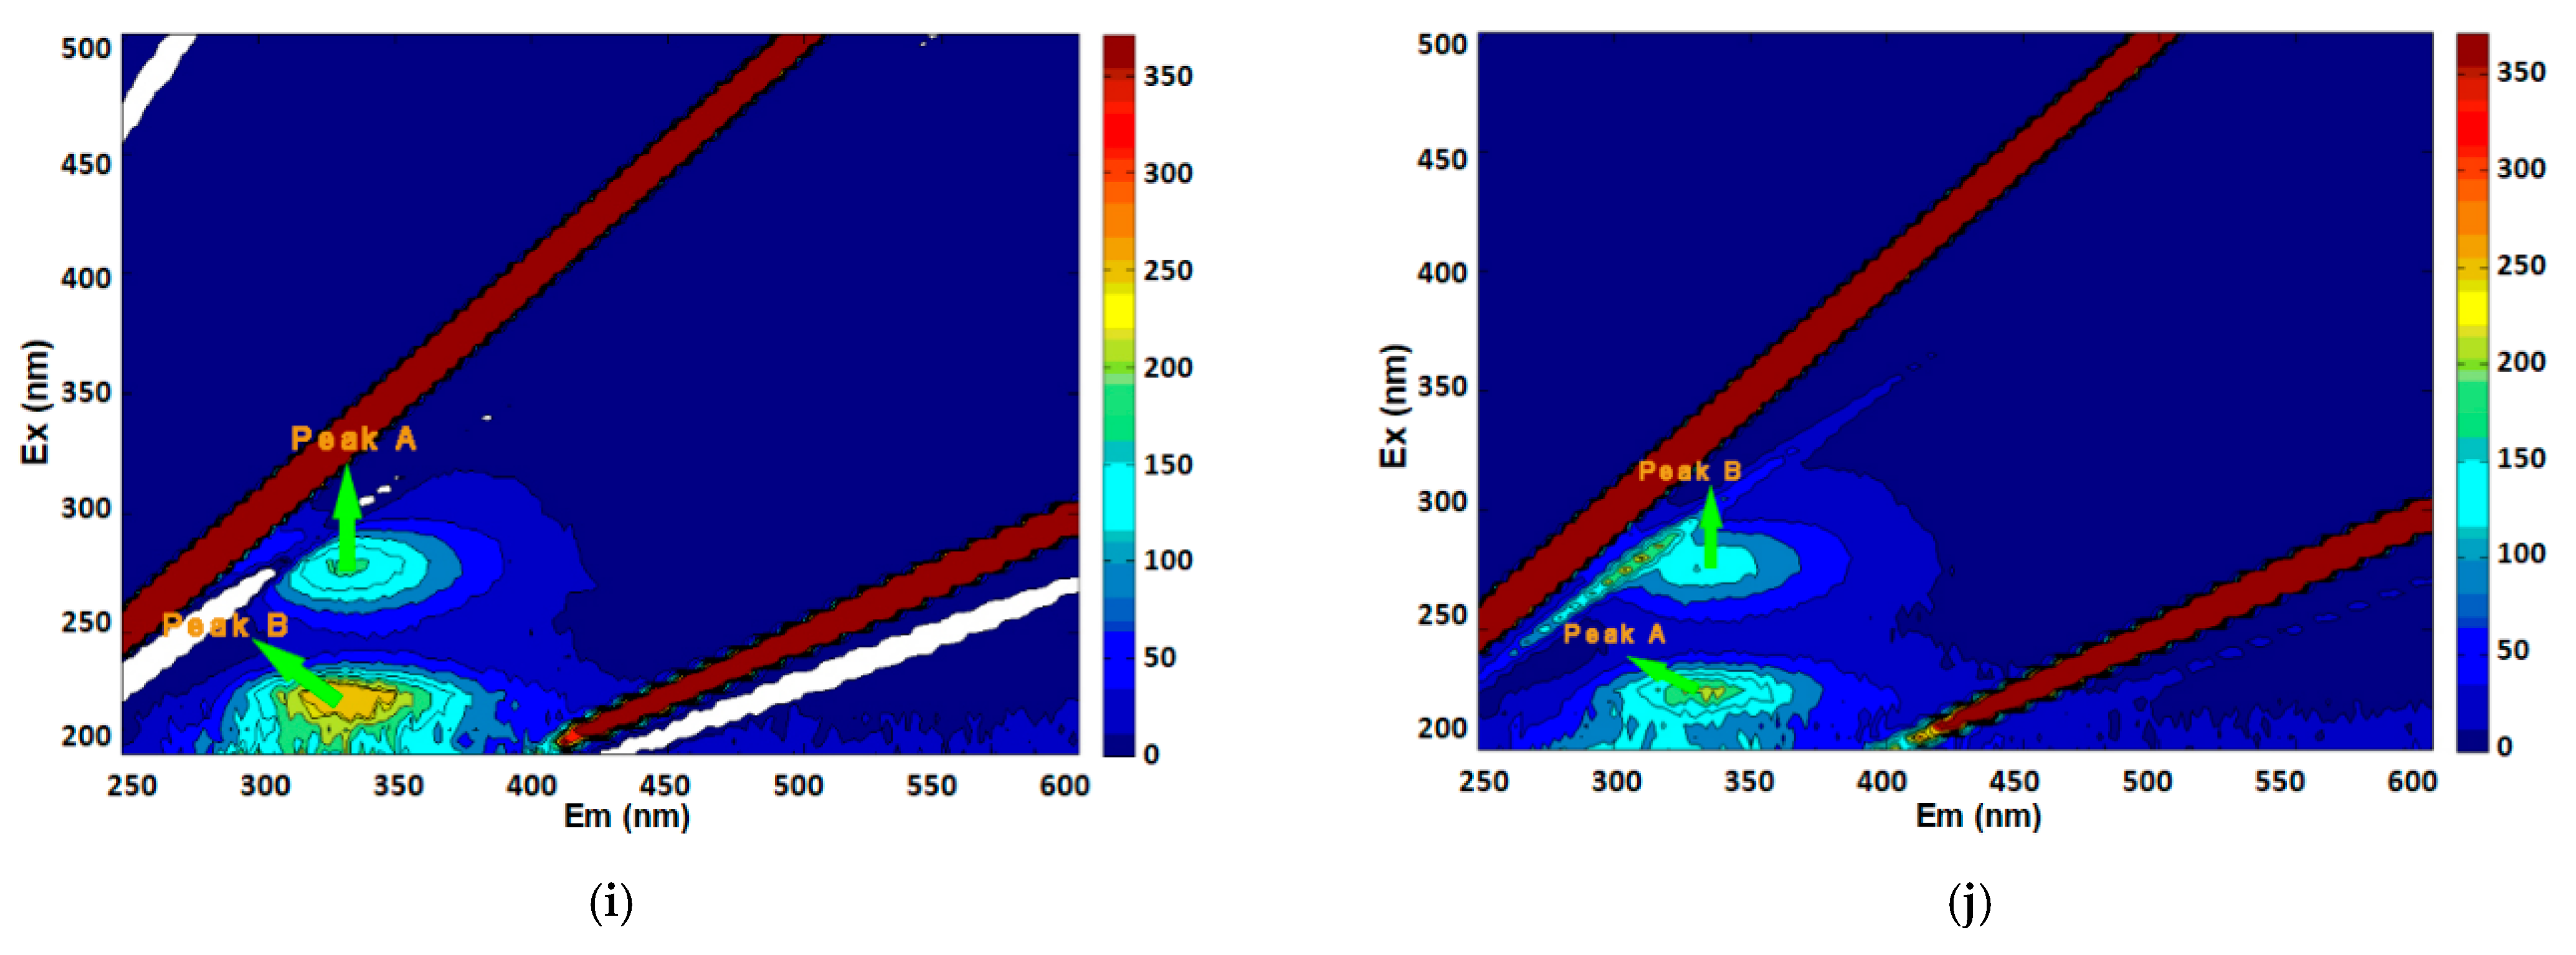
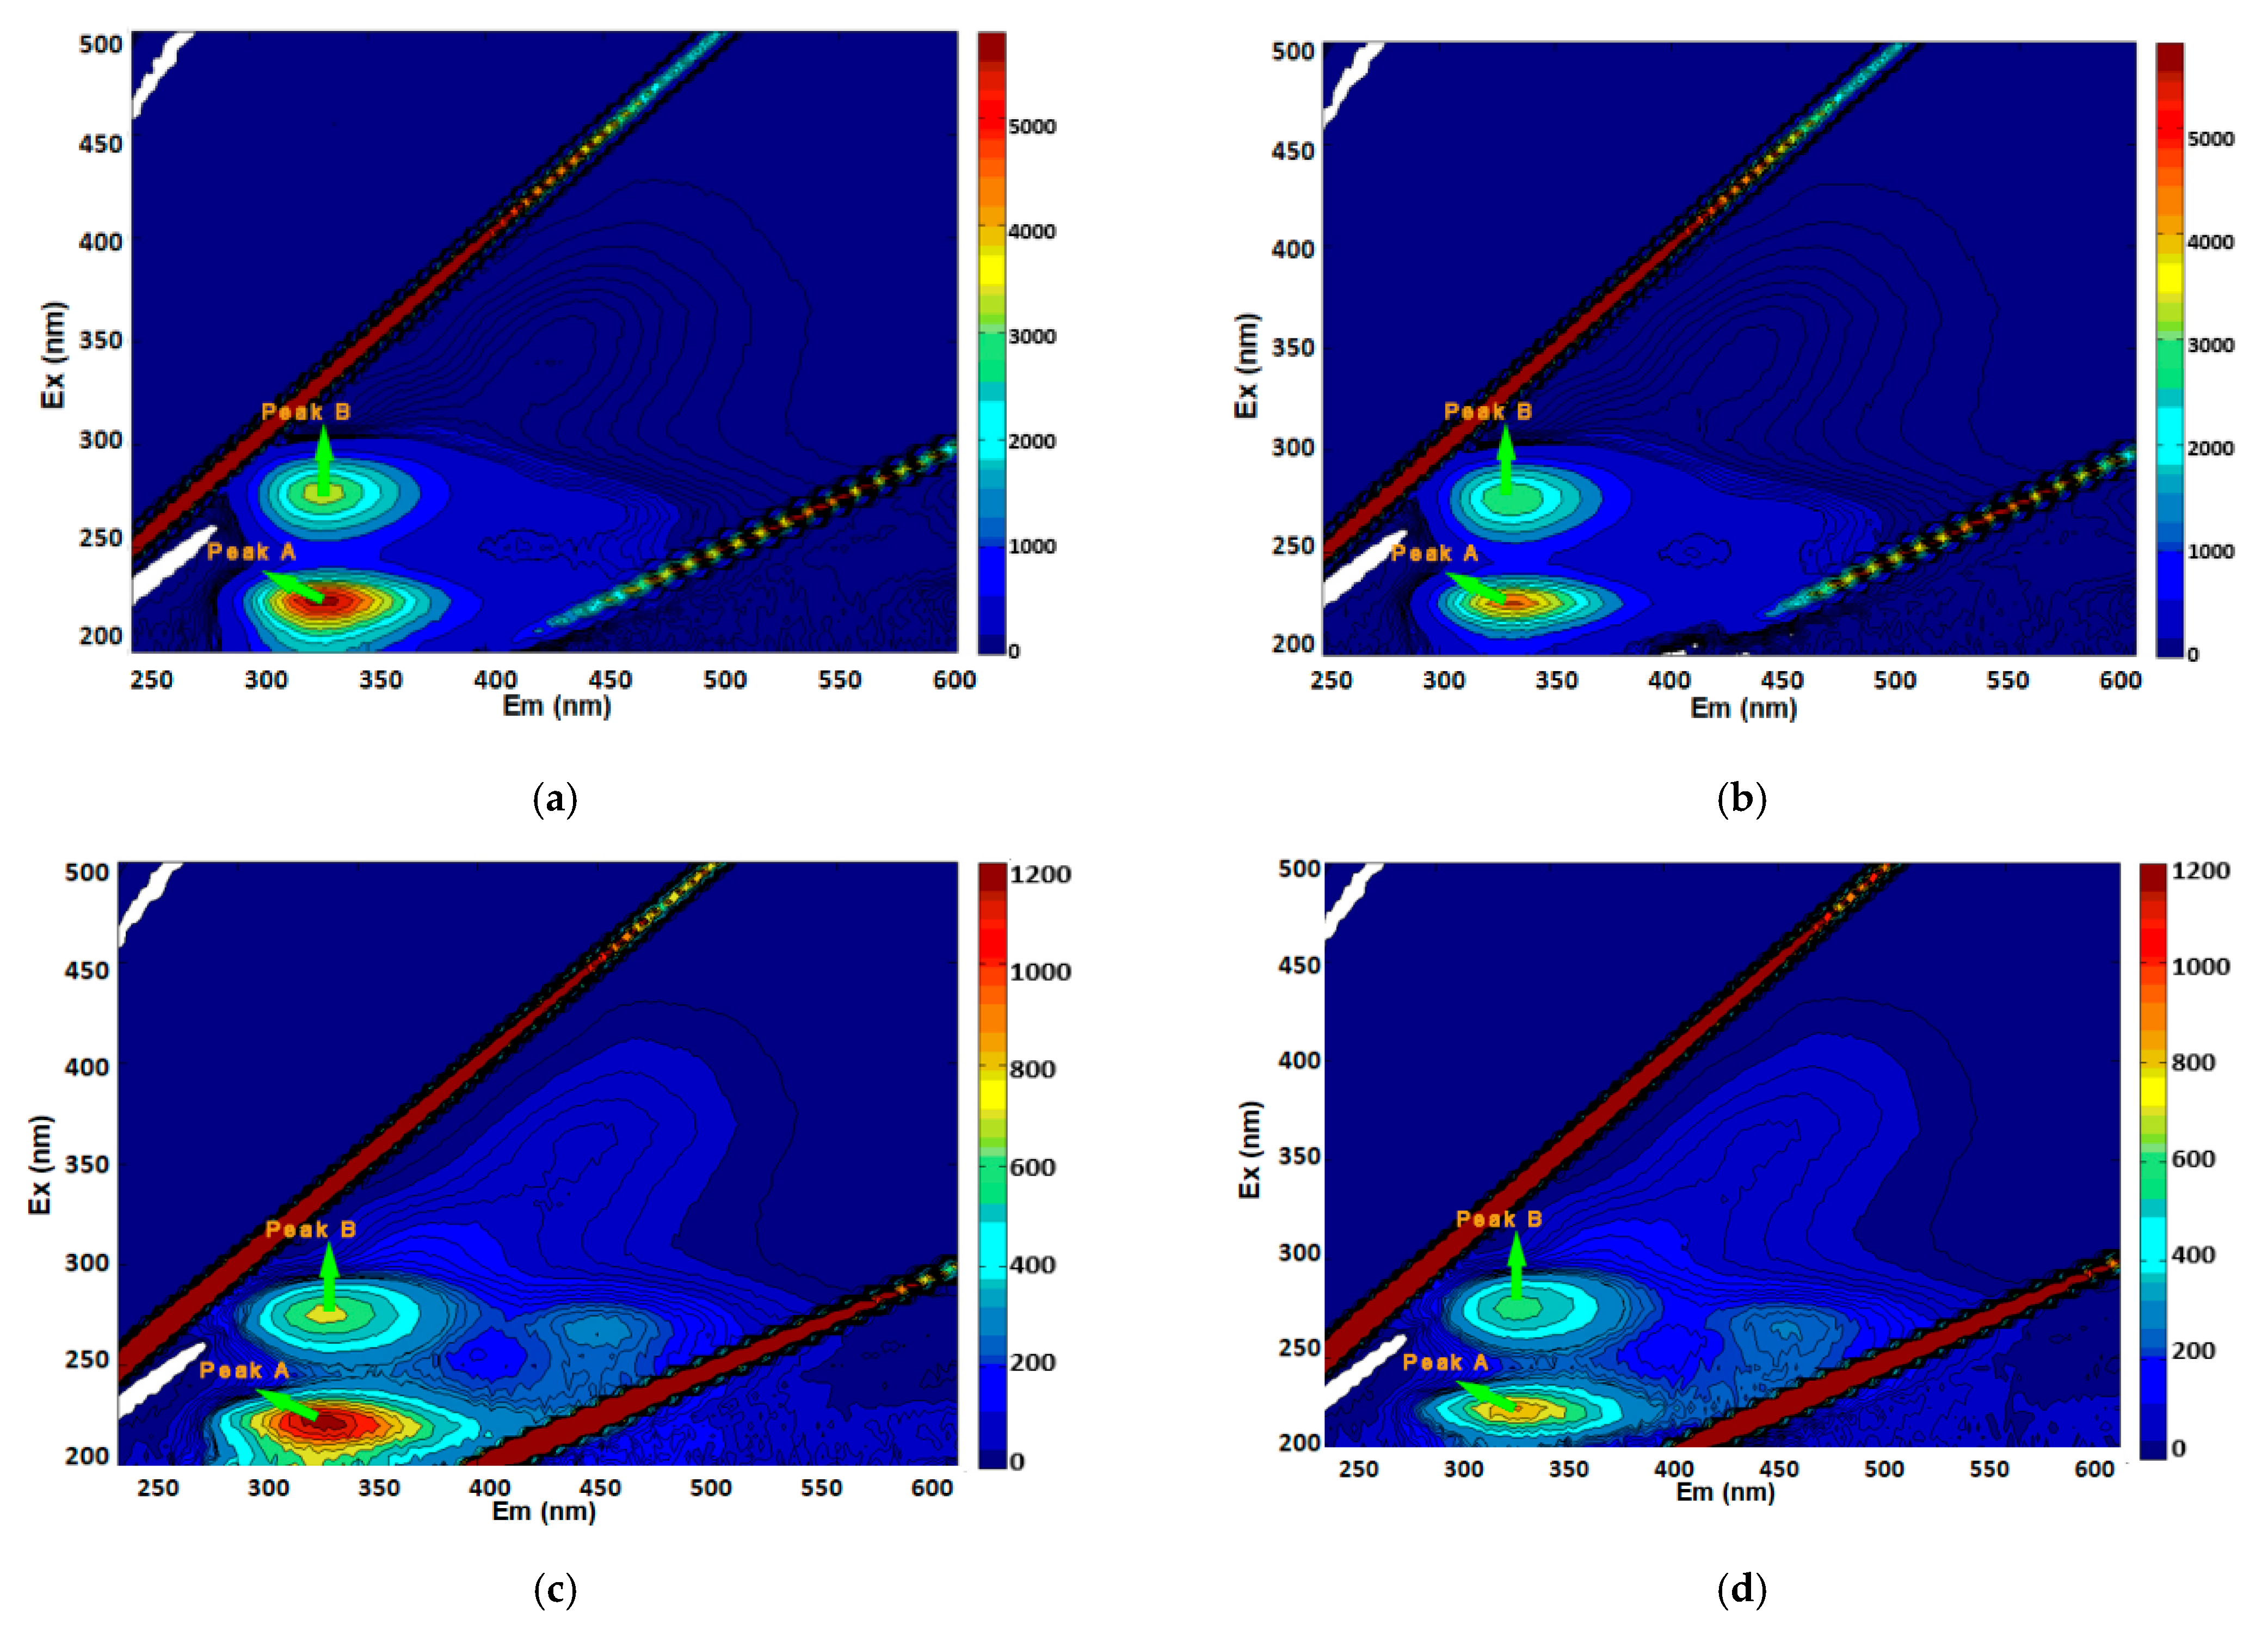
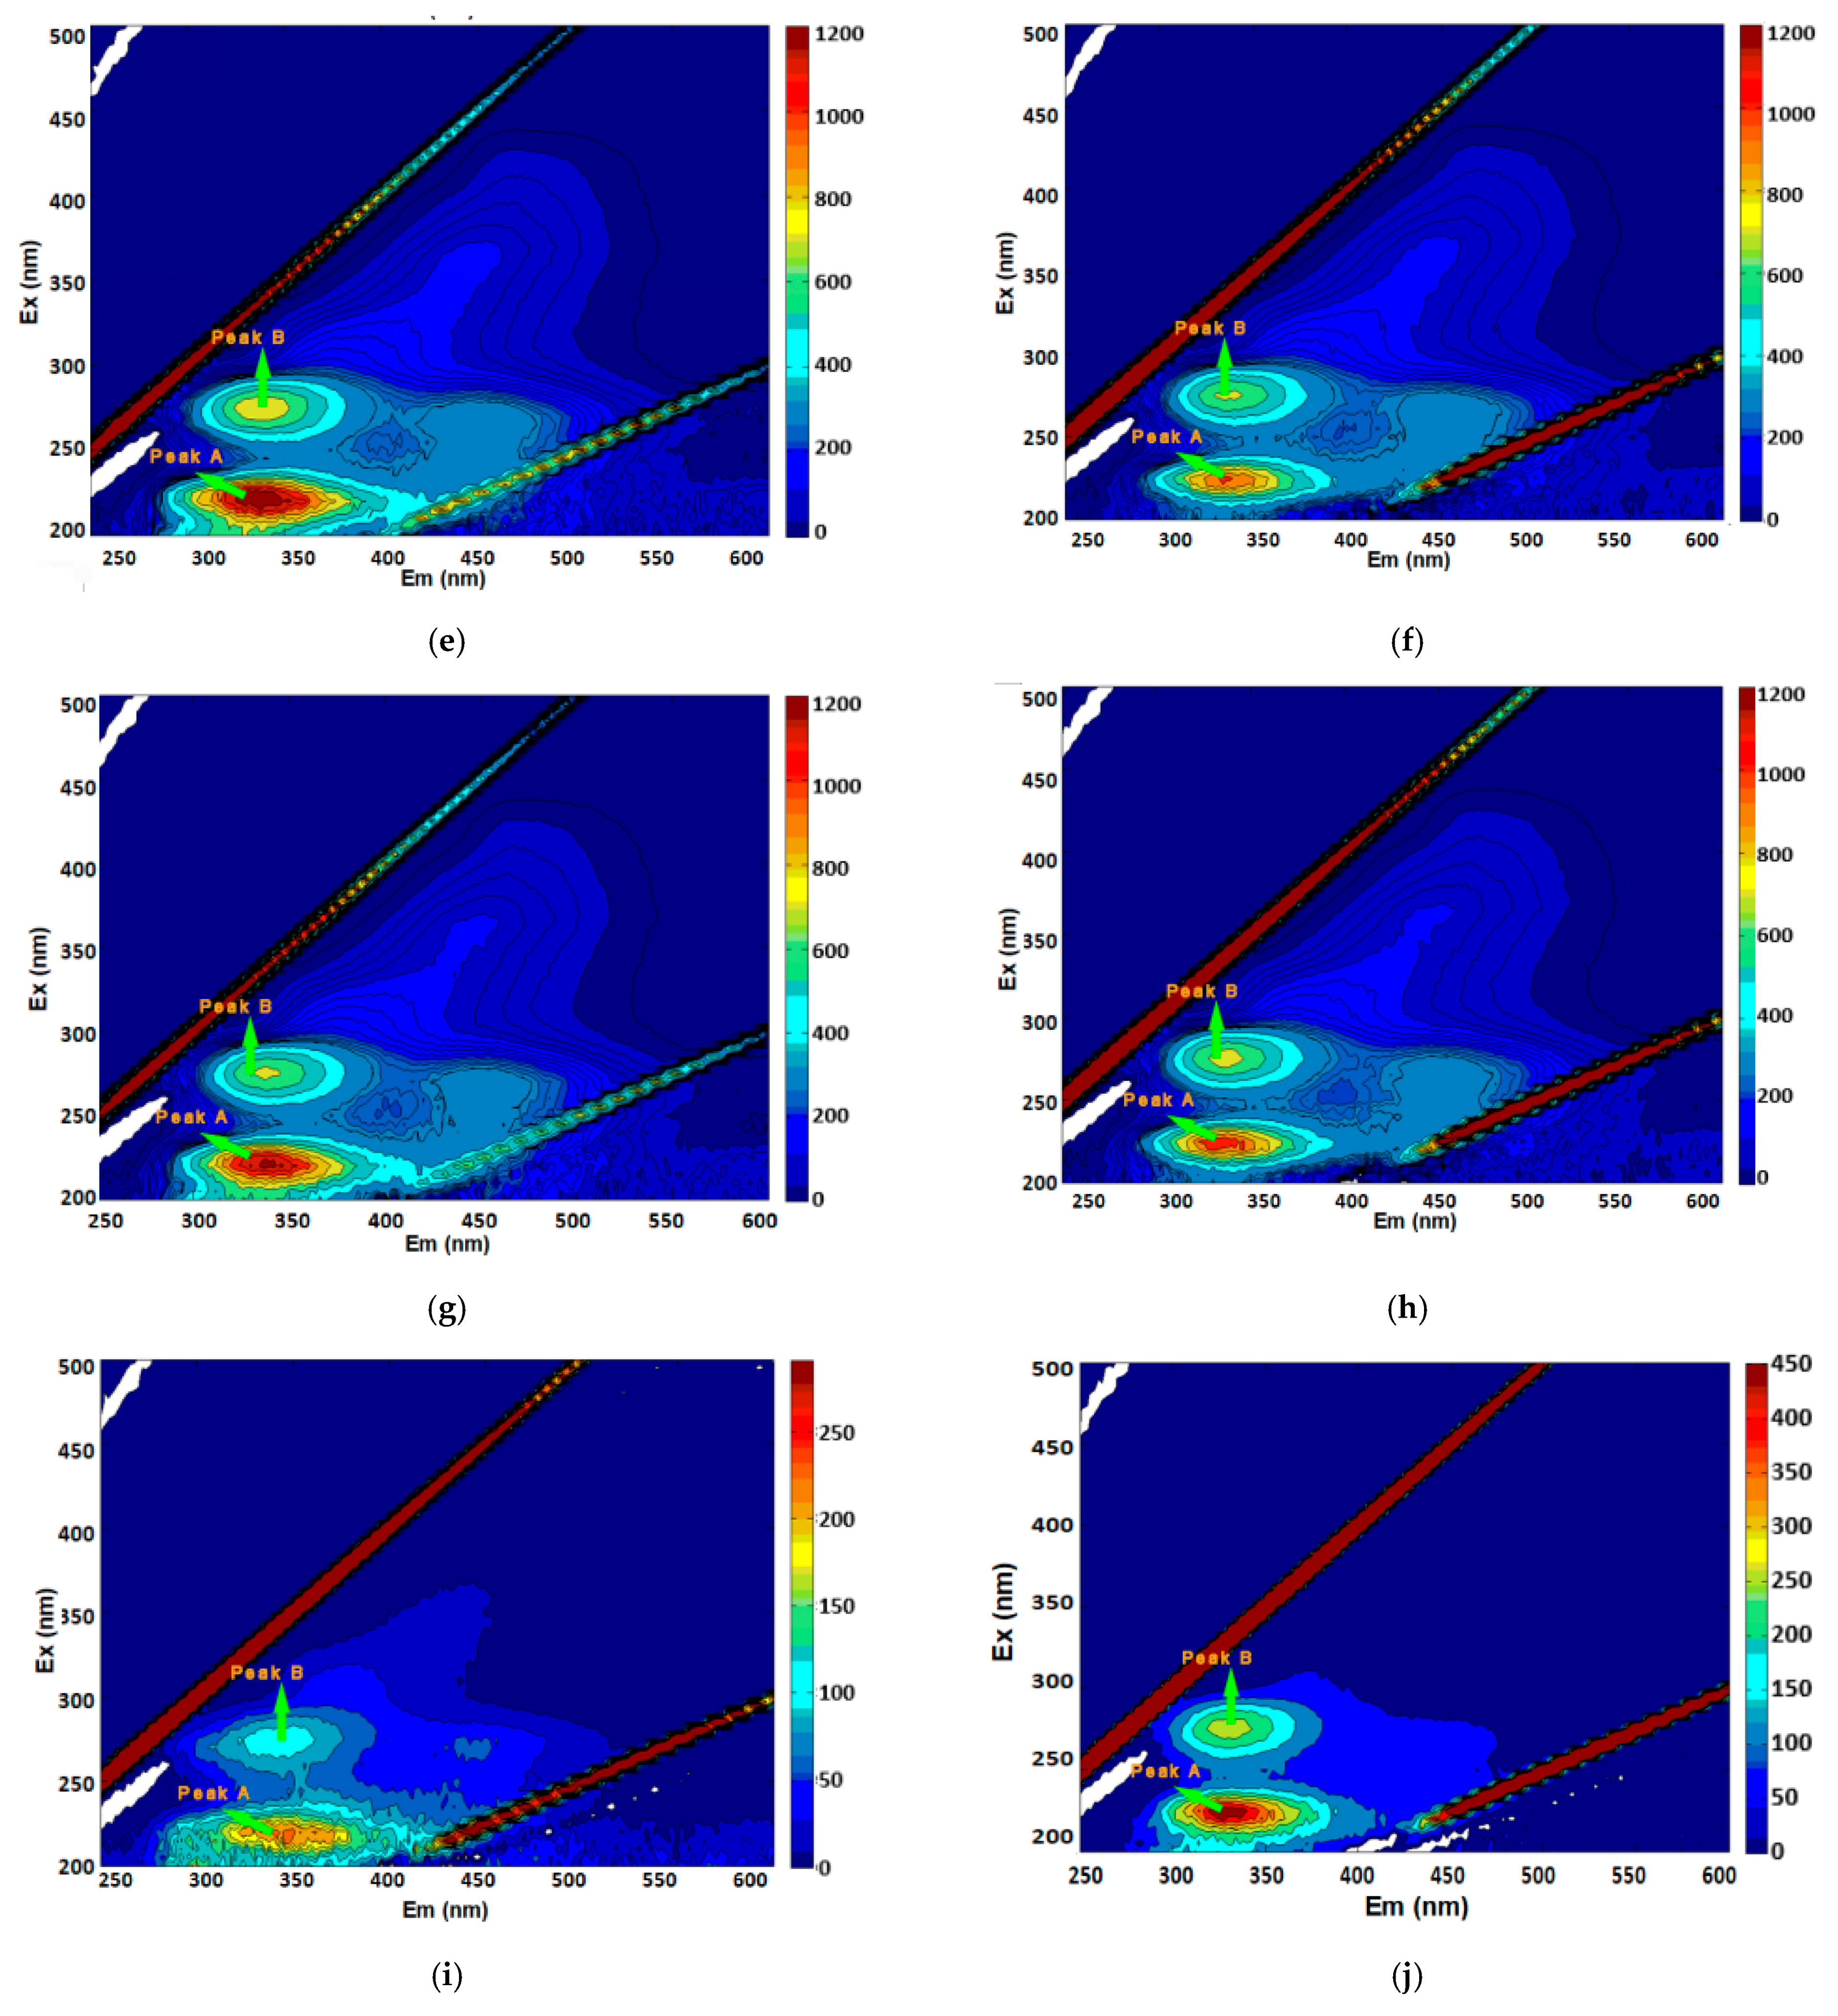
3.1. Fluorescence Characteristics of EPSs of Activated Sludge

In this paper, the EPSs of activated sludge are divided into three types: S-EPSs, LB-EPSs, and TB-EPSs. They were divided into five fractions of different molecular weight ranges by the ultrafiltration membrane method described above. The five different molecular weight ranges were 100 kDa–0.7 μm, 10–100 kDa, 5–10 kDa, 1–5 kDa, and less than 1 kDa. Each group of EPSs (i.e., slime, LB-EPSs, TB-EPSs) was separated based on these five molecular weight ranges, represented as S-EPS1 to S-EPS5, LB-EPS1 to LB-EPS5, and TB-EPS1 to TB-EPS5, respectively.
The TOC content in pristine sludge samples and EPS samples were measured to evaluate EPSs in pristine sample and in the five fractions representing different molecular weight ranges. The results showed that a significant proportion of the total EPSs was S-EPSs (65%). A possible explanation for this might be that S-EPSs were mainly composed of microbial metabolites, and were free in solution instead of being adsorbed on the surface of the cells. Thus, S-EPSs accounted for the majority of TOC in pristine. As shown in Figure 2, based on different molecular weights, EPSs of large molecular weight (100 KDa–0.7 μm) had a comparatively higher presence, and especially in LB-EPSs and TB-EPSs, EPSs of the largest molecular weight made up a much greater proportion of the total than those of the smallest molecular weight. This difference might influence the binding ability of EPSs with heavy metals.
Different types of organic matter have different fluorescence characteristics, so the analysis of three-dimensional fluorescence spectroscopy can reflect the nature of the type, content, composition, and structure of the organic matter. We used a three-dimensional fluorescence spectrometer to perform a three-dimensional fluorescence analysis of S-EPSs, LB-EPSs, and TB-EPSs, and the results showed that there were two fluorescence peaks in the three-layered EPSs. The three-dimensional fluorescence data were analyzed by PARAFAC. As illustrated in Figure 3, in S-EPSs, the wavelength of peak A was Ex/Em = 225–275/336–340 nm and the wavelength of peak B was Ex/Em = 275–285/324–336 nm. According to the position of the fluorescence peak, the literature indicates that peak A and peak B represent protein-like fluorescent substances [39,40]. In LB-EPSs, the wavelength of peak A was Ex/Em = 225–265/334–336 nm and the wavelength of peak B was Ex/Em = 275–285/328–334 nm. Protein-like substances were represented by peak A and the fluorescent substances represented by peak B were tryptophan-like and protein-like substances. The wavelength of peak A in TB-EPSs was Ex/Em = 220–225/334–336nm and the wavelength of peak B was Ex/Em = 275–280/328–334 nm. The fluorescent substances attributed to peak A were protein-like, while those of peak B were tryptophan-like and protein-like. This indicates that although LB-EPSs and TB-EPSs were located in the outer and inner layers of the sludge, their components and material structures were basically the same. Other fluorescent substances such as aromatic proteins, soluble microbial metabolites, and tyrosine-like substances were not detected in this study. This is similar to the results of Wang Weigang et al. [41], who only detected a large amount of tryptophan in the fluorescence peak of stratified anammox granular EPS subfractions. Zhang Peng et al. [42] detected three fluorescence peaks in the EPSs of biofilm and suspended sludge—namely, peak A (tryptophan protein-like), peak B (aromatic protein-like substances), and peak C (tyrosine protein-like). In our study, only two peaks were found in the three types of EPS, which may be attributed to the fact that EPSs of activated sludge were selected. The position and value of the fluorescence peaks change with different sludge sources, and the fluorescent substances detected in each fluorescence peak were also not the same. Therefore, the fluorescence characteristics of EPSs were closely related to the sludge types. Further research on the differences in the peak values indicated that peak A in S-EPSs, LB-EPSs, and TB-EPSs was attributable to low-excitation tryptophan, while peak B could be attributed to high-excitation tryptophan. These two fluorescence peaks are related to the structure of the aromatic amino acids in EPSs.

3.2. Fluorescence Quenching Mechanism

3.2.1. Stern–Volmer Equation

Fluorescence quenching, broadly speaking, includes any action that can reduce the intensity of fluorescence. In the narrow sense, it only refers to the physical or chemical processes that lead to a decrease in fluorescence intensity due to the interaction between fluorescent molecules and solvent or solute molecules. The substance that causes the fluorescence decrease in the interaction process is called the fluorescence quencher. The quenching process competes with the luminescence process to shorten the life of the excited state of the luminescent molecule. We used the Stern–Volmer equation to fit the quenching constant and understand the quenching process of Pb2+ and Cu2+ through the change in the quenching constant to explore the quenching mechanism.
Figure 4 shows the change in the Stern–Volmer quenching rate constants of Pb2+ and Cu2+ at peak A of EPSs with different molecular weights. From Figure 4a–c, the quenching rate constant (Ksv) of the same heavy metal (Pb2+) and peak A of different EPSs of activated sludge first decreased, then increased with decreasing EPS molecular weight; similarly, it can be seen from Figure 4a,d that when different heavy metals (Pb2+, Cu2+) interacted with peak A of the same activated sludge EPSs, the Ksv decreased as the EPS molecular weight decreased. Interestingly, we found that in the process of combining heavy metals with activated sludge EPSs, the overall trend of the quenching rate constant had similar features, all of which were U-shaped. This is because the fluorescence quenching of heavy metals and activated sludge EPSs is a slow and stable process. There were some differences in the fluorescence quenching process between activated sludge EPSs with different molecular weights and heavy metals, and the interaction of heavy metals with activated sludge EPSs with larger molecular weight was more obvious.
Furthermore, we wanted to explore the fluorescence quenching process of heavy metals and activated sludge EPSs. The collision process between quenched matter and a fluorescent material is called dynamic quenching, while the process that quenches matter and fluorescent material and generates a nonluminescent material at this wavelength is called a static quenching process. It can be seen from Table 1 and Table 2 that the Kq values between Pb2+, Cu2+, and activated sludge EPSs (peak A) were greater than the quenching rate constant between the quencher and biomacromolecules (2.0 × 10¹⁰ mol/L·s), indicating that the fluorescence quenching was caused by the formation of new conjugates—that is, static quenching was the main reason for the fluorescence quenching between Pb2+ and Cu2+ and the fluorescent group A in the EPSs of activated sludge. In order to quantify the complexation between EPSs and heavy metals, Wang Jin et al. used the Stern–Volmer equation to evaluate the conditional stability constant of EPS binding with heavy metals. An R2 value greater 0.90 indicates that the equation can accurately describe the complexation process [25]. From the results of this experiment, only the conditional stability constant R2 of Pb2+ complexation with S-EPS4 was less than 0.90, which indicated that the protein-like compound in S-EPS4 had a weak complexation ability with Pb2+. On the whole, R2 was greater than 0.90, showing a linear correlation; the Stern–Volmer equation could adequately judge the complexing ability of heavy metals and EPSs in this experiment.

3.2.2. Binding Constant and Number of Binding Sites

In order to further explore the binding ability of EPSs to Cu2+, S-EPSs, LB-EPSs, and TB-EPSs of different molecular weights were quenched and titrated to determine the binding constant logKb of different components in EPSs to Cu2+ and the number of binding sites (n). The binding constants (logKb) and the number of binding sites (n) between Cu2+ and peak A are shown in Table 3.
From the results in the table, it can be seen that for S-EPSs, LB-EPSs, and TB-EPSs fractions with different molecular weights, the binding sites between peak A and Cu2+ was less than 1, except for S-EPS5 (molecular weight below 1 kDa). The binding sites of peak B and Cu2+ were all less than 1, indicating that there was only one type of adsorption site for Cu2+ in activated sludge EPSs. There was no significant difference in the binding constants, but they were more inclined to protein-like fluorescent substances.
In addition, except for S-EPS2 with a molecular weight of 10–100 kDa and TB-EPSs with a molecular weight of 10–100 kDa, the results of which were abnormal (S-EPS2: The binding constant of activated sludge EPSs (peak A) and Cu2+ was 1.8442, which is smaller than the binding constant of activated sludge EPSs (peak B) and Cu2+; TB-EPS2: The binding constant of activated sludge EPSs (peak A) and Cu2+ was 1.1721 less than that of the activated sludge binding constant of activated sludge EPSs (peak B) and Cu2+), the binding constant (logKb) of Cu2+ and activated sludge EPSs (peak A) was higher than that of heavy metal Cu2+ and activated sludge EPSs (peak B), indicating that the binding of Cu2+ with the compounds represented by fluorescence peak A was more stable than that of activated sludge EPSs (peak B). The effective quenching constants logKa of S-EPSs, LB-EPSs, and TB-EPSs with Cu2+ were in the range 0.78–3.67, 0.78–3.12, and 0.83–2.99, respectively. This shows that the interaction between S-EPSs and Cu2+ formed a more stable composite than the LB-EPSs and TB-EPSs layers.

3.3. Interaction between Heavy Metals and EPSs of Activated Sludge with Different Molecular Weights

We compared the fluorescence peaks before adding a fluorescence quenching agent (heavy metal salt) with those when the concentration of the fluorescent quenching agent reached 100 μmol/L. The results showed that the quenching agent had an effect on the quenching of the fluorescence peak. When the concentration of the quenching agent increased, the quenching of the fluorescence peak of EPSs also changed. When the concentration reached 100 µmol/L, the peak value of the EPS fluorescence peak did not change, indicating that a binding saturation state had been reached.
Table 4 shows the change in the EPS fluorescence peak value when the concentration of heavy metal salt reached 100 μmol/L. It can be seen from the table that the fluorescence of EPSs (peak A) was higher than that of EPSs (peak B), indicating that the interaction of heavy metals with EPSs (peak A) was stronger than that with EPSs (peak B) in the process of the interaction between heavy metals and activated sludge EPSs. The analysis of the binding constants in Section 3.2.2 can also explain this result. In addition, after cadmium nitrate, lead nitrate, copper nitrate, and zinc nitrate were combined with S-EPS1, LB-EPS1, and TB-EPS1 fractions (i.e., those with the largest molecular weight (100 kDa–0.7 μm)), the fluorescence values reached their highest level. This showed that EPSs with the largest molecular weight could combine with heavy metals well and exhibited the best fluorescence quenching effect. It can be seen from the variation in the fluorescence peak values of activated sludge EPSs that the peak value of the fluorescence increased and decreased after metal salt solution was added, indicating that heavy metals could not only complex with the compounds responsible for the fluorescence peak to produce nonfluorescent substances, but also produce fluorescent substances, which had a good quenching effect on the fluorescence peak of activated sludge EPSs, and the strength of the quenching effect was ordered as Pb2+ > Cd2+ > Cu2+ > Zn2+.

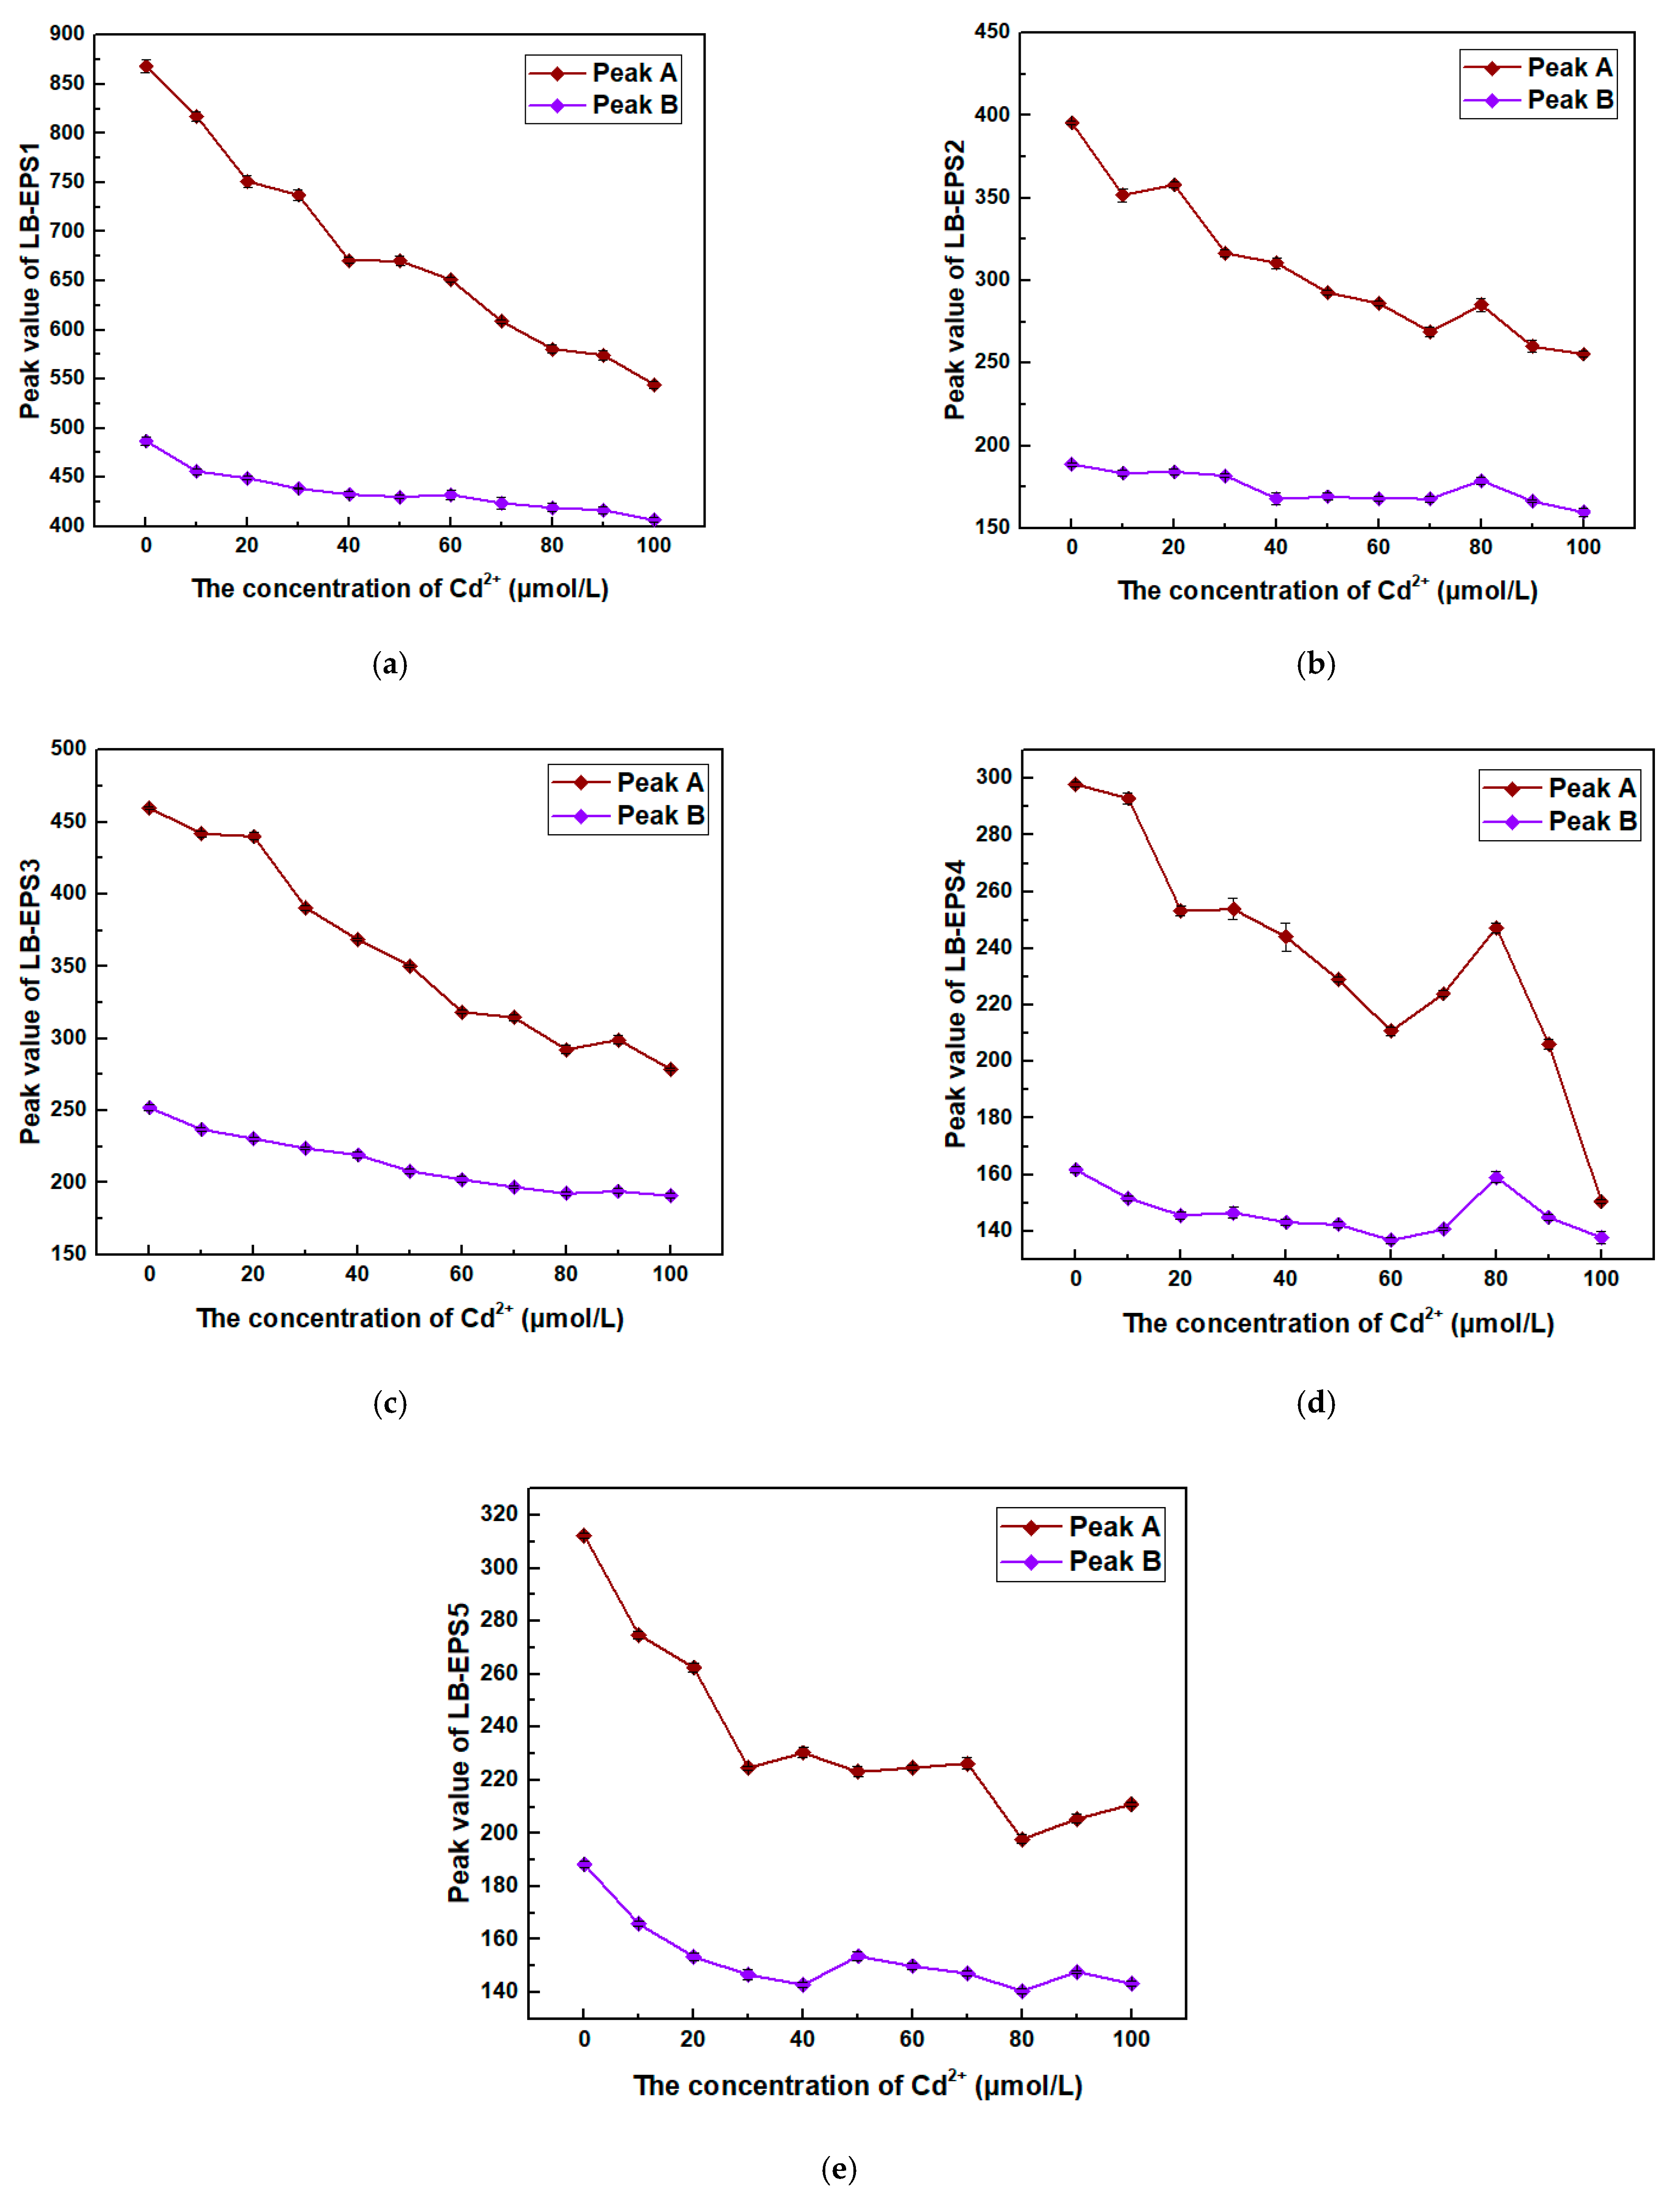
3.4. The Quenching Effect of Heavy Metals on Activated Sludge EPSs

Taking the interaction of Cd2+, Cu2+, and LB-EPSs with different molecular weights as an example, the fluorescence peaks of LB-EPSs were observed after adding quenching agent. Figure 5 and Figure 6 both reflect an obvious trend. With an increase in the concentration of quenching agent, the quenching effect of heavy metals on the fluorescence peak was more obvious. At the initial stage of quenching agent, the change of the fluorescence peak was obvious, showing a continuous downward trend, but as the concentration of heavy metals in the quenching agent increased, the change tended to be more gradual, and finally the fluorescence peak was almost unchanged. During the interaction with heavy metals, the fluorescence value of peak B was lower than that of peak A. Therefore, compared with peak B the quenching effect of heavy metals on peak A was more obvious. This was because the initial fluorescence of peak B was small, so the addition of a heavy metal quenching agent could not give it a large downward trend. Therefore, the quenching effect of Cd2+ or Cu2+ for peak A was much stronger than that for peak B.
In this study, cadmium nitrate was used as a fluorescence quencher to interact with extracellular polymers of activated sludge with different molecular weights. We took cadmium nitrate as an example. From Figure 7, Figure 8 and Figure 9, it can be clearly seen that after adding cadmium nitrate the peak values of peak A and peak B decreased, indicating that the quenching agent had an obvious quenching effect on fluorescence peaks A and B of slime, LB-EPSs, and TB-EPSs with different molecular weights. However, in Figure 9i,j, peak A and peak B of TB-EPS5 showed an abnormal behavior after adding the quencher. Compared with the original peak value, the fluorescence peaks of peak A and peak B both increased. It is possible that cadmium nitrate reacted with TB-EPS5 to form a luminescent substance, affecting the quenching effect.

4. Conclusions

In this study, three-dimensional fluorescence spectroscopy was used to explore the quenching mechanism of heavy metal ions and EPSs and to understand the interaction between heavy metals and EPSs. The findings clearly indicate that although LB-EPSs and TB-EPSs are located in the outer and inner layers of sludge, respectively, their composition and material structure are basically the same. The activated sludge EPSs included two fluorophores, both of which were protein-like substances. The compounds attributable to peak A in fluorescence spectra are high-excitation tryptophans and those attributable to peak B are low-excitation tryptophans. Peak A and peak B could be quenched by heavy metals, and the quenching process was static quenching. Compared with peak B, the quenching effect of heavy metals on peak A was more significant, indicating that the combination of heavy metals and EPSs mainly occurred on the peak A compounds and their binding ability was more stable. The interaction between heavy metals and the EPSs with the highest molecular weight evaluated here (100 kDa–0.7 μm) was more stable than that with the other ESPs. The strength of the quenching effect of different heavy metals on EPSs was ordered as Pb2+ > Cd2+ > Cu2+ > Zn2+.

Author Contributions

Conceptualization, Q.W., C.W. and L.H.; methodology, J.L., Y.Y., W.Q., Q.K. and L.H.; software, J.L. and L.H.; investigation, J.L., W.Q., Y.Y., L.H., Q.K. and Q.C.; data curation, J.L., W.Q., C.W. and Y.Y.; writing—original draft preparation, J.L., Y.Y., W.Q., L.H. and Q.W.; writing—review and editing, J.L., W.Q., Y.Y. and L.H.; supervision, Q.W., C.W., Q.K. and Q.C.; funding acquisition, Q.W. All authors have read and agreed to the published version of the manuscript.

Funding

This research was supported the National Key Research and Development Program of China (Grant No. 2018YFE0103700); by Zhejiang Provincial Natural Science Foundation of China (Grant Nos. LQ18C030002 and LY20D030002); by the National Natural Science Foundation of China (Nos. 31570364 and 61871293); by the Science and Technology Program of Cangnan, China (Grant No. 2018G29); by the Science and Technology Major Program of Wenzhou, China (Grant No. 2018ZG002); by the Postgraduate Innovation Foundation of Wenzhou University, China (Grant No. 3162019006); and by Scientific Research Fund of Zhejiang Provincial Education Department (Grant No. Y202044305).

Institutional Review Board Statement

Not applicable.

Informed Consent Statement

Not applicable.

Acknowledgments

All authors greatly appreciate the anonymous reviewers and editors for their careful comments and valuable suggestions to improve the manuscript.

Conflicts of Interest

The authors declare no conflict of interest.

References

  1. Zhao, Y.F.; Xu, M.; Liu, Q.; Wang, Z.F.; Zhao, L.; Chen, Y. Study of heavy metal pollution, ecological risk and source apportionment in the surface water and sediments of the Jiangsu coastal region, China: A case study of the Sheyang Estuary. Mar. Pollut. Bull. 2018, 137, 602–609. [Google Scholar] [CrossRef]
  2. Niu, Y.; Jiang, X.; Wang, K.; Xia, J.D.; Jiao, W.; Niu, Y.; Yu, H. Meta analysis of heavy metal pollution and sources in surface sediments of Lake Taihu, China. Sci. Total Environ. 2020, 700, 134509. [Google Scholar] [CrossRef] [PubMed]
  3. Li, X.L.; Shen, H.L.; Zhao, Y.J.; Cao, W.X.; Hu, C.W.; Sun, C. Distribution and Potential Ecological Risk of Heavy Metals in Water, Sediments, and Aquatic Macrophytes: A Case Study of the Junction of Four Rivers in Linyi City, China. Int. J. Environ. Res. Public Health 2019, 16, 2861. [Google Scholar] [CrossRef] [PubMed] [Green Version]
  4. Aftab, B.; Khan, S.J.; Maqbool, T.; Hankins, N.P. Heavy metals removal by osmotic membrane bioreactor (OMBR) and their effect on sludge properties. Desalination 2017, 403, 117–127. [Google Scholar] [CrossRef]
  5. Zhang, J.; Guo, Y.M.; Fan, S.K.; Wang, S.; Shi, Q.; Zhang, M.H.; Zhang, J.F. Detoxification of heavy metals attributed to biological and non–biological complexes in soils around copper producing areas throughout China. J. Clean. Prod. 2021, 292, 125999. [Google Scholar] [CrossRef]
  6. Dang, C.Y.; Yang, Z.X.; Liu, W.; Du, P.H.; Feng, C.; He, K. Role of extracellular polymeric substances in biosorption of Pb2+ by a high metal ion tolerant fungal strain Aspergillus niger PTN31. J. Environ. Chem. Eng. 2018, 6, 2733–2742. [Google Scholar] [CrossRef]
  7. Dai, Q.X.; Ma, L.P.; Ren, N.Q.; Ning, P.; Guo, Z.Y.; Xie, L.G. Research on the variations of organics and heavy metals in municipal sludge with additive acetic acid and modified phosphogypsum. Water Res. 2019, 155, 42–55. [Google Scholar] [CrossRef]
  8. Vimalnath, S.; Subramanian, S. Studies on the biosorption of Pb(II) ions from aqueous solution using extracellular polymeric substances (EPS) of Pseudomonas aeruginosa. Colloids Surf. B Biointerfaces 2018, 172, 60–67. [Google Scholar] [CrossRef]
  9. Kun, Y.; Wang, Q.N.; Lv, M.; Chen, L.X. Microorganism remediation strategies towards heavy metals. Chem. Eng. J. 2019, 360, 1553–1563. [Google Scholar] [CrossRef]
  10. Joseph, L.; Jun, B.; Flora, J.R.V.; Park, C.M.; Yoon, Y. Removal of heavy metals from water sources in the developing world using low-cost materials: A review. Chemosphere 2019, 229, 142–159. [Google Scholar] [CrossRef]
  11. Sophie, C.; Gilles, G.; Michel, B. Effect of extraction method on EPS from activated sludge: An HPSEC investigation. J. Hazar. Mater. 2007, 140, 129–137. [Google Scholar] [CrossRef]
  12. Cao, D.Q.; Song, X.; Fang, X.M. Membrane filtration-based recovery of extracellular polymer substances from excess sludge and analysis of their heavy metal ion adsorption properties. Chem. Eng. J. 2018, 354, 866–874. [Google Scholar] [CrossRef]
  13. Siddharth, T.; Sridhar, P.; Vinila, V.; Tyagi, R.D. Environmental applications of microbial extracellular polymeric substance (EPS): A review. J. Environ. Manag. 2021, 287, 112307. [Google Scholar] [CrossRef]
  14. Klai, N.; Ram, S.K.; Sellamuthu, B.; Tyagi, R.D. Critical review of EPS production, synthesis and composition for sludge flocculation. J. Environ. Sci. 2018, 66, 225–245. [Google Scholar] [CrossRef] [Green Version]
  15. Xu, Q.Y.; Wang, H.D.; Wang, Q.D.; Zhang, W.J.; Wang, D.S. Characterization of changes in extracellular polymeric substances and heavy metal speciation of waste activated sludge during typical oxidation solubilization processes. J. Environ. Sci. 2019, 80, 146–158. [Google Scholar] [CrossRef]
  16. Zhao, W.Q.; Yang, S.S. Bacterial cell surface properties: Role of loosely bound extracellular polymeric substances (LB-EPS). Colloids Surf. B Biointerfaces 2015, 128, 600–607. [Google Scholar] [CrossRef]
  17. Ruan, X.D.; Li, L.; Liu, J.X. Flocculating characteristic of activated sludge flocs: Interaction between Al3+ and extracellular polymeric substances. Environ. Sci. 2013, 25, 916–924. [Google Scholar] [CrossRef]
  18. Yan, P.; Xia, J.X.; Chen, Y.P. Thermodynamics of binding interactions between extracellular polymeric substances and heavy metals by isothermal titration microcalorimetry. Bioresour. Technol. 2017, 232, 354–363. [Google Scholar] [CrossRef]
  19. Cao, F.; Bourven, I.; Guibaud, G.; Rene, E.R.; Lens, P.N.L.; Pechaud, Y.; van Hullebusch, E.D. Alteration of the characteristics of extracellular polymeric substances (EPS) extracted from the fungus Phanerochaete chrysosporium when exposed to sub-toxic concentrations of nickel (II). Int. Biodeterior. Biodegrad. 2018, 129, 179–188. [Google Scholar] [CrossRef]
  20. Kalpana, R.; Angelaalincy, M.J.; Kamatchirajan, B.V.; Vasantha, V.S.; Ashokkumar, B.; Ganesh, V.; Varalakshmi, P. Exopolysaccharide from Bacillus cereus VK1: Enhancement, characterization and its potential application in heavy metal removal. Colloids Surf. B 2018, 171, 327–334. [Google Scholar] [CrossRef]
  21. Wu, J.; Ma, L.L.; Zeng, R.J. Role of extracellular polymeric substances in efficient chromium(VI) removal by algae-based Fe/C nano-composite. Chemosphere 2018, 211, 608–616. [Google Scholar] [CrossRef] [PubMed]
  22. Maqbool, T.; Quang, V.L.; Asif, M.B.; How, Y.N.; Zhang, Z.H. Fate and role of fluorescence moieties in extracellular polymeric substances during biological wastewater treatment: A review. Sci. Total Environ. 2020, 718, 137291. [Google Scholar] [CrossRef]
  23. Wu, J.; Zhang, H.; Shao, L.M.; He, P.J. Fluorescent characteristics and metal binding properties of individual molecular weight fractions in municipal solid waste leachate. Environ. Pollut. 2012, 162, 63–71. [Google Scholar] [CrossRef] [PubMed]
  24. Bhaskar, P.V.; Bhosle, N.B. Bacterial extracellular polymeric substance (EPS): A carrier of heavy metals in the marine food-chain. Environ. Int. 2006, 32, 191–198. [Google Scholar] [CrossRef] [PubMed]
  25. Wang, J.; Li, Q.; Li, M.M.; Chen, T.H.; Zhou, Y.F.; Yue, Z.B. Competitive adsorption of heavy metal by extracellular polymeric substances (EPS) extracted from sulfate reducing bacteria. Bioresour. Technol. 2014, 163, 374–376. [Google Scholar] [CrossRef]
  26. Domínguez, L.; Rodríguez, M.; Prats, D. Effect of different extraction methods on bound EPS from MBR sludges. Part I: Influence of extraction methods over three-dimensional EEM fluorescence spectroscopy fingerprint. Desalination 2010, 261, 19–26. [Google Scholar] [CrossRef]
  27. Yu, G.H.; He, P.J.; Shao, L.M.; Zhu, Y.S. Extracellular proteins, polysaccharides and enzymes impact on sludge aerobic digestion after ultrasonic pretreatment. Water Res. 2008, 42, 1925–1934. [Google Scholar] [CrossRef]
  28. Yan, Z.R.; Meng, H.S.; Yang, X.Y.; Zhu, Y.Y.; Li, X.Y.; Xu, J.S.; Guo, P. Insights into the interactions between triclosan (TCS) and extracellular polymeric substance (EPS) of activated sludge. J. Environ. Manag. 2019, 232, 219–225. [Google Scholar] [CrossRef]
  29. Felz, S.; Vermeulen, P.; van Loosdrecht, M.C.M.; Lin, Y.M. Chemical characterization methods for the analysis of structural extracellular polymeric substances (EPS). Water Res. 2019, 157, 201–208. [Google Scholar] [CrossRef]
  30. Li, J.J.; Jiang, Z.Q.; Chen, S.S.; Wang, T.; Jiang, L.; Wang, M.X.; Wang, S.M.; Li, Z. Biochemical changes of polysaccharides and proteins within EPS under Pb2+ stress in Rhodotorula mucilaginosa. Ecotoxicol. Environ. Saf. 2019, 174, 484–490. [Google Scholar] [CrossRef]
  31. Lin, F.; Zhu, X.L.; Li, J.G.; Yu, P.R.; Luo, Y.; Liu, M.R. Effect of extracellular polymeric substances (EPS) conditioned by combined lysozyme and cationic polyacrylamide on the dewatering performance of activated sludge. Chemosphere 2019, 235, 679–689. [Google Scholar] [CrossRef]
  32. Zhu, L.; Zhou, J.H.; Lv, M.L. Specific component comparison of extracellular polymeric substances (EPS) in flocs and granular sludge using EEM and SDS-PAGE. Chemosphere 2015, 121, 26–32. [Google Scholar] [CrossRef] [PubMed]
  33. Evina, K.; Simos, M.; Katherine, J.H. Industrial wastewater pre-treatment for heavy metal reduction by employing a sorbent-assisted ultrafiltration system. Chemosphere 2011, 82, 557–564. [Google Scholar] [CrossRef]
  34. Shao, Y.; Zhang, H.; Buchanan, I.; Mohammed, A.; Liu, Y. Comparison of extracellular polymeric substance (EPS) in nitrification and nitritation bioreactors. Int. Biodeterior. Biodegrad. 2019, 143, 104713. [Google Scholar] [CrossRef]
  35. Li, Q.; Song, W.; Sun, M.; Li, J.; Yu, Z. Composition change and adsorption performance of EPS from Bacillus vallismortis sp. induced by Na2S. Ecotoxicol. Environ. Saf. 2019, 185, 109679. [Google Scholar] [CrossRef] [PubMed]
  36. Ge, D.D.; Yuan, H.P.; Xiao, J.M.; Zhu, N.W. Insight into the enhanced sludge dewaterability by tannic acid conditioning and pH regulation. Sci. Total Environ. 2019, 679, 298–306. [Google Scholar] [CrossRef]
  37. Ai, J.; Zhang, W.J.; Liao, G.Y.; Chen, F.F.; Wang, D.S. A novel waste activated sludge multistage utilization strategy for preparing carbon-based Fenton-like catalysts: Catalytic performance assessment and micro-interfacial mechanisms. Water Res. 2019, 150, 473–487. [Google Scholar] [CrossRef]
  38. Stedmon, C.; Markager, S.; Bro, R. Tracing dissolved organic matter in aquatic environments using a new approach to fluorescence spectroscopy. Mar. Chem. 2003, 82, 239–254. [Google Scholar] [CrossRef]
  39. Li, L.; Wang, Y.; Zhang, W.J.; Yu, S.L.; Wang, X.Y.; Gao, N.Y. New advances in fluorescence excitation-emission matrix spectroscopy for the characterization of dissolved organic matter in drinking water treatment: A review. Chem. Eng. J. 2020, 381, 122676. [Google Scholar] [CrossRef]
  40. Yu, H.R.; Qu, F.S.; Zhang, X.L.; Shao, S.L.; Rong, H.W.; Liang, H.; Bai, L.M.; Ma, J. Development of correlation spectroscopy (COS) method for analyzing fluorescence excitation emission matrix (EEM): A case study of effluent organic matter (EfOM) ozonation. Chemosphere 2019, 228, 35–43. [Google Scholar] [CrossRef] [PubMed]
  41. Wang, W.G.; Yan, Y.; Zhao, Y.H.; Shi, Q.; Wang, Y.Y. Characterization of stratified EPS and their role in the initial adhesion of anammox consortia. Water Res. 2020, 169, 115223. [Google Scholar] [CrossRef] [PubMed]
  42. Zhang, P.; Fang, F.; Chen, Y.P.; Shen, Y.; Zhang, W. Composition of EPS fractions from suspended sludge and biofilm and their roles in microbial cell aggregation. Chemosphere 2014, 117, 59–65. [Google Scholar] [CrossRef] [PubMed]
Figure 1. The process for determining the molecular weight distribution of organic matter in water samples (TOC: total organic carbon).
Separations 08 00120 g001
Figure 2. The percentage of EPSs of the different-molecular-weight fractions in stratified extracellular polymeric substances of activated sludge.
Separations 08 00120 g002
Figure 3. Fluorescent components of different EPSs. (a,b) The fluorescent components of peak A and peak B in S-EPSs. (c,d) The fluorescent components of peak A and peak B in LB-EPSs. (e,f) The fluorescent components of peak A and peak B in TB-EPSs.
Separations 08 00120 g003
Figure 4. Stern–Volmer quenching rate constants of heavy metals on peak A of EPSs with different molecular weights. (ac) The Stern–Volmer quenching rate constants of Pb2+ on S-EPSs, LB-EPSs, and TB-EPSs (peak A) with different molecular weights. (d) The Stern–Volmer quenching rate constants of Cu2+ on S-EPSs (peak A) with different molecular weights.
Separations 08 00120 g004
Figure 5. Fluorescence quenching of LB-EPSs with different molecular weights by Cd2+ at 25 °C. The fluorescence quenching of Cd2+ to (a) LB-EPS1, (b) LB-EPS2, (c) LB-EPS3, (d) LB-EPS4, and (e) LB-EPS5 at 25 °C.
Separations 08 00120 g005
Figure 6. Fluorescence quenching of Cu2+ with different-molecular-weight LB-EPSs at 25 °C. The fluorescence quenching of Cu2+ to (a) LB-EPS1, (b) LB-EPS2, (c) LB-EPS3, (d) LB-EPS4, and (e) LB-EPS5 at 25 °C.
Separations 08 00120 g006
Figure 7. Three-dimensional fluorescence spectra of activated sludge S-EPSs with different molecular weights before and after adding Cd(NO3)2 at 25 °C. (a,c,e,g,i) the three-dimensional fluorescence spectra of S-EPS1, S-EPS2, S-EPS3, S-EPS4, and S-EPS5 before adding Cd(NO3)2 at 25 °C. (b,d,f,h,j) The three-dimensional fluorescence spectra of S-EPS1, S-EPS2, S-EPS3, S-EPS4, and S-EPS5 after adding Cd(NO3)2 at 25 °C.
Separations 08 00120 g007aSeparations 08 00120 g007b
Figure 8. Three-dimensional fluorescence spectra of activated sludge LB-EPSs with different molecular weights before and after adding Cd(NO3)2 at 25 °C. (a,c,e,g,i) The three-dimensional fluorescence spectra of LB-EPS1, LB-EPS2, LB-EPS3, LB-EPS4, and LB-EPS5 before adding Cd(NO3)2 at 25 °C. (b,d,f,h,j) The three-dimensional fluorescence spectra of LB-EPS1, LB-EPS2, LB-EPS3, LB-EPS4, and LB-EPS5 after adding Cd(NO3)2 at 25 °C.
Separations 08 00120 g008aSeparations 08 00120 g008bSeparations 08 00120 g008c
Figure 9. Three-dimensional fluorescence spectra of activated sludge TB-EPSs with different molecular weights before and after adding Cd(NO3)2 at 25 °C. (a,c,e,g,i) The three-dimensional fluorescence spectra of TB-EPS1, TB-EPS2, TB-EPS3, TB-EPS4, and TB-EPS5 before adding Cd(NO3)2 at 25 °C. (b,d,f,h,j) The three-dimensional fluorescence spectra of TB-EPS1, TB-EPS2, TB-EPS3, TB-EPS4, and TB-EPS5 after adding Cd(NO3)2 at 25 °C.
Separations 08 00120 g009aSeparations 08 00120 g009b
Table 1. Stern–Volmer constants of different heavy metals reacting with the same kind of activated sludge EPSs.
QuencherDifferent Molecular Weight EPSsFluorescence PeakKsv
1 × 10³ L/moL
Kq
1 × 10¹¹ L/(moL·s)
R2
Pb2+S-EPSsS-EPS1Peak A9.1609.0000.965
S-EPS25.9425.9400.953
S-EPS36.0716.0700.984
S-EPS42.7912.7900.843
S-EPS58.6328.6300.937
Cu2+S-EPSsS-EPS17.8517.8500.988
S-EPS23.0613.0600.911
S-EPS33.4293.4300.967
S-EPS43.0513.0500.986
S-EPS56.1556.1600.900
Table 2. Stern-Volmer equation of the same kind of heavy metals react with different activated sludge EPSs.
QuencherDifferent Molecular Weight EPSsFluorescence PeakKsv
1 × 10³ L/moL
Kq
1 × 10¹¹ L/(moL s)
R2
Pb2+S-EPSsS-EPS1Peak A9.1609.1600.965
S-EPS25.9425.9420.953
S-EPS36.0716.0710.984
S-EPS42.7912.7910.843
S-EPS58.6338.6330.937
LB-EPSsLB-EPS18.6848.6840.980
LB-EPS28.5128.5120.988
LB-EPS36.3936.3930.865
LB-EPS48.0968.0960.934
LB-EPS51.21712.170.935
TB-EPSsTB-EPS121.3921.390.996
TB-EPS210.7710.770.982
TB-EPS311.9911.990.986
TB-EPS410.7010.700.954
TB-EPS520.7020.700.981
Table 3. The binding constants for Cu2+ and EPSs of activated sludge.
EPSsFractionPeaknlogKbR2
S-EPSsS-EPS1Peak A0.81172.9260.980
Peak B0.64772.2460.982
S-EPS2Peak A0.60411.8440.927
Peak B0.70652.0950.968
S-EPS3Peak A0.63531.9480.964
Peak B0.54001.3820.945
S-EPS4Peak A0.64181.9470.977
Peak B0.35640.77600.955
S-EPS5Peak A1.0093.6700.846
Peak B0.56781.6620.940
LB-EPSsLB-EPS1Peak A0.49331.8120.992
Peak B0.48651.6940.992
LB-EPS2Peak A0.83623.1170.942
Peak B0.38711.2620.993
LB-EPS3Peak A0.47311.6930.975
Peak B0.41891.4340.995
LB-EPS4Peak A0.45871.4130.895
Peak B0.32410.77690.884
LB-EPS5Peak A0.34181.1330.969
Peak B0.28200.82280.995
TB-EPSsTB-EPS1Peak A0.77952.9930.949
Peak B0.54601.9420.967
TB-EPS2Peak A0.32481.1720.993
Peak B0.38811.2850.988
TB-EPS3Peak A0.35991.2780.998
Peak B0.34901.0910.993
TB-EPS4Peak A0.58792.0920.910
Peak B0.36510.82950.943
TB-EPS5Peak A0.60842.1220.953
Peak B///
Table 4. The change in the EPS fluorescence peak values when the concentration of heavy metal salt reached 100 μmol/L.
Heavy Metal SaltEPSs Molecular Weight FractionS-EPSsLB-EPSsTB-EPSs
Peak APeak BPeak APeak BPeak APeak B
Cd(NO3)21534.9345.30323.580.302220435.0
291.20−14.70 1140.129.00521.6113.2
3179.464.90181.061.10320.017.60
4299.9150.9147.524.00224.0−52.40 1
582.3024.40101.345.10−236.3 1−201.5
Pb(NO3)21663.1292.8460.785.6033961010
2317.2−8.300 1144.149.36642.6149.3
3453.2139.583.6024.66749.2171.6
4192.250.40184.951.30273.274.40
590.0027.1079.9921.61276.9139.4
Cu(NO3)21577.7405.6699.8319.337461929
2187.579.70142.383.791355501.9
3227.7124.5218.7114.01123488.4
4131.298.9092.1039.59305.375.00
554.8423.3790.2841.30104.711.10
Zn(NO3)21311.2123.2598.3202.12343442.0
2176.842.70116.117.401022244.2
3165.439.0061.00−31.80 1798.8192.2
4183.751.7040.10−11.50 1231.819.00
596.3019.5047.30−36.22 1144.4−30.80 1
1 A negative sign indicates that the fluorescence value increased.
Publisher’s Note: MDPI stays neutral with regard to jurisdictional claims in published maps and institutional affiliations.

