Article

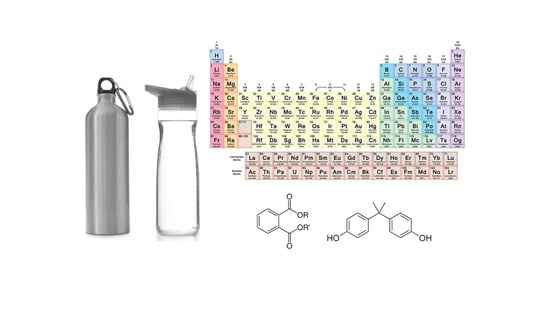
Reusable Water Bottles: Release of Inorganic Elements, Phthalates, and Bisphenol A in a “Real Use” Simulation Experiment

1
Department of Chemistry, Sapienza University, Piazzale Aldo Moro 5, I-00185 Rome, Italy
2
Department of Public Health and Infectious Diseases, Sapienza University, Piazzale Aldo Moro 5, I-00185 Rome, Italy
3
Department of Ecological and Biological Sciences, Tuscia University, Largo dell’Università snc, I-01100 Viterbo, Italy
4
Department of Agricultural, Environmental and Food Sciences (DiAAA), University of Molise, via De Sanctis, I-86100 Campobasso, Italy
5
Department of Environmental Biology, Sapienza University, Piazzale Aldo Moro 5, I-00185 Rome, Italy
*
Author to whom correspondence should be addressed.
Submission received: 3 August 2021 / Revised: 17 August 2021 / Accepted: 19 August 2021 / Published: 20 August 2021

Abstract

:
Reusable water bottles are growing in popularity; thus, possible chemical release from the internal surface into water should be carefully considered to control related health risks. We experimentally evaluated the release into deionized water of 40 elements, six phthalates, and bisphenol-A for 20 different reusable bottles by simulating the use in real world scenario. The 20 bottles, identified as those most purchased in Italy, were made of various materials (stainless steel, aluminum, plastic, and silicone). The experiment was carried out for four consecutive weeks in duplicate for each type of bottle. Our results showed the release, to various extents, of inorganic elements from all 20 bottles, while the release of phthalates and bisphenol-A was never found. The elements most frequently released were Al, Sr, Mo, and Cr, while the highest concentrations were for Ca, K, Mg, and Na; the release of toxic elements (such as Pb, Cd, Ni, Sb) also occurred. The comparison of our results with regulatory limits on drinking water quality revealed no exceeding values except for Al. However, these releases represent a further intake, and the related risks cannot be neglected, especially for highly susceptible populations. Thus, it is essential to correctly inform consumers both with dedicated interventions and exhaustive labelling.

Graphical Abstract

1. Introduction

Single-use plastics have taken on an important role in the modern society, significantly improving the safety of medical devices, packaging technology, and the possibility of preserving food but, at the same time, greatly increasing the amount of disposable products waste [1]. In many cases, however, as for bottled water, the increase in the quantity of plastic disposed of as waste depends on the poor compliance with recovery and recycling of the community and individuals; a recent life-cycle analysis demonstrated that PET bottles’ production and use assure a lower environmental impact compared to polylactic acid and to aluminium bottles [2]. For these reasons, reusable water bottles, as possible alternative to single-use plastic bottles, are growing in popularity in recent years because they appear environmentally friendly [3], economic as refillable multiple times, and socially appreciated [4,5]. On the other hand, the risk of bacterial and/or fungal proliferation inside the bottle and of migration of chemicals from the internal surface in direct contact with water to the water itself should be taken into consideration. On this specific topic, there is vast international legislation [6,7,8,9,10] that deals with both safety and quality issues of food contact materials (FCMs), among which these water bottles are included. In particular, when marketed in the European Union (EU), they should be produced according to strict quality standards, use only materials present in the so-called “positive lists”, report on the label all the elements for traceability, and provide the consumer with specific instructions for use, maintenance, and disposal. Additionally, the EC mark and the “fork and glass” symbol should be present and clearly visible on each bottle [6,7].
The biological risk associated with the use/reuse of water bottles has been evaluated by recent studies [11,12,13,14], demonstrating high bacterial and fungal growth when cleaning and maintaining practices are not correctly adopted. To date, however, the same attention has not been given to the chemical risk related to the possible release of elements and/or compounds to the water from the internal surface of the bottles. Indeed, water bottles can be made of stainless steel, aluminum (also recycled), plastic, or silicone; metallic bottles usually present an internal lining that is in direct contact with water, and heavy metals residual of the catalysts used in the manufacturing process, in particular Sb, may be present [15]. Thus, a great number of chemicals, including inorganic elements (metals, semi-metals, non-metals), phthalates (PAEs), bisphenol-A (BP-A), and lining compounds, can be released into water, posing potential health risks for consumers. Among the inorganic elements potentially involved in migration, Co, Cr, Cu, Mn, Mo, Ni, Se, and Zn are essential to maintain proper metabolic activity in living organisms, but, at certain levels, they also present toxicological properties [16,17]. Other elements, such as Al, As, Ba, Be, Cd, Sn, Pb, Sb, and U are toxic and do not present any biological role [17,18]. PAEs and BP-A are chemicals widely used as plasticizing agents, mainly in the manufacturing of polyvinyl chloride (PVC) and polyethylene terephthalate (PET) [19,20]. PAEs can dissociate or migrate from plastics, especially when stressed by thermal and/or mechanical factors or when into contact with lipophilic substances [21]. Both PAEs and BP-A have been associated with adverse human health effects [22]. In particular, they have been recognized as endocrine disruptors [23] and may negatively influence human fertility [24]. BP-A is also associated with several adverse outcomes in pregnant women, fetuses, and children [25,26]. As regards the internal lining of metallic bottles, information on the composition is usually not disclosed, preventing evaluations of the possible release.
This paper aimed to a) evaluate the release of 40 inorganic elements (Al, As, B, Ba, Be, Bi, Ca, Cd, Ce, Co, Cr, Cs, Cu, Fe, Ga, K, La, Li, Mg, Mn, Mo, Na, Nb, Ni, P, Pb, Rb, Sb, Se, Si, Sn, Sr, Te, Ti, Tl, U, V, W, Zn, and Zr) and seven organic compounds (di-methyl-phthalate (DMP), di-ethyl-phthalate (DEP), di-iso-butyl phthalate (DiBP), di-butyl phthalate (DBP), di-ethyl-exyl-phthalate (DEHP), di-octyl-phthalate (DOP), and BP-A) from 20 different reusable water bottles (made of stainless steel, aluminum, plastic, or silicone) into deionized water by simulating their use in a “real world” scenario for four consecutive weeks; and b) investigate possible consumers’ health risks by comparing the results with the maximum limits fixed by current legislation on drinking water.

2. Materials and Methods

2.1. Selection of Reusable Water Bottles and Experimental Planning

The 20 studied reusable water bottles were selected by a simple market analysis of the best-sellers, both retail and online, for each material (glass excluded) in Italy in 2019. In total, we purchased 40 different bottles (20 typologies in duplicate) of different capacities (from 350 to 1000 mL) and different materials (stainless steel—1 bottle, aluminum also recycled—12, plastics—6, and silicone—1) (Table 1).
The selected water bottles were intended for adult and/or pediatric consumers and were tested by simulating their typical use (preliminary cleansing and daily rinsing, filling, and use). The simulation was carried out at room temperature (19–22 °C) using organics-free deionized water and lasted a total of four weeks. Deionized water was used to allow the quantification, also in trace levels, of released elements/compounds that could have been masked by the use of tap water. Indeed, tap water usually contains minerals at various levels (from µg L−1 to mg L−1) and trace residues of organic compounds [27,28,29,30,31,32]. Additionally, the experiment should not be reproducible because the content of studied elements widely vary in different drinking waters according to their geographical and geological origin.
The experimental timetable is shown in Table 2.
Briefly, before first use, each bottle was rinsed five times with deionized water, emptied, and left to dry upside down in a suspended position, preventing the neck and the inside of the cap from touching any surface.
Each day of the four weeks-long experiment, the bottles were rinsed and filled with deionized water at 08.00 am, sampled or not according to the timetable shown in Table 2, and emptied and left to dry upside down in a suspended position at 20:00. In particular, the analyses were performed on samples taken six times during the first day, then once a day during the following six days of the first week and, finally, once a day during the 14th, 21st, and 28th day.
30 mL of water were sampled at each fixed interval, 10 mL in polypropylene tubes for elemental analysis, and 20 mL in class A borosilicate glass vials for PAEs and BP-A determination. All samples were stored at −20 °C and analyzed within one month of sampling. Method blanks were treated as samples for subtraction of the background signal from the reagents.

2.2. Instrument

A quadrupole inductively coupled plasma mass spectrometry (ICP-MS; 820-MS, Bruker, Bremen, Germany) equipped with a collision–reaction interface (CRI) and a glass nebulizer (0.4 mL min−1; MicroMistTM; Analytik Jena AG, Jena, Germany) were used for multi-elemental analysis. CRI was used for As, Cr, Fe, Mn, Se, and V determination with He and H2 (both 99.9995% purity; SOL Spa, Monza, Italy) as cell gases. ICP-MS operating parameters were detailed previously [33,34,35].
A gas chromatography/ion trap mass spectrometry (GC/ITMS; Trace GC coupled with a PolarisQ mass spectrometer, Thermo Finnigan, Bremen, Germany) equipped with a home-made fused-silica capillary column with chemically bonded phase (SE-54, 5% phenyl-95% dimethylpolysiloxane) was used for PAEs and BP-A determination, as previously described [21]. The software used was Xcalibur 1.4.1.
An Arioso Power I RO-UP Scholar UV (Human Corporation, Songpa-Ku, Seoul, Korea) system was used to produce organics-free deionized water.

2.3. Materials, Reagents, and Standard Solutions

All solutions were prepared with deionized water at 18.3 MΩ.cm resistivity. Reagents used for the sample preparation were HNO3 (70%, super-pure), n-hexane of pesticide grade, and NaCl of analytical grade (Carlo Erba Reagents S.r.l. Milan, Italy). Adequate aliquots of a multi-element standard solution (1.000 ± 0.005 mg L−1 As, Al, Ba, Be, Bi, Cd, Ce, Co, Cr, Cs, Cu, Ga, La, Li, Mn, Mo, Nb, Ni, Pb, Rb, Sb, Se, Sn, Te, Ti, Tl, U, V, W, and Zr; 10.00 ± 0.05 mg L−1 Fe and Zn; 50.00 ± 0.25 mg L−1 P and Si; 55.00 ± 0.25 mg L−1 B and Sr; 500.0 ± 2.5 mg L−1 K, Mg, and Na; 1000 ± 5 mg L−1 Ca and S in 5% HNO3, VWR International S.r.l., Milan, Italy) were used for preparing the ICP-MS calibration solutions. Y (at 0.005 mg L−1 from 1000 ± 2 mg L−1; Panreac Química, Barcelona, Spain), Sc, Rh, In, and Th (at 10 mg L−1 from 1000 ± 5 mg L−1; Merck KGaA, Darmstadt, Germany) in 2% HNO3 (v/v) were used as internal standards to monitor matrix effects and sensitivity drifts of the ICP-MS instrument, as previously reported [36,37]. Before each analysis run, the ICP-MS performance was tested using a multi-standard stock solution of Ba, Be, Ce, Co, In, Pb, Mg, Tl, and Th (10.00 ± 0.05 mg L−1; Spectro Pure, Ricca Chemical Company, Arlington, TX, USA). Water reference standard certificate (SRM 1643e trace elements in water; National Institute of Standards and Technology, NIST; Gaithersburg) was used to assess the elemental analysis accuracy.
PAES (di-methyl-phthalate (DMP), di-ethyl-phthalate (DEP), di-iso-butyl phthalate (DiBP), di-butyl phthalate (DBP), di-ethyl-exyl-phthalate (DEHP), di-octyl-phthalate (DOP)) and BP-A standards were obtained from Merck Life Science S.r.l. (Milan, Italy). Anthracene, purchased from LabService Analytical (Anzola Emilia, Bologna, Italy), was used as internal standard. A detailed description of the method was previously reported [21].

2.4. Elemental Analysis

The determination of 40 elements’ (Al, As, B, Ba, Be, Bi, Ca, Cd, Ce, Co, Cr, Cs, Cu, Fe, Ga, K, La, Li, Mg, Mn, Mo, Na, Nb, Ni, P, Pb, Rb, Sb, Se, Si, Sn, Sr, Te, Ti, Tl, U, V, W, Zn, and Zr) content in the water samples stored in the reusable bottles was carried out using ICP-MS, in accordance with the official methods and current legislation [38]. Briefly, each water sample (10 mL) was filtered and acidified with 0.1 mL concentrated HNO3, filtered, and analyzed without further dilution. Blanks and calibration standards were also prepared as the tested water samples.
All ICP-MS calibration curves were performed using at least five levels (including zero) and showed a correlation coefficient of at least 0.999 and good linear relationships across all concentration ranges studied, as verified by Mandel’s fit test. The detection limits (LODs) for each element were calculated as three times the standard deviation of the blank sample, which was the deionized water used for the experiment (10 replicates).
LODs values ranged from 0.0005 (Be) to 70 (Ca, K, and P) µg L−1. The accuracy (as trueness bias percentage), evaluated using SRM 1643e trace elements in water, resulted in a range between 5 and 10% for all the analyzed elements, while the relative standard deviation (repeatability) did not, in any case, exceed 10%.

2.5. PAEs and BP-A Analysis

Analytical determinations of six PAEs and BP-A in the water samples were performed by dispersive liquid–liquid micro-extraction and GC-IT/MS analysis, as previously reported [21]. Briefly, the micro-extraction was carried out using 0.2 mL n-hexane for 10 mL water sample; the solution was then subjected to forced solvent dispersion by Vortex, treated in an ultrasound bath for 6 min, and then centrifuged for 30 min at 4000 rpm. The micro-extraction solvent was then accurately measured (final volume), and 1 mL was injected into the GC-MS system. The calibration curves were performed in the concentration range from 10 to 5000 µg L−1. LODs ranged between 0.1 (DEP) and 1.2 µg L−1 (DOP). The recoveries (%) calculated on spiked organics-free deionized water (at 20 µg L−1 for each analyte) and on spiked real samples (at 20 and 500 µg L−1) resulted, respectively, in the range 85.2 (DMP)–99.6% (DiBP), and 76.3 (DMP)–101.6% (DOP). The inter-day and intra-day precision was always lower than 12.1%.

2.6. Data Elaboration

The results of the analytical determinations for each studied bottle were expressed, after subtracting blank concentration, as the arithmetic mean of the pair. Additionally, in order to compare the migration among the different bottles, we calculated the inner surface in cm2 of each kind of bottle (neck excluded); thus, results were also expressed as µg cm−2 of each compound.

3. Results and Discussion

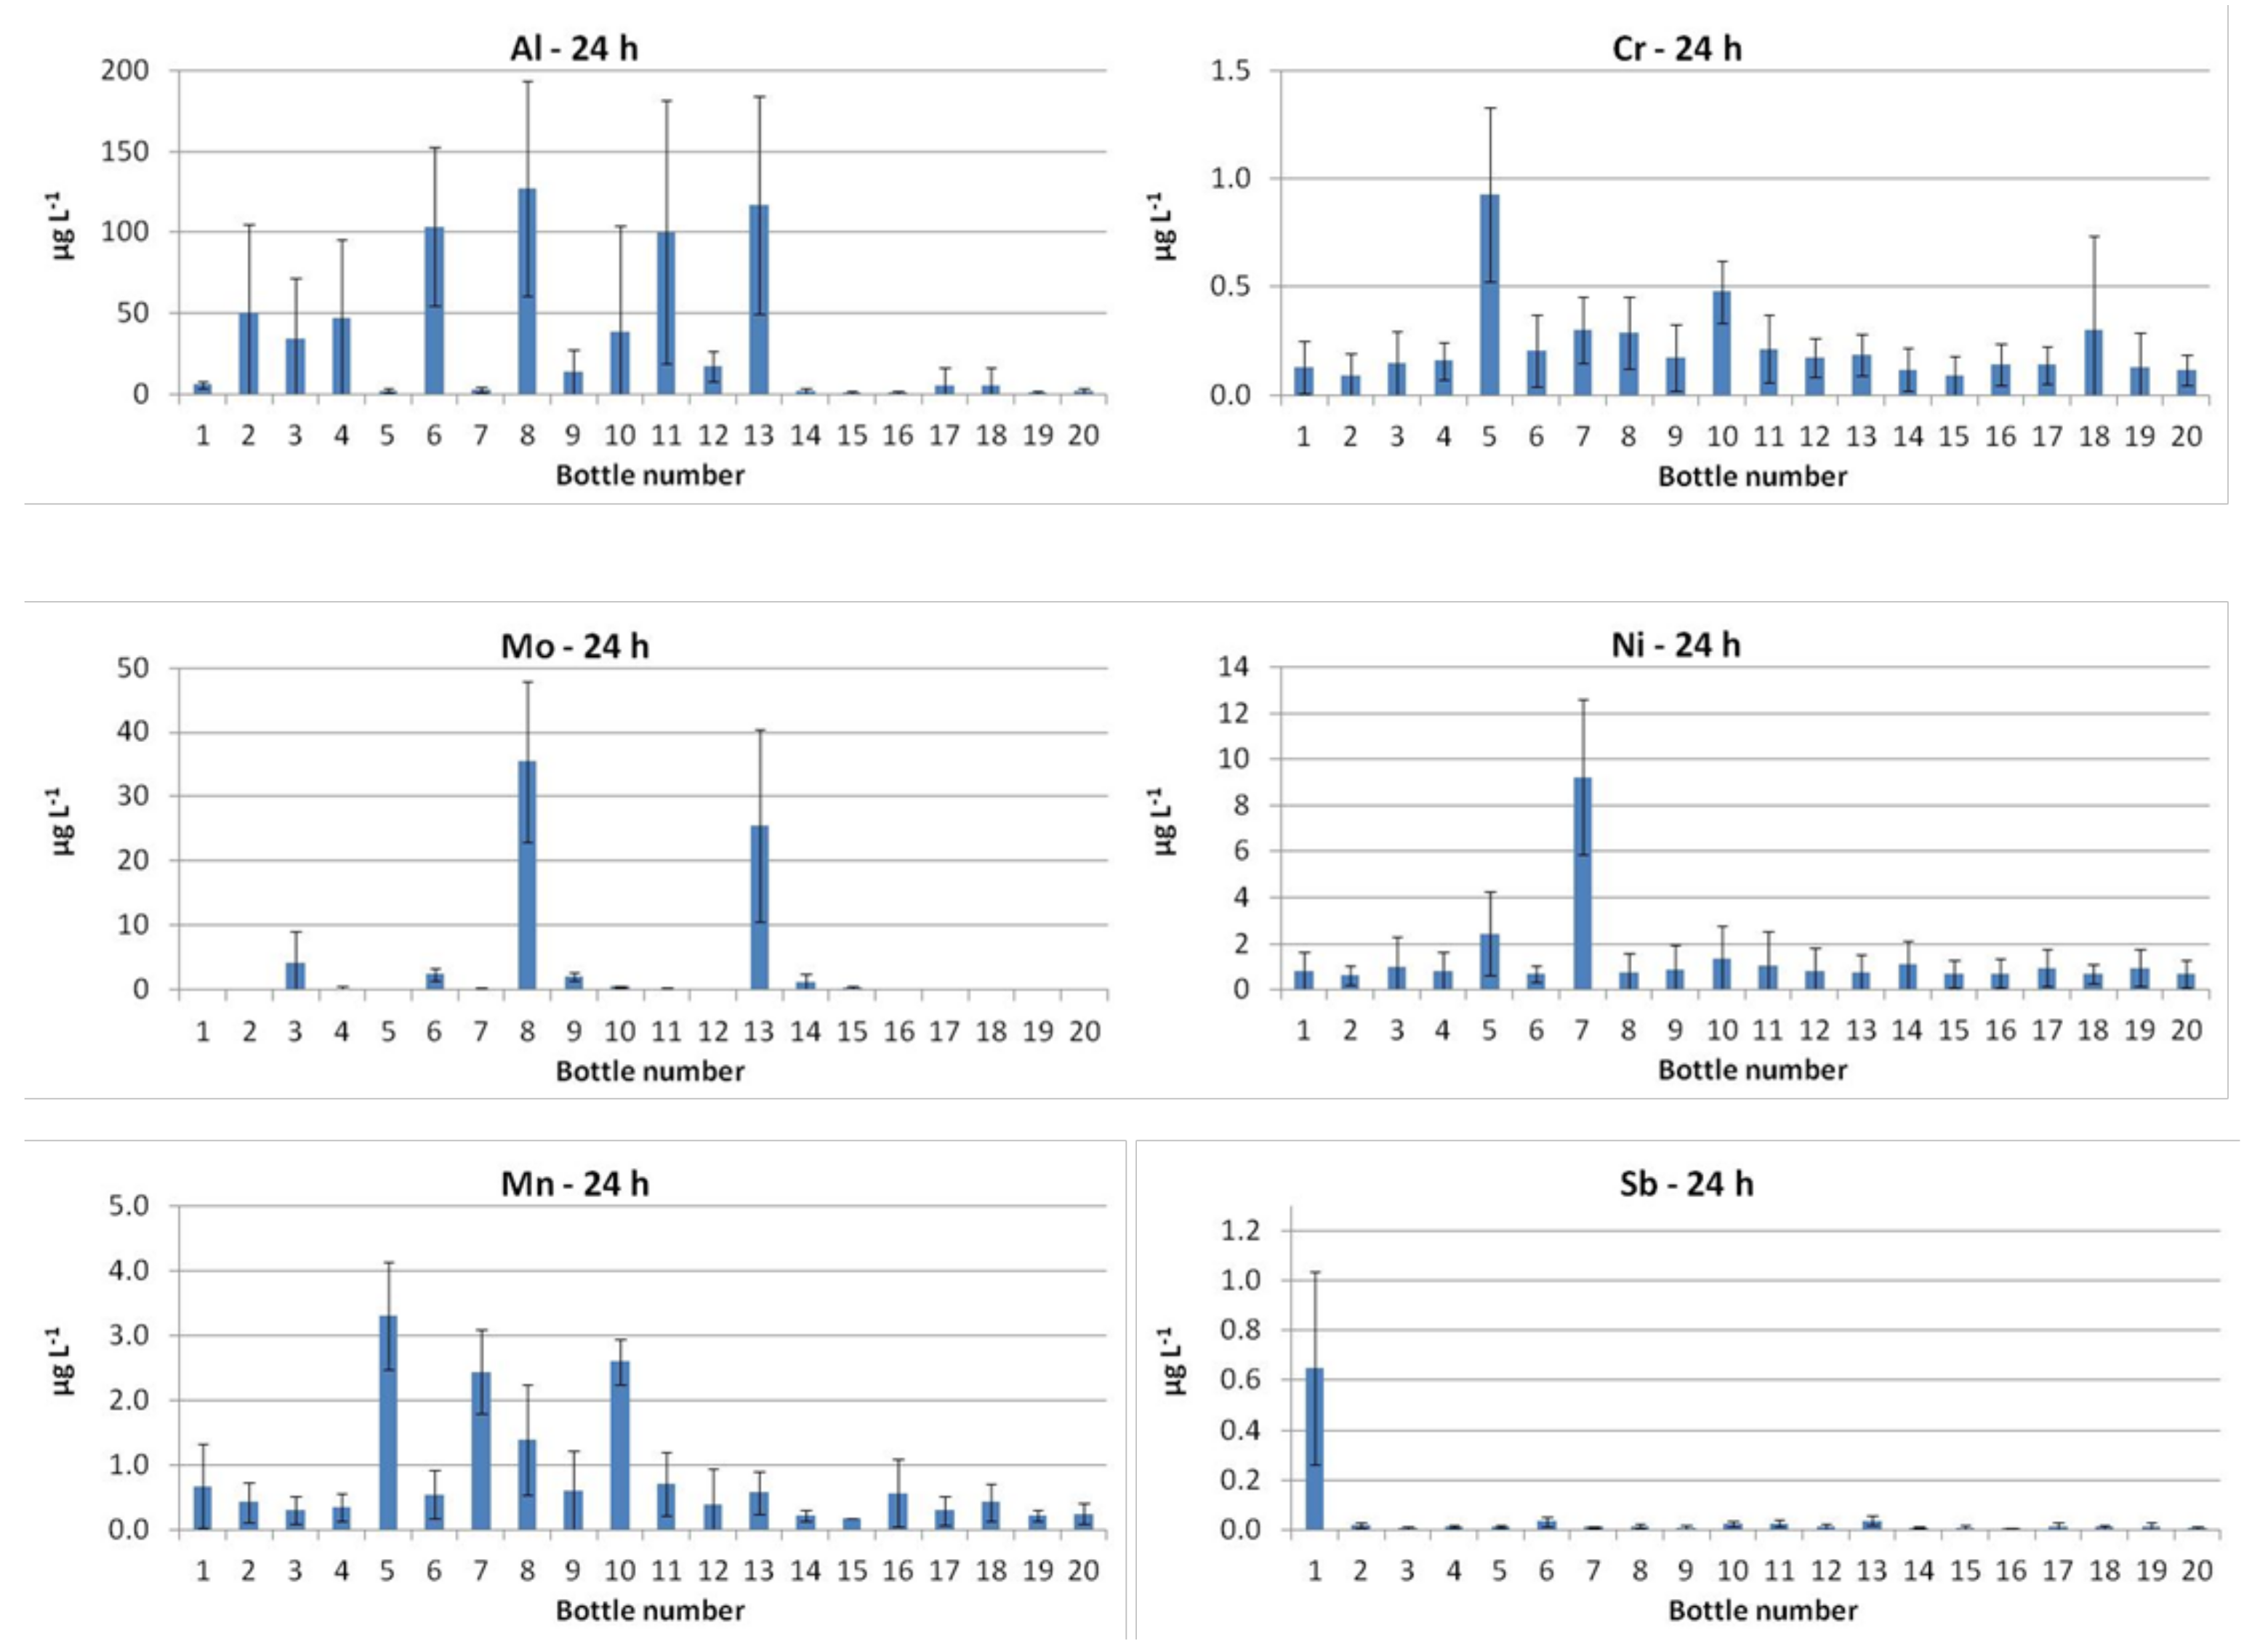
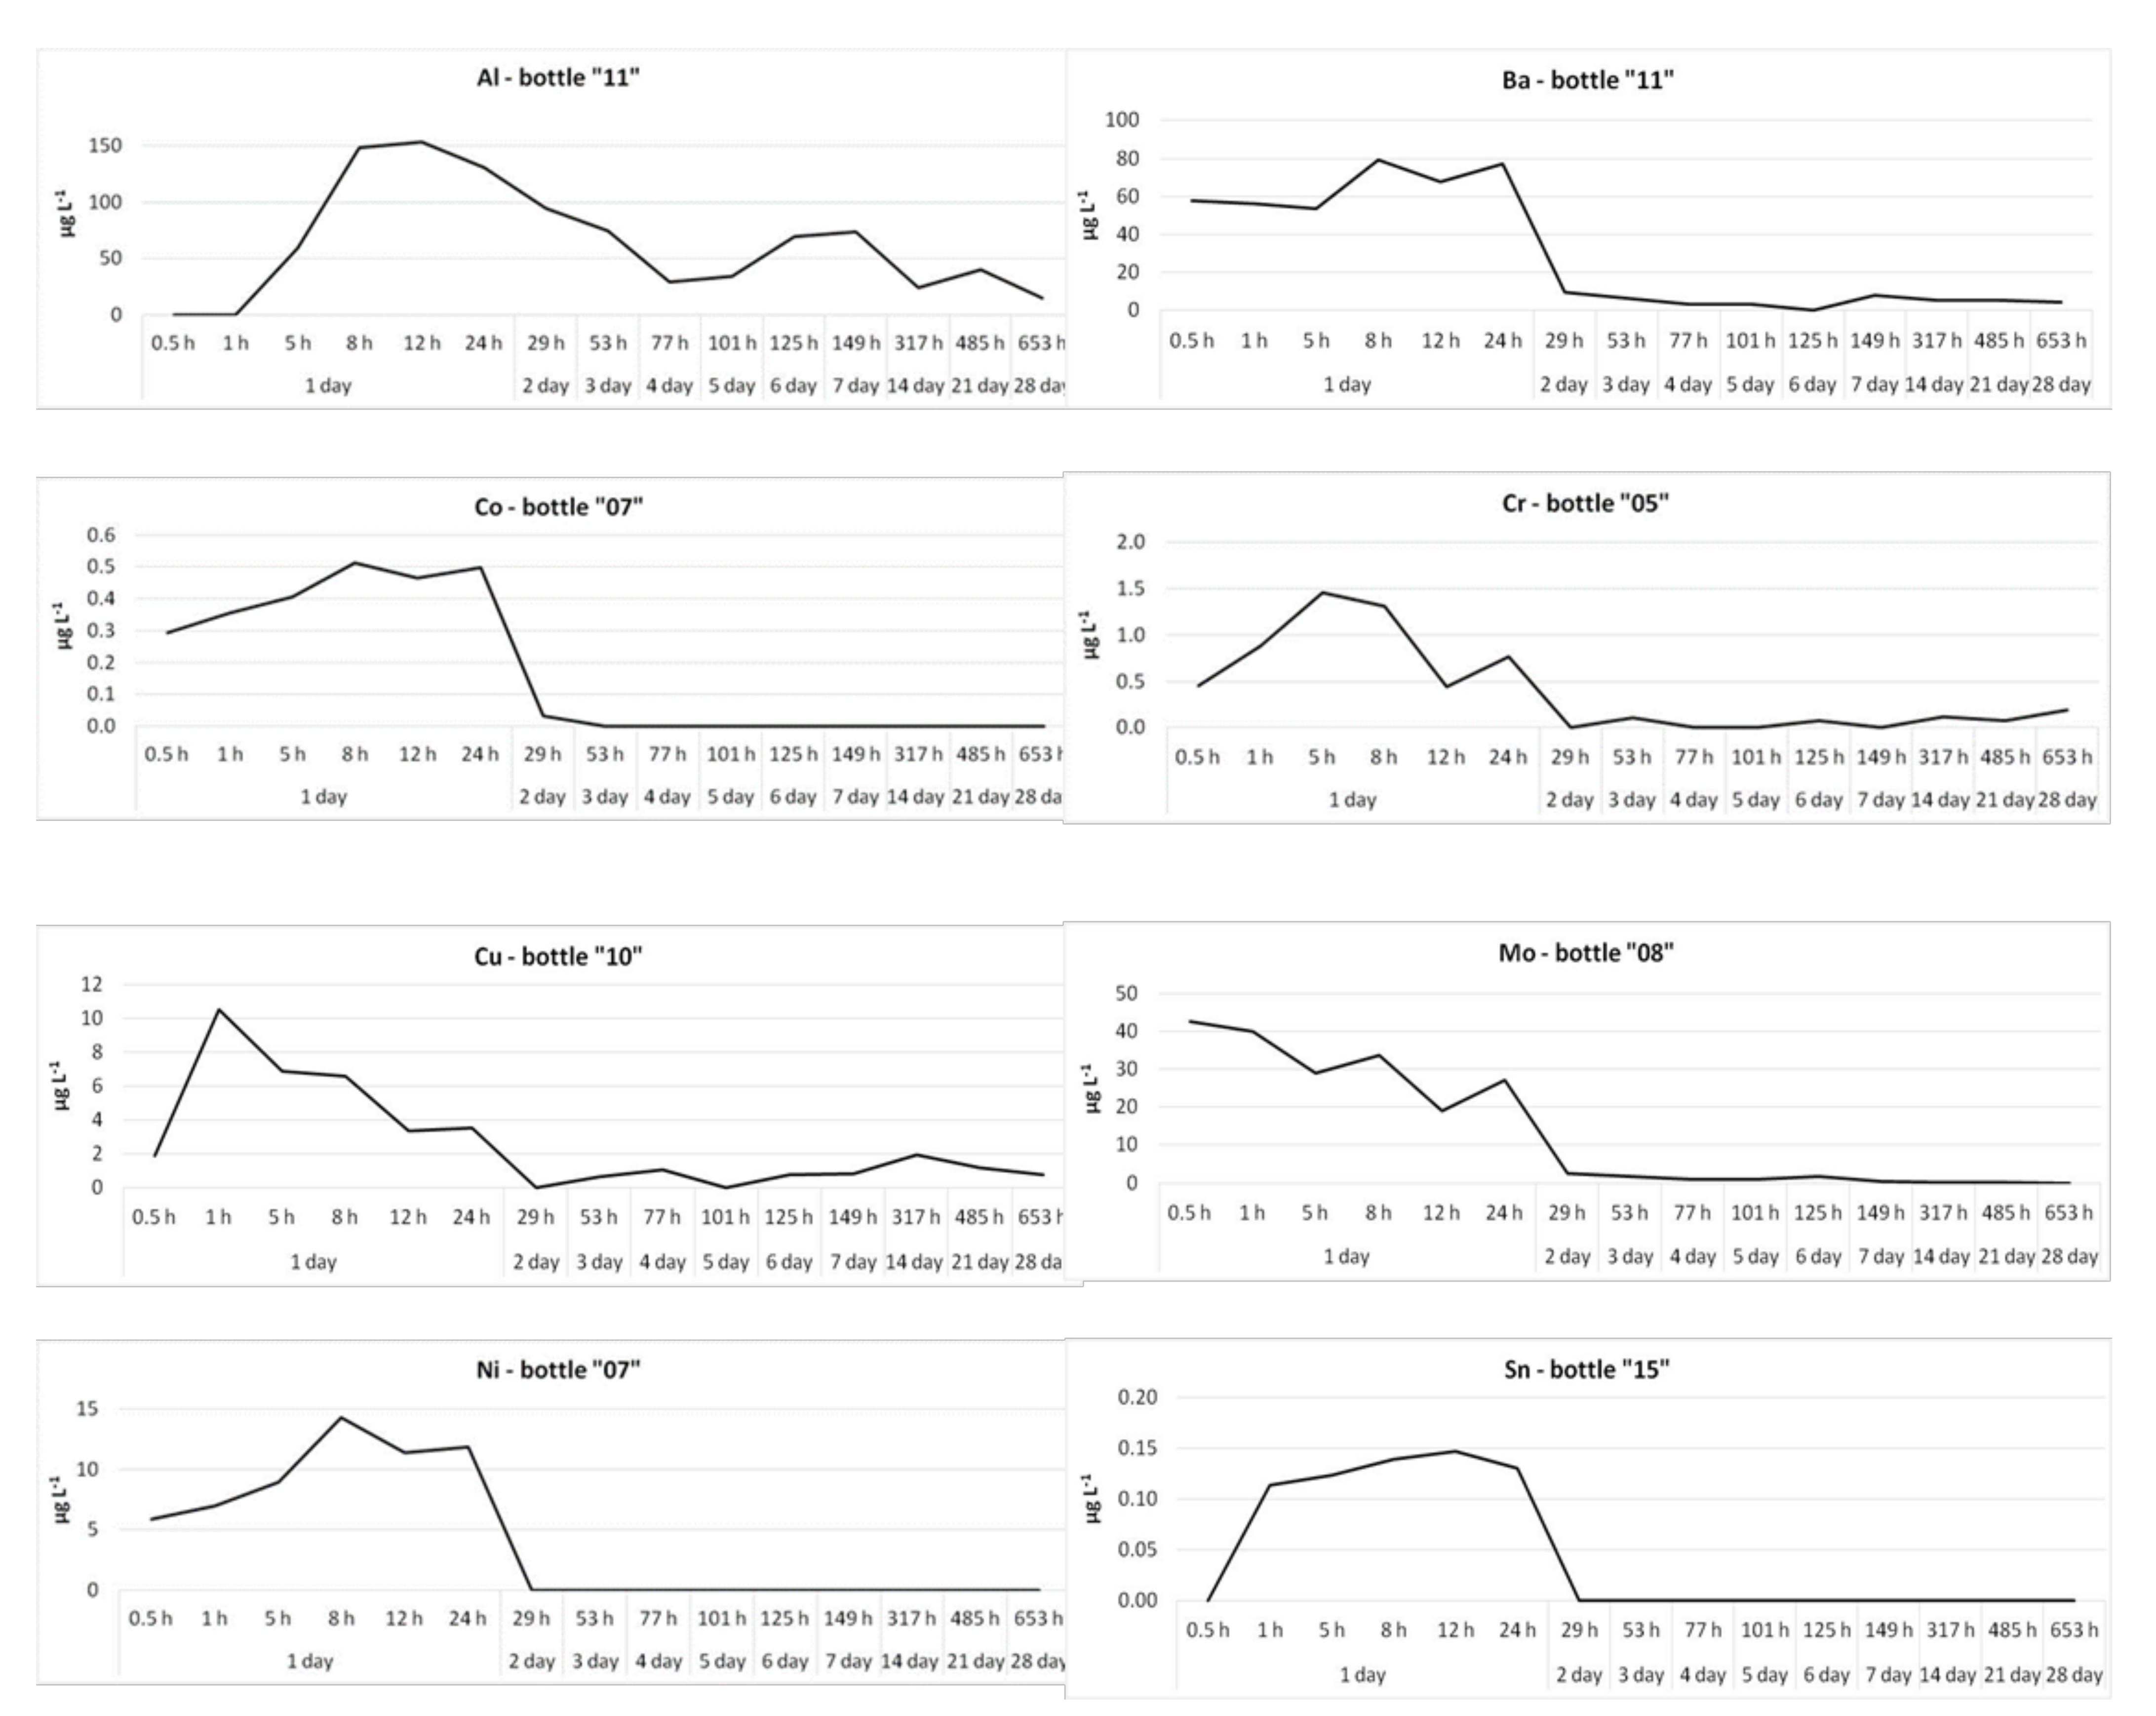
3.1. Main Results of the Experimental Tests

Table 3 reports the LODs together with the percentage of bottles in which the specific analyte resulted <LOD.
Elements’ concentrations above the LODs in most water samples (>50%) occurred for Cu, La, Li, Mg, Na, Pb, Rb, and Zn from metallic bottles and Al, Cr, Mo, and Sr from both types of bottles (metallic and non-metallic). Ce, Nb, and Te levels were lower than LODs for all the studied bottles. As many as 91% of analyses provided measurable Al concentrations for metallic bottles, while for As, Cd, Se, Sn, Tl, U, and Zr, less than 10% of analyses provided measurable levels. The comparison of our results on elemental release with other studies is not possible because, in our knowledge, this is the first study measuring the elemental release from reusable water bottles and similar experimental data are not available.
Both PAEs and BP-A concentrations were always <LOD. This finding is in contrast with those reported previously by other studies, that demonstrated the occurrence of release phenomena from different reusable bottles (plastic baby bottles, plastic bottles, metallic with internal lining) [21,39,40]. Indeed, several previous studies have proved general population exposure to these additives by urinary biomonitoring studies [41,42]. Thus, over the years, BP-A and PAEs have received special attention, resulting in the reduction or elimination of their use in water bottle manufacturing, as confirmed by our results.
Table 4 shows the maximum levels found for each studied compound in water samples stored in metallic and non-metallic bottles and expressed both as µg L−1 and µg cm−2. Cs, Nb, Te, PAEs, and BP-A are not reported because all results were <LOD.
The highest values, ranging from tenth of mg to mg L−1 and mg cm−2, were recorded for Ca, K, Mg, and Na in both metallic and non-metallic bottles. Additionally, as expected, Al showed high levels in metallic bottles when compared to other metals. Notice that, even if in low levels, many other elements, including rare or toxic metals, were revealed in metallic bottles, such as As, Cr, Mo, Cd, Ga, U, W, and Zr. A similar feature was found for non-metallic bottles, although at lower concentrations, indicating that plastic and silicone materials are also at risk for inorganic elements’ release into water. However, the levels of each monitored analyte varied widely among the 20 different bottles. In particular, while alkali and alkaline earth metals showed a lower variability with respect to the other elements, some heavy metals, such as Al, Cr, Mo, Ni, Mn, and Sb, presented relevant differences among the studied bottles, as evidenced in Figure 1.
The great variability in released amounts among all the studied bottles is likely due to the kind and quality of the materials of which they are made. This variability occurs mostly when considering metallic bottles (bottles n. 1–13), stainless steel included (bottle n. 7), while non-metallic ones (bottles n. 14–20) showed concentrations quite similar to each other.
As regards the trend of the release phenomena measured over time, for the majority of the elements, the highest concentrations were recovered during the first 24 h of the experiment in all cases. As an example, Figure 2 shows the concentration trends over time of some elements (Al, Ba, Co, Cr, Cu, Mo, Ni, and Sr) for the bottle that presented the highest release for that specific analyte.
As evidenced in Figure 2, some elements, such as Ba, Ni, and Sn, were no more released after the first 24 h, while the others continued to be, although at much lower amounts with respect to the first day of the experiment.

3.2. Possible Consumers’ Health Risks from Reusable Water Bottles Use

The second aim of the study was to evaluate the possible consumers’ health risks due to the use of reusable water bottles. For this purpose, we compared our results with the regulatory limits fixed by current legislation on drinking water. In particular, we considered the recent European Union Directive 2020/2184 on drinking water quality [43] and, for parameters not included in this Directive, we referred to other international bodies such as the WHO or Canadian or USEPA guidelines [44,45,46,47,48,49]. In Table 5, we reported our results, expressed as the highest value obtained during the experiment for all the elements found at concentrations >LOD and for which regulatory limits are currently fixed, along with the limits themselves.
As shown in Table 5, in one case, the highest Al concentration exceeded its regulatory limit. Among the other studied elements, toxic heavy metals were, respectively, equal to 3, 6, 65, and 71% of the fixed limits for Cd, Cr, Pb, and Ni. Other relevant results are related to As (60%), Mn (9%), Mo (81%), and Sb (11%). Notice that these values refer to the maximum concentration levels found across the experiment. However, this finding cannot be neglected for two main reasons: first, the use of reusable bottles contributes to the consumers’ total intake of many elements, some of them recognized as a risk for human health. Secondly, these bottles are made for drinking water, which usually contains variable amounts of minerals, including those released by the studied metallic and non-metallic bottles. Thus, the final concentration will be determined by the sum of the two contributions, which could also exceed the regulatory limit.
This study had some limitations. Firstly, we used organics-free deionized instead of drinking water for the experiments, which does not fully represent a real world scenario; however, in this way, we were able to measure even small amounts of released elements and made the experiment reproducible. Second, the number of studied bottles is not very high, even if they were the most popular on the market. Additionally, our experiment lasted 28 days, while generally, people use reusable water bottles for a longer time. Nevertheless, the release phenomena decreased after the first days of use, becoming negligible at the end of our study in all cases.

4. Conclusions

Our findings demonstrated that all the studied reusable bottles (aluminum, stainless steel, plastic, and silicone) release inorganic elements at variable amounts, while they do not release PAEs and BP-A at detectable levels. This result is of relevance for human health, especially for highly susceptible populations such as infants, children, and pregnant women. Thus, it is essential to perform some public health interventions aimed to inform the consumers. First, the general population should be correctly informed to making an informed choice when deciding to use a water bottle. In addition, these bottles should be accompanied by an exhaustive label, reporting the maintenance criteria and the recommendation to not use the bottle with beverages other than drinking water. Indeed, sparkling water and carbonated soft drinks should increase release phenomena due to their lower pH. Additionally, fat substances contained in fruit juices or alcohol should extract organic compounds from the inner of the bottles.

Author Contributions

Conceptualization, C.P. and M.V.; methodology, M.V. and C.P.; software, M.L.A. and F.C.; validation, C.P. and M.V.; formal analysis, M.L.A., F.C., A.A. and P.A.; investigation, M.L.A., F.C., A.A. and P.A.; resources, M.V., C.P. and S.C.; data curation, C.P., S.C. and A.A.; writing—original draft preparation, M.L.A., A.A., F.C. and P.A.; writing—review and editing, C.P. and M.V.; visualization, C.P.; supervision, M.V. and C.P.; project administration, C.P., M.V., P.A. and S.C.; funding acquisition, M.V. All authors have read and agreed to the published version of the manuscript.

Funding

This research was partially funded by Fondazione Acqua, Rome, Italy.

Institutional Review Board Statement

Not applicable.

Informed Consent Statement

Not applicable.

Data Availability Statement

The data presented in this study are available on request from the corresponding author.

Conflicts of Interest

The authors declare no conflict of interest. The funders had no role in the design of the study; in the collection, analyses, or interpretation of data; in the writing of the manuscript, or in the decision to publish the results.

References

  1. Directive (EU) 2019/904 of the European Parliament and of the Council on the Reduction of the Impact of Certain Plastic Products on the Environment. 2019. Available online: https://eur-lex.europa.eu/eli/dir/2019/904/oj (accessed on 20 August 2021).
  2. Tamburini, E.; Costa, S.; Summa, D.; Battistella, L.; Fano, E.A.; Castaldelli, G. Plastic (PET) vs bioplastic (PLA) or refillable aluminium bottles—What is the most sustainable choice for drinking water? A life-cycle (LCA) analysis. Environ. Res. 2021, 196, 110974. [Google Scholar] [CrossRef]
  3. Marazzi, L.; Loiselle, S.; Anderson, L.G.; Rocliffe, S.; Winton, D.J. Consumer-based actions to reduce plastic pollution in rivers: A multi-criteria decision analysis approach. PLoS ONE 2020, 15, e0236410. [Google Scholar] [CrossRef]
  4. Graydon, R.C.; Gonzalez, P.A.; Laureano-Rosario, A.E.; Pradieu, G.R. Bottled water versus tap water: Risk perceptions and drinking water choices at the University of South Florida. Int. J. Sustain. High. Educ. 2019, 20, 654–674. [Google Scholar] [CrossRef]
  5. Levêque, J.G.; Burns, R.C. Drinking water in West Virginia (USA): Tap water or bottled water—What is the right choice for college students? J. Water Health 2018, 16, 827–838. [Google Scholar] [CrossRef] [PubMed] [Green Version]
  6. Commission Regulation (EC), No.1935/2004 of the European Parliament and of the Council on Materials and Articles Intended to Come into Contact with FOOD and Repealing Directives 80/590/EEC and 89/109/EEC. 2004. Available online: https://eur-lex.europa.eu/LexUriServ/LexUriServ.do?uri=OJ:L:2004:338:0004:0017:en:PDF (accessed on 20 August 2021).
  7. Commission Regulation (EC), No. 2023/2006 on Good Manufacturing Practice for Materials and Articles Intended to Come into Contact with Food. 2006. Available online: https://eur-lex.europa.eu/LexUriServ/LexUriServ.do?uri=OJ:L:2006:384:0075:0078:EN:PDF (accessed on 20 August 2021).
  8. Legal Information Institute. The United States Code, Title 21—Food and Drugs. Available online: https://www.law.cornell.edu/uscode/text/21 (accessed on 3 August 2021).
  9. Food Standards Australia New Zealand. Food Standards Code. Available online: https://www.foodstandards.gov.au/code/Pages/default.aspx (accessed on 3 August 2021).
  10. The Japanese Food Sanitation Act. 1947. Available online: http://extwprlegs1.fao.org/docs/pdf/jap52285.pdf (accessed on 3 August 2021).
  11. Silveira, M.B.; Scudese, E.; Weber Senna, G.; Ferreira, A.P.; Dantas, E.H.M.; Pereira Ribero, L.C. Microbial contamination in shaker bottles among members of fitness centers. J. Exerc. Physiol. 2018, 21, 134. [Google Scholar]
  12. Sun, X.; Kim, J.; Behnke, C.; Almanza, B.; Greene, C.; Miller, J.; Schindler, B. The cleanliness of reusable water bottles: How contamination levels are affected by bottle usage and cleaning behaviors of bottle owners. Food Prot. Trends 2017, 37, 392–402. [Google Scholar]
  13. Hubbard, A.T.M.; Newire, E.; Botelho, J.; Reiné, J.; Wright, E.; Murphy, E.A.; Hutton, W.; Roberts, A.P. Isolation of an antimicrobial-resistant, biofilm-forming, Klebsiella grimontii isolate from a reusable water bottle. Microbiologyopen 2020, 9, e1023. [Google Scholar] [CrossRef] [Green Version]
  14. Mills, K.; Golden, J.; Bilinski, A.; Beckman, A.L.; McDaniel, K.; Harding, A.S.; France, A.; Napa Tobar, H.; Vecitis, C. Bacterial contamination of reusable bottled drinking water in Ecuador. J. Water Sanit. Hyg. Dev. 2018, 8, 81–89. [Google Scholar] [CrossRef]
  15. Cheng, X.; Shi, H.; Adams, C.D.; Ma, Y. Assessment of metal contaminations leaching out from recycling plastic bottles upon treatments. Environ. Sci. Pollut. Res. 2010, 17, 1323–1330. [Google Scholar] [CrossRef]
  16. Farid, S.M.; Enani, M.A.; Wajid, S.A. Determination of trace elements in cow’s milk in Saudi Arabia. J. Zhejiang Univ. Eng. Sci. 2004, 15, 131–140. [Google Scholar] [CrossRef]
  17. De la Guardia, M.; Garrigues, S. Handbook of Mineral Elements in Food; Wiley-Blackwell: Hoboken, NJ, USA, 2015; p. 792. [Google Scholar]
  18. Barros Paiva, R.; Neves, A.; Sequeira, V.; Cardoso, C.; Bandarra, N.; Serrano Gordo, L.; Nunes, M.L. Risks and benefits’ consumption of birdbeak dogfish Deania calcea. Br. Food J. 2012, 114, 826–839. [Google Scholar] [CrossRef]
  19. Wilkes, C.E.; Daniels, C.A.; Summers, J.W. PVC Handbook; Hanser Fachbuchverlag: Munchen, Deutschland, 2008; p. 701. [Google Scholar]
  20. Al-Shukri, S.; Mahmood, A.; Al-Hanbali, O.A. Thermal properties, adhesive strength, and optical transparency of cyclolinear poly(aryloxycyclotriphosphazenes). J. Appl. Polym. Sci. 2011, 122, 1058–1065. [Google Scholar] [CrossRef]
  21. Notardonato, I.; Protano, C.; Vitali, M.; Bhattacharya, B.; Avino, P. Phthalates and Bisphenol-A determination and release from different beverage plastic containers by dispersive liquid-liquid microextraction and GC-IT/MS analysis. Food Anal. Methods 2019, 12, 2562–2571. [Google Scholar] [CrossRef]
  22. Heudorf, U.; Mersch-Sundermann, V.; Angerer, J. Phthalates: Toxicology and exposure. Int. J. Hyg. Env. Health 2007, 210, 623–634. [Google Scholar] [CrossRef]
  23. Rudel, R.; Perovich, L. Endocrine disrupting chemicals in indoor and outdoor air. Atmos. Environ. 2008, 43, 170–181. [Google Scholar] [CrossRef] [Green Version]
  24. Zamkowska, D.; Karwacka, A.; Jurewicz, J.; Radwan, M. Environmental exposure to non-persistent endocrine disrupting chemicals and semen quality: An overview of the current epidemiological evidence. Int. J. Occup. Med. Environ. Health 2018, 31, 377–414. [Google Scholar] [CrossRef]
  25. Carlstedt, F.; Jönsson, B.G.; Bornehag, C.G. PVC flooring is related to human uptake of phthalates in infants. Indoor Air 2013, 23, 32–39. [Google Scholar] [CrossRef]
  26. Braun, J.M. Early-life exposure to EDCs: Role in childhood obesity and neurodevelopment. Nat. Rev. Endocrinol. 2017, 13, 161–173. [Google Scholar] [CrossRef] [Green Version]
  27. World Health Organization (WHO). Sustainable Development and Healthy Environments Cluster. Nutrients in Drinking Water. 2005. Available online: https://apps.who.int/iris/handle/10665/43403 (accessed on 3 August 2021).
  28. Li, N.; Ying, G.G.; Hong, H.; Po Keung Tsang, E.; Deng, W.J. Plasticizer contamination in the urine and hair of preschool children, airborne particles in kindergartens, and drinking water in Hong Kong. Environ. Pollut. 2021, 271, 116394. [Google Scholar] [CrossRef]
  29. Bach, C.; Rosin, C.; Munoz, J.F.; Dauchy, X. National screening study investigating nine phthalates and one adipate in raw and treated tap water in France. Environ. Sci. Pollut. Res. Int. 2020, 27, 36476–36486. [Google Scholar] [CrossRef]
  30. Yang, X.; Wang, C.; Shao, H.; Zheng, Q. Non-targeted screening and analysis of volatile organic compounds in drinking water by DLLME with GC–MS. Sci. Total Environ. 2019, 694, 133494. [Google Scholar] [CrossRef]
  31. Cantoni, B.; Penserini, L.; Vries, D.; Dingemans, M.M.L.; Bokkers, B.G.H.; Turolla, A.; Smeets, P.W.M.H.; Antonelli, M. Development of a quantitative chemical risk assessment (QCRA) procedure for contaminants of emerging concern in drinking water supply. Water Res. 2021, 194, 116911. [Google Scholar] [CrossRef]
  32. Yee Wee, S.; Zaharin Aris, A.; Md Yusoff, F.; Mangala Praveena, S. Tap water contamination: Multiclass endocrine disrupting compounds in different housing types in an urban settlement. Chemosphere 2021, 264, 128488. [Google Scholar] [CrossRef] [PubMed]
  33. Astolfi, M.L.; Protano, C.; Schiavi, E.; Marconi, E.; Capobianco, D.; Massimi, L.; Ristorini, M.; Baldassarre, M.E.; Laforgia, N.; Vitali, M.; et al. A prophylactic multi-strain probiotic treatment to reduce the absorption of toxic elements: In-vitro study and biomonitoring of breast milk and infant stools. Env. Int. 2019, 130, 104818. [Google Scholar] [CrossRef] [PubMed]
  34. Astolfi, M.L.; Marconi, E.; Protano, C.; Canepari, S. Comparative elemental analysis of dairy milk and plant-based milk alternatives. Food Control. 2020, 116, 107327. [Google Scholar] [CrossRef]
  35. Astolfi, M.L.; Protano, C.; Marconi, E.; Massimi, L.; Brunori, M.; Piamonti, D.; Migliara, G.; Vitali, M.; Canepari, S. A new treatment of human hair for elemental determination by inductively coupled mass spectrometry. Anal. Methods 2020, 12, 1906–1918. [Google Scholar] [CrossRef]
  36. Astolfi, M.L.; Di Filippo, P.; Gentili, A.; Canepari, S. Semiautomatic sequential extraction of polycyclic aromatic hydrocarbons and elemental bio-accessible fraction by accelerated solvent extraction on a single particulate matter sample. Talanta 2017, 174, 838–844. [Google Scholar] [CrossRef]
  37. Astolfi, M.L.; Conti, M.E.; Marconi, E.; Massimi, L.; Canepari, S. Effectiveness of different sample treatments for the elemental characterization of bees and beehive products. Molecules 2020, 25, 4263. [Google Scholar] [CrossRef]
  38. Lucentini, L.; Patriarca, M. Analytical reference methods for water intended for human consumption according to Legislative Decree 31/2001. Chemical methods. Rapp. ISTISAN Ist. Super. Sanità. 2019, 19, 1–187. [Google Scholar]
  39. Cooper, J.E.; Kendig, E.L.; Belcher, S.M. Assessment of bisphenol A released from reusable plastic, aluminium and stainless steel water bottles. Chemosphere 2011, 85, 943–947. [Google Scholar] [CrossRef] [Green Version]
  40. Kubwabo, C.; Kosarac, I.; Stewart, B.; Gauthier, B.R.; Lalonde, K.; Lalonde, P.J. Migration of bisphenol A from plastic baby bottles, baby bottle liners and reusable polycarbonate drinking bottles. Food Addit. Contam. Part A 2009, 26, 928–937. [Google Scholar] [CrossRef] [PubMed]
  41. Catarina Luís, C.; Algarra, M.; Câmara, J.S.; Perestrelo, R. Comprehensive insight from phthalates occurrence: From health outcomes to emerging analytical approaches. Toxics 2021, 9, 157. [Google Scholar] [CrossRef] [PubMed]
  42. Meeker, J.D.; Sathyanarayana, S.; Shanna, H.S. Phthalates and other additives in plastics: Human exposure and associated health outcomes. Phil. Trans. R. Soc. B 2009, 364, 2097–2113. [Google Scholar] [CrossRef] [PubMed] [Green Version]
  43. Directive (EU) 2020/2184 of the European Parliament and of the Council of on the Quality of Water Intended for Human Consumption. 2020. Available online: https://eur-lex.europa.eu/legal-content/EN/TXT/?uri=CELEX%3A32020L2184 (accessed on 20 August 2021).
  44. World Health Organization (WHO). Barium in Drinking-Water: Background Document for Development of WHO Guide-Lines for Drinking-Water Quality; World Health Organization: Geneva, Switzerland, 2016; Available online: https://www.who.int/water_sanitation_health/water-quality/guidelines/chemicals/barium-background-jan17.pdf (accessed on 3 August 2021).
  45. World Health Organization (WHO). Beryllium in Drinking-Water: Background DOCUMENT for development of WHO Guide-Lines for Drinking-Water Quality; World Health Organization: Geneva, Switzerland, 2009; Available online: https://apps.who.int/iris/handle/10665/70172 (accessed on 3 August 2021).
  46. World Health Organization (WHO). Molybdenum in Drinking-Water: Background Document for Development of WHO Guidelines for Drinking-Water Quality; World Health Organization: Geneva, Switzerland, 2011; Available online: https://apps.who.int/iris/handle/10665/75372 (accessed on 3 August 2021).
  47. Government of Canada. Guidelines for Canadian Drinking Water Quality: Guideline Technical Document–Strontium; Health Canada: Ottawa, ON, Canada, 2019; p. 58. Available online: https://www.canada.ca/en/health-canada/services/publications/healthy-living/guidelines-canadian-drinking-water-quality-guideline-technical-document-strontium.html (accessed on 3 August 2021).
  48. United States Environmental Protection Agency (US-EPA). 2018 Edition of the Drinking Water Standards and Health Advisories; US-EPA: Washington, DC, USA, 2018. Available online: https://www.epa.gov/sites/default/files/2018-03/documents/dwtable2018.pdf (accessed on 3 August 2021).
  49. Ministero della Salute. Decreto 22 dicembre 2011. Attuazione della direttiva 98/83/CE, relativa alla qualita’ delle acque destinate al consumo umano. Modifica del valore parametrico per il Vanadio. Available online: https://www.gazzettaufficiale.it/eli/id/2012/01/05/11A16893/sg (accessed on 3 August 2021).
Figure 1. Mean levels of some elements in the water stored in each bottle over 24 h.
Separations 08 00126 g001
Figure 2. 28 days release trend for Al, Ba, Co, Cr, Cu, Mo, Ni, Sn for the bottle that presented the highest release for the specific analyte.
Separations 08 00126 g002
Table 1. Descriptive characteristics of the studied water bottles.
CodeConsumers’ Age GroupMaterial
(as Declared on the Packaging)
Made inCapacity
(mL)
01A–01Badultsaluminumnot indicated500
02A–02Badultsaluminumnot indicated600
03A–03Bchildrenaluminumnot indicated500
04A–04Bchildrenaluminumnot indicated500
05A–05BchildrenaluminumChina750
06A–06Badultsaluminumnot indicated600
07A–07Badultsstainless steelnot indicated350
08A–08Badultsaluminumnot indicated1000
09A–09Badultsaluminumnot indicated750
10A–10BadultsaluminumChina800
11A–11Badultsaluminumnot indicated750
12A–12Badultsaluminumnot indicated500
13A–13Badultsaluminumnot indicated750
14A–14BadultsBP-A-free plasticnot indicated500
15A–15BadultsplasticAustria500
16A–16Badultsplasticnot indicated800
17A–17BadultsplasticItaly550
18A–18BchildrenplasticTurkey500
19A–19BchildrenplasticChina400
20A–20BadultssiliconeChina500
Table 2. Study project and water bottle sampling plan (n = 20 double water bottles).
DayRinsing and Filling (hour)Sample Taking Time Starting from Filling (hour)Emptying (hour)
100.5 158122424
2+24 --5 ---+29
3+48 --5---+53
4+72 --5---+77
5+96 --5---+101
6+120 --5---+125
7+144 --5---+149
8–13every morning at 8:00 every evening at 20:00
14+312--5---+317
15–20every morning at 8:00 every evening at 20:00
21+480--5---+485
22–27every morning at 8:00 every evening at 20:00
28+648--5---+653
Table 3. Limits of detection (LODs) (µg L−1) of studied compounds in water samples stored in metallic (stainless steel and aluminum) and non-metallic bottles and % of bottles in which the specific analyte was < LOD.
CompoundsLODMetallic Water BottlesNon-Metallic Water Bottles
% < LOD% < LOD
Al0.7942
As19090
B0.78689
Ba36065
Be0.00056262
Bi0.0047076
Ca705664
Cd0.019599
Ce0.0045773
Co0.027594
Cr0.073135
Cs0.008100100
Cu0.54372
Fe25677
Ga0.0045291
K706163
La0.0023450
Li0.014873
Mg44358
Mn0.45771
Mo0.012342
Na103868
Nb0.005100100
Ni0.98688
P705652
Pb0.043959
Rb0.023461
Sb0.0095376
Se19296
Si205661
Sn0.019695
Sr0.072035
Te0.1100100
Ti0.26467
Tl0.0029598
U0.0029296
V0.28180
W0.015375
Zn14755
Zr0.0059397
BP-A1.1100100
DMP0.7100100
DEP0.1100100
DiBP0.8100100
DBP0.4100100
DEHP0.6100100
DOP1.2100100
Table 4. Maximum levels found for each studied element in water samples stored in metallic (stainless steel and aluminum) and non-metallic bottles, expressed both as µg L−1 and µg cm−2.
ElementsMetallic Water BottlesNon-Metallic Water Bottles
Max Value
(µg L−1)
Max Value
(µg cm−2)
Max Value
(µg L−1)
Max Value
(µg cm−2)
Al2110.7430.70.12
As60.019950.0151
B2.610.00859.10.0201
Ba790.268510.171
Be0.03520.0001190.06480.000200
Bi0.0490.0001810.0380.000125
Ca340012.518005.7
Cd0.150.0005420.130.000462
Ce0.0440.0001410.0220.000067
Co0.510.001410.030.00010
Cr1.460.005381.240.00384
Cu10.50.03893.10.0098
Fe230.085180.055
Ga0.1880.000690.0060.00002
K6642.455871.95
La0.0260.0000950.0170.000058
Li0.450.001450.130.00037
Mg1160.429520.158
Mn4.50.01651.50.0053
Mo57.00.2042.900.010
Na6641.961110.44
Ni14.30.03924.60.0153
P8322.97611003.635
Pb3.260.010150.460.00152
Rb0.950.003520.170.00069
Sb1.140.003370.0410.00016
Se40.0118740.00999
Si1910.6142620.741
Sn0.100.0003840.150.000431
Sr9.340.03451.980.0066
Ti3.20.01092.00.0062
Tl0.0040.00001170.0030.0000094
U0.0080.00002880.0110.0000364
V0.50.001870.50.00151
W0.420.001490.060.00017
Zn930.344460.157
Zr0.0340.0001220.0380.000116
Table 5. Maximum levels found for each element in water samples stored in reusable water bottles and regulatory limits fixed by current legislation, both expressed in µg L−1.
ElementMaximum Level (µg L−1)Limit (µg L−1)
Al211200 [43]
As610 [43]
B9.11500 [43]
Ba791300 [44]
Be0.064812 [45]
Cd0.155.0 [43]
Cr1.4625 [43]
Cu10.52000 [43]
Fe23200 [43]
Mn4.550 [43]
Mo57.070 [46]
Na664200,000 [43]
Ni14.320 [43]
Pb3.265.0 [43]
Sb1.1410 [43]
Se420 [43]
Sr9.347000 [47]
Tl0.0042 [48]
U0.01130 [43]
V0.5140 [49]
Publisher’s Note: MDPI stays neutral with regard to jurisdictional claims in published maps and institutional affiliations.

