Article

Simultaneous Detection of Chlorzoxazone and Paracetamol Using a Greener Reverse-Phase HPTLC-UV Method

1
Department of Pharmacognosy, College of Pharmacy, Prince Sattam Bin Abdulaziz University, Al-Kharj 11942, Saudi Arabia
2
Department of Pharmaceutics, College of Pharmacy, King Saud University, Riyadh 11451, Saudi Arabia
*
Author to whom correspondence should be addressed.
Submission received: 19 September 2022 / Revised: 30 September 2022 / Accepted: 5 October 2022 / Published: 9 October 2022

Abstract

:
In the literature, greener/eco-friendly analytical techniques for simultaneous estimation of chlorzoxazone (CZN) and paracetamol (PCT) are scarce. As a consequence, greener reverse-phase high-performance thin-layer chromatography with ultraviolet (HPTLC-UV) detection was developed and validated for simultaneous estimation of CZN and PCT in commercial capsules and tablets. The greenness of the proposed HPTLC-UV technique was assessed quantitatively by utilizing the “Analytical GREENness (AGREE)” methodology. For simultaneous estimation of CZN and PCT, the greener HPTLC-UV technique was linear in the 40–1600 ng band−1 and 30–1600 ng band−1 ranges, respectively. Furthermore, the suggested HPTLC-UV methodology proved sensitive, accurate, precise, and robust for simultaneous detection of CZN and PCT. The assay of CZN in marketed capsules and tablets was found to be 99.01 ± 1.53 and 100.87 ± 1.61%, respectively, using the suggested HPTLC-UV method. The assay of PCT in commercial capsules and tablets was found to be 98.31 ± 1.38 and 101.21 ± 1.67%, respectively. The AGREE index for the greener HPTLC-UV technique was found to be 0.79, suggesting an excellent greenness profile for the proposed HPTLC-UV technique. These results and data suggested the suitability of the greener HPTLC-UV methodology for simultaneous estimation of CZN and PCT in commercial formulations.

1. Introduction

Combined dosage forms are widely used due to their tolerability, synergistic effects, and patient’s acceptability [1]. Paracetamol (PCT) (chemical name: 4-hydroxyacetanilide; molecular structure: Figure 1A) is a commonly used nonsteroidal anti-inflammatory, antipyretic, and analgesic drug [2,3]. It is marketed in the form of several dosage forms [3]. Chlorzoxazone (CZN) (chemical name: 5-chloro-2-benzoxazolinone; molecular structure: Figure 1B) is used as a muscle relaxant [4,5]. The combination of PCT and CZN (tablets and capsules) is commonly used as a muscle relaxant [1,4]. Although PCT has been recommended as the safest anti-inflammatory medicine, gastrointestinal bleeding, hypertension, and hepatotoxicity are common hazardous/toxic effects of PCT in higher doses [6]. The common overdose/hazardous effects of CZN are nausea vomiting, diarrhea, drowsiness, and dizziness [7]. Therefore, it is crucial to conduct a qualitative and quantitative investigation of PCT and CZN in commercialized dosage forms.
A literature survey demonstrated several analytical methods for simultaneous detection of CZN and PCT in marketed dosage forms and biological samples. For simultaneous detection of CZN and PCT in combined dosage forms, several ultraviolet (UV)-based spectrometry methods have been reported [1,8,9,10,11,12]. For simultaneous detection of CZN and PCT in various commercially available combined pharmaceutical preparations, a number of “high-performance liquid chromatography (HPLC)” methods are also reported [13,14,15,16,17,18,19,20]. Ultra-high-performance liquid chromatography (UHPLC) and supercritical fluid chromatography methods have also been utilized for simultaneous detection of CZN and PCT in commercially available combined dosage forms [21,22]. UHPLC and liquid chromatography tandem mass-spectrometry methods have also been used for simultaneous detection of CZN and PCT in human plasma samples [23,24]. For simultaneous detection of CZN and PCT in various commercially available combined pharmaceutical preparations, various “high-performance thin-layer chromatography (HPTLC)” approaches have also been used [25,26,27,28]. A capillary liquid chromatography technique has also been applied for concurrent detection of CZN and PCT in commercialized tablets [29]. Recently, we reported a single greener HPTLC method for simultaneous detection of caffeine and PCT in combined dosage forms [30]. However, no greener HPTLC methods have been reported for simultaneous detection of CZN and PCT in combined pharmaceutical preparations. Various analytical approaches have been recommended in published papers on simultaneous detection of CZN and PCT in combination dosage forms. Meanwhile, the greenness index in any of the pharmaceutical assay literature has not been determined. Furthermore, greener HPTLC methods have not been used for simultaneous detection of CZN and PCT in combined dosage forms. For the determination of the greenness index, several quantitative and qualitative analytical approaches have been documented [31,32,33,34,35]. Only the “Analytical GREENness (AGREE)” methodology takes all twelve green analytical chemistry (GAC) components into account when calculating the greenness index [33]. As a result, the greenness index of a suggested HPTLC-UV method has been determined using the AGREE analytical approach [33].
The goal of the current study was to design and validate a reverse-phase HPTLC-UV approach for rapid, accurate, and environmentally friendly simultaneous detection of CZN and PCT in combination dosage forms. The greener HPTLC-UV methodology for simultaneous detection of CZN and PCT was verified using “The International Council for Harmonization (ICH)” Q2-R1 protocols [36].

2. Materials and Methods

2.1. Materials

CZN and PCT working standards were procured from Sigma Aldrich (St. Louis, MO, USA). HPLC-grade ethanol and methanol were procured from E-Merck (Darmstadt, Germany). Ultra-pure water was procured using a Milli-Q unit. Marketed capsules (Relaxon containing 250 mg of CZN and 300 mg of PCT) and marketed tablets (Myodol having 250 mg of CZN and 325 mg of PCT) were purchased from pharmacy shops in Riyadh (Saudi Arabia) and New Delhi (India), respectively. Every other substance, including solvents, was of analytical grade.

2.2. Instrumentation and Chromatographic Analysis

Simultaneous detection of CZN and PCT in their pure forms, as well as in marketed capsules and tablets, was carried out using an “HPTLC CAMAG TLC system (CAMAG, Muttenz, Switzerland)”. The obtained samples were applied as 6 mm bands using a “CAMAG Automatic TLC Sampler 4 (ATS4) Sample Applicator (CAMAG, Geneva, Switzerland)”. A “CAMAG microliter Syringe (Hamilton, Bonaduz, Switzerland)” was connected to the sample applicator. TLC plates were glass plates (plate size: 10 × 20 cm) pre-coated with RP silica gel (particle size: 5 µm) 60F254S plates. A constant application rate of 150 nL s−1 was established for the simultaneous detection of CZN and PCT. The TLC plates were prepared in a “CAMAG automated developing chamber 2 (ADC2) (CAMAG, Muttenz, Switzerland)” in a linear ascending mode at an 80 mm distance. A binary ethanol/water (70:30, v v−1) mixture was used as the mobile phase. The preparation chamber was filled with the vapors of the mobile phase for 30 min at 22 °C. CZN and PCT were measured at a wavelength of 268 nm. Scan speed was adjusted at 20 mm s−1, and the slit size was set to 4 × 0.45 mm2. For each measurement, either three or six replicates were used. “WinCAT’s (version 1.4.3.6336, CAMAG, Muttenz, Switzerland)” was the program utilized for data processing and analysis.

2.3. Calibration Curves and Quality Control (QC) Samples for CZN and PCT

The required quantities of CZN and PCT were dispensed separately in the designated volumes of the mobile phase to create individual stock solutions, each of which contained 100 µg mL−1 of the drug. By serial dilution of the CZN or PCT stock solution using the mobile phase, concentrations in the 40–1600 ng band−1 range for CZN and the 30–1600 ng band−1 range for PCT were produced. On RP-TLC plates, 200 µL of each concentration of CZN and PCT were spotted. Each CZN and PCT concentration’s spot area was noted. By plotting the concentrations of both medications against the observed spot area in six replicates (n = 6), calibration curves for CZN and PCT were created. Three distinct QC samples were freshly created for the evaluation of several validation parameters.

2.4. Sample Preparations for Simultaneous Detection of CZN and PCT in Marketed Tablets and Capsules

Ten marketed tablets (each having 250 mg of CZN and 325 mg of PCT) were taken, and the average weight was noted. For the simultaneous detection of CZN and PCT in commercial capsules, ten capsules (each having 250 mg of CZN and 300 mg of PCT) were taken, and average weight was noted. The contents of the capsules were taken out from the capsule shell. The contents of the tablets or capsules were powdered after being roughly crushed. One hundred milliliters of methanol was used to dissolve a portion of the powder from each brand. Ten milliliters of methanol was used to dilute around 1 mL of this solution for each brand of tablet or capsule once more. To get rid of any undissolved excipients, the produced tablets and capsule solutions were filtered and sonicated for ten minutes. The produced solutions were utilized to detect CZN and PCT in the marketed tablets and capsules using the suggested HPTLC-UV approach.

2.5. Validation Parameters

The proposed HPTLC-UV method for simultaneous detection of CZN and PCT was validated for a number of parameters using the ICH-Q2-R1 protocols [36]. The linearity range for CZN and PCT was established by plotting their concentrations versus the measured spot areas. The linearity of the greener HPTLC-UV method was determined in the 40–1600 ng band−1 range for CZN and the 30–1600 ng band−1 range for PCT in six replicates (n = 6).
The determination of retardation factor (Rf), asymmetry factor (As), and theoretical plates number per meter (N m−1) were used to assess the parameters for system acceptability for the suggested HPTLC-UV method for simultaneous detection of CZN and PCT. Using their published equations, Rf, As, and N m−1 values were calculated [34].
The accuracy of the suggested HPTLC-UV approach for simultaneous detection of CZN and PCT was evaluated using the percentage of recovery. For CZN and PCT, three QC levels—lower QC (LQC; 100 ng band−1), middle QC (MQC; 400 ng band−1), and high QC (HQC; 1600 ng band−1)—were used to test the accuracy of the proposed HPTLC-UV method. At each QC level, the percentage of recovery for CZN and PCT was evaluated across six replicates (n = 6).
For CZN and PCT, the proposed HPTLC-UV method’s intra- and inter-assay precision was assessed. Examining intra-assay variation for CZN and PCT involved quantifying newly made CZN and PCT solutions at LQC, MQC, and HQC on the same day in six replicates (n = 6). Inter-assay variability for CZN and PCT was examined using quantitation of newly generated solutions at LQC, MQC, and HQC on three consecutive days in six replicates (n = 6).
By making a few small, deliberate adjustments to the mobile phase mixture, the robustness for CZN and PCT was assessed for the greener HPTLC-UV method. The greener mobile phase for CZN and PCT, ethanol/water (70:30, v v−1), was changed to ethanol/water (72:28, v v−1) and ethanol/water (68:32, v v−1), and the differences in chromatographic response and Rf values were noted in six replicates (n = 6).
The sensitivity of the proposed HPTLC-UV methodology for CZN and PCT was evaluated as “limit of detection (LOD) and limit of quantification (LOQ)” using a “standard deviation” method. The “LOD and LOQ” values for CZN and PCT were determined using their published equations (n = 6) [36].
To assess the specificity of the proposed HPTLC-UV method, the Rf values and UV-absorption spectra of standard CZN and PCT were compared to those of CZN and PCT in marketed tablets and capsules.

2.6. Application of a Greener HPTLC-UV Method in Simultaneous Detection of CZN and PCT in Commercial Tablets and Capsules

The acquired marketed tablet and capsule solutions were spotted onto RP-TLC plates for the HPTLC-UV technique, and the chromatographic responses were recorded using the same experimental conditions used for the simultaneous detection of standards CZN and PCT in three replicates (n = 3). Using the calibration curves for CZN and PCT, the amounts of CZN and PCT in the marketed tablets and capsules were calculated.

2.7. Greenness Evaluation Using AGREE Methodology

The AGREE methodology [33] was used to determine the greenness index for the greener HPTLC-UV method for simultaneous detection of CZN and PCT. In this methodology, different greenness scores (between 0.0 and 1.0) are assigned to twelve different components of GAC, and the average of twelve is finally taken. Twelve different components considered by the AGREE methodology are sample treatment, sample amount, device positioning, steps for sample preparation, automation of device, derivatization, amount of waste, analysis throughput, energy consumption, source of reagents/solvents, toxicity, and operator’s safety [33]. AGREE indices (0.0–1.0) for the greener HPTLC-UV method were assessed using “AGREE: The Analytical Greenness Calculator (version 0.5, Gdansk University of Technology, Gdansk, Poland, 2020)”.

3. Results and Discussion

3.1. Method Development

Different ethanol/water concentrations between the ranges of 40 and 90% ethanol were investigated as greener mobile mixtures for method development in order to create a valid chromatogram for concurrent detection of CZN and PCT by the proposed HPTLC-UV methodology. The development of all the suggested green mobile phase mixtures took place under saturation chamber conditions. The outcomes revealed that the green solvent mixture of ethanol and water (70:30, v v−1) produced well-separated and intact chromatographic peaks for CZN at Rf = 0.54 ± 0.02 and for PCT at Rf = 0.67 ± 0.02, as shown in Figure 2. In HPTLC chromatograms of CZN and PCT (Figure 2), the zero point of the horizontal coordinate and the zero point of the vertical coordinate were coincided together, which is very common in such chromatograms. Additionally, As values of 1.06 and 1.04, which are particularly reliable for simultaneous detection of CZN and PCT, were discovered for CZN and PCT. As a result, the ethanol/water (70:30, v v−1) ratio was chosen as the final mobile phase composition for the proposed HPTLC-UV method for simultaneous detection of CZN and PCT in commercial tablets and capsules. When the spectral bands for CZN and PCT were recorded in densitometry mode, the maximum response was found at a wavelength of 268 nm. As a consequence, the wavelength at which CZN and PCT were simultaneously detected was 268 nm.

3.2. Validation Parameters

To evaluate a number of parameters for simultaneous detection of CZN and PCT, the ICH-Q2-R1 protocol was employed [36]. The outcomes of the HPTLC-UV method’s linear regression analysis of the CZN and PCT calibration curves are illustrated in Table 1. CZN and PCT calibration curves were linear in the 40–1600 ng band−1 and 30–1600 ng band−1 ranges for CZN and PCT, respectively. In the HPTLC method of analysis, the samples are applied in the form of bands. As a result, the most convenient unit for representing concentration is ng band−1. Therefore, the concentrations of CZN and PCT are expressed in ng band−1 in this study. CZN and PCT’s determination coefficients (R2) were predicted to be 0.9990 and 0.9985, respectively. For both medications, the values of R2 were highly significant (p < 0.05). These results revealed that for simultaneous detection of CZN and PCT, there was a significant correlation between the concentration and measured response of CZN and PCT.
Table 2 documents the details of the system’s compatibility for the proposed HPTLC-UV methodology. The Rf, As, and N m−1 for the proposed HPTLC-UV technique were found to be satisfactory for simultaneous detection of CZN and PCT.
The accuracy of the proposed HPTLC-UV approach was evaluated using the percentage of recovery for both CZN and PCT. Table 3 presents the accuracy evaluation findings for the proposed HPTLC-UV methodology. The percentage recoveries of CZN and PCT at three different QC concentrations were determined to be 98.68–101.42 and 98.69–100.96, respectively, using the proposed HPTLC-UV technique. These findings demonstrated that the proposed HPTLC-UV technique was reliable for simultaneous detection of CZN and PCT.
For simultaneous detection of CZN and PCT, the precision of the proposed HPTLC-UV approach was assessed as intra- and inter-assay precision, with findings reported as a percentage of the coefficient of variation (CV). The findings of intra- and inter-day precisions for the simultaneous detection of CZN and PCT utilizing the proposed HPTLC-UV approach are illustrated in Table 4. It was discovered that the percent CVs of CZN and PCT for intra-day variation were 0.49–0.90 and 0.64–0.97 percent, respectively. According to research, the percent CVs of CZN and PCT for intra-day variation are 0.75–0.98 and 0.54–0.96 percent, respectively. These findings showed that the proposed HPTLC-UV technique was precise for simultaneous detection of CZN and PCT.
The robustness of the proposed HPTLC-UV approach for concurrent detection of CZN and PCT was assessed by making small, purposeful changes to the greener mobile phase mixtures. Table 5 illustrates the resulting data of robustness analysis utilizing the proposed HPTLC-UV method. It was established that percent CVs for CZN and PCT were 0.94–1.06 and 0.94–0.97 percent, respectively. Additionally, the Rf values of CZN and PCT were found to be 0.53–0.55 and 0.66–0.68, respectively. These findings demonstrated the robustness of the greener HPTLC-UV technique for simultaneous detection of CZN and PCT.
In order to evaluate the sensitivity of the proposed HPTLC-UV methodology for simultaneous detection of CZN and PCT, the “LOD and LOQ” were determined. Table 1 illustrates the computed data of “LOD and LOQ” for CZN and PCT using the proposed HPTLC-UV approach. The “LOD and LOQ” for CZN were calculated to be 13.86 ± 0.21 and 41.58 ± 0.63 ng band−1, respectively, using the proposed HPTLC-UV methodology. The “LOD and LOQ” for PCT were calculated to be 10.21 ± 0.16 and 30.63 ± 0.48 ng band−1, respectively, using the proposed HPTLC-UV technique. The LOD values for CZN and PCT were much lower than the lowest linearity concentration for both drugs. The linearity range for CZN was 40–1600 ng band−1, and its LOD was 13.86 ng band−1, which was much lower than the lowest linearity concentration of CZN. Similarly, the linearity range for PCT was 30–1600 ng band−1, and its LOD was 10.21 ng band−1, which was also much lower than the lowest linearity concentration of PCT. However, the LOQ values for CZN and PCT were slightly higher than the lowest linearity concentration for both drugs. The LOQ is the amount of analyte which can be quantified by the proposed analytical method. The LOQ value is always within the linearity range, which was achieved in the present study [36]. Hence, both LOD and LOQ values for both drugs correlated well with the linearity range. These results revealed that the greener HPTLC-UV method was sensitive enough for simultaneous detection and quantification of CZN and PCT.
The Rf values and overlaid UV-absorption spectra of CZN and PCT in commercially available tablets (Myodol) and capsules (Relaxon) were examined and compared with that of standards CZN and PCT to determine the specificity of the proposed HPTLC-UV method for simultaneous detection of CZN and PCT. The standards CZN and PCT as well as CZN and PCT in commercially available tablets and capsules are shown in Figure 3 along with their overlapping UV-absorption spectra.
The maximum densitometry response of CZN and PCT in standards, commercially available tablets, and commercially available capsules was observed at a wavelength of 268 nm. The identical UV-absorption spectra, Rf values, and wavelengths of CZN and PCT in standards and commercial tablets and capsules demonstrated the specificity of the proposed HPTLC-UV approach for concurrent detection of CZN and PCT.

3.3. Application of the HPTLC-UV Method in Simutaneous Detection of CZN and PCT in Marketed Tablets and Capsules

For simultaneous detection of CZN and PCT in their commercially available tablets and capsules, the greener HPTLC-UV method has been proposed as an alternative to routine liquid chromatography methods. The chromatograms of CZN and PCT from marketed tablets and capsules were verified by comparing their TLC bands at Rf = 0.54 ± 0.02 for CZN and Rf = 0.67 ± 0.02 for PCT with that of standards CZN and PCT using the proposed HPTLC-UV method. Figure 4 illustrates the obtained densitograms of CZN and PCT in marketed capsules Relaxon (Figure 4A) and tablets Myodol (Figure 4B), which revealed the densitograms of CZN and PCT similar to those of standard CZN and PCT in marketed capsules and tablets.
The percent assay of CZN in commercially available capsules (Relaxon) and tablets (Myodol) was found to be 99.01 ± 1.53 and 100.87 ± 1.61 percent, respectively, using the proposed HPTLC-UV approach. The percent assay of PCT in commercially available capsules (Relaxon) and tablets (Myodol) was discovered to be 98.31 ± 1.38 and 101.21 ± 1.67%, respectively, utilizing the proposed HPTLC-UV method. These pharmaceutical assay results demonstrated that the greener HPTLC-UV method was suitable and acceptable for simultaneous detection of CZN and PCT in marketed capsules and tablets.

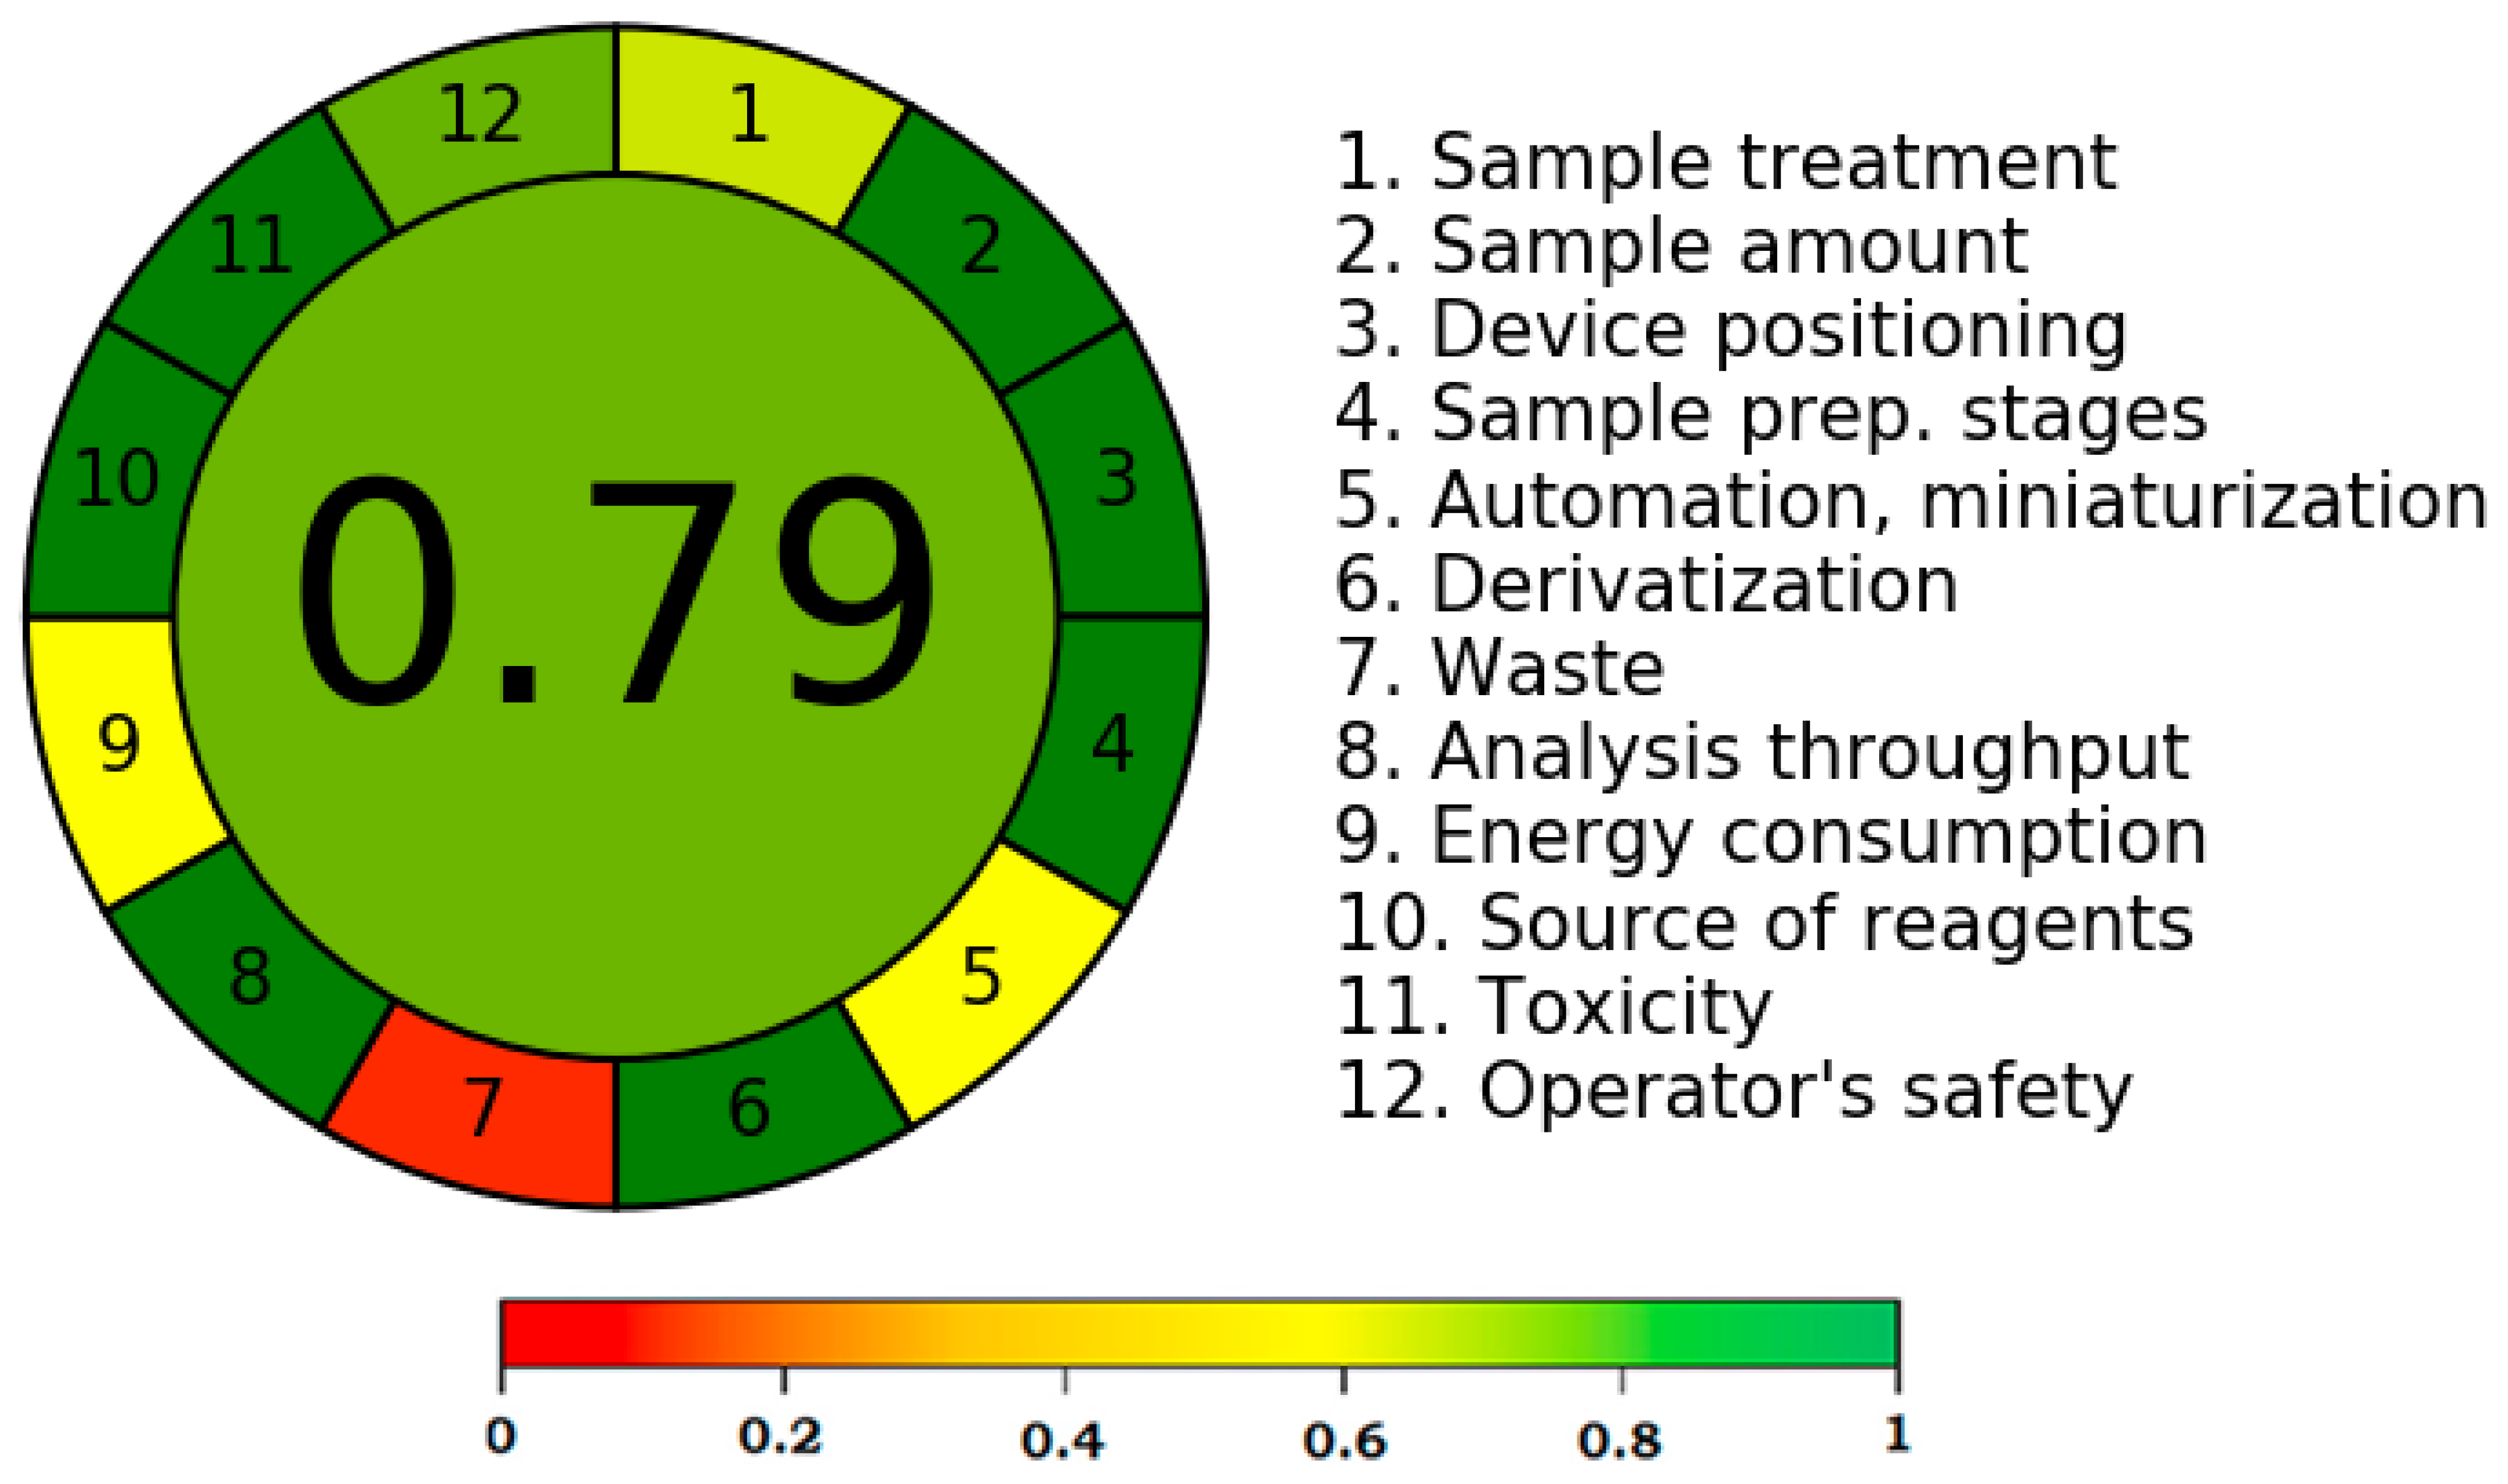
3.4. Greenness Evaluation Using the AGREE Approach

For the estimation of the greenness of analytical techniques, a number of quantitative and qualitative methodologies have been published [31,32,33,34,35]. Only AGREE, however, makes use of all twelve GAC principles for this objective [33]. As a result, the suggested HPTLC-UV approach’s greenness was assessed using the AGREE methodology. Figure 5 shows the typical pictogram for the AGREE index of the suggested HPTLC-UV approach. Using all twelve GAC principles, 0.79 was the expected value for the AGREE index. These results revealed that the suggested HPTLC-UV methodology for concurrent detection of CZN and PCT had an outstanding greenness profile.

4. Conclusions

The literature shows a scarcity in greener analytical methods for simultaneous detection of CZN and PCT. Therefore, the goal of the current work was to design and validate a rapid (analysis time: 30 min for 24 samples), sensitive, and greener HPTLC-UV method for simultaneous detection of CZN and PCT in their commercialized tablets and capsules. The proposed HPTLC-UV approach is linear, rapid, affordable, accurate, precise, robust, specific, and sensitive for concurrent detection of CZN and PCT. The amounts of CZN and PCT in marketed tablets and capsules were found to be acceptable using the proposed HPTLC-UV method. The AGREE evaluation revealed an excellent greenness profile of the proposed HPTLC-UV method. These observations and results demonstrated that the proposed HPTLC-UV method can be successfully utilized for simultaneous detection of CZN and PCT in commercially available combined dosage forms, such as tablets and capsules. Due to its successful application in tablets and capsules, the proposed HPTLC-UV method can also be applied to simultaneous detection of CZN and PCT in other dosage forms.

Author Contributions

Conceptualization—P.A. and F.S.; methodology—A.I.F., P.A., M.H.A. and T.M.A.; validation—S.A. and M.H.A.; data curation—T.M.A.; funding acquisition—S.A.; project administration—P.A.; supervision—P.A. and F.S.; software—S.A. and F.S.; writing original draft—F.S.; writing—review and editing—A.I.F. and S.A. All authors have read and agreed to the published version of the manuscript.

Funding

This research was funded by the Researchers Supporting Project (Number RSP-2021/146), King Saud University, Riyadh, Saudi Arabia. The APC was funded by RSP.

Institutional Review Board Statement

Not applicable.

Informed Consent Statement

Not applicable.

Data Availability Statement

This study did not report any data.

Acknowledgments

The authors are thankful to the Researchers Supporting Project (Number RSP-2020/146) at King Saud University, Riyadh, Saudi Arabia for supporting this work.

Conflicts of Interest

The authors declare no conflict of interest.

References

  1. Toubar, S.S.; Hegazy, M.A.; Elshaheda, M.S.; Helmy, M.I. Novel pure component contribution, mean centering of ratio spectra and factor based algorithms for simultaneous resolution and quantification of overlapped spectral signals: An application to recently co-formulated tablets of chlorzoxazone, aceclofenac and paracetamol. Spectrochim. Acta Part A 2016, 163, 89–95. [Google Scholar]
  2. Jimenez, J.A.; Martinez, F. Thermodynamic study of the solubility of acetaminophen in propylene glycol + water cosolvent mixtures. J. Braz. Chem. Soc. 2006, 17, 125–134. [Google Scholar] [CrossRef] [Green Version]
  3. Shakeel, F.; Alanazi, F.K.; Alsarra, I.A.; Haq, N. Solubilization behavior of paracetamol in Transcutol-water mixtures at T = (298.15 to 333.15) K. J. Chem. Eng. Data 2012, 58, 3551–3556. [Google Scholar] [CrossRef]
  4. Petsalo, A.; Turpeinen, M.; Pelkonen, O.; Tolonen, A. Analysis of nine drugs and their cytochrome P450-specific probe metabolites from urine by liquid chromatography tandem mass spectrometry utilizing sub 2 μm particle size column. J. Chromatogr. A 2008, 1215, 107–115. [Google Scholar] [CrossRef]
  5. Joshi, M.; Tyndale, R.F. Regional and cellular distribution of CYP2E1 in monkey brain and its induction by chronic nicotine. Neuropharmacology 2006, 50, 568–575. [Google Scholar] [CrossRef]
  6. McCrae, J.C.; Morrison, E.E.; Maclntyre, I.M.; Dear, J.W.; Webb, D.J. Long-term adverse effects of paracetamol-a review. Br. J. Clin. Pharmacol. 2018, 84, 2218–2230. [Google Scholar] [CrossRef] [Green Version]
  7. Richards, B.L.; Whittle, S.L.; Buchbinder, R. Muscle relaxants for pain management in rheumatoid arthritis. Cochrane Database Syst. Rev. 2012, 1, CD008922. [Google Scholar] [CrossRef]
  8. Chatterjee, P.K.; Jain, C.L.; Sethi, P.D. Simultaneous estimation of chlorzoxazone and acetaminophen in combined dosage forms by an absorbance ratio technique and difference spectrophotometry. J. Pharm. Biomed. Anal. 1989, 7, 693–698. [Google Scholar] [CrossRef]
  9. Garg, C.; Saraf, W.; Saraf, S. Simultaneous estimation of aceclofenac, paracetamol and chlorzoxazone in tablets. Indian J. Pharm. Sci. 2007, 69, 692–694. [Google Scholar]
  10. Joshi, R.; Pawar, N.; Sawant, R.; Gaikwad, P. Simultaneous estimation of paracetamol, chlorzoxazone and ibuprofen by validated spectrophotometric methods. Anal. Chem. Lett. 2012, 2, 118–124. [Google Scholar] [CrossRef]
  11. El-Bagary, R.I.; El-Kady, E.F.; Al-Matari, A.A. Simultaneous spectrophotometric determination of diclofenac sodium, paracetamol, and chlorzoxazone in ternary mixture using chemometric and artificial neural networks techniques. Asian J. Pharm. Clin. Res. 2017, 10, 225–230. [Google Scholar] [CrossRef]
  12. Mohammed, M.A.; Reid, I.O.A.; Elawni, A. H-point standard additions method for the simultaneous determination of paracetamol and chlorzoxazone in tablets using addition of both analytes and absorbance increments (∆A). Int. J. Adv. Pharm. Anal. 2017, 7, 1–5. [Google Scholar]
  13. Ravisankar, S.; Vasudevan, M.; Gandhimathi, M.; Suresh, B. Reversed-phase HPLC method for the estimation of acetoaminophen, ibuprofen and chlorzoxazone in formulations. Talanta 1998, 46, 1577–1581. [Google Scholar] [CrossRef]
  14. Ali, M.S.; Rafiuddin, S.; Ghori, M.; Kahtri, R.A. Simultaneous determination of paracetamol, chlorzoxazone, and related impurities 4-aminophenol, 4’-chloroacetanilide, and p-chlorophenol in pharmaceutical preparations by high-performance liquid chromatography. J. AOAC Int. 2007, 90, 82–93. [Google Scholar] [CrossRef] [Green Version]
  15. Shaikh, K.A.; Devkhile, A.B. Simultaneous determination of aceclofenac, paracetamol, and chlorzoxazone by RP-HPLC in pharmaceutical dosage form. J. Chromatogr. Sci. 2008, 46, 649–652. [Google Scholar] [CrossRef] [PubMed] [Green Version]
  16. Karthikeyan, V.; Vaidhyalingam; Yuvaraj, G.; Nema, R.K. Simultaneous estimation of paracetamol, chlorzoxazone and aceclofenac in pharmaceutical formulation by HPLC method. Int. J. ChemTech. Res. 2009, 1, 457–460. [Google Scholar]
  17. Badgujar, M.A.; Pingale, S.G.; Mangaonkar, K.V. Simultaneous determination of paracetamol, chlorzoxazone and diclofenac sodium in tablet dosage form by high performance liquid chromatography. E-J. Chem. 2011, 8, 1206–1211. [Google Scholar] [CrossRef]
  18. More, S.J.; Tandulwadkar, S.S.; Nikam, A.R.; Rathore, A.S.; Sathianarayanan, L.; Mahadik, K.R. Application of HPLC for the simultaneous determination of paracetamol, chlorzoxazone, and nimesulide in pharmaceutical dosage form. ISRN Chromatogr. 2012, 2012, E252895. [Google Scholar] [CrossRef] [Green Version]
  19. Vidya, P.; Gawande, V.; Chandewar, A.V.; Dewani, A.P. Development and validation of HPLC-PDA method for simultaneous estimation of famotidine, paracetamol, chlorzoxazone and diclofenac potassium in combined solid dosage from. Der. Pharm. Lett. 2017, 10, 15–27. [Google Scholar]
  20. El-Yazbi, A.F.; Guirguis, K.M.; Bedair, M.M.; Belal, T.S. Validated specific HPLC-DAD method for simultaneous estimation of paracetamol and chlorzoxazone in the presence of five of their degradation products and toxic impurities. Drug Dev. Ind. Pharm. 2020, 46, 1853–1861. [Google Scholar] [CrossRef]
  21. Prema Kumari, K.B.; Murugan, V.; Ezhilarasan, V.; Joseph, S.R. Simultaneous determination of paracetamol, aceclofenac and chlorzoxazone in pharmaceutical dosage form by UHPLC method. J. Chromatogr. Sep. Technol. 2017, 8, E1000384. [Google Scholar]
  22. Bari, V.R.; Dhorda, U.J.; Sundaresan, M. A simultaneous packed column supercritical fluid chromatographic method for ibuprofen, chlorzoxazone and acetoaminophen in bulk and dosage forms. Talanta 1997, 45, 297–302. [Google Scholar] [CrossRef]
  23. Khan, H.; Ali, M.; Ahuja, A.; Ali, J. Validated UPLC/Q-TOF-MS method for simultaneous determination of aceclofenac, paracetamol and chlorzoxazone in human plasma and its application to pharmacokinetic study. Asian J. Pharm. Anal. 2017, 7, 93. [Google Scholar] [CrossRef]
  24. Mohamed, D.; Hegazy, M.A.; Elshahed, M.S.; Toubar, S.S.; Helmy, M.I. Liquid chromatography-tandem MS/MS method for simultaneous quantification of paracetamol, chlorzoxazone and aceclofenac in human plasma: An application to a pharmacokinetic study. Biomed. Chromatogr. 2018, 32, E4232. [Google Scholar] [CrossRef]
  25. Sane, R.T.; Gadgil, M. Simultaneous determination of paracetamol, chlorzoxazone, and nimesulide by HPTLC. J. Planar Chromatogr. 2002, 15, 76–78. [Google Scholar] [CrossRef]
  26. Yadav, S.S.; Jagtap, A.S.; Rao, J.R. Simultaneous determination of paracetamol, lornoxicam and chlorzoxazone in tablets by high performance thin layer chromatography. Der. Pharm. Lett. 2012, 4, 1798–1802. [Google Scholar]
  27. Abdelaleem, E.A.; Abdelwahab, N.S. Stability-indicating TLC-densitometry method for simultaneous determination of paracetamol and chlorzoxazone and their toxic impurities. J. Chromatogr. Sci. 2013, 51, 187–191. [Google Scholar] [CrossRef]
  28. Chhalotiya, U.K.; Patel, D.B.; Shah, D.A.; Mehta, F.A.; Bhatt, K.K. Simultaneous estimation of chlorzoxazone, paracetamol, famotidine and diclofenac potassium in their combined dosage form by thin layer chromatography. J. Pharm. Pharmacol. Sci. 2017, 2, E111. [Google Scholar] [CrossRef]
  29. Salih, M.E.; Aqel, A.; Abdulkhair, B.Y.; Alothman, Z.A.; Abdulaziz, M.A.; Badjah-Hadj-Ahmed, A.Y. Simultaneous determination of paracetamol and chlorzoxazone in their combined pharmaceutical formulations by reversed-phase capillary liquid chromatography using a polymethacrylate monolithic column. J. Chromatogr. Sci. 2018, 56, 819–827. [Google Scholar] [CrossRef] [Green Version]
  30. Alam, P.; Shakeel, F.; Ali, A.; Alqarni, M.H.; Foudah, A.I.; Aljarba, T.M.; Alkholifi, F.K.; Alshehri, S.; Ghoneim, M.M.; Ali, A. Simultaneous determination of caffeine and paracetamol in commercial formulations using normal-phase and reversed-phase HPTLC methods: A contrast of validation parameters. Molecules 2022, 27, 405. [Google Scholar] [CrossRef]
  31. Abdelrahman, M.M.; Abdelwahab, N.S.; Hegazy, M.A.; Fares, M.Y.; El-Sayed, G.M. Determination of the abused intravenously administered madness drops (tropicamide) by liquid chromatography in rat plasma; an application to pharmacokinetic study and greenness profile assessment. Microchem. J. 2020, 159, E105582. [Google Scholar] [CrossRef]
  32. Duan, X.; Liu, X.; Dong, Y.; Yang, J.; Zhang, J.; He, S.; Yang, F.; Wang, Z.; Dong, Y. A green HPLC method for determination of nine sulfonamides in milk and beef, and its greenness assessment with analytical eco-scale and greenness profile. J. AOAC Int. 2020, 103, 1181–1189. [Google Scholar] [CrossRef]
  33. Pena-Pereira, F.; Wojnowski, W.; Tobiszewski, M. AGREE-Analytical GREEnness metric approach and software. Anal. Chem. 2020, 92, 10076–10082. [Google Scholar] [CrossRef]
  34. Foudah, A.I.; Shakeel, F.; Alqarni, M.H.; Alam, P. A rapid and sensitive stability-indicating green RP-HPTLC method for the quantitation of flibanserin compared to green NP-HPTLC method: Validation studies and greenness assessment. Microchem. J. 2021, 164, E105960. [Google Scholar] [CrossRef]
  35. Alam, P.; Salem-Bekhit, M.M.; Al-Joufi, F.A.; Alqarni, M.H.; Shakeel, F. Quantitative analysis of cabozantinib in pharmaceutical dosage forms using green RP-HPTLC and green NP-HPTLC methods: A comparative evaluation. Sustain. Chem. Pharm. 2021, 21, E100413. [Google Scholar] [CrossRef]
  36. International Conference on Harmonization (ICH). Q2 (R1): Validation of Analytical Procedures–Text and Methodology; International Conference on Harmonization (ICH): Geneva, Switzerland, 2005. [Google Scholar]
Figure 1. Molecular structures of (A) paracetamol (PCT) and (B) chlorzoxazone (CZN).
Separations 09 00300 g001
Figure 2. Representative high-performance thin-layer chromatography ultraviolet (HPTLC-UV) chromatograms of standard CZN and PCT.
Separations 09 00300 g002
Figure 3. Overlaid UV-absorption spectra of standard CZN and PCT and CZN and PCT in commercial Relaxon capsules and commercial Myodol tablets.
Separations 09 00300 g003
Figure 4. HPTLC-UV densitograms of CZN and PCT in (A) marketed Relaxon capsules and (B) marketed Myodol tablets.
Separations 09 00300 g004
Figure 5. “Analytical GREEnness (AGREE)” score for the greener HPTLC-UV method.
Separations 09 00300 g005
Table 1. Results for linearity evaluation for simultaneous detection of chlorzoxazone (CZN) and paracetamol (PCT) using the greener high-performance thin-layer chromatography ultraviolet (HPTLC-UV) methodology (mean ± SD; n = 6).
ParametersCZNPCT
Linearity range (ng band−1)40–160030–1600
R20.99900.9985
Slope ± SD19.29 ± 0.5618.73 ± 0.53
Intercept ± SD294.32 ± 5.38900.96 ± 9.87
Standard error of slope0.220.21
Standard error of intercept2.194.03
95% CI of slope18.31–20.2817.80–19.67
95% CI of intercept284.86–303.77883.61–918.30
LOD ± SD (ng band−1)13.86 ± 0.2110.21 ± 0.16
LOQ ± SD (ng band−1)41.58 ± 0.6330.63 ± 0.48
R2: determination coefficient; CI: confidence interval; LOD: limit of detection; LOQ: limit of quantification.
Table 2. The values of system suitability parameters for CZN and PCT for the HPTLC-UV methodology (mean ± SD; n = 3).
ParametersCZNPCT
Rf0.54 ± 0.020.67 ± 0.02
As1.06 ± 0.031.04 ± 0.02
N m−15361 ± 6.125485 ± 6.28
Rf: retardation factor; As: asymmetry factor; N m−1: number of theoretical plates per meter.
Table 3. Determination of the accuracy of CZN and PCT for the HPTLC-UV methodology (mean ± SD; n = 6).
Conc. (ng band−1)Conc. Found (ng band−1) ± SDRecovery (%)CV (%)
CZN
5050.71 ± 0.54101.421.06
400404.64 ± 3.12101.160.77
16001578.95 ± 9.9498.680.62
PCT
5050.48 ± 0.47100.960.93
400394.76 ± 1.9298.690.48
16001585.83 ± 7.1699.110.45
CV: coefficient of variance.
Table 4. Determination of intra- and inter-day precision of CZN and PCT for the HPTLC-UV methodology (mean ± SD; n = 6).
Conc.
(ng band−1)
Intra-Day PrecisionInter-Day Precision
Conc.
(ng band−1) ± SD
Standard ErrorCV (%)Conc.
(ng band−1) ± SD
Standard ErrorCV (%)
CZN
5049.39 ± 0.480.190.9749.52 ± 0.490.200.98
400392.34 ± 3.081.250.78389.88 ± 3.141.280.80
16001581.41 ± 10.224.170.641610.23 ± 12.214.980.75
PCT
5049.61 ± 0.450.180.9050.66 ± 0.490.200.96
400406.14 ± 2.140.870.52392.87 ± 2.240.910.57
16001653.54 ± 8.123.310.491581.87 ± 8.553.490.54
CV: coefficient of variance.
Table 5. Robustness evaluation of CZN and PCT for the HPTLC-UV methodology (mean ± SD; n = 6).
Conc.
(ng band−1)
Mobile Phase Composition (Ethanol/Water)Results
OriginalUsed (ng band−1) ± SD% CVRf
CZN
72:28+2.0386.87 ± 3.680.950.53
40070:3070:300.0395.41 ± 3.740.940.54
68:32−2.0404.64 ± 3.950.970.55
PCT
72:28+2.0387.84 ± 3.650.940.66
40070:3070:300.0397.63 ± 3.860.970.67
68:32−2.0405.64 ± 4.301.060.68
CV: coefficient of variance; Rf: retardation factor.
Publisher’s Note: MDPI stays neutral with regard to jurisdictional claims in published maps and institutional affiliations.

