
Comparison of Validation Parameters for the Determination of Vitamin D3 in Commercial Pharmaceutical Products Using Traditional and Greener HPTLC Methods

 , , , , and
Abstract
:1. Introduction
2. Materials and Methods
2.1. Materials
2.2. Instrumentation and Analytical Conditions
2.3. Calibration Curves and Quality Control (QC) Sample for VD3
2.4. Sample Processing for the Estimation of VD3 in Marketed Tablets A–D
2.5. Validation Parameters
2.6. Application of Traditional and Greener Analytical Strategies in the Estimation of VD3 in Marketed Tablets A–D
2.7. Greenness Evaluation
2.8. Statistical Analysis
3. Results and Discussion
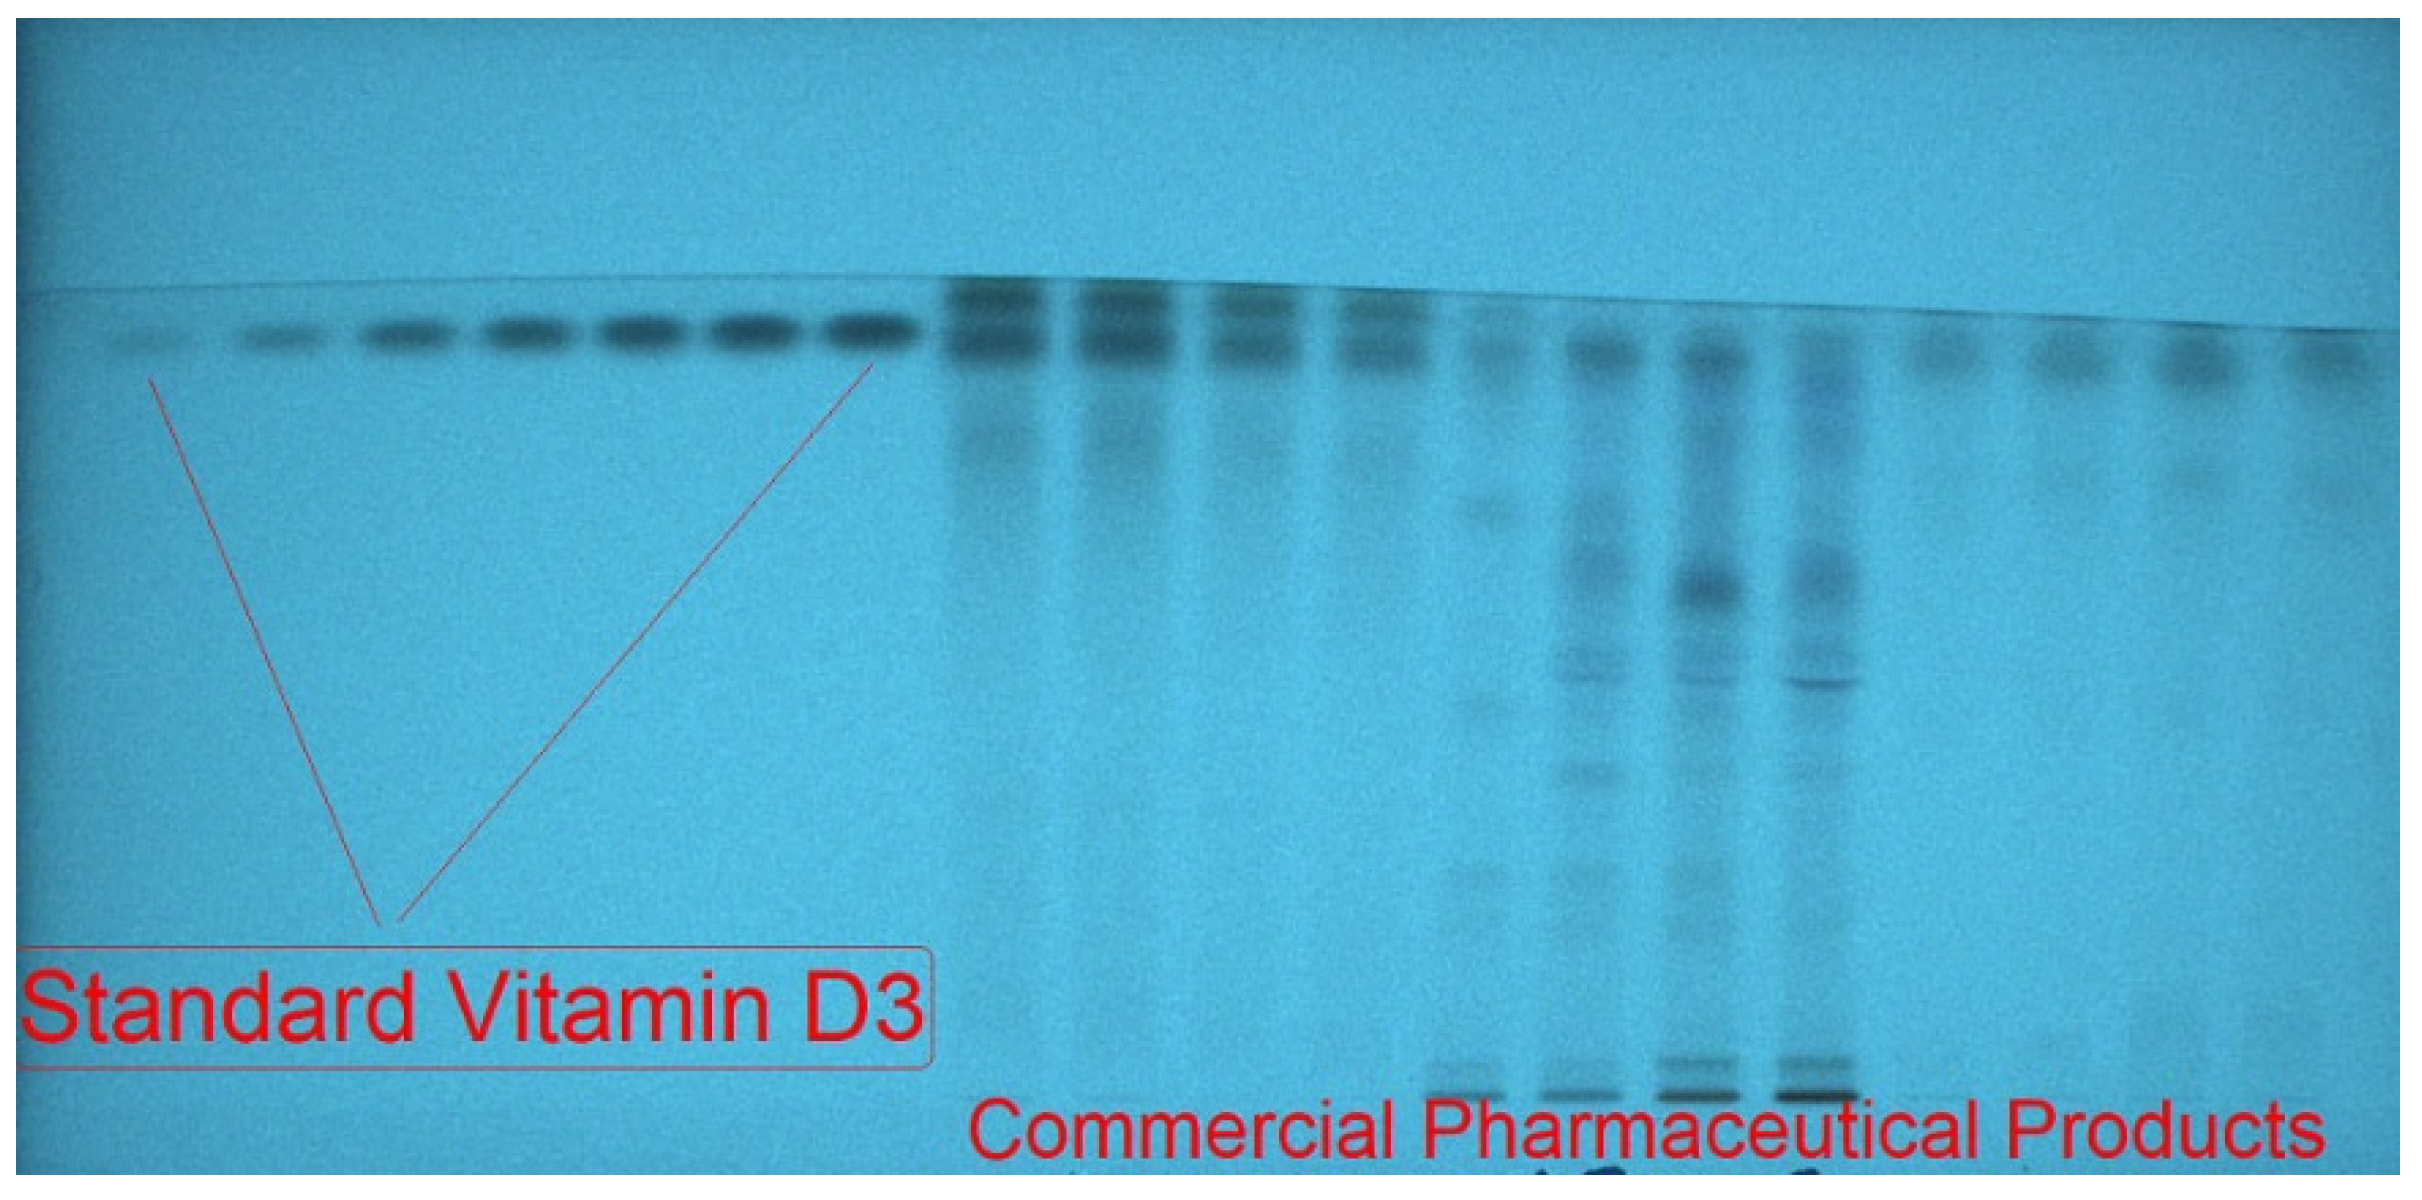
3.1. Method Development
3.2. Validation Parameters
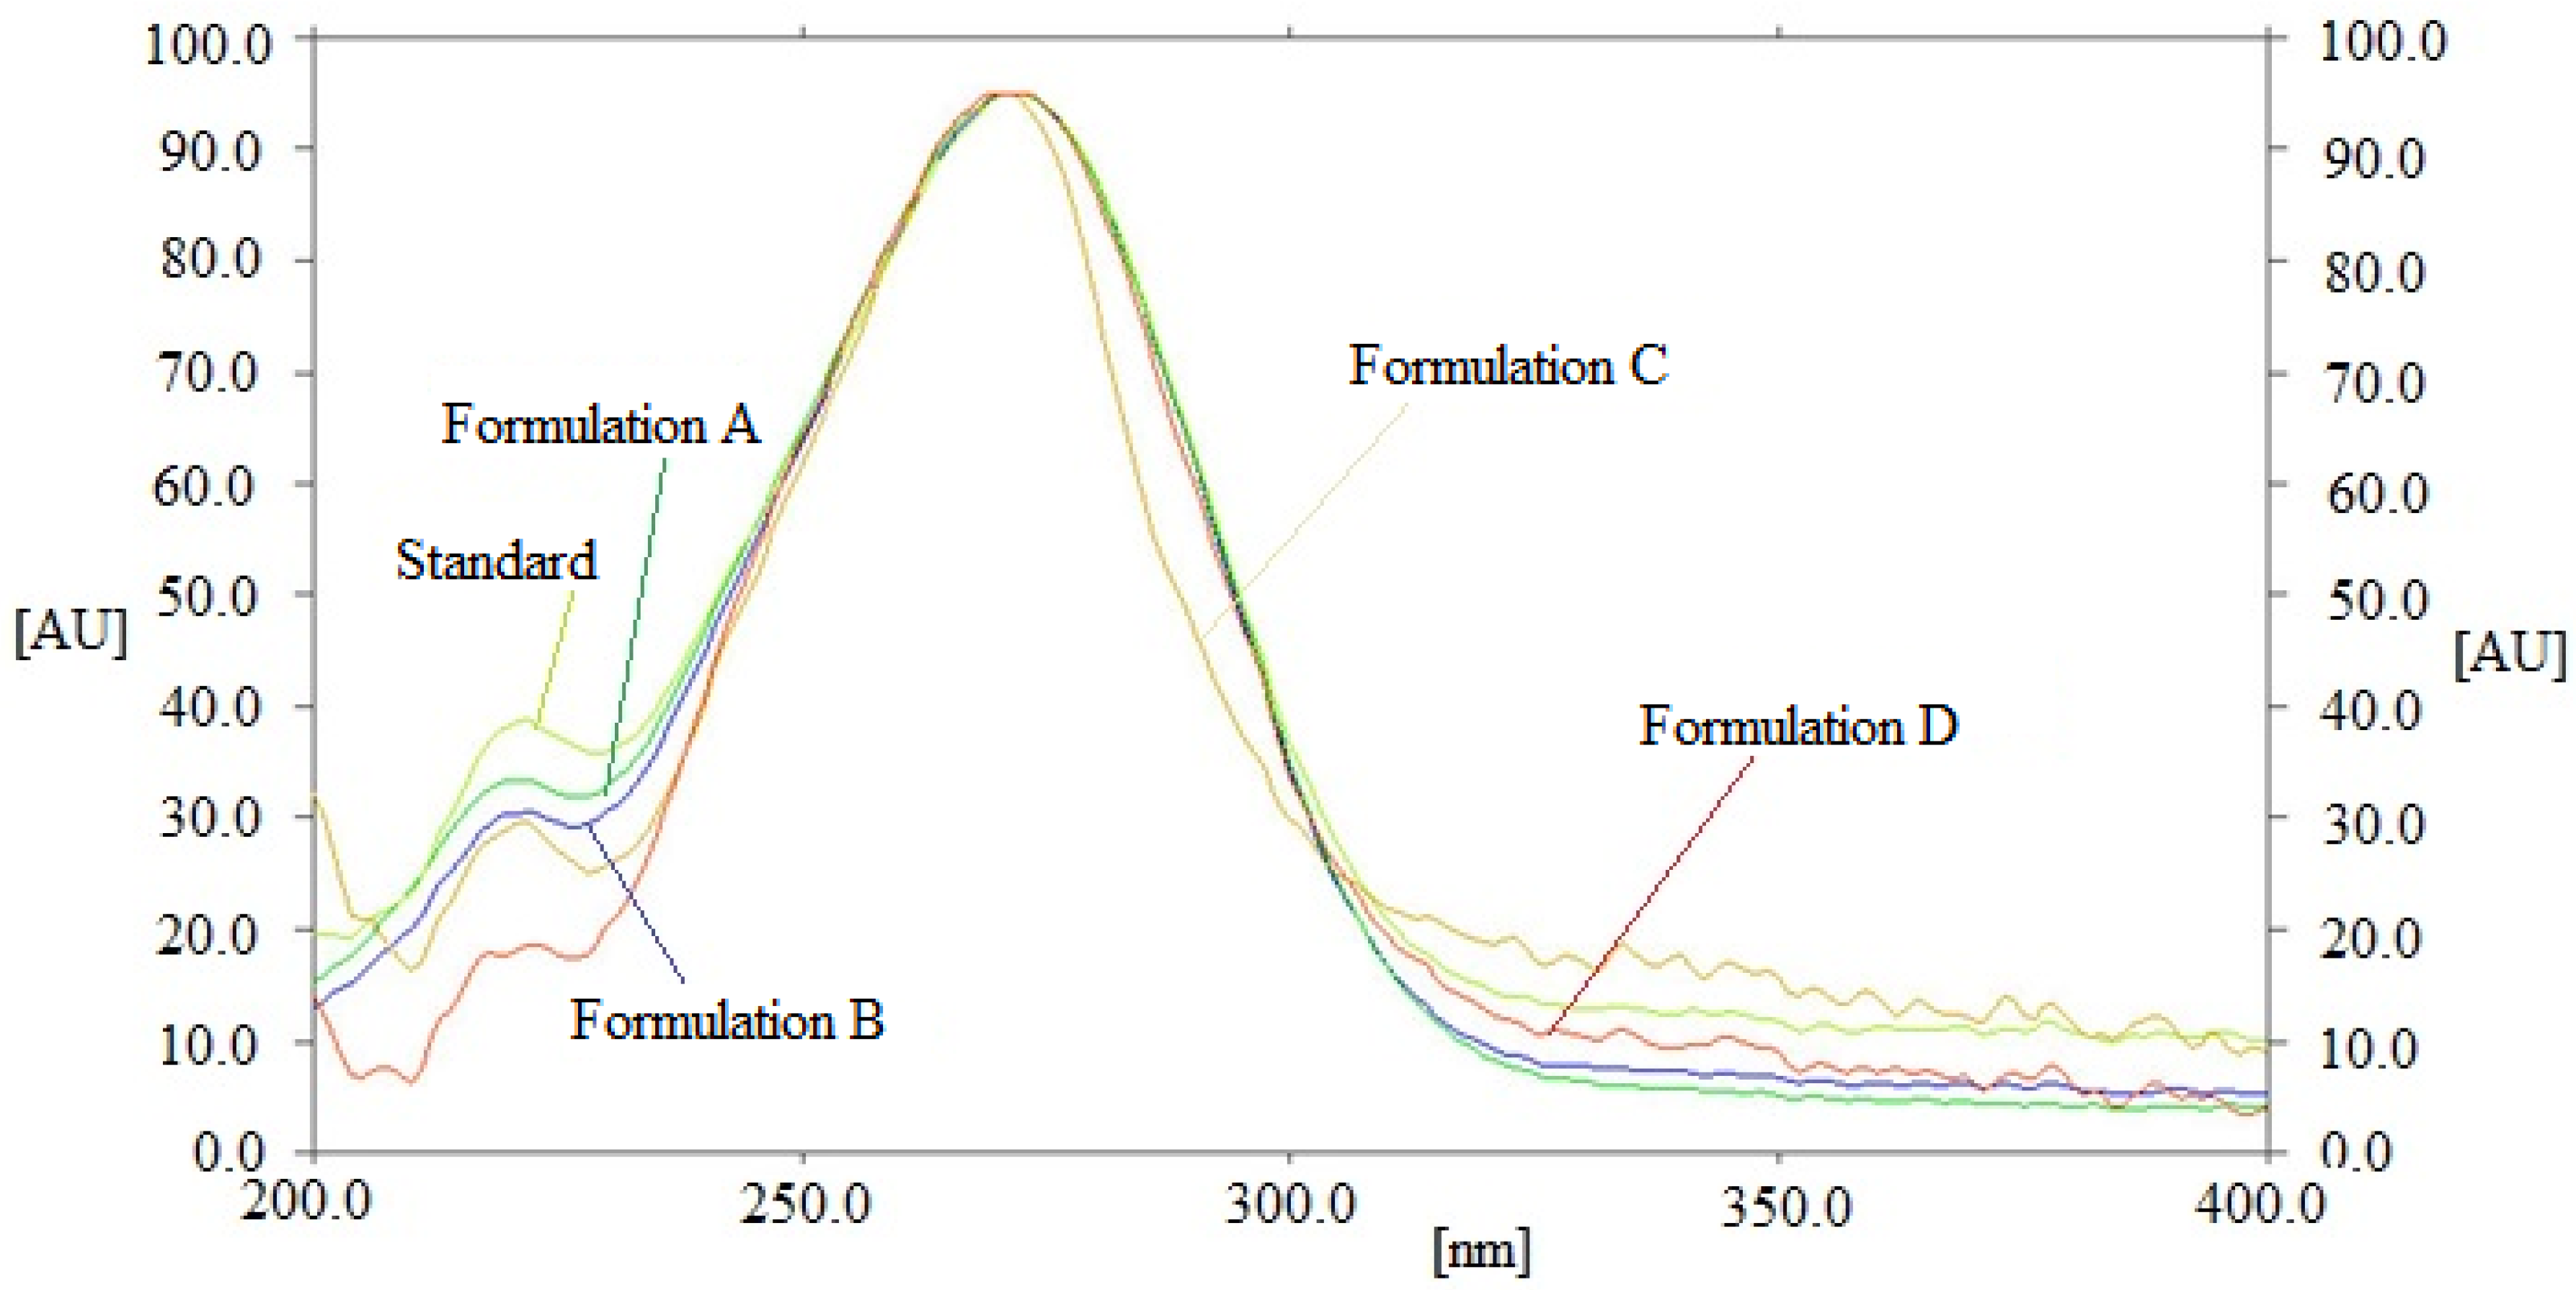
3.3. Application of Traditional and Greener HPTLC Strategies in the Estimation of VD3 in Marketed Tablets A–D
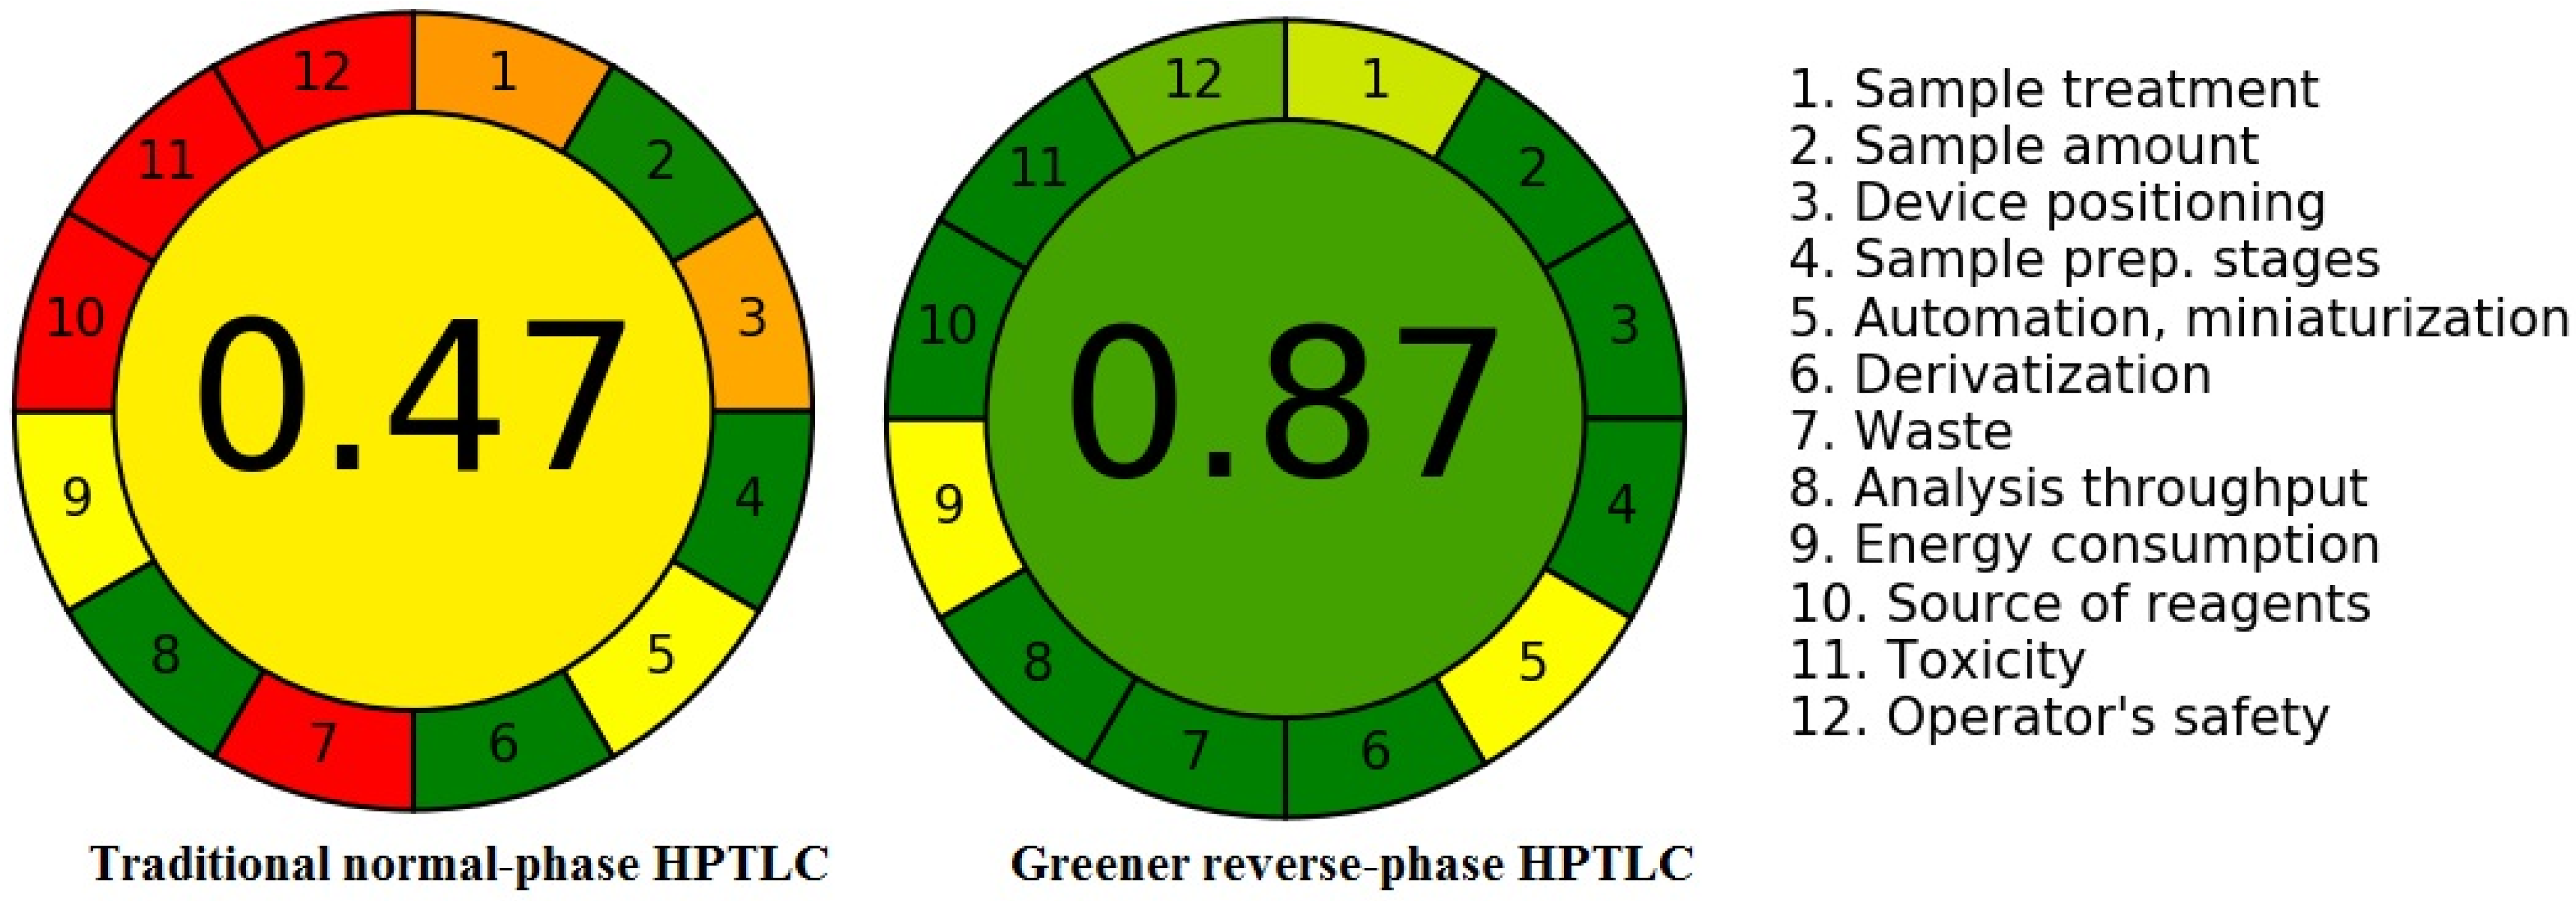
3.4. Greenness Assessment
4. Conclusions
Author Contributions
Funding
Institutional Review Board Statement
Informed Consent Statement
Data Availability Statement
Acknowledgments
Conflicts of Interest
References
- Christakos, S.; Dhawan, P.; Benn, B.; Porta, A.; Hediger, M.; Oh, G.T.; Jeung, E.B.; Zhong, Y.; Ajibade, D.; Dhawan, K.; et al. Vitamin D-molecular mechanism of action. Ann. N. Y. Acad. Sci. 2007, 1116, 340–348. [Google Scholar] [CrossRef]
- Pike, J.W. Vitamin-D3 receptors-structure and function in transcription. Annu. Rev. Nutr. 1991, 11, 189–216. [Google Scholar] [CrossRef]
- Holick, M.F. Resurrection of vitamin D deficiency and rickets. J. Clin. Investig. 2006, 116, 2062–2072. [Google Scholar] [CrossRef] [PubMed] [Green Version]
- Deluca, H.D. Metabolism and molecular mechanism of action of vitamin-D. Biochem. Soc. Trans. 1982, 10, 147–158. [Google Scholar] [CrossRef] [Green Version]
- Jurutka, P.W.; Bartik, L.; Whitfield, G.K.; Mathern, D.R.; Barthel, T.K.; Gurevich, M.; Hsieh, J.C.; Kaczmarska, M.; Haussler, C.A.; Haussler, M.R. Vitamin D receptor: Key roles in bone mineral pathophysiology, molecular mechanism of action, and novel nutritional ligands. J. Bone Miner. Res. 2007, 22, V2–V10. [Google Scholar] [CrossRef] [PubMed]
- Alsuwdia, A.O.; Frag, Y.M.; Sayyari, A.A.; Mousa, D.H.; Alhijaili, F.F.; Al-Harbi, A.S.; Housawi, A.A.; Mittal, B.V.; Singh, A.K. Prevalence of vitamin D deficiency in Saudi adults. Saudi Med. J. 2013, 34, 814–818. [Google Scholar]
- AlBuhairan, F.S.; Tamim, H.; Al-Dubayee, M.; AlDhukair, S.; Al-Shehri, S.; Tamimi, W.; El-Bcheraoui, C.; Magzoub, M.E.; de Vries, N.; Al-Alwan, I. Time for an adolescent health surveillance system in Saudi Arabia: Findings from “Jeeluna”. J. Adolesc. Health 2015, 57, 263–269. [Google Scholar] [CrossRef] [PubMed] [Green Version]
- Rahman, A.; Rahman, M.M.; Hossain, M.S.; Jahan, M.S.; Akter, N.J.; Bari, M.L. A simple and alternative UV spectrometric method for the estimation of vitamin D3. Microb. Bioact. 2019, 2, 98–105. [Google Scholar]
- Johnsson, H.; Halen, B.; Hessel, H.; Nyman, A.; Thorzell, K. Determination of vitamin D3 in margarines, oils and other supplemented food products using HPLC. Int. J. Vitam. Nutr. Res. 1989, 59, 262–268. [Google Scholar]
- Sarioglu, K.; Celebi, S.S.; Mutlu, M. A rapid method for determination of vitamins D2 and D3 in pharmaceutical preparations by HPLC. J. Liq. Chromatogr. Relat. Technol. 2001, 24, 973–982. [Google Scholar] [CrossRef]
- Jakobsen, J.; Clausen, I.; Leth, T.; Ovesen, L. A new method for the determination of vitamin D3 and 25-hydroxyvitamin D3 in meat. J. Food Compos. Anal. 2004, 17, 777–787. [Google Scholar] [CrossRef]
- Bilodeau, L.; Dufresne, G.; Deeks, J.; Clement, G.; Bertrand, J.; Turcotte, S.; Rbichaud, A.; Beraldin, F.; Fouquet, A. Determination of vitamin D3 and 25-hydroxyvitamin D3 in foodstuffs by HPLC UV-DAD and LC–MS/MS. J. Food Compos. Anal. 2011, 24, 441–448. [Google Scholar] [CrossRef]
- Kumar, S.; Chawla, D.; Tripathi, K. An improved and sensitive method for vitamin D3 estimation by RP-HPLC. Pharm. Anal. Acta 2015, 6, E1000410. [Google Scholar]
- Temova, Z.; Roskar, R. Stability-indicating HPLC–UV method for vitamin D3 determination in solutions, nutritional supplements and pharmaceuticals. J. Chromatogr. Sci. 2016, 54, 1180–1186. [Google Scholar] [CrossRef]
- Farag, A.M.; Rizk, M.S.; El-Bassel, H.A.; Youssif, M.H. Determination of vitamin D3 content in high, low and zero fat food using high performance liquid chromatography. Med. J. Cairo Univ. 2018, 86, 3911–3918. [Google Scholar]
- Huang, B.-F.; Pan, X.-D.; Zhang, J.-S.; Xu, J.-J.; Cai, Z.-X. Determination of vitamins D2 and D3 in edible fungus by reversed-phase two-dimensional liquid chromatography. J. Food Qual. 2020, 2020, E8869279. [Google Scholar] [CrossRef]
- Rashidi, L.; Nodeh, H.R.; Shahabuddin, S. Determination of vitamin D in the fortified sunflower oil: Comparison of two developed methods. Food Anal. Methods 2022, 15, 330–337. [Google Scholar] [CrossRef]
- Brunetto, M.R.; Obando, M.A.; Gallignani, M.; Alarcon, O.M.; Nieto, E.; Salinas, R.; Burguera, J.L.; Burguera, M. HPLC determination of vitamin D3 and its metabolite in human plasma with on-line sample cleanup. Talanta 2004, 64, 1364–1370. [Google Scholar] [CrossRef]
- Keyfi, F.; Nahid, S.; Mokhtariye, A.; Nayerabadi, S.; Alaei, A.; Varasteh, A.-R. Evaluation of 25-OH vitamin D by high performance liquid chromatography: Validation and comparison with electrochemiluminescence. J. Anal. Sci. Technol. 2018, 9, E25. [Google Scholar] [CrossRef]
- Babat, N.; Turkmen, Y. Determination of serum vitamin D3 level by high performance liquid chromatography (HPLC) in patients with coronary artery ectasia. Cardiol. Cardiovasc. Med. 2020, 4, 97–104. [Google Scholar] [CrossRef]
- Mirza, T.; Qadeer, K.; Ahmad, I. Clinical analysis of vitamin D and metabolites. J. Baqai Med. Univ. 2009, 12, 25–28. [Google Scholar]
- Shah, I.; James, R.; Barker, J.; Petroczi, A.; Naughton, D.P. Misleading measures in vitamin D analysis: A novel LC-MS/MS assay to account for epimers and isobars. Nutr. J. 2011, 10, E46. [Google Scholar] [CrossRef] [Green Version]
- Becze, A.; Fuss, V.L.B.; Scurtu, D.A.; Tomoaia-Cotisel, M.; Mocanu, A.; Cadar, O. Simultaneous determination of vitamins D3 (calcitriol, cholecalciferol) and K2 (menaquinone-4 and menaquinone-7) in dietary supplements by UHPLC. Molecules 2021, 26, 6982. [Google Scholar] [CrossRef]
- Andri, B.; Lebrun, P.; Dispas, A.; Klinkenberg, R.; Streel, B.; Ziemons, E.; Marini, R.D.; Hubert, P. Optimization and validation of a fast supercritical fluid chromatography method for the quantitative determination of vitamin D3 and its related impurities. J. Chromatogr. A 2017, 1491, 171–181. [Google Scholar] [CrossRef]
- Oberson, J.M.; Benet, S.; Redeuil, K.; Campos-Gimenez, E. Quantitative analysis of vitamin D and its main metabolites in human milk by supercritical fluid chromatography coupled to tandem mass spectrometry. Anal. Bioanal. Chem. 2020, 412, 365–375. [Google Scholar] [CrossRef] [Green Version]
- Socas-Rodriguez, B.; Pilarova, V.; Sandahl, M.; Holm, C.; Turner, C. Simultaneous determination of vitamin D and its hydroxylated and esterified metabolites by ultrahigh-performance supercritical fluid chromatography−tandem mass spectrometry. Anal. Chem. 2022, 94, 3065–3073. [Google Scholar] [CrossRef]
- Durovic, A.; Stojanovic, Z.; Kravic, S.; Kos, J.; Richtera, L. Electrochemical determination of vitamin D3 in pharmaceutical products by using boron doped diamond electrode. Electroanalysis 2020, 32, 741–748. [Google Scholar] [CrossRef]
- Demchenko, D.V.; Pozharitskaya, O.N.; Shikov, A.N.; Makarov, V.G. Validated HPTLC method for quantification of vitamin D in fish oil. J. Planar Chromatogr. 2011, 24, 487–490. [Google Scholar] [CrossRef]
- Almarri, F.; Haq, N.; Alanazi, F.K.; Mohsin, K.; Alsarra, I.A.; Aleanizy, F.S.; Shakeel, F. An environmentally benign HPLC-UV method for thermodynamic solubility measurement of vitamin D3 in various (Transcutol + water) mixtures. J. Mol. Liq. 2017, 242, 798–806. [Google Scholar] [CrossRef]
- Abdelrahman, M.M.; Abdelwahab, N.S.; Hegazy, M.A.; Fares, M.Y.; El-Sayed, G.M. Determination of the abused intravenously administered madness drops (tropicamide) by liquid chromatography in rat plasma; an application to pharmacokinetic study and greenness profile assessment. Microchem. J. 2020, 159, E105582. [Google Scholar] [CrossRef]
- Duan, X.; Liu, X.; Dong, Y.; Yang, J.; Zhang, J.; He, S.; Yang, F.; Wang, Z.; Dong, Y. A green HPLC method for determination of nine sulfonamides in milk and beef, and its greenness assessment with analytical eco-scale and greenness profile. J. AOAC Int. 2020, 103, 1181–1189. [Google Scholar] [CrossRef]
- Pena-Pereira, F.; Wojnowski, W.; Tobiszewski, M. AGREE-Analytical GREEnness metric approach and software. Anal. Chem. 2020, 92, 10076–10082. [Google Scholar] [CrossRef]
- Alam, P.; Salem-Bekhit, M.M.; Al-Joufi, F.A.; Alqarni, M.H.; Shakeel, F. Quantitative analysis of cabozantinib in pharmaceutical dosage forms using green RP-HPTLC and green NP-HPTLC methods: A comparative evaluation. Sustain. Chem. Pharm. 2021, 21, E100413. [Google Scholar] [CrossRef]
- Foudah, A.I.; Shakeel, F.; Alqarni, M.H.; Alam, P. A rapid and sensitive stability-indicating green RP-HPTLC method for the quantitation of flibanserin compared to green NP-HPTLC method: Validation studies and greenness assessment. Microchem. J. 2021, 164, E105960. [Google Scholar] [CrossRef]
- International Conference on Harmonization (ICH). Q2 (R1): Validation of Analytical Procedures–Text and Methodology; ICH: Geneva, Switzerland, 2005. [Google Scholar]
- Alam, P.; Shakeel, F.; Ali, A.; Alqarni, M.H.; Foudah, A.I.; Aljarba, T.M.; Alkholifi, F.K.; Alshehri, S.; Ghoneim, M.M.; Ali, A. Simultaneous determination of caffeine and paracetamol in commercial formulations using greener normal-phase and reversed-phase HPTLC methods: A contrast of validation parameters. Molecules 2022, 27, 405. [Google Scholar] [CrossRef]


| Parameters | Traditional HPTLC | Greener HPTLC |
|---|---|---|
| Linearity range (ng band−1) | 50–600 | 25–1200 |
| Regression equation | y = 16.975x + 922.55 | y = 18.446x + 1213.2 |
| R2 | 0.9919 | 0.9955 |
| R | 0.9959 | 0.9977 |
| Traditional error of slope | 0.40 | 0.41 |
| Traditional error of intercept | 11.81 | 4.63 |
| 95% confidence interval of slope | 15.25–18.69 | 16.65–20.23 |
| 95% confidence interval of intercept | 871.70–973.39 | 1193.25–1233.14 |
| LOD ± SD (ng band−1) | 17.54 ± 0.24 | 8.47 ± 0.12 |
| LOQ ± SD (ng band−1) | 52.62 ± 0.72 | 25.41 ± 0.36 |
| Parameters | Traditional HPTLC | Greener HPTLC |
|---|---|---|
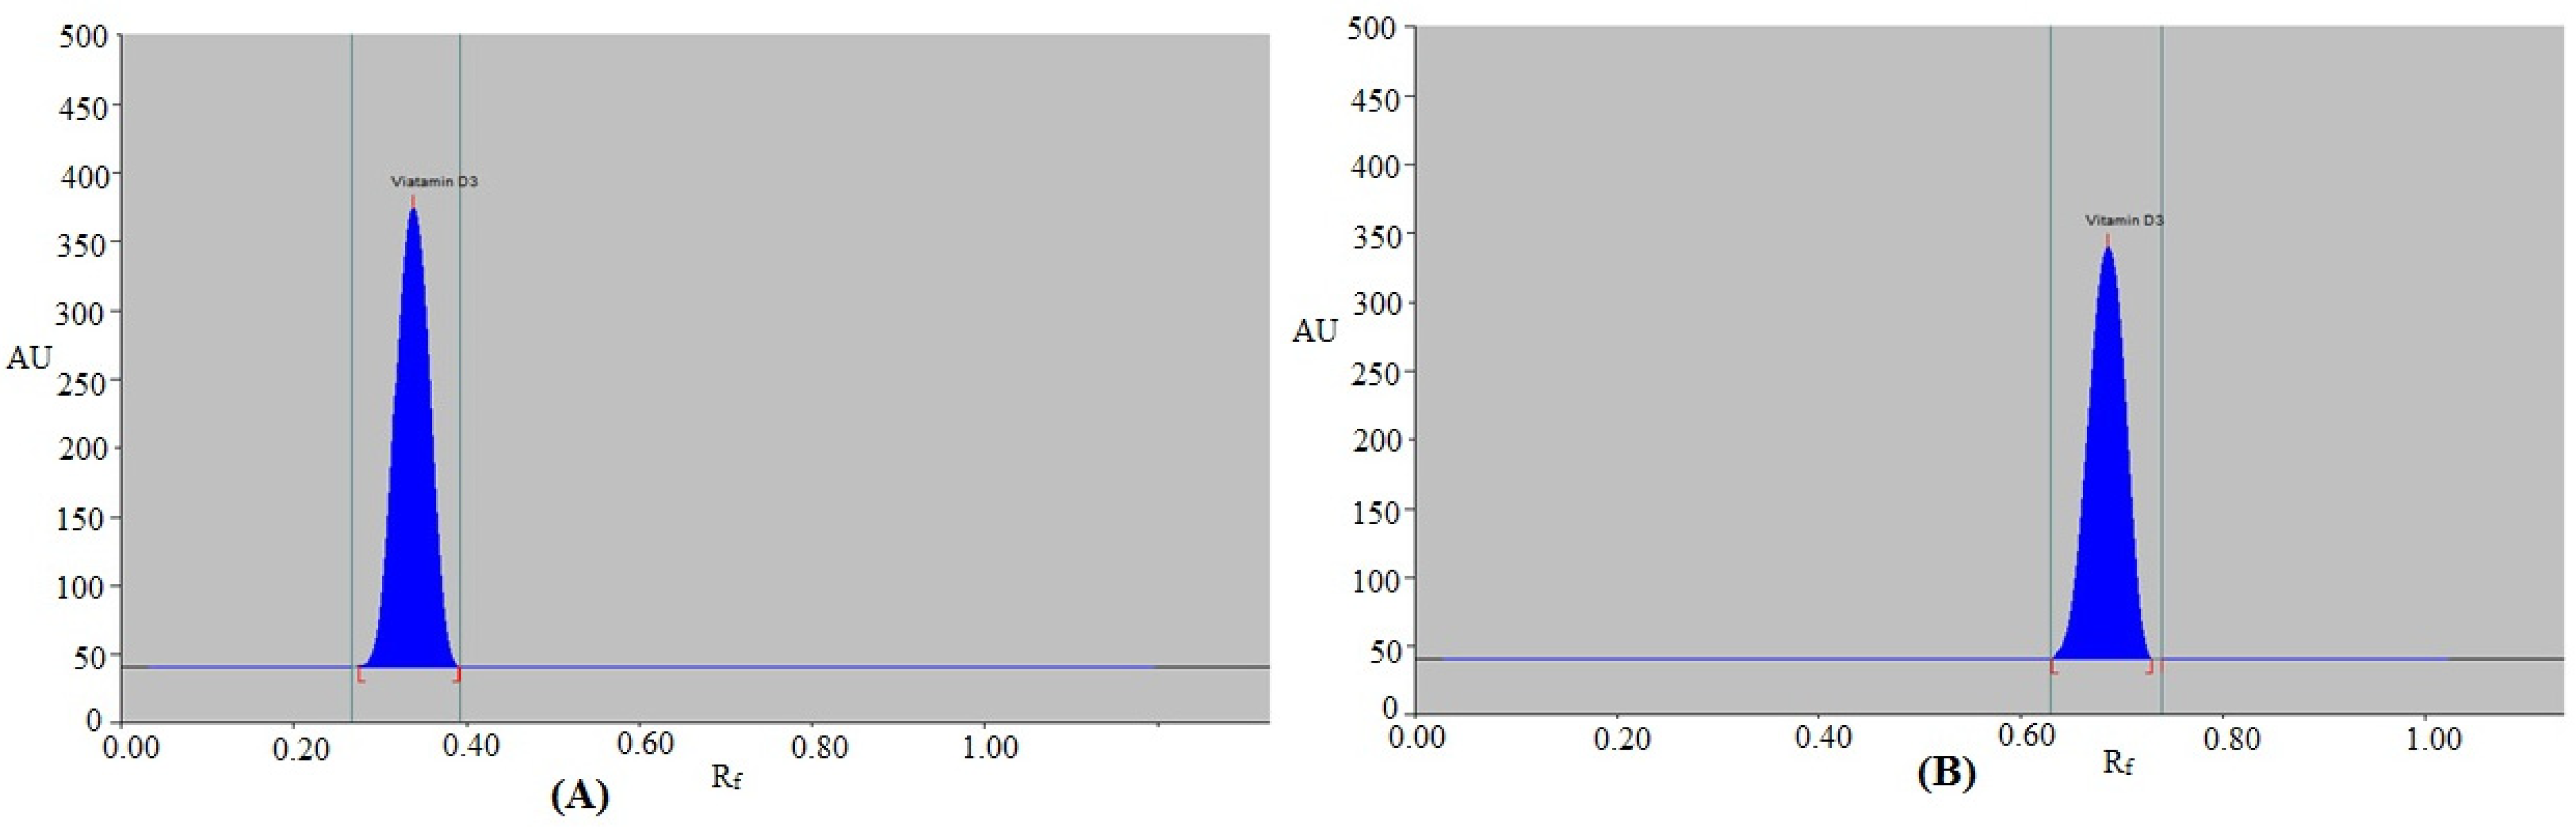
| Rf | 0.34 ± 0.01 | 0.69 ± 0.02 |
| As | 0.97 ± 0.01 | 1.04 ± 0.02 |
| N m−1 | 4875 ± 4.19 | 4798 ± 4.12 |
| Conc. (ng band−1) | Conc. Found (ng band−1) ± SD | Recovery (%) | RSD (%) |
|---|---|---|---|
| Traditional HPTLC | |||
| 100 | 103.24 ± 3.23 | 103.24 | 3.12 |
| 300 | 284.51 ± 8.65 | 94.83 | 3.04 |
| 600 | 621.14 ± 16.97 | 103.52 | 2.73 |
| Greener HPTLC | |||
| 50 | 49.91 ± 0.38 | 99.82 | 0.76 |
| 400 | 394.98 ± 2.97 | 98.74 | 0.75 |
| 1200 | 1210.23 ± 7.61 | 100.85 | 0.62 |
| Conc. (ng band−1) | Intra-Day Precision | Inter-Day Precision | ||||
|---|---|---|---|---|---|---|
| Conc. Found (ng band−1) ± SD | Standard Error | RSD (%) | Conc. Found (ng band−1) ± SD | Standard Error | RSD (%) | |
| Traditional HPTLC | ||||||
| 100 | 94.87 ± 2.97 | 1.21 | 3.13 | 93.61 ± 2.94 | 1.20 | 3.14 |
| 300 | 316.54 ± 9.12 | 3.72 | 2.88 | 318.21 ± 9.68 | 3.95 | 3.04 |
| 600 | 581.45 ± 15.67 | 6.39 | 2.69 | 618.31 ± 18.54 | 7.57 | 2.99 |
| Greener HPTLC | ||||||
| 50 | 50.23 ± 0.39 | 0.15 | 0.77 | 50.64 ± 0.44 | 0.17 | 0.86 |
| 400 | 405.61 ± 3.01 | 1.22 | 0.74 | 393.65 ± 3.10 | 1.26 | 0.78 |
| 1200 | 1194.51 ± 7.35 | 3.00 | 0.61 | 1206.32 ± 7.41 | 3.02 | 0.61 |
| Conc. (ng band−1) | Mobile Phase Mixture (Chloroform-Diethyl Ether) | Results | ||||
|---|---|---|---|---|---|---|
| Original | Used | Conc. (ng band−1) ± SD | RSD (%) | Rf | ||
| Traditional HPTLC | ||||||
| 92:8 | +2.0 | 288.71 ± 10.12 | 3.50 | 0.33 | ||
| 300 | 90:10 | 90:10 | 0.0 | 294.61 ± 10.95 | 3.71 | 0.34 |
| 88:12 | −2.0 | 308.41 ± 11.21 | 3.63 | 0.36 | ||
| Greener HPTLC | ||||||
| Mobile phase mixture (ethanol-water) | ||||||
| 72:28 | +2.0 | 389.51 ± 2.64 | 0.67 | 0.68 | ||
| 400 | 70:30 | 70:30 | 0.0 | 394.25 ± 2.75 | 0.69 | 0.69 |
| 68:32 | −2.0 | 403.67 ± 2.89 | 0.71 | 0.70 | ||
| Samples | Label Claim (µg) | Content Found (µg) ± SD | Assay (%) |
|---|---|---|---|
| Traditional HPTLC | |||
| Formulation A | 125 | 119.21 ± 2.12 | 95.36 |
| Formulation B | 125 | 116.41 ± 2.06 | 93.12 |
| Formulation C | 125 | 111.51 ± 1.97 | 89.20 |
| Formulation D | 125 | 109.56 ± 1.88 | 87.64 |
| Greener HPTLC | |||
| Formulation A | 125 | 126.41 ± 2.18 | 101.12 |
| Formulation D | 125 | 125.98 ± 2.14 | 100.78 |
| Formulation C | 125 | 124.14 ± 2.13 | 99.31 |
| Formulation D | 125 | 122.74 ± 2.15 | 98.19 |
Publisher’s Note: MDPI stays neutral with regard to jurisdictional claims in published maps and institutional affiliations. |
© 2022 by the authors. Licensee MDPI, Basel, Switzerland. This article is an open access article distributed under the terms and conditions of the Creative Commons Attribution (CC BY) license (https://creativecommons.org/licenses/by/4.0/).
Share and Cite
Alqarni, M.H.; Shakeel, F.; Foudah, A.I.; Aljarba, T.M.; Alam, A.; Alshehri, S.; Alam, P. Comparison of Validation Parameters for the Determination of Vitamin D3 in Commercial Pharmaceutical Products Using Traditional and Greener HPTLC Methods. Separations 2022, 9, 301. https://0-doi-org.brum.beds.ac.uk/10.3390/separations9100301
Alqarni MH, Shakeel F, Foudah AI, Aljarba TM, Alam A, Alshehri S, Alam P. Comparison of Validation Parameters for the Determination of Vitamin D3 in Commercial Pharmaceutical Products Using Traditional and Greener HPTLC Methods. Separations. 2022; 9(10):301. https://0-doi-org.brum.beds.ac.uk/10.3390/separations9100301
Chicago/Turabian StyleAlqarni, Mohammed H., Faiyaz Shakeel, Ahmed I. Foudah, Tariq M. Aljarba, Aftab Alam, Sultan Alshehri, and Prawez Alam. 2022. "Comparison of Validation Parameters for the Determination of Vitamin D3 in Commercial Pharmaceutical Products Using Traditional and Greener HPTLC Methods" Separations 9, no. 10: 301. https://0-doi-org.brum.beds.ac.uk/10.3390/separations9100301