Article

Evaluation of Pulsed Electric Field-Assisted Extraction on the Microstructure and Recovery of Nutrients and Bioactive Compounds from Mushroom (Agaricus bisporus)

1
Department of Preventive Medicine and Public Health, Food Science, Toxicology and Forensic Medicine, Faculty of Pharmacy, Universitat de València, Avda. Vicent Andrés Estellés s/n, Burjassot, 46100 València, Spain
2
Department of Environmental Quality and Soils, Centro de Investigaciones Sobre Desertificación-CIDE (CSIC-Universitat de Valencia-GV), 46113 Valencia, Spain
*
Authors to whom correspondence should be addressed.
Submission received: 18 September 2022 / Revised: 3 October 2022 / Accepted: 6 October 2022 / Published: 10 October 2022

Abstract

:
Pulsed electric field (PEF) is a sustainable innovative technology that allows for the recovery of nutrients and bioactive compounds from vegetable matrices. A. bisporus was chosen for its nutritional value and the effect of PEF pretreatment was evaluated using different conditions of electric field (2–3 kV/cm), specific energy (50–200 kJ/kg) and extraction time (0–6 h) to obtain the best conditions for nutrient and bioactive compound extraction. Spectrophotometric methods were used to evaluate the different compounds, along with an analysis of mineral content by inductively coupled plasma mass spectrometry (ICP-MS) and the surface was evaluated using scanning electron microscopy (SEM). In addition, the results were compared with those obtained by conventional extraction (under constant shaking without PEF pretreatment). After evaluating the extractions, the best extraction conditions were 2.5 kV/cm, 50 kJ/kg and 6 h which showed that PEF extraction increased the recovery of total phenolic compounds in 96.86%, carbohydrates in 105.28%, proteins in 11.29%, and minerals such as P, Mg, Fe and Se. These results indicate that PEF pretreatment is a promising sustainable technology to improve the extraction of compounds and minerals from mushrooms showing microporation on the surface, positioning them as a source of compounds of great nutritional interest.

1. Introduction

World mushroom production has increased by more than 30 times since 1978 (from 4.2 million kg in 1978 to 34 billion kg in 2013) currently reaching a 4.3% production increase every year [1,2], with five genera (Lentinula, Pleurotus, Auricularia, Agaricus and Flammulina) comprising 85% of the world supply. Among these five genera, Lentinula edodes, Pleurotus spp. and Agaricus bisporus mushrooms represent 22%, 19% and 15% of the supply, respectively. At European and Spanish levels, the production of A. bisporus stands out, representing 90% of the total cultivable mushrooms [3,4].
Furthermore, a worldwide mushroom consumption increase of almost five times has been observed over the last decades (from 1 kg/person in 1997 to 4.7 kg/person in 2013) [1], observing the same trend at the European and Spanish levels, with an increase in domestic consumption of approximately 15% in recent decades with A. bisporus being the most consumed mushroom [5]. Considering the growing interest in A. bisporus, the number of studies evaluating its nutritional and bioactive properties has increased considerably. Besides being used as food, mushrooms are of great interest as a source of compounds that can be used in the formulation of supplements and/or food additives [6].
Mushrooms are rich in macronutrients (proteins and polysaccharides), micronutrients (vitamins and minerals) and bioactive compounds (e.g., polyphenols), and have a low lipid content, which makes them a food of high dietary value [7]. In fact, A. bisporus and L. edodes mushrooms are colloquially known as “vegetable meat” due to their high protein content and nutritional value [8]. This is particularly interesting for specific population groups such as people following a vegetarian/vegan diet as possible alternatives to meat products. Regarding polysaccharides, A. bisporus has a high content of β-glucans, which have been associated with immune-regulating, hypoglycemic and anticoagulant properties [9]. Moreover, mushrooms have a high content of natural antioxidants with the ability to reduce the damage caused by oxidative stress, which is one of the main causes of cellular aging [10]. It is also remarkable for its high micronutrient content, being a good source of potassium, phosphorus, magnesium and selenium, as well as vitamin A, B (thiamine, niacin and folic acid), C and D vitamins [11]. This high micronutrient content combined with bioactive compounds shows biological properties (antioxidant, antimicrobial and antitumor) [12,13].
Considering the nutritional value of mushrooms, there is a growing interest in the extraction of these compounds. Traditionally, conventional methods have been used for this purpose, which is not highly ecological and efficient since they require high temperatures, long extraction times and organic solvents, being in many cases toxic. Therefore, in recent years, pulsed electric field-assisted extraction (PEF) technology has been used for the recovery of compounds from plant matrices [14,15,16]. The use of PEF allows for the sustainable and economical obtaining of compounds by using water as a solvent, thus reducing the use of organic solvents that are much more polluting. In addition, it is a technology that reduces the temperature and time required for the extraction of the different compounds, thus reducing the degradation of thermolabile components, making it of special interest at the industrial level when seeking greater process efficiency [9].
This technology is based on the application of electrical pulses between two electrodes inside the treatment chamber, allowing the formation of micropores in eukaryotic cell membranes and increasing cell permeability, which allows for the selective extraction of intracellular compounds. The efficiency of the PEF extraction process to permeabilize the membrane changes depending on the strength of the electric field applied, the specific energy, treatment time, temperature and the properties of the material used, such as pH, conductivity and the characteristics of the matrix cells to be extracted [17].
The electroporation produced by this extraction method can be observed on the surface of the sample using techniques such as scanning electron microscopy (SEM) [18]. In this way, it is possible to compare the conventional extraction or untreated sample versus alternative methods in relation to the impact on the surface of the food.
Therefore, the present study aims to evaluate the recovery of high added-value compounds from Agaricus bisporus using an optimization strategy based on response surface methodology (RSM) and to study the influence of PEF on the mushroom surface using scanning electron microscopy (SEM).

2. Materials and Methods

2.1. Chemicals and Reagents

Sodium carbonate (Na2CO3) was purchased from VWR (Saint-Prix, France). AAPH (2,2′-Azobis (2-methylpropanimidamide) dihydrochloride), ABTS (2,2′-Azinobis (3-ethylbenzothiazoline-6-sulfonic acid)), Trolox (6-hydroxy-2,5,7,8-tetramethylchroman-2-carboxylic acid), potassium persulfate (K2S2O8), Folin–Ciocalteu reagent, gallic acid (C7H6O5), fluorescein (C20H12O5), mineral standards (Ca, P, Mg, Fe, Zn and Se) and internal standards of Sc and Ge were purchased from Sigma–Aldrich (Steinheim, Baden-Württemberg, Germany). Disodium phosphate (Na2HPO4) and potassium dihydrogen phosphate (KH2PO4) were purchased from VWR International Eurolab S.L. (Barcelona, Spain).
Sulfuric acid (H2SO4) and phenol (C6H6O) were purchased from Thermo Fisher Scientific (Waltham, MA, USA). Ethanol (99%) was purchased from Baker (Deventer, The Netherlands). Distilled water was obtained from Milli-Q SP Reagent Water System (Millipore Corporation, Bedford, MA, USA).

2.2. Sample Preparation

White button mushroom (A. bisporus) samples were obtained from a local supermarket (Valencia, Spain) and used the day after purchase. All mushroom samples were stored in plastic containers in a refrigerator at 4 °C for 24 h. Subsequently, they were cut into 3 × 5 × 3 mm slices manually with a kitchen knife to obtain 20 g of fresh sample for each of the replicates in the PEF and conventional extraction and for the lyophilization necessary to compare the samples by SEM [8]. The initial A. bisporus moisture content (g water/100 g sample) was 0.88 ± 0.01.

2.3. Extraction Conditions

A PEF-Cellcrack III (German Institute of Food Technologies (DIL)) equipment (ELEA, Quakenbrück, Germany) located at the Faculty of Pharmacy of the University of Valencia (València, Spain) was used for the extraction. Specifically, for each extraction, 20 g of fresh sample previously cut into slices were taken and placed in contact with 200 mL of water (100 mL distilled water and 100 mL tap water) until the conductivity was approximately 700–800 µS/cm, using an extraction chamber with a capacity of 900 mL and a distance between electrodes of 10 cm. In addition, pulse duration was 100 ms using a 2.00 Hz frequency. The samples were pre-treated according to the optimal conditions obtained after performing RSM with 17 samples (Table 1); electric field strength values varied between 2–3 kV/cm, specific energy values between 50–200 kJ/kg and total extraction time ranged between 0–6 h.
The temperature and conductivity of each sample was measured before and after PEF treatment with the ProfiLine Cond 3310 conductometer (WTW, Xylem Analytics, Weilheim in Oberbayern, Germany). According to previous studies, the minimum electric field to produce cellular changes is 1 kV/cm, because of that the application of 2–3 kV/cm is enough to produce electroporation [19,20].
Extracts with extraction time 0 h were filtered and centrifuged (4000 rpm, 15 min) to remove solid residues and stored frozen at −20 °C until their use in chemical analysis; those extracts with time higher than 0 h were kept after PEF pre-treatment in agitation using a magnetic stirrer for a certain period depending on the number of samples. They were then filtered and centrifuged under the same conditions as the samples at time 0 h. Conventional extracts were subsequently obtained and stored under the same conditions without the PEF pre-treatment.
Response surface methodology (RSM) was used as a method to optimize the extraction conditions. This methodology includes a variety of techniques used to study the relationship between factors or independent variables with one or more responses or dependent variables, to optimize them [21]. In this case, the study was carried out to determine how the variation of factors related to the PEF technology (electric field strength, specific energy, and extraction time) affects the concentration of different mushroom compounds in the extracts obtained by PEF (proteins, carbohydrates, and antioxidant compounds). A central composite design with 17 experiments and 3 central points (3 samples with the same PEF extraction conditions) was applied. The inclusion of central points allows for estimating the experimental error and avoiding the generation of a model that leads to incorrect conclusions.
After applying SRM, 20 g of fresh A. bisporus sample was treated under optimal PEF extraction conditions to validate the result. The results were compared with a control obtained under the same conditions except for PEF pre-treatment.

2.4. Chemical Analyses

2.4.1. Total Protein Content

The bicinchoninic acid (BCA) assay was used to determine the protein content of the extracts. The working solution was prepared according to the Pierce BCA kit Protein Assay (Thermo Fisher Scientific, Waltham, MA, USA). Bovine serum albumin (0–2000 mg/L) was used as standard. To prepare the analysis, 10 µL of sample/standard was added to the microplate combined with 200 µL of the working solution of BCA, subsequently mixed and incubated at 37 °C for 30 min. Finally, the absorbance of the samples was measured at 562 nm. The results are expressed in mg of bovine serum albumin/g dry matter (mg BSA/g DM).

2.4.2. Total Antioxidant Capacity

ORAC determination was performed according to Cao et al. [22]. This assay measures the oxidative degradation of a fluorescent molecule, fluorescein, after the addition of AAPH, measuring the antioxidant capacity of the sample compared to the Trolox standard. Phosphate buffer pH 7.0–7.4 was used for the blank and 1 mM Trolox as the standard. Fluorescein (50 µL) was added to the microplate along with 50 µL of Trolox/blank/sample and incubated for 10 min at 37 °C. Subsequently, 25 µL of AAPH was added and wavelengths 480 nm excitation and of 520 nm emission were set using Wallac 1420 VICTOR 2 plate reader (Perkin–Elmer, Jügesheim, Germany) and the measurements were collected every minute for 60 min. Finally, the blank was subtracted from the results obtained; one ORAC unit indicates that the antioxidant capacity of the sample is equivalent to 1 µM Trolox. The results were expressed in µmol Trolox equivalents/g dry matter (µmol TE/g DM).
The TEAC assay is used to observe the capacity of the extracts to neutralize the ABTS+ radical. To perform the assay, 25 mL of ABTS (7 mM) and 440 µL K2S2O8 (140 mM) were mixed, the solution was incubated in the dark at 20 °C for 16 h to obtain the working solution with the ABTS+ radical. Subsequently, this working solution was mixed with 96% ethanol to reach an absorbance at 734 nm of 0.70 ± 0.02. For the measurement, 2 mL of ethanol solution was taken and 100 µL of the sample was added, the initial and final absorbance was recorded at 734 nm. A Trolox standard curve was used as a reference at different concentrations (0–250 µM). The results were expressed in µmol Trolox equivalents/g dry matter (µmol TE/g DM).

2.4.3. Total Phenolic Compounds (TPC)

The Folin–Ciocalteu method was used for the total phenolic compounds (TPC) determination, according to the method proposed by Singleton et al. [23], which is based on the capacity of phenols to react against oxidizing compounds. Thus, the Folin–Ciocalteu reagent, which contains molybdate and sodium tungstate, can react with the phenolic compounds found in the sample forming phosphomolybdic and phosphotungstic complexes. As these compounds are found in a basic medium, they are reduced forming a blue-colored compound that is proportional to the phenolic concentration. Folin–Ciocalteu reagent at 50% v/v was used together with Na2CO3 solution and gallic acid standards. In each tube, 100 µL of standard/sample, 3 mL of Na2CO3 and finally 100 µL of Folin–Ciocalteu were added. The samples were incubated for 60 min in the dark and measured at 750 nm using a Perkin–Elmer UV/V is Lambda 2 spectrophotometer (Perkin–Elmer, Jügesheim, Germany). Results were expressed as mg gallic acid equivalents/g dry matter (mg GAE/g DM).

2.4.4. Total Carbohydrate Content

Total carbohydrate content was determined by the phenol-sulfuric method described by Dubois et al. [24], which allows knowing the concentration of total sugars by acid catalysis of these by adding sulfuric acid, obtaining furfural and hydroxymethyl-furfural that condensed with phenols give rise to yellow-orange products proportional to the total concentration of carbohydrates. For their determination, D-glucose solutions (10–100 mg/L) was used as standard. One milliliter of sample was taken with 1/10 dilution or the D-glucose standard solutions along with 0.5 mL of 5% phenol solution and 2.5 mL of sulfuric acid. After mixing the reagents, they were incubated for 30 min at 25 °C. Finally, absorbance was measured at a wavelength of 490 nm. The results were expressed in mg glucose/g dry matter (mg glu/g DM).

2.4.5. Mineral Content

To determine the Ca, Mg, Fe, Zn, P and Se content of liquid extracts from PEF and conventional extraction, 1 mL of each extract was taken and digested with 1 mL of 69% nitric acid (HNO3) along with 250 µL of hydrogen peroxide (H2O2) in a 180 °C microwave oven. Subsequently, it was brought to a volume of 5 mL with ultrapure water (UW), 100 µL were taken and brought again to a final volume of 10 mL with UW.
On the other hand, to determine the content of the above-mentioned minerals in fresh samples of A. bisporus, 10 mg were weighed and digested with 1 mL of 69% HNO3 followed by 250 µL of H2O2 in a microwave oven at 180 °C. Afterward, it was brought to 10 mL with UW to take an aliquot of 100 µL and add 9 mL of UW. The multi-elemental determination was performed by inductively coupled plasma mass spectrometry (ICP-MS) using a 20 µg/g Sc and Ge solution as an internal standard. The results are expressed in mg/100 g for Ca, Mg, Fe, Zn and P, and µg/100 g for Se.

2.5. Scanning Electron Microscopy (SEM)

To observe the surface of A. bisporus, small fragments belonging to the pileus were used both from the sample subjected only to freeze-drying (control sample) and from the samples subjected to freeze-drying and PEF/conventional treatment. For sample preparation, a carbon film was taken on which the sample is placed, and the fragments were treated for 2 min to produce metallization of the sample with a thin layer of Au and Pd. Subsequently, the sample was placed under the microscope and the difference between the control and the treated sample was observed on the surface, searching for the electroporation produced by the PEF pre-treatment in A. bisporus.

2.6. Statistical Analysis

The data were analyzed using an analysis of variance (ANOVA), where the parameters of the PEF pre-treatment (electric field and specific energy) with extraction time were the factors and the values of TEAC, ORAC, TPC, carbohydrates and total proteins were the variables. A p-value < 0.05 was considered a significant difference. All statistical analyses concerning MSR were performed with Statgraphics Centurion XVII software (Statpoint Technologies, Inc., Warrenton, VA, USA), while ANOVA analysis of data obtained from analysis of extracts under optimal PEF extraction conditions was performed with GraphPad Prism 8 software (GraphPad Software, San Diego, CA, USA). Each analysis was performed in triplicate assuming a significance level of 5%. Standard deviations are represented in the figures using error bars.

3. Results

3.1. Effect of Extraction Time, Electric Field Strength and Specific Energy on the Selective Extraction of Nutrients and Bioactive Compounds

PEF-assisted water extraction of A. bisporus samples was optimized according to the response surface methodology (RSM) with three central points to maximize the values obtained for the following factors: TPC (mg GAE/g DM), TEAC (µmol TE/g DM), ORAC (µmol TE/g DM), total carbohydrate content (mg glu/g DM) and total protein content (mg BSA/g DM).

3.1.1. Macronutrients

The range of values for protein and total carbohydrate was from 7.79 ± 0.83 to 140.72 ± 15.14 mg BSA/g DM and 0.86 ± 0.07 to 39.51 ± 0.59 mg glu/g DM, respectively.
Figure 1 shows the influence of electric field strength, specific energy and extraction time on carbohydrate recovery. It can be observed that the extraction time had a significant effect (p < 0.05) on the recovery of carbohydrate with a linear rise as time increased. Moreover, an increase in carbohydrate content was observed as the electric field and specific energy increased (p < 0.05), reaching an optimum point at 2.5 kV/cm and 125 kJ/kg. Once these values were reached, a decrease in the carbohydrate values was obtained as both factors continued to increase. According to the obtained results, the maximum carbohydrate extraction (39.51 ± 0.59 mg glu/g DM) in A. bisporus was observed after applying 2.5 kV/cm, 125 kJ/kg and 6 h of extraction.
The protein content was also influenced by the factors mentioned above (Figure 2). Similarly to carbohydrates, time had a significant impact (p < 0.05) on protein extraction, obtaining a higher recovery of protein with the elapse of treatment time. However, an opposite trend was observed for specific energy, finding a decrease in protein content as the specific energy increased. On the other hand, an increase in protein recovery was observed after increasing the electric field (p > 0.05) from 2 to 2.5 kV/cm, reaching a plateau after these conditions, then decreasing the recovery.
After evaluating the optimal extraction conditions, the maximum protein recovery (140.72 ± 15.14 mg BSA/g DM) was obtained after applying a PEF pre-treatment of 2 kV/cm, 50 kJ/kg and 6 h of extraction.
To evaluate the influence of PEF pre-treatment to reduce the time required for carbohydrates and protein extraction, other authors compared PEF-assisted extraction with conventional methods. In this sense, these authors indicated possible limitations when extracting carbohydrates in water must be considered since, although carbohydrates are mostly polar and highly soluble, mushrooms present certain insoluble polysaccharides that would need longer extraction times, higher temperatures or alkaline solvents [25]. In addition, chitinous compounds and high molecular weight polysaccharides, which are more viscous, also require longer extraction times or higher temperatures [26,27], which would promote the degradation of other compounds and protein denaturation. Finally, PEF technology could generate hydroxyl radicals that degrade polysaccharides such as chitosan. Moreover, Dellarosa et al. reported that the variation in water holding capacity of the mushroom observed could be explained by a lower molecular weight due to degradation of the chitosan after PEF pre-treatment [28].

3.1.2. Total Antioxidant Capacity and Total Phenolic Compounds

The TPC, TEAC and ORAC values range from 1.49 ± 0.16 to 25.20 ± 1.81 mg GAE/g DM, 9.22 ± 0.45 to 65.83 ± 1.14 µmol TE/g DM and 14.53 ± 0.58 to 145.68 ± 17.80 µmol TE/g DM, respectively.
The ANOVA analysis performed showed a significant effect of extraction time on TPC recovery, as well as TEAC and ORAC values, this parameter also having the greatest influence (p < 0.05) on the extraction of antioxidant compounds.
The factor having the strongest influence on the recovery was the extraction time, after performing the ANOVA analysis, observing significant (p < 0.05) changes in ORAC and TEAC values. However, the specific energy of 50 kJ/kg is the value coincident as optimal for the results of the three antioxidant capacity analyses, while the time presented a slight variability according to the specific analyses.
Figure 3 shows the values resulting from the three tests, obtaining the maximum recovery by setting a value of 50 kJ/kg, which is the lowest value of the chosen range. Regarding time, a similar behavior to that of carbohydrates was found for ORAC values, where the maximum obtained corresponds to 6 h; however, for TPC and TEAC values, the maximum values were not obtained after 6 h, but presented a maximum recovery at 5 h, reaching a plateau after this time and then decreasing.
The electric field strength was the lowest significant factor in all studies; however, it was set at 2.5 kV/cm, obtaining the highest values for TEAC, ORAC, carbohydrates and total proteins. However, the behavior in the extraction of polyphenols was different, presenting its maximum at 3 kV/cm. This behavior agrees with that observed by several authors. For instance, in the study conducted by Darra et al. [29] on grape pomace, it was observed that increasing the electric field from 400 to 800 V/cm improved the extraction of polyphenols, although this fact was also observed on A. bisporus, where an intense increase in recovery was observed when increasing the electric field strength [30]; however, regarding the antioxidant components evaluated by TEAC and ORAC, the behavior was similar to that observed for macronutrients, where an increase in the electric field strength promotes their degradation.
In addition, a decrease in the compounds was observed when increasing the specific energy supplied (related to the number of pulses), which could indicate a degradation caused by the conditions as they are very sensitive compounds, such as vitamin C measured through the TEAC assay, where the slight increase in temperature caused due to the increase in the number of pulses would be responsible for this loss, as it has been observed in several studies [31,32].
Therefore, the maximum recovery of antioxidant compounds would be obtained by applying 50 kJ/kg of specific energy maintaining a total extraction time of 5.6 h with a theoretical value of 67.94 µmol TE/g DM for TEAC, 161.41 µmol TE/g DM for ORAC and 22.16 mg GAE/g DM for TPC.

3.1.3. Optimization

The simultaneous optimization of all the responses was carried out by the desirability function, in such a way that the extraction of all the compounds was maximized. The optimum conditions obtained were 50 kJ/kg for specific energy, 2.5 kV/cm for electric field strength and 6 h of total extraction time. As can be seen in Figure 4, the desirability obtained at the optimum conditions was 0.88. This result is due to the variability in the behavior of each of the compounds in relation to the factors; for example, a decrease in the extraction of antioxidant compounds measured by TEAC and TPC was found when an extraction time of 6 h was set, while the content of carbohydrates, proteins and antioxidant compounds measured by ORAC was maximized, presenting the opposite behavior.
Therefore, it would be necessary to further investigate whether a longer extraction time could increase the recovery of these macronutrients and antioxidant compounds. However, that prolonged extraction could end up degrading certain compounds such as proteins, where a curvature in the behavior with respect to time is observed (Figure 2). On the other hand, it would not be desirable to increase the specific energy and the electric field strength since this would result in a loss of the compounds studied.
Finally, it should be considered that the knowledge of PEF technology is more extensive for pasteurization and food preservation, but it is limited in the effect on the recovery of bioactive compounds, whose specific mechanism is still partially unknown [31].

3.2. Recovery of Nutrients and Bioactive Compounds in PEF-Assisted Extraction at Optimal Conditions

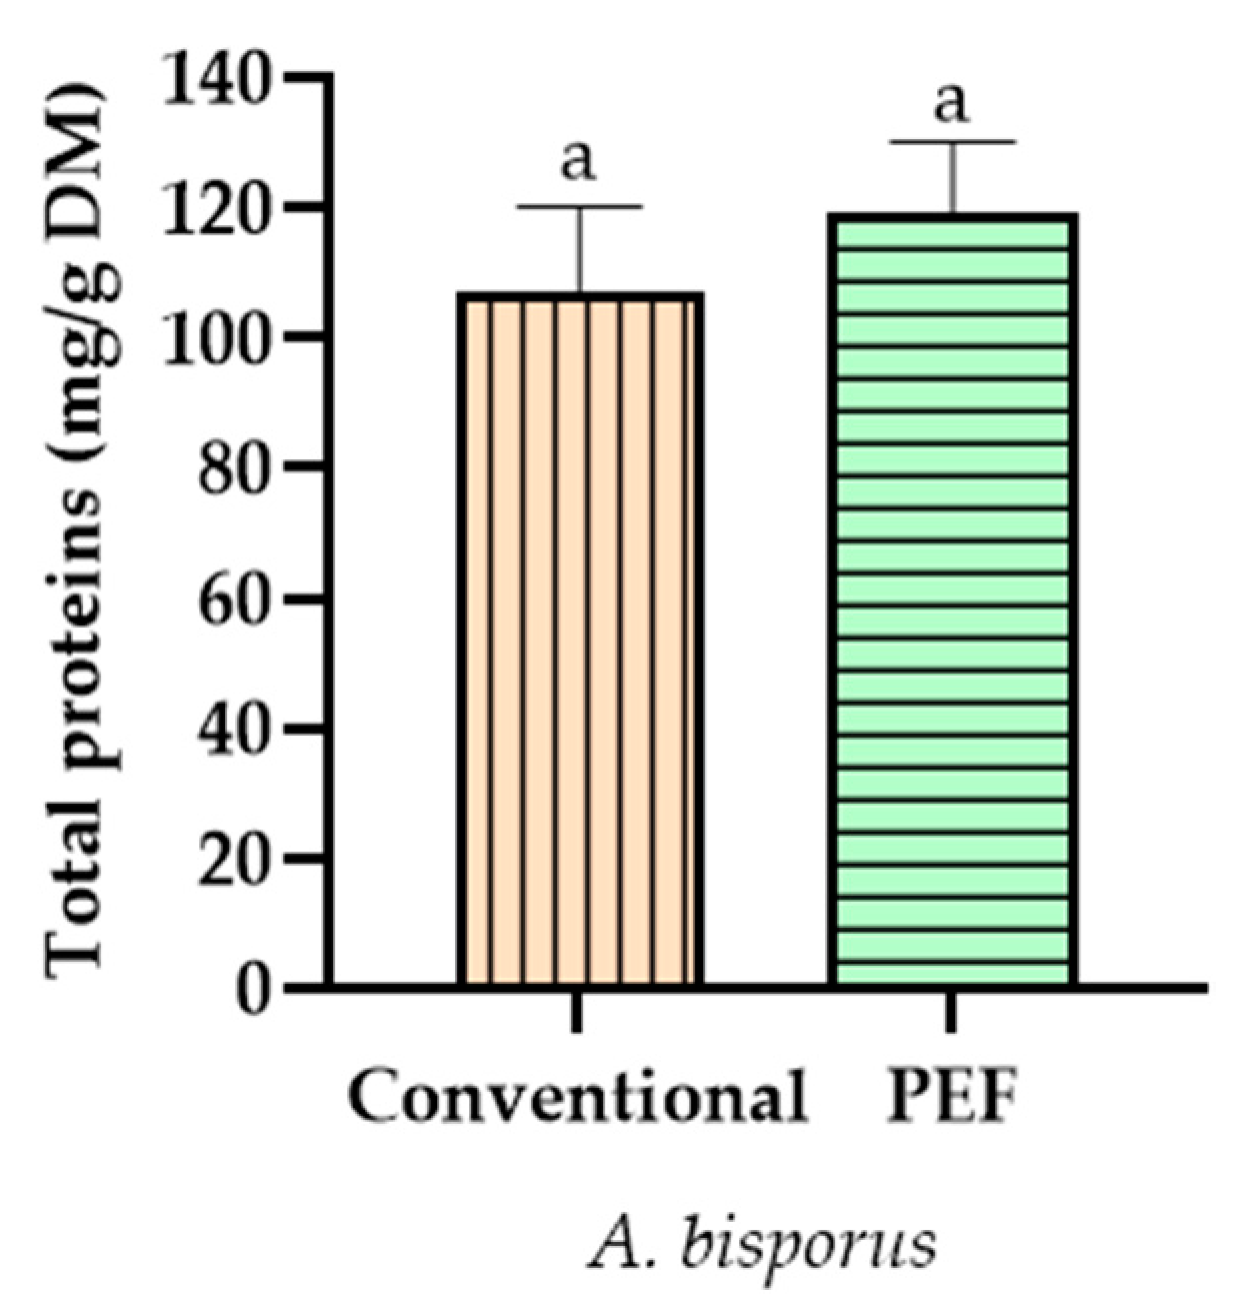
3.2.1. Macronutrient Content

The carbohydrate content obtained, shown in Figure 5, ranged from 8.14 ± 0.74 to 16.71 ± 0.72 mg glu/g DM, belonging to conventional and PEF-assisted extraction using the optimal conditions previously described in the preceding sections, respectively. Therefore, the application of PEF technology on A. bisporus samples increases carbohydrate recovery by 105.28% compared to conventional extraction, showing statistical difference (p < 0.05) between methodologies.
Increased carbohydrate recovery was observed by other authors, who obtained higher polysaccharide and protein content after exposing A. bisporus to PEF pretreatment compared to conventional extraction at 95 °C for 1 h [30]. Parniakov et al. [9] compared the efficiency and stability of extraction from A. bisporus with different methodologies, which showed that the combination of PEF methodology along with the pressure application exhibited the highest polysaccharide content compared to conventional aqueous extraction at high temperatures.
Likewise, the protein recovery is noteworthy, with 107.02 ± 10.13 mg BSA/g DM for conventional extraction and 119.11 ± 11.05 mg BSA/g DM for PEF pretreatment shown in Figure 6, observing an increase of 11.29% compared to conventional extraction. Therefore, the application of PEF technology for the recovery of the macronutrients studied is a promising extraction method, enabling an increase in macronutrient recovery without the application of high temperature.
Both protein and carbohydrate recovery have been evaluated in several studies after the application of PEF pretreatment compared to conventional aqueous extraction, which led to a loss of protein quality due to coagulation when high temperatures were applied, and other methods such as pressure application showed similar results [9,30]. In addition, the application of PEF is especially interesting in protein extraction since mushrooms, such as A. bisporus, are considered good sources of protein, not only in terms of protein quantity but also in terms of amino acid composition compared to animal protein. Kakon et al. [33] reported that mushroom proteins contain nine essential amino acids, making A. bisporus a food suitable as a substitute for meat protein. However, the variation observed in the protein content when the growing substrate of A. bisporus changes should be noted, with ranges of protein content indicated from 11.01% by Sadiq et al. [34] to 29.14% by Ahlawat et al. [35].

3.2.2. Total Antioxidant Capacity and Total Phenolic Compounds

The global recovery of antioxidant compounds is shown in Figure 7, with values of 14.63 ± 2.76 and 28.80 ± 2.86 mg GAE/g DM for TPC, 53.15 ± 1.2 and 57.37 ± 5.40 µmol TE/g DM for TEAC and 133.48 ± 7.61 and 202.20 ± 21.19 µmol TE/g DM for ORAC comparing conventional and PEF-assisted extraction, respectively. Similarly to the protein and carbohydrate content, PEF-assisted extraction showed a higher recovery of these compounds measured through three assays, increasing all of them and doubling the value obtained for TPC with the application of PEF technology. Furthermore, significant differences (p > 0.05) were observed for TPC and ORAC values concerning the extraction methodology, with a 96.86% and 51.48% increase, respectively.
In general, the results obtained were in agreement with those indicated by other authors, showing that the application of moderate PEF intensity increases the production of bioactive compounds with antioxidant capacity in A. bisporus, establishing a high positive correlation between antioxidant capacity and phenolic compounds [30,36]. However, the great variability of specific results should be considered due to the affectation of the food by cultivation and storage conditions, and those related to PEF technology, since although the overall result was an increase in the recovery of these compounds, it depends on the conditions applied and the sample processing [31].
According to the values obtained, the antioxidant capacity of A. bisporus mainly attributed to its phenolic compounds has shown anti-inflammatory capacity reducing bleeding and damage to the intestinal mucosa of mice with colitis, also attenuating myeloperoxidase activity and overproduction of TNF-α as a consequence of the disease when this mushroom is introduced in their diet [37].

3.2.3. Mineral Content

The mineral content per 100 g and the percentage of the dietary reference intake (DRI) established by the Spanish Agency for Food Safety and Nutrition (AESAN) [38] covered by a portion are shown in Table 2 after the analysis of the fresh samples. It was observed that A. bisporus is a source of P and Se, covering 31.32% and 50.07% of the INR, respectively, especially the Se content with 24.30 µg/100 g, covering half of the INR in a portion. In contrast to the remaining minerals, the Ca content of A. bisporus does not exceed 1% of the DRI, so it is not considered a source of this mineral, showing contents of 3.02 mg/100 g.
These results agreed with the results obtained by other authors, where it was observed that the major minerals in mushrooms are K and P with contents higher than or comparable to those of most vegetables [8,39]. The low Ca content of mushrooms has also been reported by several authors [11,40], especially in A. bisporus and P. ostreatus along with Fe, so the results are consistent with these observations. However, the great variability in the mineral content of mushrooms attributable to different soil conditions, cultivation and location produced mixed results such as those observed in the study published by Mattila et al. [11].
The mineral contents obtained suggest that A. bisporus could contribute to the decrease in population deficiencies shown in the nutritional assessment study published by AESAN based on data from the National Survey of Dietary Intake (ENIDE) [41]. Both P and Se are obtained mainly from animal sources (72% and 67%, respectively), so the introduction of A. bisporus in the vegan population would increase the intake of these minerals, avoiding population deficiencies. On the other hand, although the contribution is lower than in the minerals indicated above, the consumption of A. bisporus can contribute to the daily intake of Fe, especially in fertile women and children, and of Zn, whose main source is fish, with a worldwide population deficiency of 30%.
Table 2. Mineral content (mg or µg/100 g) of A. bisporus and dietary reference intake percentage of each mineral covering a portion (150 g) [38,42].
A. bisporus
Ca (mg)Fe (mg)Zn (mg)Se (µg)P (mg)Mg (mg)
In 100 g3.020.860.9924.30146.1014.10
% DRI 10.4814.1813.5052.0731.326.04
1 Dietary reference intake.
In addition, the mineral recovery percentages analyzed with each extraction methodology compared to the fresh solid matrix differed according to the mineral, giving mixed results. As shown in Figure 8, the recovery of Mg, P, Se and Fe was higher in PEF extraction showing significant differences (p < 0.05), with a PEF recovery of 20.64% to 61.73% belonging to Fe and Se, respectively. The PEF recovery of the previously mentioned minerals does not decrease below 20% while the conventional extraction does not exceed 24.69%, obtained for Se. On the other hand, conventional extraction has shown a higher recovery in Ca recovery with 2.25% compared to 1.30% obtained by PEF showing significant differences (p < 0.05), however, low recoveries were shown for both extractions.
Therefore, PEF technology is useful in the extraction of P, Mg, Fe and Se compared to conventional technology; in addition, the recovery of Se and P, abundant minerals in the fresh matrix, was noteworthy. Nevertheless, it is not appropriate for Ca recovery due to the low recovered value added to the limited quantity of this mineral in the fresh matrix. Finally, although A. bisporus contains a considerable amount of Zn, both methodologies were not effective for its recovery, showing non-significant differences between them (p > 0.05) as can be seen in Figure 8.

3.2.4. Evaluation of the Extraction Methodology Effect on the Mushroom Surface by SEM

Figure 9 shows the effects of a conventional extraction (20 ± 4 °C, 6 h) and a PEF pre-treated extraction (2.5 kV/cm, 50 kJ/kg, 6 h) on the microstructure of freeze-dried samples of A. bisporus. The results were compared with those obtained for an untreated sample (freeze-dried sample of fresh mushroom). Clear differences in microstructure were obtained when comparing the pretreated sample with the control sample. In this regard, the structure of the untreated samples difficult the diffusion of the compounds to the exterior by presenting fibers intertwined with each other, as can be observed in the control sample of A. bisporus.
On the other hand, in the samples pretreated with PEF, the presence of pores or cavities on the surface was observed, leading to a structural change that allows an improvement in the diffusion of the compounds and selective extraction of these at the cell level, since the disintegration of the cell membrane is caused [43], compared to a more disorganized structure resulting from conventional extraction. This observation was consistent with the results obtained in the study by Li et al. [44], in which the same results were presented by treating L. edodes samples using PEF and observing the effect of microporation on their surface. In addition, comparing the PEF methodology with other extraction techniques such as ultrasound application, and despite the fact that in the application of ultrasound the energy supplied to the sample is higher, it was observed that PEF induces a greater degree of cell disruption that is reflected in changes in the microstructure caused by a rupture of the cell membrane [28].
The presence of micropores on the surface of samples pretreated with PEF was associated with the increased recovery of macronutrients and antioxidant compounds in the extracts pretreated with PEF. In fact, electroporation-assisted processes were proposed as a method to improve the extraction of beneficial compounds from plant tissues, including mushrooms [9,45], which is an interesting process for the extraction of thermosensitive components. Therefore, there is a correlation between the content of nutrients and compounds with antioxidant capacity obtained in PEF and conventional extracts with the microstructure of the solid after treatment.

4. Conclusions

From the results obtained, it is possible to conclude that the optimal conditions for the extraction of nutrients and bioactive antioxidant compounds from A. bisporus, using response surface methodology based on all the variables analyzed, were an electric field strength of 2.5 kV/cm, 50 kJ/kg of specific energy and 6 h of time. Moreover, the influence of the studied parameters (electric field strength, specific energy, and extraction time) differed according to the target compound analyzed, showing different behaviors in relation to the parameters depending on the compound. Likewise, it was observed that an increase in the extraction time increased the recovery of carbohydrates, proteins, and antioxidant compounds, the last mentioned with a maximum of 5 h in general, while the increase in the electric field strength showed a positive effect on the recovery of all compounds with a maximum at 2.5 kV/cm, a field from which a decrease in the recovery was observed, except for total phenolic compounds. The specific energy showed mixed results, the increase in the energy supplied caused a decrease in the recovery of proteins and antioxidant compounds, and an increase in the recovery of carbohydrates with a maximum of 150 kJ/kg. On the other hand, SEM results showed that PEF pretreatment changes the microstructure of the mushrooms causing surface electroporation which allows an increase in the recovery of compounds observable in the extracts. The application of PEF technology under optimal conditions to mushrooms increases the extraction of carbohydrates, proteins, antioxidant compounds and minerals such as P, Mg, Fe and Se compared to conventional methodology. In addition, A. bisporus is an optimal matrix for the high content of bioactive compounds and micronutrients, as a source of P and Se, and containing considerable amounts of Fe, Zn and Mg, making them foods of great interest in the diet, especially for people with a vegetarian/vegan diet, as they largely supply nutrients abundant in animal products.

Author Contributions

Conceptualization, F.J.B.; methodology, M.C.-G.; formal analysis, M.C.-G., and J.M.C.; software, M.C.-G. and J.M.C.; resources, E.C., E.F., H.B. and F.J.B.; writing—original draft preparation, M.C.-G., J.M.C. and F.J.B.; writing—review and editing, J.M.C., E.C., E.F., H.B. and F.J.B.; supervision, J.M.C., E.C., E.F., H.B. and F.J.B.; funding acquisition, E.C. and F.J.B. All authors have read and agreed to the published version of the manuscript.

Funding

This research was supported by the Spanish Ministry of Science and Innovation project (PID2021-123628OB-C42—Eco-innovative extraction of nutrients and bioactive compounds from agri-food co-products for the design of healthier foods. Study of biological activities) funded by MCIN/AEI/10.13039/501100011033/. Moreover, authors would like to acknowledge the University of Valencia through the project OTR2021-21736INVES, supported by the University of Vigo.

Institutional Review Board Statement

Not applicable.

Informed Consent Statement

Not applicable.

Data Availability Statement

Not applicable.

Acknowledgments

Juan Manuel Castagnini is the beneficiary of the grant (ZA21-028) for the requalification of the Spanish university system from the Ministry of Universities of the Government of Spain, modality “Maria Zambrano”, financed by the European Union, NextGeneration EU through the project “Extraction of bioactive compounds from food matrices using innovative and sustainable technologies (EXTRABIO)”. Moreover, Mara Calleja Gómez would like to acknowledge the Ministry of Education for providing her a collaboration grant. Francisco J. Barba is member of the CYTED network “P320RT0186—Aprovechamiento sostenible de recursos biomásicos vegetales iberoamericanos en cosmética (BIOLATES)”. The authors would also like to acknowledge Generalitat Valenciana for financial support (IDIFEDER/2018/046—Procesos innovadores de extracción y conservación: pulsos eléctricos y fluidos supercríticos) through the European Union ERDF funds (European Regional Development Fund).

Conflicts of Interest

The authors declare no conflict of interest.

References

  1. Royse, D.J.; Baars, J.; Tan, Q. Current overview of mushroom production in the world. In Edible and Medicinal Mushrooms; John Wiley & Sons, Ltd.: Chichester, UK, 2017; pp. 5–13. [Google Scholar] [CrossRef]
  2. Vaishnavi, M.; Durga Prasad, M.; Sharma, A.; Tiwari, J.; Singh, S.; Sharma, S. Production of edible mushrooms to meet the food security: A review. J. Posit. Sch. Psychol. 2022, 6, 4316–4325. [Google Scholar]
  3. Eurostat. Crop Production in European Union Standard Humidity. Available online: https://ec.europa.eu/eurostat/databrowser/view/APRO_CPSH1__custom_2950901/default/table?lang=en (accessed on 20 June 2022).
  4. Ministerio de Agricultura, Pesca y Alimentación. Superficies y Producciones Anuales de Cultivos. Available online: https://www.mapa.gob.es/es/estadistica/temas/estadisticas-agrarias/agricultura/superficies-producciones-anuales-cultivos/ (accessed on 8 May 2022).
  5. Ministerio de Agricultura, Pesca y Alimentación. Informe del consumo de alimentación en España. Available online: https://www.mapa.gob.es/es/alimentacion/temas/consumo-tendencias/informe-anual-consumo-2020-v2-nov2021-baja-res_tcm30-562704.pdf (accessed on 8 May 2022).
  6. Leuci, R.; Brunetti, L.; Poliseno, V.; Laghezza, A.; Loiodice, F.; Tortorella, P.; Piemontese, L. Natural compounds for the prevention and treatment of cardiovascular and neurodegenerative diseases. Foods 2020, 10, 29. [Google Scholar] [CrossRef] [PubMed]
  7. Kumar, K.; Mehra, R.; Guiné, R.P.F.; Lima, M.J.; Kumar, N.; Kaushik, R.; Ahmed, N.; Yadav, A.N.; Kumar, H. Edible mushrooms: A comprehensive review on bioactive compounds with health benefits and processing aspects. Foods 2021, 10, 2996. [Google Scholar] [CrossRef] [PubMed]
  8. Torija, M.E. Principios Inmediatos y Elementos Minerales en Hongos Comestibles. Ph.D. Thesis, Universidad Complutense de Madrid, Madrid, Spain, 2015. [Google Scholar]
  9. Parniakov, O.; Lebovka, N.I.; van Hecke, E.; Vorobiev, E. Pulsed electric field assisted pressure extraction and solvent extraction from mushroom (Agaricus bisporus). Food Bioprocess Technol. 2014, 7, 174–183. [Google Scholar] [CrossRef]
  10. Gazaryan, I.G.; Ratan, R.R. Oxidative damage in neurodegeneration and injury. In The Curated Reference Collection in Neuroscience and Biobehavioral Psychology; Elsevier: Amsterdam, The Netherlands, 2017; pp. 327–336. [Google Scholar] [CrossRef]
  11. Mattila, P.; Könkö, K.; Eurola, M.; Pihlava, J.M.; Astola, J.; Vahteristo, L.; Hietaniemi, V.; Kumpulainen, J.; Valtonen, M.; Piironen, V. Contents of vitamins, mineral elements, and some phenolic compounds in cultivated mushrooms. J. Agric. Food Chem 2001, 49, 2343–2348. [Google Scholar] [CrossRef]
  12. Roselló-Soto, E.; Parniakov, O.; Deng, Q.; Patras, A.; Koubaa, M.; Grimi, N.; Boussetta, N.; Tiwari, B.K.; Vorobiev, E.; Lebovka, N.; et al. Application of non-conventional extraction methods: Toward a sustainable and green production of valuable compounds from mushrooms. Food Eng. Rev. 2016, 8, 214–234. [Google Scholar] [CrossRef]
  13. Khatun, S. Research on mushroom as a potential source of nutraceuticals: A review on Indian perspective. Am. J. Exp. Agric. 2012, 2, 47–73. [Google Scholar] [CrossRef] [Green Version]
  14. Athanasiadis, V.; Pappas, V.M.; Palaiogiannis, D.; Chatzimitakos, T.; Bozinou, E.; Makris, D.P.; Lalas, S.I. Pulsed electric field-based extraction of total polyphenols from Sideritis raiseri using hydroethanolic mixtures. Oxygen 2022, 2, 91–98. [Google Scholar] [CrossRef]
  15. Barros, M.; Redondo, L.; Rego, D.; Serra, C.; Miloudi, K. Extraction of essential oils from plants by hydrodistillation with pulsed electric fields (PEF) pre-treatment. Appl. Sci. 2022, 12, 8107. [Google Scholar] [CrossRef]
  16. Bocker, R.; Silva, E.K. Pulsed electric field-assisted extraction of natural food pigments and colorings from plant matrices. Food Chem. 2022, 15, 100398. [Google Scholar] [CrossRef]
  17. Martí-Quijal, F.J.; Ramon-Mascarell, F.; Pallarés, N.; Ferrer, E.; Berrada, H.; Phimolsiripol, Y.; Barba, F.J. Extraction of antioxidant compounds and pigments from Spirulina (Arthrospira platensis) assisted by pulsed electric fields and the binary mixture of organic solvents and water. Appl. Sci. 2021, 11, 7629. [Google Scholar] [CrossRef]
  18. Vernon-Parry, K.D. Scanning electron microscopy: An introduction. III-Vs Rev. 2000, 13, 40–44. [Google Scholar] [CrossRef] [Green Version]
  19. De Vito, F.; Ferrari, G.; Lebovka, N.I.; Shynkaryk, N.V.; Vorobiev, E. Pulse duration and efficiency of soft cellular tissue disintegration by pulsed electric fields. Food Bioprocess Technol. 2008, 1, 307–313. [Google Scholar] [CrossRef]
  20. Luengo, E.; Raso, J. Pulsed electric field-assisted extraction of pigments from Chlorella vulgaris. In Handbook of Electroporation; Springer: Berlin/Heidelberg, Germany, 2017; pp. 2939–2954. ISBN 9783319328867. [Google Scholar]
  21. Ovalles-Rodríguez, G.A. Uso de la metodología de superficies de respuesta en la optimización de procesos. Eco. Mat. 2011, 2, 16–20. [Google Scholar] [CrossRef]
  22. Cao, G.; Alessio, H.M.; Cutler, R.G. Oxygen-radical absorbance capacity assay for antioxidants. Free Radic. Biol. Med. 1993, 14, 303–311. [Google Scholar] [CrossRef] [Green Version]
  23. Singleton, V.L.; Orthofer, R.; Lamuela-Raventos, R.M. Analysis of total phenols and other oxidation substrates and antioxidants by means of Folin–Ciocalteau reagent. In Methods in Enzymology; Elsevier: Amsterdam, The Netherlands, 1999; pp. 152–178. [Google Scholar] [CrossRef]
  24. Dubois, M.; Gilles, K.A.; Hamilton, J.K.; Rebers, P.A.; Smith, F. Colorimetric method for determination of sugars and related substances. Anal. Chem. 1956, 28, 350–356. [Google Scholar] [CrossRef]
  25. Smiderle, F.R.; Morales, D.; Gil-Ramírez, A.; de Jesus, L.I.; Gilbert-López, B.; Iacomini, M.; Soler-Rivas, C. Evaluation of microwave-assisted and pressurized liquid extractions to obtain β-d-glucans from mushrooms. Carbohydr. Polym. 2017, 156, 165–174. [Google Scholar] [CrossRef]
  26. Akram, K.; Shahbaz, H.M.; Kim, G.R.; Farooq, U.; Kwon, J.H. Improved extraction and quality characterization of water-soluble polysaccharide from gamma-irradiated Lentinus edodes. J. Food Sci. 2017, 82, 296–303. [Google Scholar] [CrossRef]
  27. Morales, D.; Smiderle, F.R.; Villalva, M.; Abreu, H.; Rico, C.; Santoyo, S.; Iacomini, M.; Soler-Rivas, C. Testing the effect of combining innovative extraction technologies on the biological activities of obtained β-glucan-enriched fractions from Lentinula edodes. J. Funct. Foods 2019, 60, 103446. [Google Scholar] [CrossRef]
  28. Dellarosa, N.; Frontuto, D.; Laghi, L.; Dalla Rosa, M.; Lyng, J.G. The impact of pulsed electric fields and ultrasound on water distribution and loss in mushrooms stalks. Food Chem. 2017, 236, 94–100. [Google Scholar] [CrossRef]
  29. El Darra, N.; Grimi, N.; Vorobiev, E.; Louka, N.; Maroun, R. Extraction of polyphenols from red grape pomace assisted by pulsed ohmic heating. Food Bioprocess Technol. 2013, 6, 1281–1289. [Google Scholar] [CrossRef]
  30. Xue, D.; Farid, M.M. Pulsed electric field extraction of valuable compounds from white button mushroom (Agaricus bisporus). Innov. Food Sci. Emerg. Technol. 2015, 29, 178–186. [Google Scholar] [CrossRef]
  31. Vivanco, D.; Ardiles, P.; Castillo, D.; Puente, L. Emerging technology: Pulsed electric fields (PEF) for food treatment and its effect on antioxidant content. Rev. Chil. Nutr. 2021, 48, 609–619. [Google Scholar] [CrossRef]
  32. Agostini, L.R.; Morón Jiménez, M.J.; Ramón, A.N.; Ayala Gómez, A. Determinación de la capacidad antioxidante de flavonoides en frutas y verduras frescas y tratadas térmicamente. Arch. Latinoam. Nutr. 2004, 54, 89–92. [Google Scholar]
  33. Kakon, A.J.; Bazlul, M.; Choudhury, K.; Saha, S. Mushroom is an ideal food supplement. J. Dhaka Natl. Med. Coll. Hosp. 2012, 18, 58–62. [Google Scholar] [CrossRef] [Green Version]
  34. Saiqa, S.; Haq, N.B.; Muhammad, A.H.; Muhammad, A.A.; Rehman, A. Studies on chemical composition and nutritive evaluation of wild edible mushrooms. Iran J. Chem. Chem. Eng. 2008, 27, 151–154. [Google Scholar] [CrossRef]
  35. Ahlawat, O.P.; Manikandan, K.; Singh, M. Proximate composition of different mushroom varieties and effect of UV light exposure on vitamin D content in Agaricus bisporus and Volvariella volvacea. Mushroom Res. 2016, 25, 1–8. [Google Scholar]
  36. Mendiola, M. Caracterización de Compuestos Bioactivos y Efecto de la Aplicación de Pulsos Eléctricos de Moderada Intensidad de Campo en Setas Cultivadas en La Rioja. Ph.D. Thesis, Universitat de Lleida, Lérida, Spain, 2017. [Google Scholar]
  37. Moro, C. Obtención de Extractos Metanólicos Ricos en Compuestos Fenólicos a Partir de Hongos Comestibles. Valoración, In Vitro, de la Actividad Antioxidante y Antiinflamatoria de los Extractos. Ph.D. Thesis, Universidad de Valladolid, Valladolid, Spain, 2015. [Google Scholar]
  38. Agencia Española de Seguridad Alimentaria y Nutrición. Informe del Comité Científico de la Agencia Española de Seguridad Alimentaria y Nutrición (AESAN) Sobre Ingestas Nutricionales de Referencia para la Población Española. Available online: https://www.aesan.gob.es/AECOSAN/docs/documentos/seguridad_alimentaria/evaluacion_riesgos/informes_comite/INR.pdf (accessed on 8 May 2022).
  39. Kalač, P. A review of chemical composition and nutritional value of wild-growing and cultivated mushrooms. J. Sci. Food Agric. 2013, 93, 209–218. [Google Scholar] [CrossRef]
  40. Bano, Z.; Rajarathnam, S. Pleurotus mushrooms. Part II. Chemical composition, nutritional value, post-harvest physiology, preservation, and role as human food. Crit. Rev. Food Sci. Nutr. 1988, 27, 87–158. [Google Scholar] [CrossRef]
  41. Agencia Española de Seguridad Alimentaria y Nutrición. Evaluación Nutricional de la Dieta Española II SOBRE datos de la Encuesta Nacional de Ingesta Dietética (ENIDE). Available online: http://www.laboratoriolcn.com/wp-content/uploads/2019/11/Valoracion_nutricional_ENIDE_micronutrientes.pdf (accessed on 24 May 2022).
  42. Fundación española de la Nutrición. Alimentos y Bebidas: Verduras y Hortalizas. Available online: https://www.fen.org.es/vida-saludable/alimentos-bebidas (accessed on 8 May 2022).
  43. Saulis, G. Electroporation of cell membranes: The fundamental effects of pulsed electric fields in food processing. Food Eng. Rev. 2010, 2, 52–73. [Google Scholar] [CrossRef]
  44. Li, X.; Li, J.; Wang, R.; Rahaman, A.; Zeng, X.A.; Brennan, C.S. Combined effects of pulsed electric field and ultrasound pretreatments on mass transfer and quality of mushrooms. LWT 2021, 150, 112008. [Google Scholar] [CrossRef]
  45. Vorobiev, E.; Lebovka, N. Pulsed-electric-fields-induced effects in plant tissues: Fundamental aspects and perspectives of applications. In Electrotechnologies for Extraction from Food Plants and Biomaterials; Springer: New York, NY, USA, 2009; pp. 39–81. ISBN 9780387793733. [Google Scholar]
Figure 1. Influence of the different extraction conditions (A) and main effects chart (B) for electric field strength, specific energy and time on carbohydrate recovery yield (mg glucose/g dry matter). The least relevant factor (highest p-value) has been set at its optimal value.
Separations 09 00302 g001
Figure 2. Influence of the different extraction conditions (A) and main effects chart (B) for electric field strength, specific energy and time on protein recovery yield (mg bovine serum albumin/g dry matter). The least relevant factor (highest p-value) has been set at its optimal value.
Separations 09 00302 g002aSeparations 09 00302 g002b
Figure 3. Main effect chart of different extraction conditions on (A) Trolox equivalent antioxidant capacity (TEAC), (B) oxygen radical antioxidant capacity recovery yield (µmol Trolox equivalent/g dry matter), and (C) total phenolic compounds (TPC) recovery yield (mg gallic acid equivalent/g dry matter).
Separations 09 00302 g003
Figure 4. Influence of different extraction conditions on the recovery yield of antioxidant compounds, total carbohydrates and total proteins. The least relevant factor (highest p-value) has been set at its optimum value.
Separations 09 00302 g004
Figure 5. Total carbohydrate content (mg glucose (glu)/g dry matter (DM)) in conventional and pulsed electric field-assisted extraction (PEF) of A. bisporus. Different lowercase letters in the same parameter indicate statistical differences related to the extraction methodology.
Separations 09 00302 g005
Figure 6. Total protein content (mg bovine serum albumin (BSA)/g dry matter (DM)) in conventional and pulsed electric field-assisted extraction (PEF) of A. bisporus. Different lowercase letters in the same parameter indicate statistical differences related to the extraction methodology.
Separations 09 00302 g006
Figure 7. Total phenolic compounds (TPC) (mg gallic acid equivalents (GAE)/g dry matter (DM)), Trolox equivalent antioxidant capacity (TEAC) and oxygen radical antioxidant capacity (ORAC) (µmol Trolox equivalents (TE)/g dry matter (DM)) values in conventional and pulsed electric field-assisted extraction of A. bisporus. Different lowercase letters in the same parameter indicate statistical differences related to the extraction methodology.
Separations 09 00302 g007
Figure 8. The percentage recovery of each mineral in conventional and pulsed electric field-assisted (PEF) extracts from fresh samples of A. bisporus. Different lowercase letters in the same mineral suggest significant differences in relation to the methodology applied.
Separations 09 00302 g008
Figure 9. Microstructure (presented as scanning electron microscopy images; ×300 magnification) of freeze-dried A. bisporus after different processes: (a) untreated sample (control), (b) conventional aqueous extraction and (c) pulsed electric field (PEF) pretreated sample.
Separations 09 00302 g009
Table 1. Pulsed electric field (PEF)-assisted extraction experimental conditions.
SampleWeight
(g)
Field strength
(kV/cm)
Specific Energy
(kJ/kg)
Time
(h)
12203.00506
22202.001253
32203.002000
42203.00500
52202.00506
62202.501253
72202.002006
82202.501250
92202.002000
102203.001253
112202.502003
122202.501256
132202.50513
142202.501253
152202.00500
162203.002006
172202.501253
Publisher’s Note: MDPI stays neutral with regard to jurisdictional claims in published maps and institutional affiliations.

