1. Introduction
Monitoring of vibrations from anthropogenic sources is becoming increasingly important, mainly due to the mass development of transport and construction–reconstruction in urban areas, where heavy construction equipment is used. Hence, effective low-cost, low-power, low-complexity methods for monitoring the dynamic response of buildings are intensively sought, which will transmit information about seismic or acoustic load continuously and in real time.
In the field of seismic engineering, when monitoring vibrations from anthropogenic sources, measuring technology based on sensors in the electrical domain has been used for several decades to measure the dynamic response of the rock environment as well as the dynamic response of the structure. Currently, standard seismic instrumentation consisting of a digital station and a three-component piezoelectric velocity seismometer is used to monitor dynamic effects [
1]. In the dynamically developing 21st century, however, new progressive solutions are being sought in this area as well; these solutions can be found, for example, in other physical principles than those that have been used so far. Sensory technologies based on other physical principles form a new alternative method of monitoring both seismic (dynamic) effects and acoustic (all-in-one) effects, with high added value. The main advantages of these technologies are small size, electrical passivity and immunity to electromagnetic interference, the simple internal structure, high mechanical resistance, the possibility of use in extreme conditions (humidity, extreme temperatures, explosive environments, oil industry, nuclear power plants, etc.) or also a significantly lower price. In recent years, there has also been considerable progress in the area of advanced methods of digital signal processing and work with Big Data. It is one of the fastest growing scientific disciplines and it is obvious that these progressive methods will penetrate the field of seismic monitoring. These new DSP (Digital Signal Processing) methods can make measurements more accurate, provide new measurement functions, etc. Modern digital signal processing methods have now been used in many areas and industries, and current practice suggests that the same trend will continue in the future. For the practical application of these progressive methods in real applications, among other things, both theoretical and applied research of the new as well existing methods are needed. Some application areas of these new approaches are not yet very developed and, in some fields, including the area of seismic monitoring, they are completely missing. It can be expected that new methods of seismic monitoring will enable the development of progressive techniques that are not yet very developed in this area, such as the use of artificial intelligence and machine learning techniques to predict, creation of seismic and acoustic maps of analyzed areas, linking with other smart cities entities, etc.
However, before the routine field deployment of similar equipment in common seismic engineering tasks, such as monitoring the dynamic response of the building structure and rock mass from various sources [
2,
3,
4,
5,
6,
7], it is first necessary to experimentally verify whether the equipment being developed is able to detect vibrations to the extent and accuracy required for engineering practice (
Table 1). For this purpose, several successful experiments with different sources of vibration have been conducted in situ [
8,
9,
10]. These experiments, when confronted with common instrumentation for seismic monitoring, proved the applicability of the devices tested and being developed for given tasks, specifically in a wide range of applications, with excellent agreement both in time (length of seismic events, detection of specific maxima) and the frequency domain (predominant frequency content, identical frequency peaks). The next logical step was to verify, at the experimental level, the possibility of recalculation of the measurements units in the time domain, so that new devices could be a direct alternative to commercially used systems. The paper is going to present such a laboratory experiment with finding of basic relationship for an interferometric sensor and a pneumatic sensor using a calibrated stroke in simplified conditions. A calibrated and certified standard seismic station with a velocity sensor installed was used as a reference standard.
The following sections will present State Of-the-Art, Methods, Experimental Setup, Results of Experiments, Discussion and Conclusions.
2. State-of-the-Art
In this part, the issue of vibration measurement with standard seismic instrumentation will be introduced, as well as alternative approaches to vibration measurement using developed sensors.
2.1. Commercially Used Seismic Instrumentation
Many manufacturers around the world produce seismic vibration monitoring stations, which are used for seismic monitoring purposes in engineering practice. These stations are manufactured as compact, or are supplied separately with an evaluation unit and a seismic sensor.
As a standard, these stations are used to measure vibrations to dynamically assess the response of a building structure due to anthropogenic sources. These sources include both wheeled and rail transport (tram transport especially in the urban area) as well as all construction technology generating vibrations, which are mostly inextricably connected with construction processes, especially with foundation of buildings and subsoil modification. Blasting work carried out in the vicinity of urban areas, whether it is large-scale blasting work in mining processes on the surface and underground, as well as blasting work as one of the work cycles in tunnel excavation, is a stand-alone issue. Here, these stations are then deployed as a necessary part of geotechnical monitoring, where, based on the measurement results, excavation and tunnelling procedures are optimized, thus reducing negative impacts on the environment. In general, vibrations from all these sources are called technical seismicity. The character of the recording in the time domain is subsequently dependent on the source of the dynamic load, which is a rapidly dampened seismic impulse or a longer-lasting shock.
Seismic sensors detect and measure ground vibration by means of the movement of a magnet suspended in a surrounding by a coil of wire. According to the Lenz Law of physics, a current is induced in the surrounding coil in a proportion to the velocity of the magnet movement with respect to the coil. The electronics in the monitor then measures this current, converts it to ground motion velocities and stores the raw data in the memory. Each of the three directions perpendicular to one another (longitudinal or radial, transverse, and vertical) has its own separate measuring coil in the transducer head, since the vibrations often differ significantly along the different measurement directions.
Standard seismic stations used for monitoring vibrations from anthropogenic sources have a common frequency range in the range from 2 to 200 Hz with respect to the sensor type. The mechanical principle of the measurement itself is the main disadvantage of these devices, since they are very sensitive to manipulation. The sensors as such are not immune to electromagnetic interference and, unlike the newly designed sensory technologies, do not withstand the long-term effects of extreme climatic conditions.
2.2. Experimentally Developed Sensor Systems
Sensory technologies based on optical fibers are an alternative method of monitoring seismic (dynamic) effects with a high added value. The fundamental advantages of fiber-optic sensors include small size, electrical passivity, resistance to electromagnetic interference (EMI) and low optical attenuation (measuring point can be separated from the evaluation optoelectronics). For high-precision measurements fiber-optic interferometers (such as Mach–Zehnder, Sagnac, Michelson, or Fabry–Perot) are the best choice. Interferometers are well known for their ability of making precision measurements of optical path difference between two fiber arms caused by a refractive index change in the interferometer arm or physical displacement [
11]. Other technologies such as fiber gratings have limited frequency range, so the acoustic measurements are easier to implement in the case of interferometers. Below is a summary of current research in the field of optical sensing technology applicable in seismic measurements and with emphasis on interferometers.
The current state of knowledge mentions the use of optical interferometers in the area of seismic measuring about two decades ago [
12]. However, these interferometers used interference in free space, not in optical fibers. Optical fiber configurations did not begin to appear until later. As one of the first fiber-optic approach within interferometric seismic measuring Sagnac interferometers [
13] were described. Sagnac interferometer enables measuring even with the use of less coherent radiation sources contrary to other types of interferometers. The ability to measure rotation during seismic activity proved interesting but without further application, their main domain is still gyroscopes. An example of possible sensor design is [
14]. The sensor is in the form of a cylinder on which a coil of optical fiber is wound. The cylinder is then immersed in a second larger cylinder full of water. The fiber length used in the Sagnac interferometer was only about 30 m long, yet the authors were able to sense the vibrations generated within the experiment.
Seismic stations can be substituted by another fiber-optic sensors operating on the principle of acceleration detection [
15] such as Fabry–Perot, Mach–Zehnder or Michelson interferometers. Sensors with these types of interferometers can be constructed as tri-axial [
16]. They can be characterized with the output intensity modulation measurable with regular optical power detectors. Design issues of all-fiber interferometric seismometers are discussed in [
17].
The authors of [
18] describe a simple seismometer based on a Mach–Zehnder interferometer. The designers were facing a phase drift of the sensor, which they successfully solved by actively controlling the operating point using a piezoelement in the arm of the interferometer. However, this solution is no longer completely optically passive and requires active electronic control, which is a considerable disadvantage. The resonant frequency of the resultant sensor is relatively low (60 Hz), which is also not practical in terms of calibrating the sensor frequency response. These issues were overcome in our setup using passive optical demodulation as described in [
19] and a sensor design with short optical fibers in the interferometer arms.
The demonstration of in-fiber Fabry–Perot interferometer with fiber Bragg grating mirrors (FBG-FPI) is described in [
20]. The sensor can monitor a wide range of vibration frequencies and therefore can be applicable in monitoring of seismic responses.
A distributed fiber-optic sensing technology called DAS or DVS (Distributed Acoustic/Vibration Sensing) was also presented as an alternate approach [
21]. The principle uses Rayleigh’s backscattering for scanning interferences over the entire length of the optical fiber acting as the sensor. Resulting acoustic and vibration signals at any point of the monitored fiber length have no parallel in the conventional measuring technology. The downside is the impossibility of measuring of wave direction at the measuring point and very high price of the evaluation units. For these reasons, it has not been put into practice yet and is used rather on an experimental basis. In [
22] the authors deal with the use of DAS for the measurement of underground propagation of acoustic and vibration waves, is an example of a successful application in practice, but, for surface measurements, this method is not entirely suitable.
In case of non-fiber interferometric approach of measuring, several interesting studies can be mentioned. The authors of [
23] provided results describing the monitoring system of bridge statics and dynamic vibrations. Two different camera types were used to monitor the response of a bridge to a passing train. Image processing techniques (pattern matching, edge detection, and digital image correlation) were used for the analysis of the acquired images. Results were compared to reference measurements obtained by single point measurements using the laser interferometer. The laser interferometer sensors can provide a method for observing low-frequency ground motion on seismic, geodetic, and intermediate time scales, as described by the authors of [
24]. Comparison of individual interferometers with respect to the description of the sensor design, and the advantages and disadvantages are shown in
Table 2.
A unique pneumatic sensory device was also employed in the experiments using other physical approaches to vibration measurement. The first instruments used to measure vibrations historically consisted mainly of weights suspended on a cable or a spring, and these, using their inertia, were able to detect slight movements of the earth due to seismic waves. The device, which is historically close in principle to the presented solution, is called a geophone. However, the pneumatic sensor does not detect movement by direct contact of the armature from the permanent magnet inserted in the coil, but uses a pressure sensor to measure the change in sound pressure inside the closed tube. This innovative method was a by-product of experiments in which dilatation was measured using a similar pneumatic system in a strong magnetic field, where standard sensors designed for this type of measurement could not be used. This device is still unparalleled in its research field and thus has not a non-commonly used and defined name. The device is, by its principle, similar to closed-hose presence detectors [
26,
27,
28]. In contrast, this application does not depend on deformation, and its subsequent pressure changes, under the weight of the measured object. The presented device measures vibrations, which are propagated by material surrounding the pressure tube.
A partly similar topic can be found in publications examining the manifestation of changes in closed tube-based vibration measurement [
29,
30,
31]. The authors analyze vibrations produced by changes in flow, pressure, and density of the medium propagated by the tubes. This gives them a better understanding of the process that takes place inside the pressure tube, in contrast to our measurement, which focuses on the detection of external excitations passing into the tube.
3. Methods
In this section, will be presented specific devices that have been used for experimental vibration measurements, therefore standard seismic station, fiber-optic interferometric system and pneumatic system.
3.1. Seismic Equipment BRS32
The BRS32 seismic station is one of the most widely used seismic stations in Central Europe; it is used for the purposes of seismic monitoring in engineering practice. BRS32 is, therefore, a universal seismic station, used for measurements both with battery power in field conditions for short-term measurements and for long-term seismic monitoring with connection to the electrical network and the possibility of remote data transmission. The compact station contains a three-component seismic velocity geophone. USB interface is used for all settings. The frequency range of the internal geophone (depending on the type of installed geophone) is between 0.5 Hz and 80 Hz at the dynamics of up to 120 dB. Sampling frequency is 250 Hz. The device, after switching on is automatically connected to the Global Positioning System (GPS) signal. The measurement coordinates are saved and the time is synchronized. The battery lasts more than 48 hours. BRS32 is very compact with simple control. Use of this device is in all application in the field of natural and induced seismicity. Internal geophones can be selected during the production. Two types are the most used: Dutch SM6-3D with frequency range 4.5 to 100 Hz and German LE3D Lennartz with frequency range 1 to 80 Hz [
32]. Geophone SM6-3D has been installed in the device used. The seismic station BRS32 is serially manufactured in the Czech Republic by Arenal s.r.o., it is calibrated according to the relevant standards, and certified.
3.2. Fiber-Optic Interferometric System Being Developed for Seismic Monitoring
Fiber-optic sensors can be divided into several basic categories, wherein one of them includes phase-modulated sensors. Phase-modulated sensors compare the phase of the radiation source (light) in a measurement fiber to a reference fiber in a device called an interferometer. In other words, the relative phase change between two light waves is measured. Phase-modulated sensors are one of the most sensitive principles known, with large dynamic range suitable for various applications.
The phase delay of light due to passing through the optical fiber section
is given by relation (
1), where
is the refractive index of the fiber core,
l represents the fiber length and
the wavelength of the radiation source used. A change in the fiber length
l or the refractive index of the core of the measuring fiber
causes a phase change that can be described as follows (
2).
The external conditions can affect the characteristics of light waves within the optical fiber one of them being the phase delay. The optical fiber is sensitive to the mechanical stress (the expansion or compression) acting in the fiber axis which is based on the theory of elasticity. The mechanical stress results in the changes of the refractive indices of the fiber core and cladding, the fiber length and the fiber core diameter [
33]. Interferometer translates these mechanical changes into optical intensity changes measurable by regular optical power detectors. The interferometric sensor output can be described by (
3), where
C is the mean value of the optical intensity,
A is the amplitude of the variation of the optical intensity, and
is the phase difference between the interferometer arms.
Since several known fiber-optic connections lead to wave interference, it was necessary to choose the most suitable one for solving the issue of vibration measurement. Eventually, the connection of the Michelson interferometer, which uses two short sections of fibers terminated by a reflective element, such as a mirror, became the most suitable one. This type of interferometer is not very sensitive to changes in the wavelength of the radiation source, assuming a balanced fiber length of the interferometer arms, is compact because it requires only short sections of optical fibers in the sensor, has as large dynamic range as the Mach–Zehnder interferometer, and is fairly sensitive to low-frequency vibrations and acoustic signals [
33].
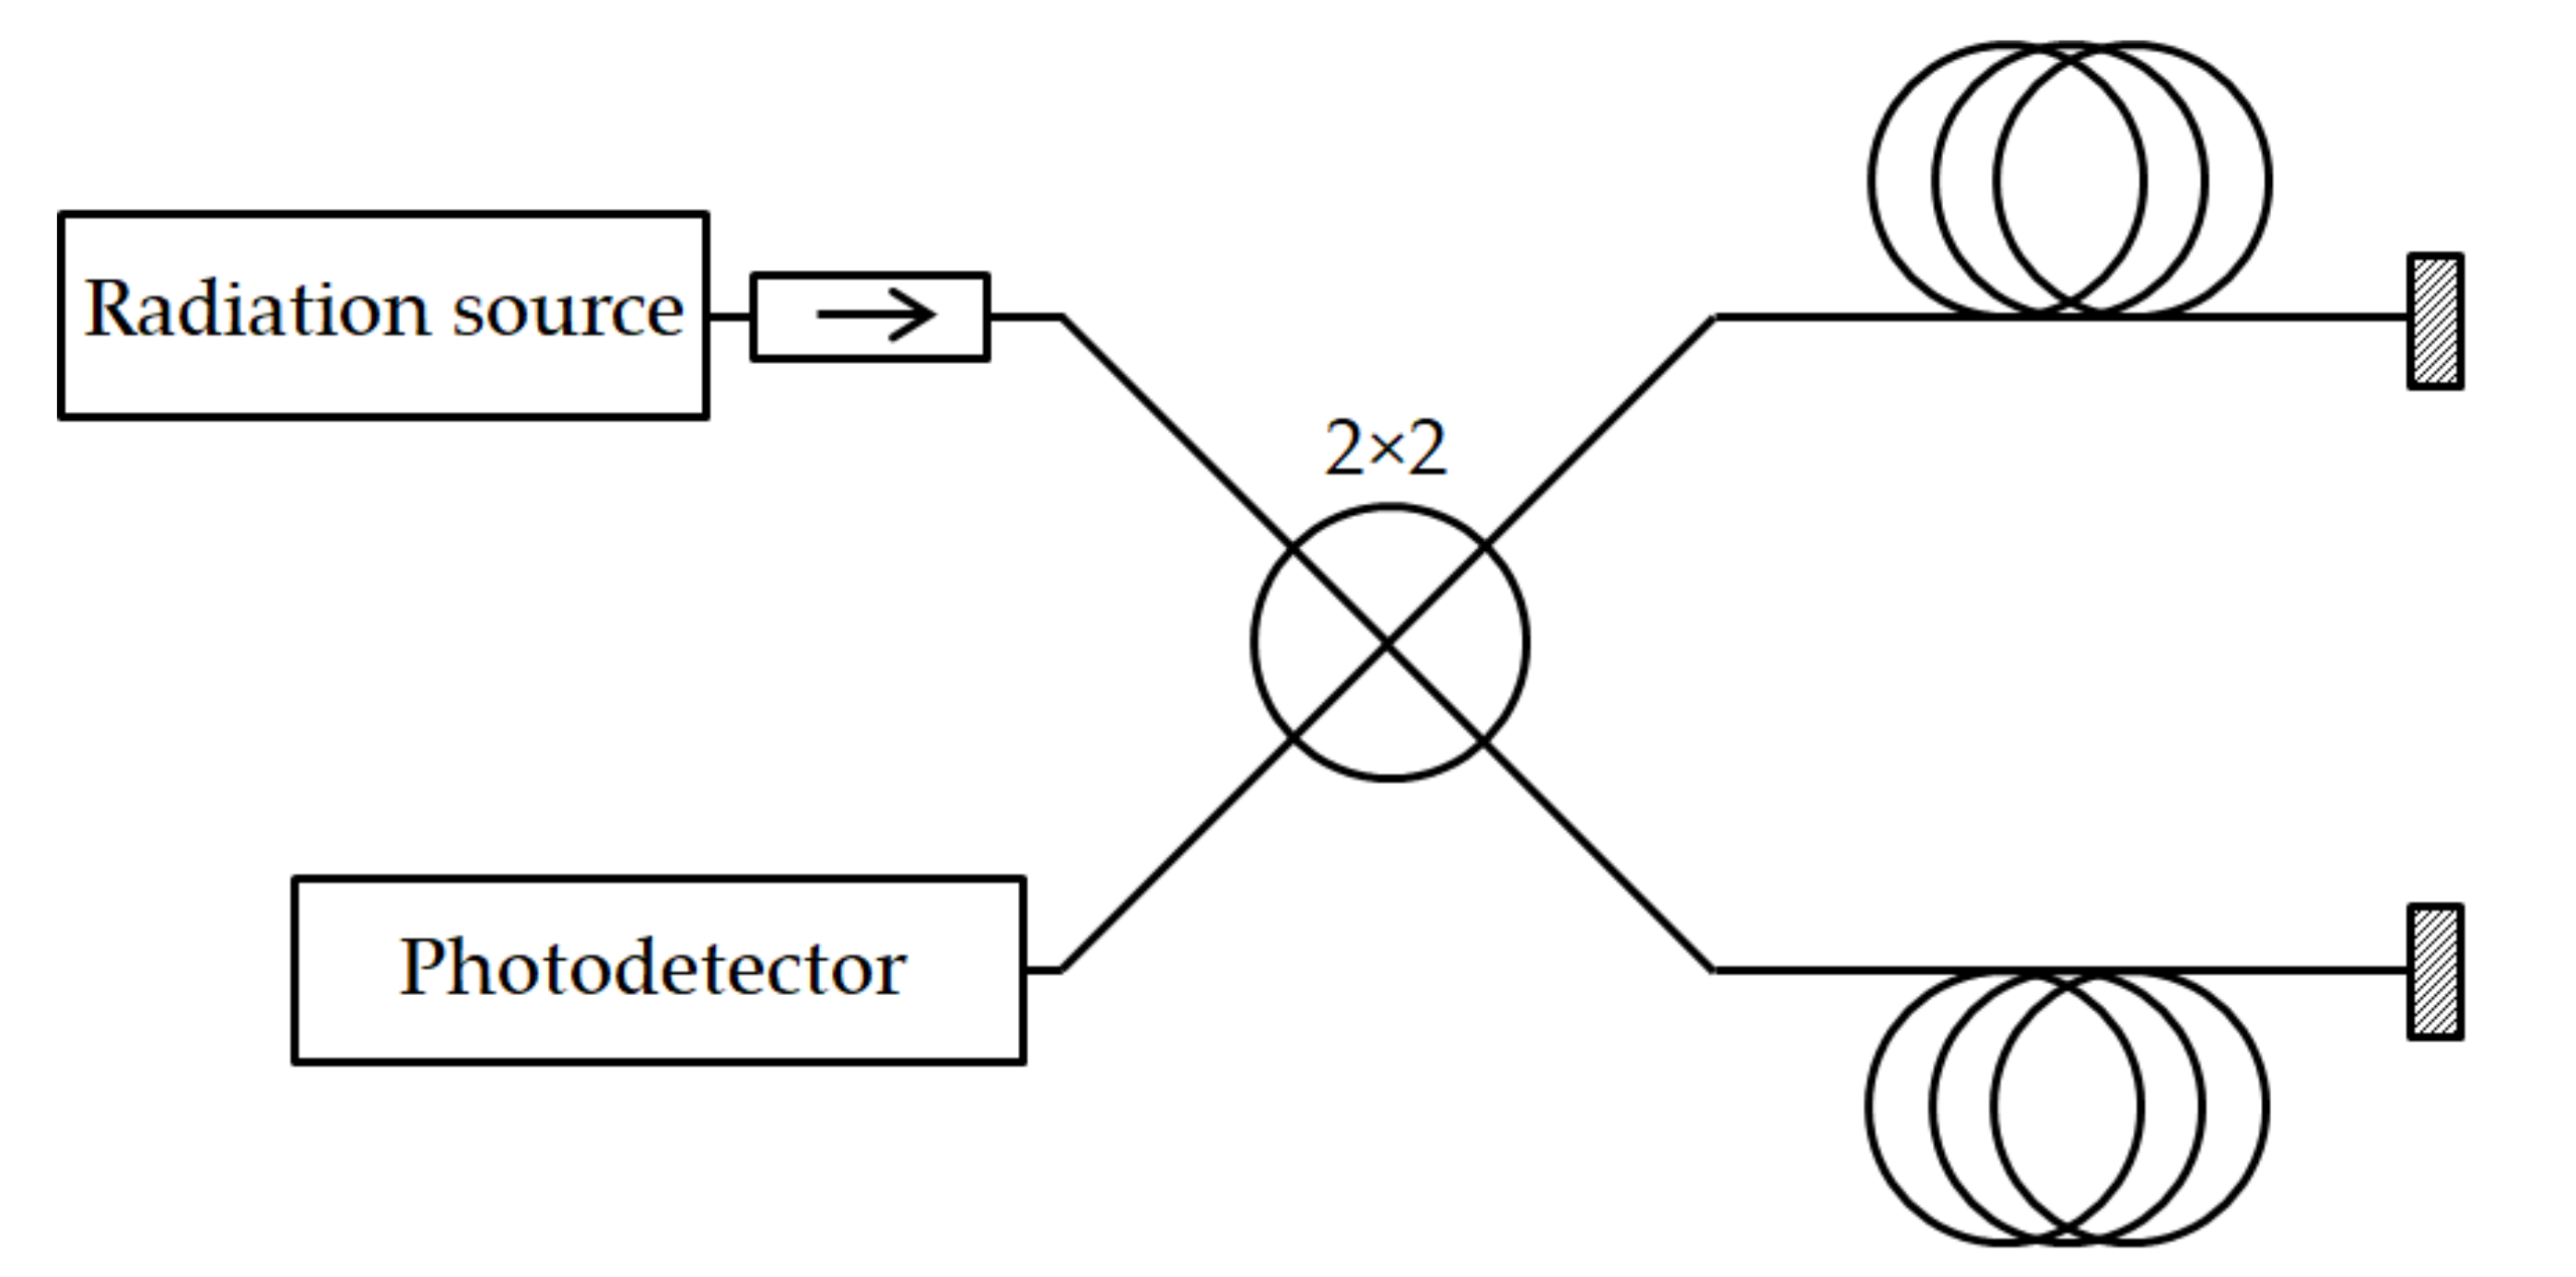
The basic connection of the fiber-optic Michelson interferometer (MI) is determined by fiber optical symmetrical 2 × 2 coupler which has two input and two output ports. An optical radiation source is connected at the input port and is supplemented by an isolator, to suppress the back reflections. The short fiber sections at the outputs form the measurement and reference arms of the interferometer. The fibers are terminated with mirrors and the output signal is transmitted by the same coupling element to the photodetector via the second input port, see
Figure 1.
To determine the value of
, a demodulation technique is essential to perform the measurements. The operational passivity of the so-called homodyne demodulation [
34] is advantageous in the sensor construction as it uses a 3 × 3 coupler instead of 2 × 2 and therefore having phase-shifted signal outputs, which can be described by the following Equations (
4)–(
6), where
is 3 × 3 coupler phase asymmetry.
In the first step, the DC offset
and modulation amplitude
are equalized for all channels,
is set to 0 and
is set to 1. Subsequently, following Formula (
7) can be applied [
35]. The demodulation can be performed digitally with harmonic arctangent function.
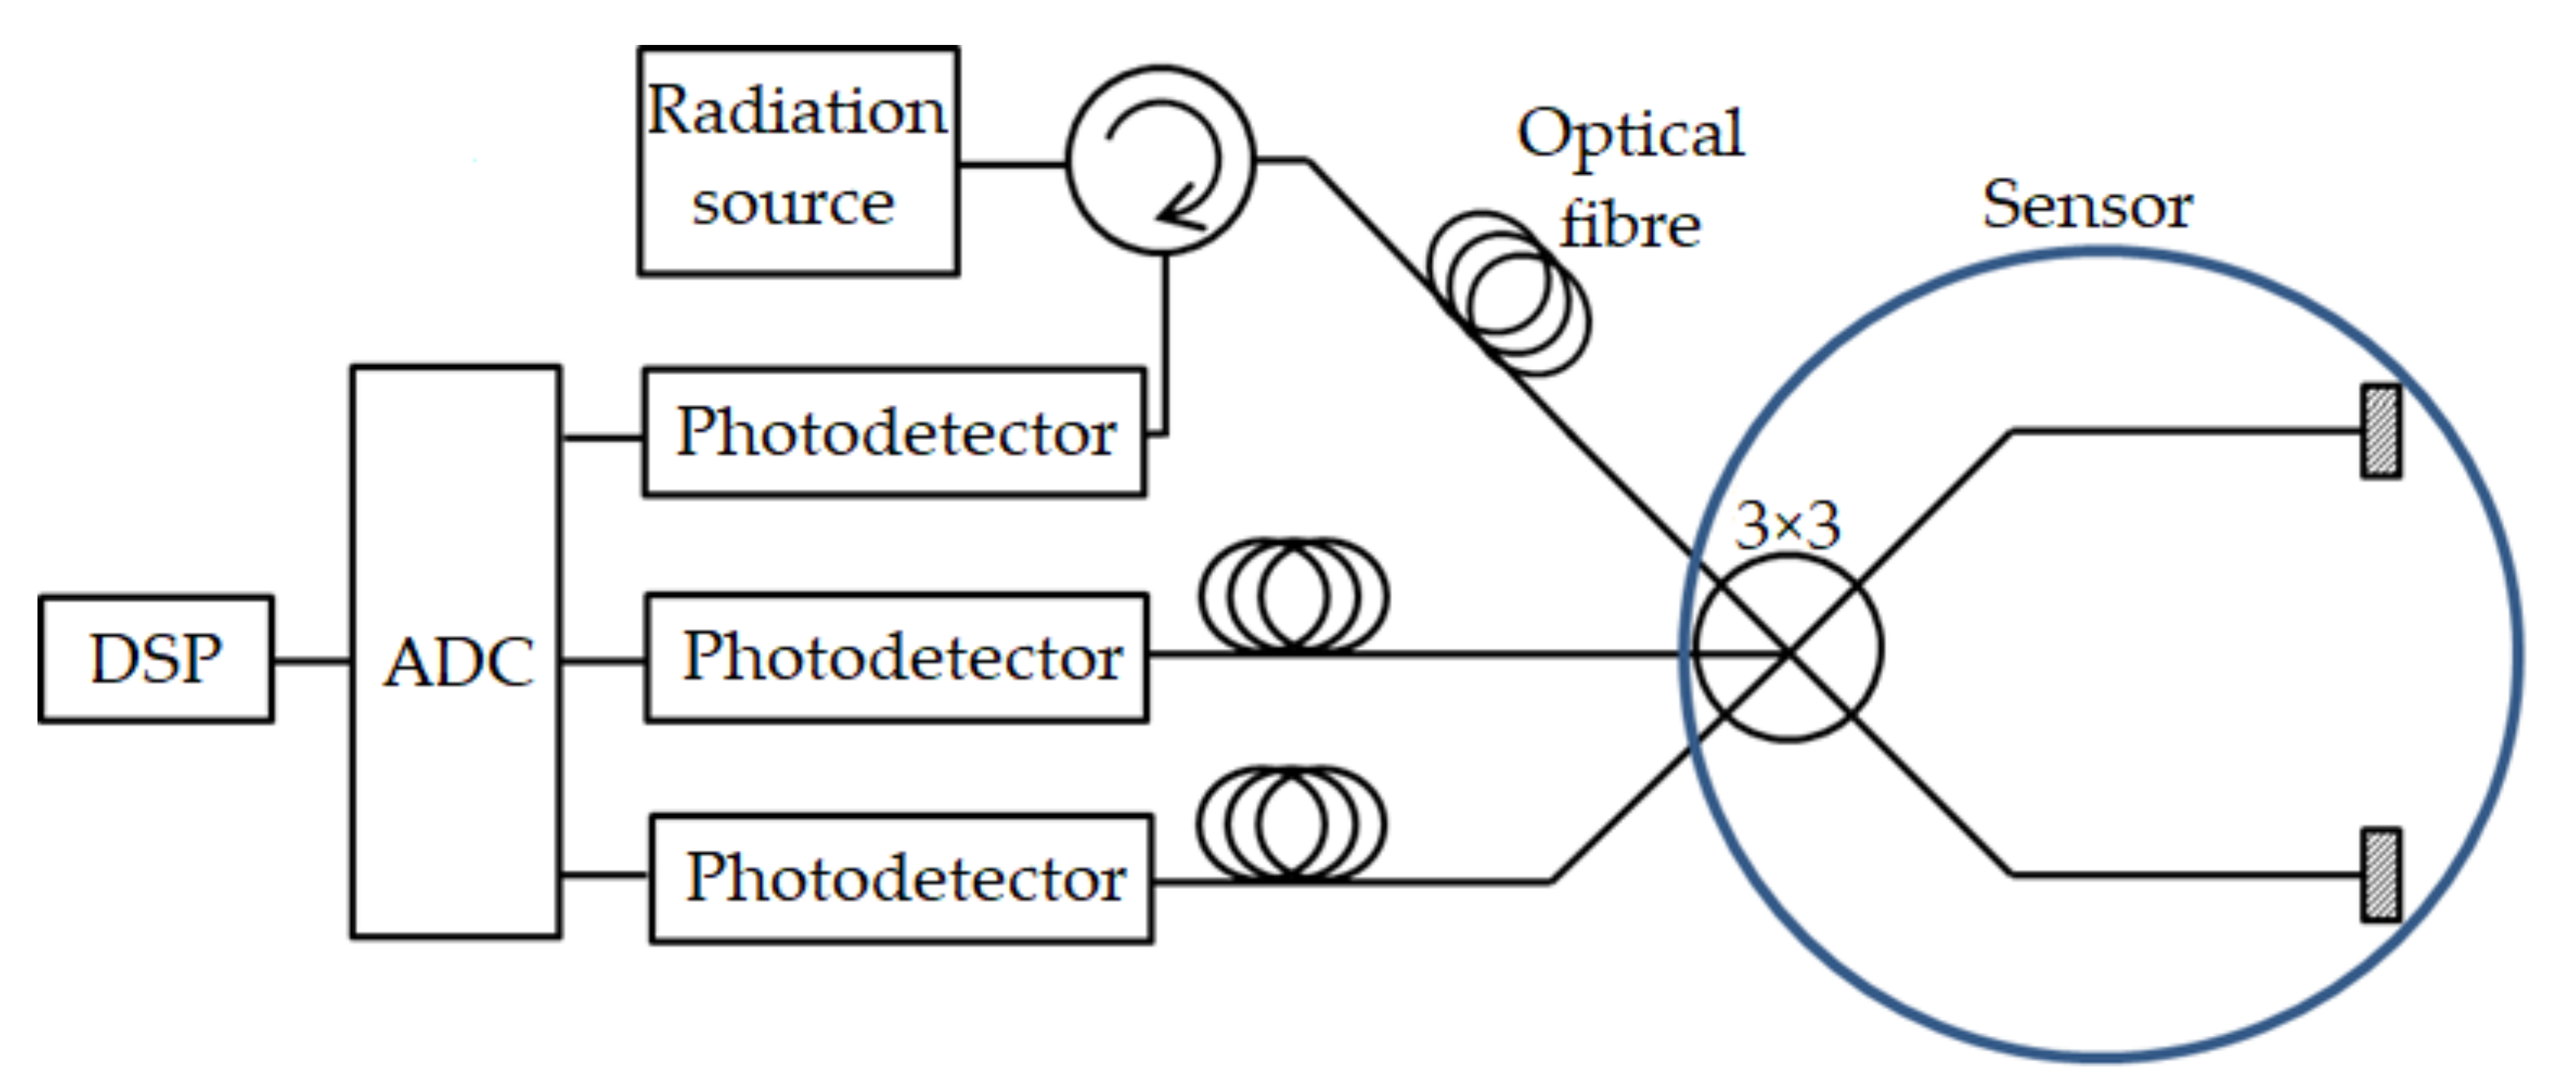
The unwrapped phase difference can be continuously measured in real time with basically no limit to its measuring range. The accuracy and amplitude limit of phase difference is given by the photodetector bandwidth and sampling rate. For the particular application, single MHz photodetector and 100 kS/s sampling rate is well above the expected measured vibration frequency and amplitude range. The entire connection of the actual measuring system with the interferometer is shown in
Figure 2.
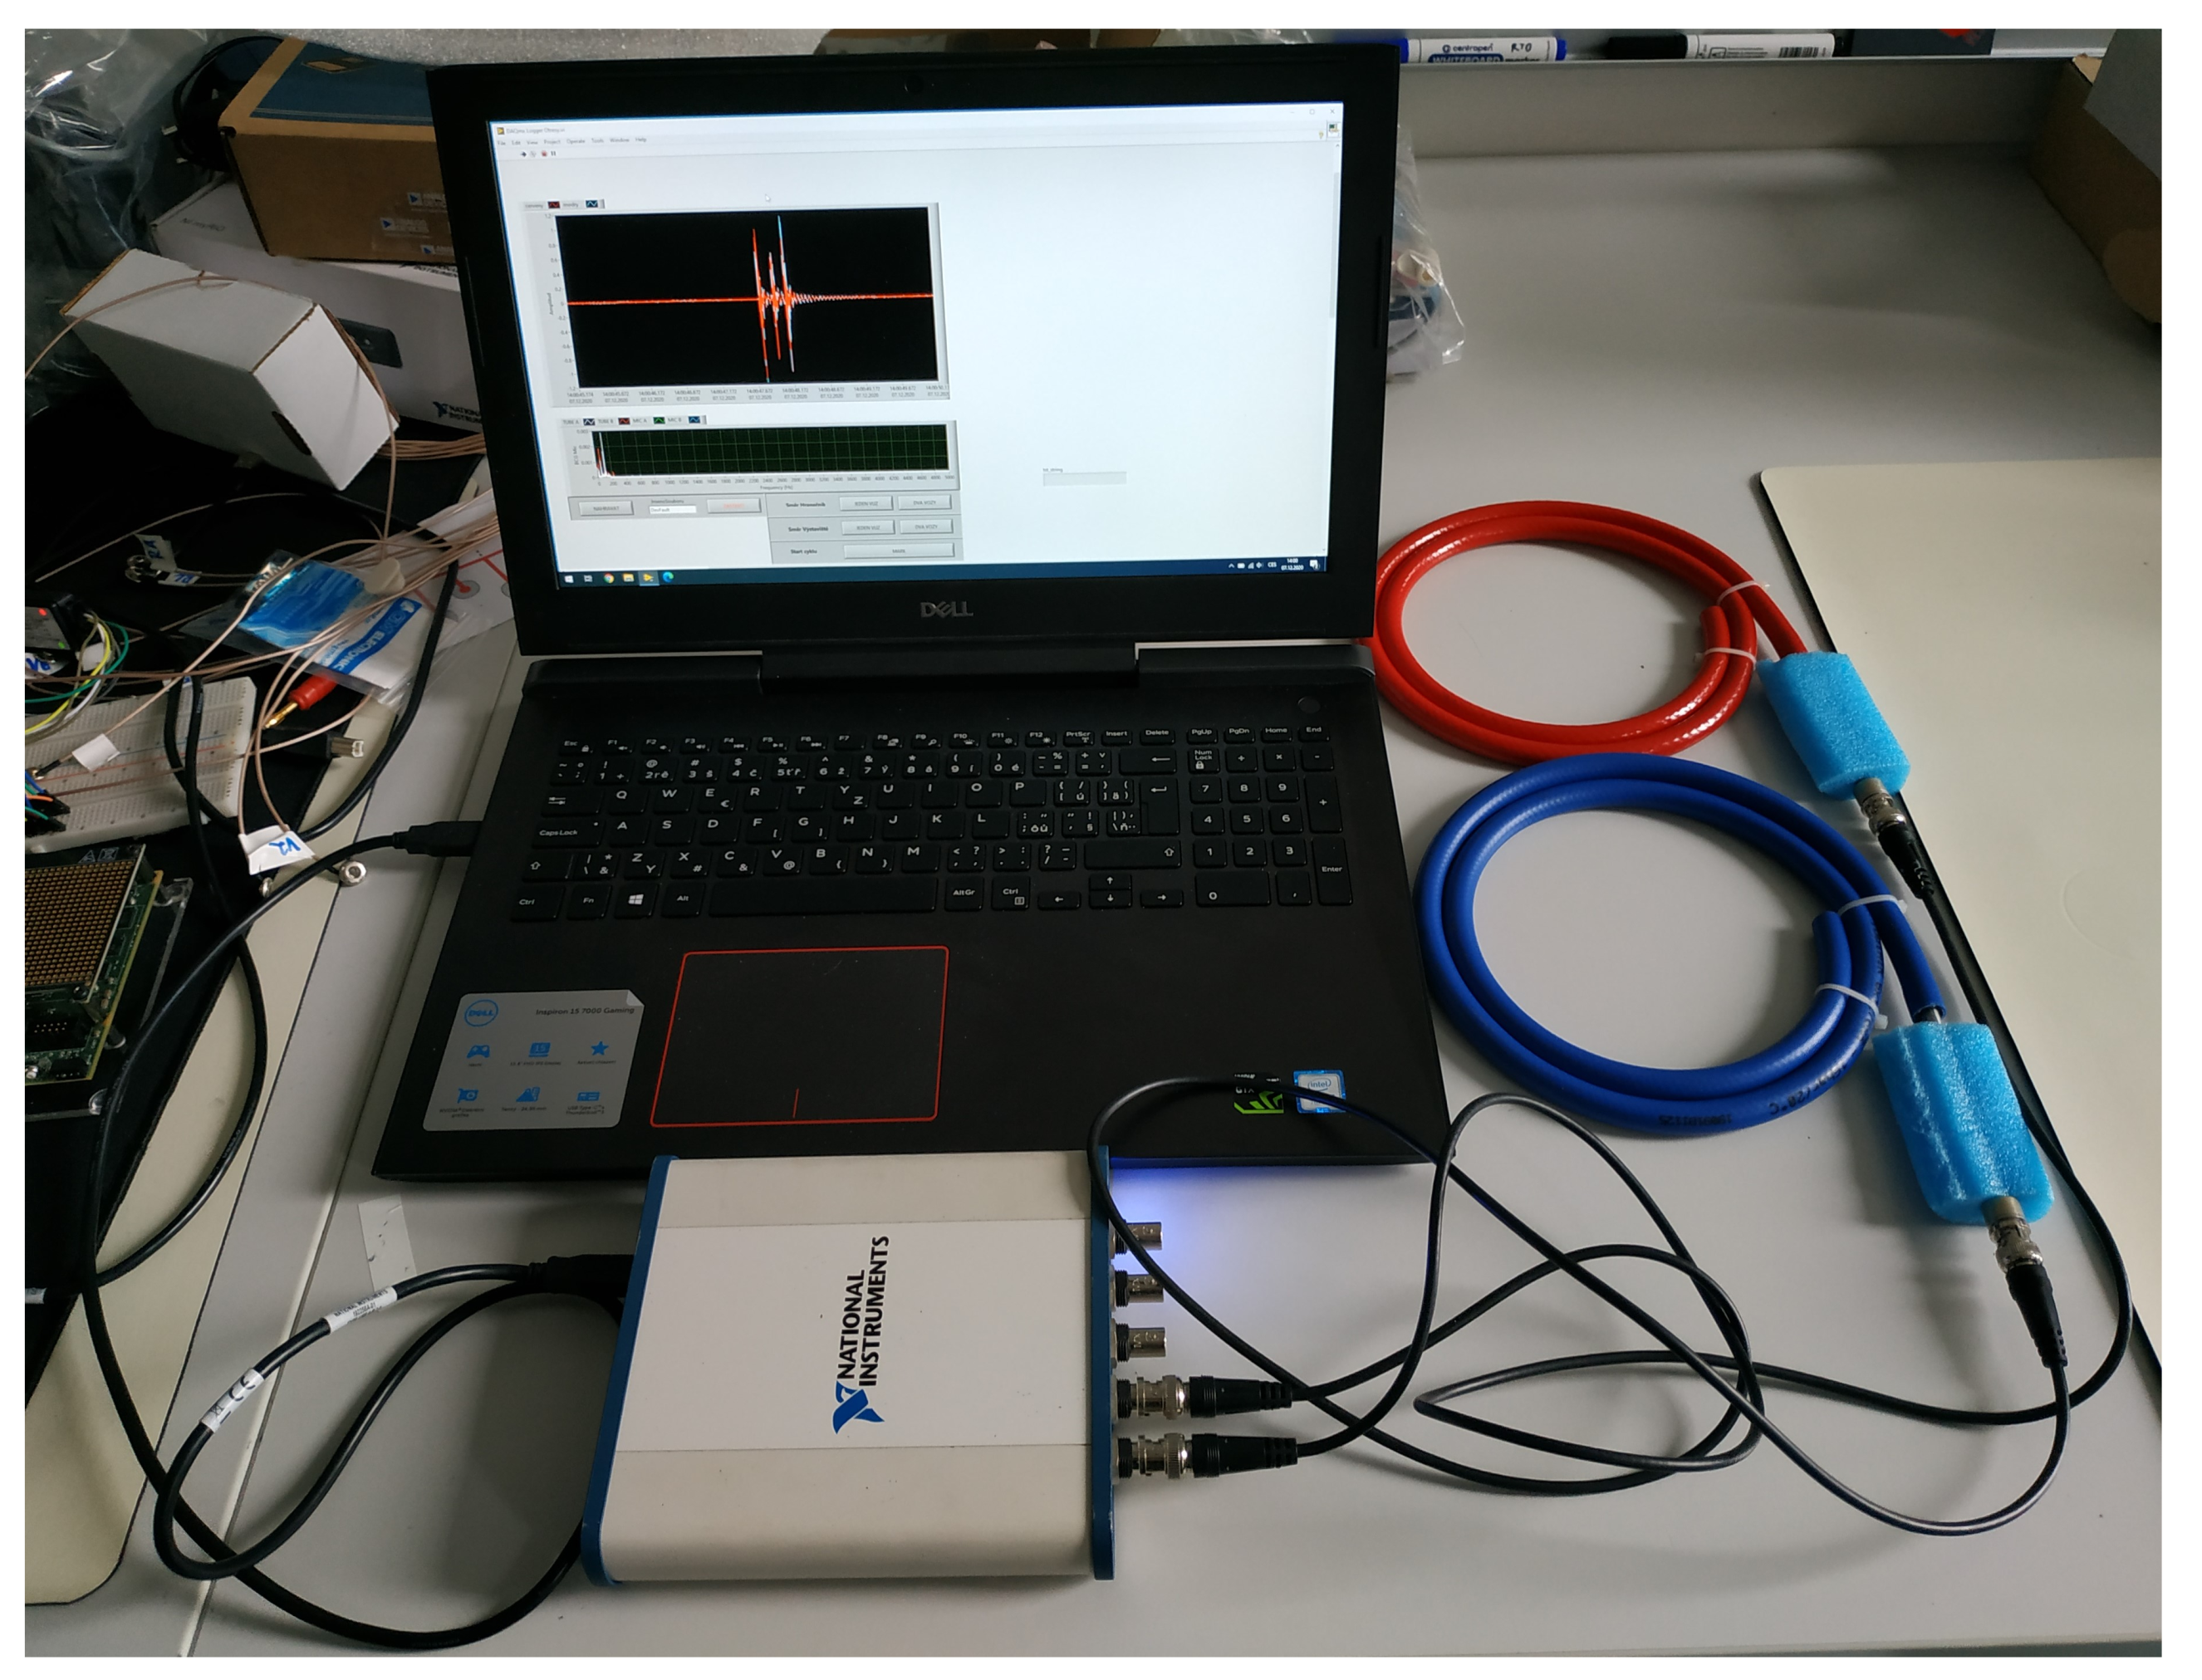
The radiation source is a narrow-spectrum laser diode operating at a wavelength of 1550 nm with an output power of 3 mW. An optical three-port circulator separating the forward and reverse directions is connected to the laser output. This circulator can be located just behind the diode, behind the connecting optical cable, or be a part of the sensor, but is typically located just behind the radiation source, thereby saving one fiber in the cable connecting the optoelectronics and the sensor itself. The sensor then consists only of a 3 × 3 coupling element with even ratio and a measuring and reference fiber terminated with fiber mirrors, e.g., Newport F-FRM. Three output signals are fed to InGaAs photodetectors, the electrical output of which is connected to a measuring card (A/D converter). The ADC used is the 9222 module in the cDAQ-9181 chassis made by National Instruments. The signals are further processed by software (passive demodulation, filtering, spectral analysis).
The sensor design incorporates a waterproof aluminum box measuring 253 × 159 × 72 mm. A three-meter single-mode fiber in primary protection was affixed to the bottom of the box using epoxy resin (hard material with a high Young’s modulus of elasticity, for good vibration transmission). Shorter fiber lengths provide lower sensitivity, while longer lengths limit the lower cut-off frequency of the sensor due to the still present slow drift of the sensors. The drift comes from several imperfections, such as finite polarization extinction ratio of passive optical components and fibers, radiation source wavelength stability but mainly due to the small temporal variation of temperature. The length of three meters is the compromise value for both. A vertical vibration then uniformly applies mechanical stress perpendicular to the fiber axis. A reference arm of the same length and a fiber coupler were then loosely placed in the acoustic insulating foam to minimize the transmission of vertical vibrations to the other arm [
36]; in addition, this arm was made in a higher degree of protection with a 3 mm jacket further reducing the amount of vibration affecting the fiber length and core refractive index. Optical connectors for connecting the optical cable or fibers were built into the front panel. An example of the complete connection of the Fiber-optic interferometric system is shown in
Figure 3.
3.3. Pneumatic System Being Developed for Seismic Monitoring
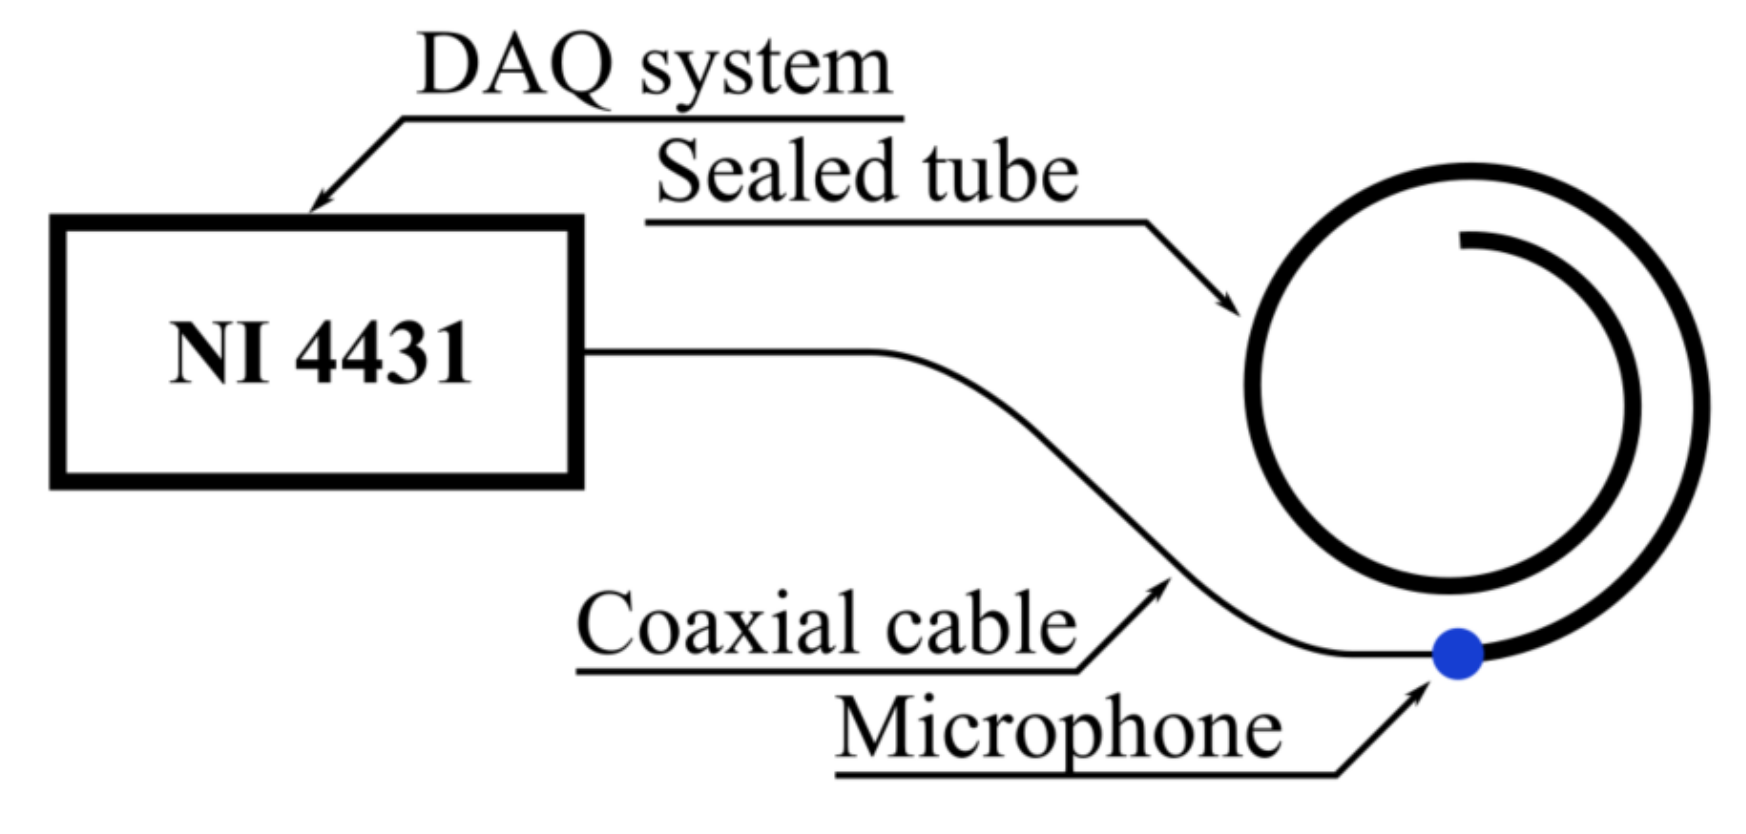
The device works as a converter of mechanical vibrations propagated by the surrounding material to a change in the sound pressure, which is sensed by a pressure sensor. The device consists of a flexible polyvinyl chloride (PVC) tube, which is in direct contact with a pad through which the desired signal is propagated. The tube is sealed on both sides, specifically with a microphone on one side and a seal on the other one. The surface of the tube acts as a membrane that is dilated by seismic/mechanical waves, thus changing the volume of the tube. A system sealed in this manner has, at a constant temperature, a direct relationship between the volume and the pressure of the gas enclosed within the tube, so this system works as a converter of physical quantities (
Figure 4).
This system is resistant to ambient acoustic interference. According to the previous experiment in which the signal inside and outside the tube was sensed, the measurement showed that the attenuation of the signal measured with a wobble frequency of up to 2.5 kHz was 20 to 40 dB [
37]. Furthermore, it was found that despite the self-supporting PVC pipes, there were changes in the measured signal due to sudden changes in the ambient pressure, e.g., when opening the doors or windows. In the case of industrial use, it would be necessary to bury this sensor, cover it with sand or place it in a box with a constant pressure to prevent the influence of changes in the ambient pressure on the measured signal. These error signals appear to be short-term extremes, but in the case of evaluating seismic activity at critical points, they could be evaluated as a hazardous condition.
Previous experiments have also confirmed that this system measures more easily mechanical vibration propagated through materials with acoustic impedance similar to the tube material rather than through ambient air. In the case of using a material with similar acoustic impedance, this results in minimal reflection of the passing wave and the highest signal gain.
Due to its low construction costs, the measuring system is suitable for outdoor use or for incorporation into the building structure. The sensitive part of the measuring system, a soft tube with the advantage of a PVC material, is resistant to electromagnetic influences, mechanical and chemical damage, so it can be used even in places where standard sensors could be harmed or affected. An example of the complete connection of the pneumatic system is shown in
Figure 5.
4. Experimental Setup
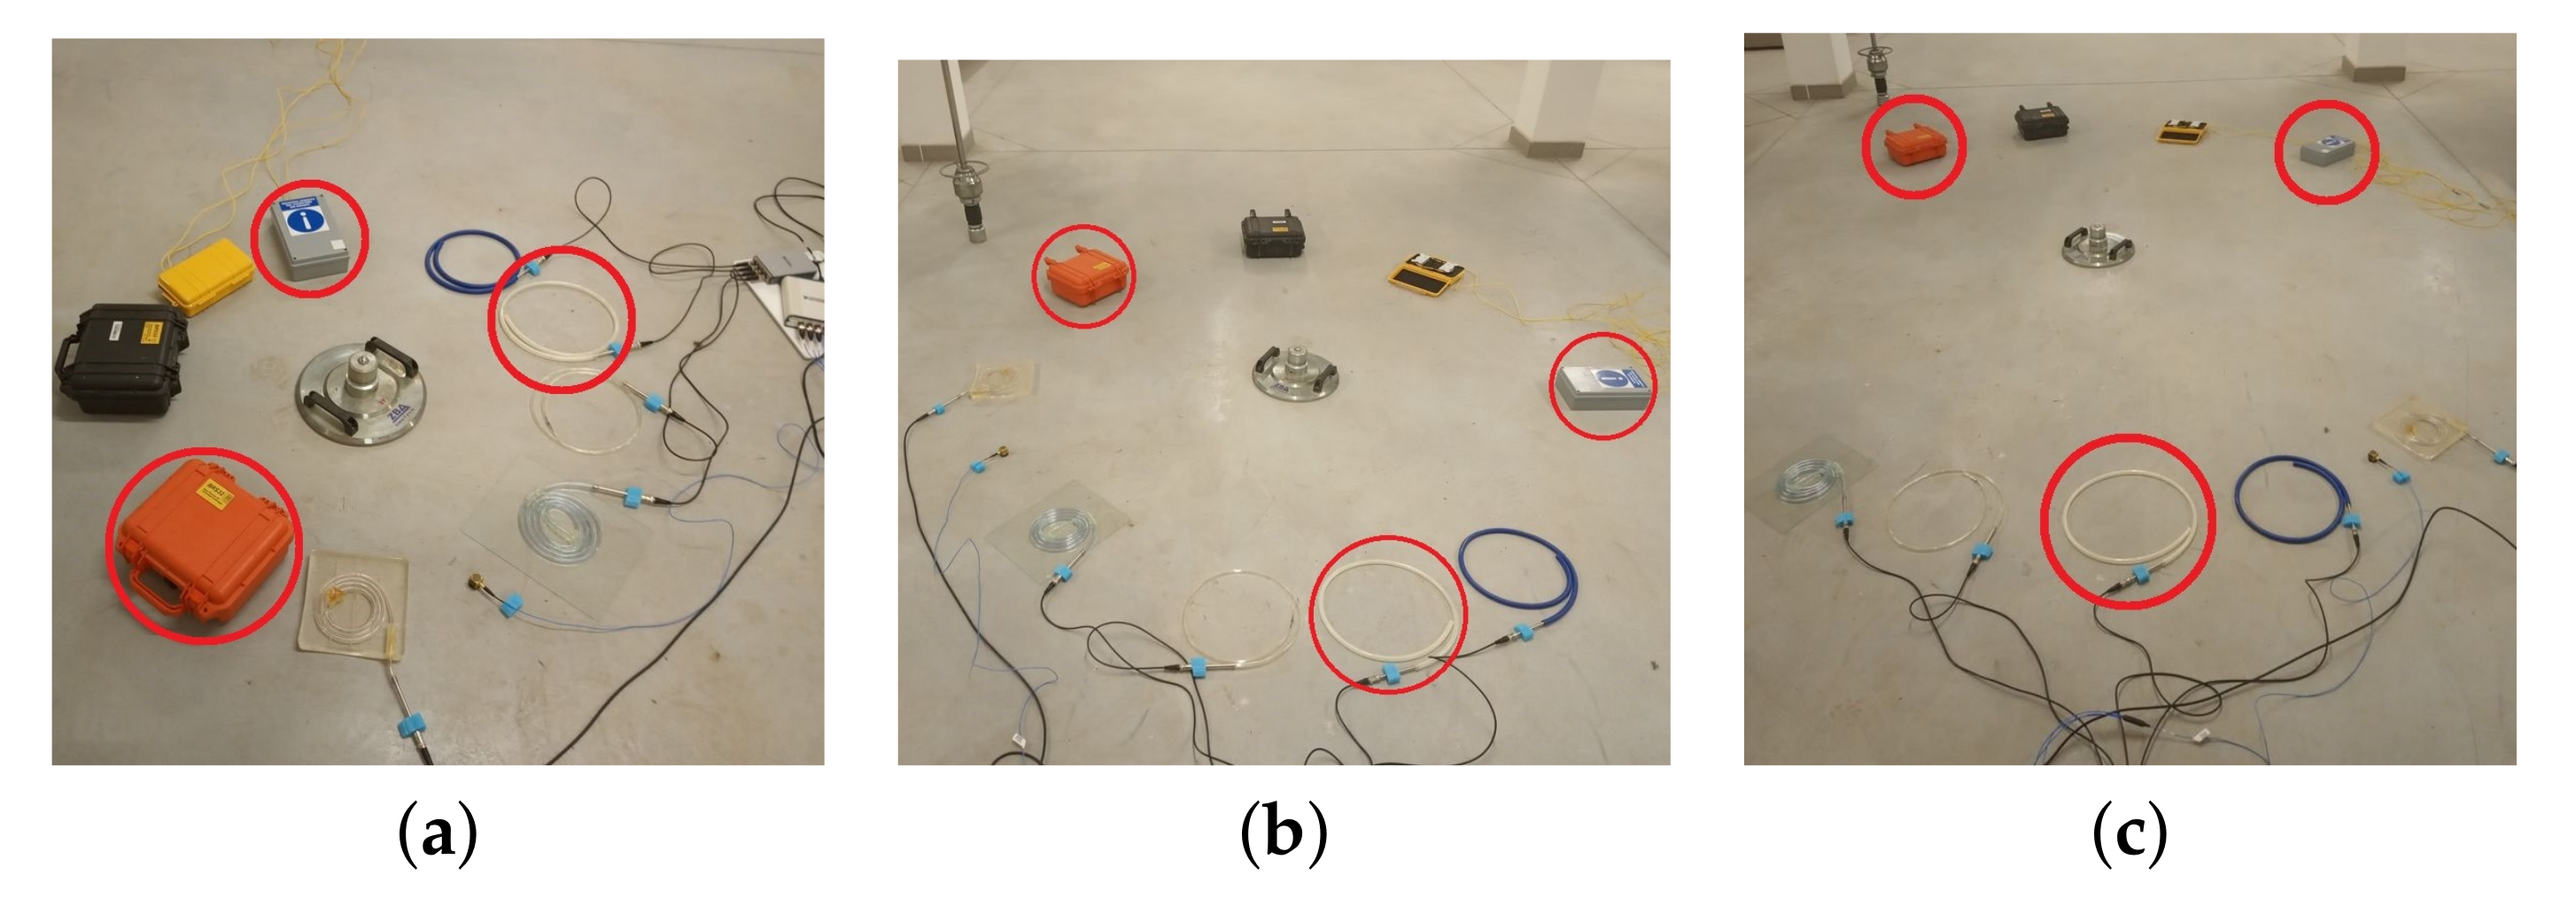
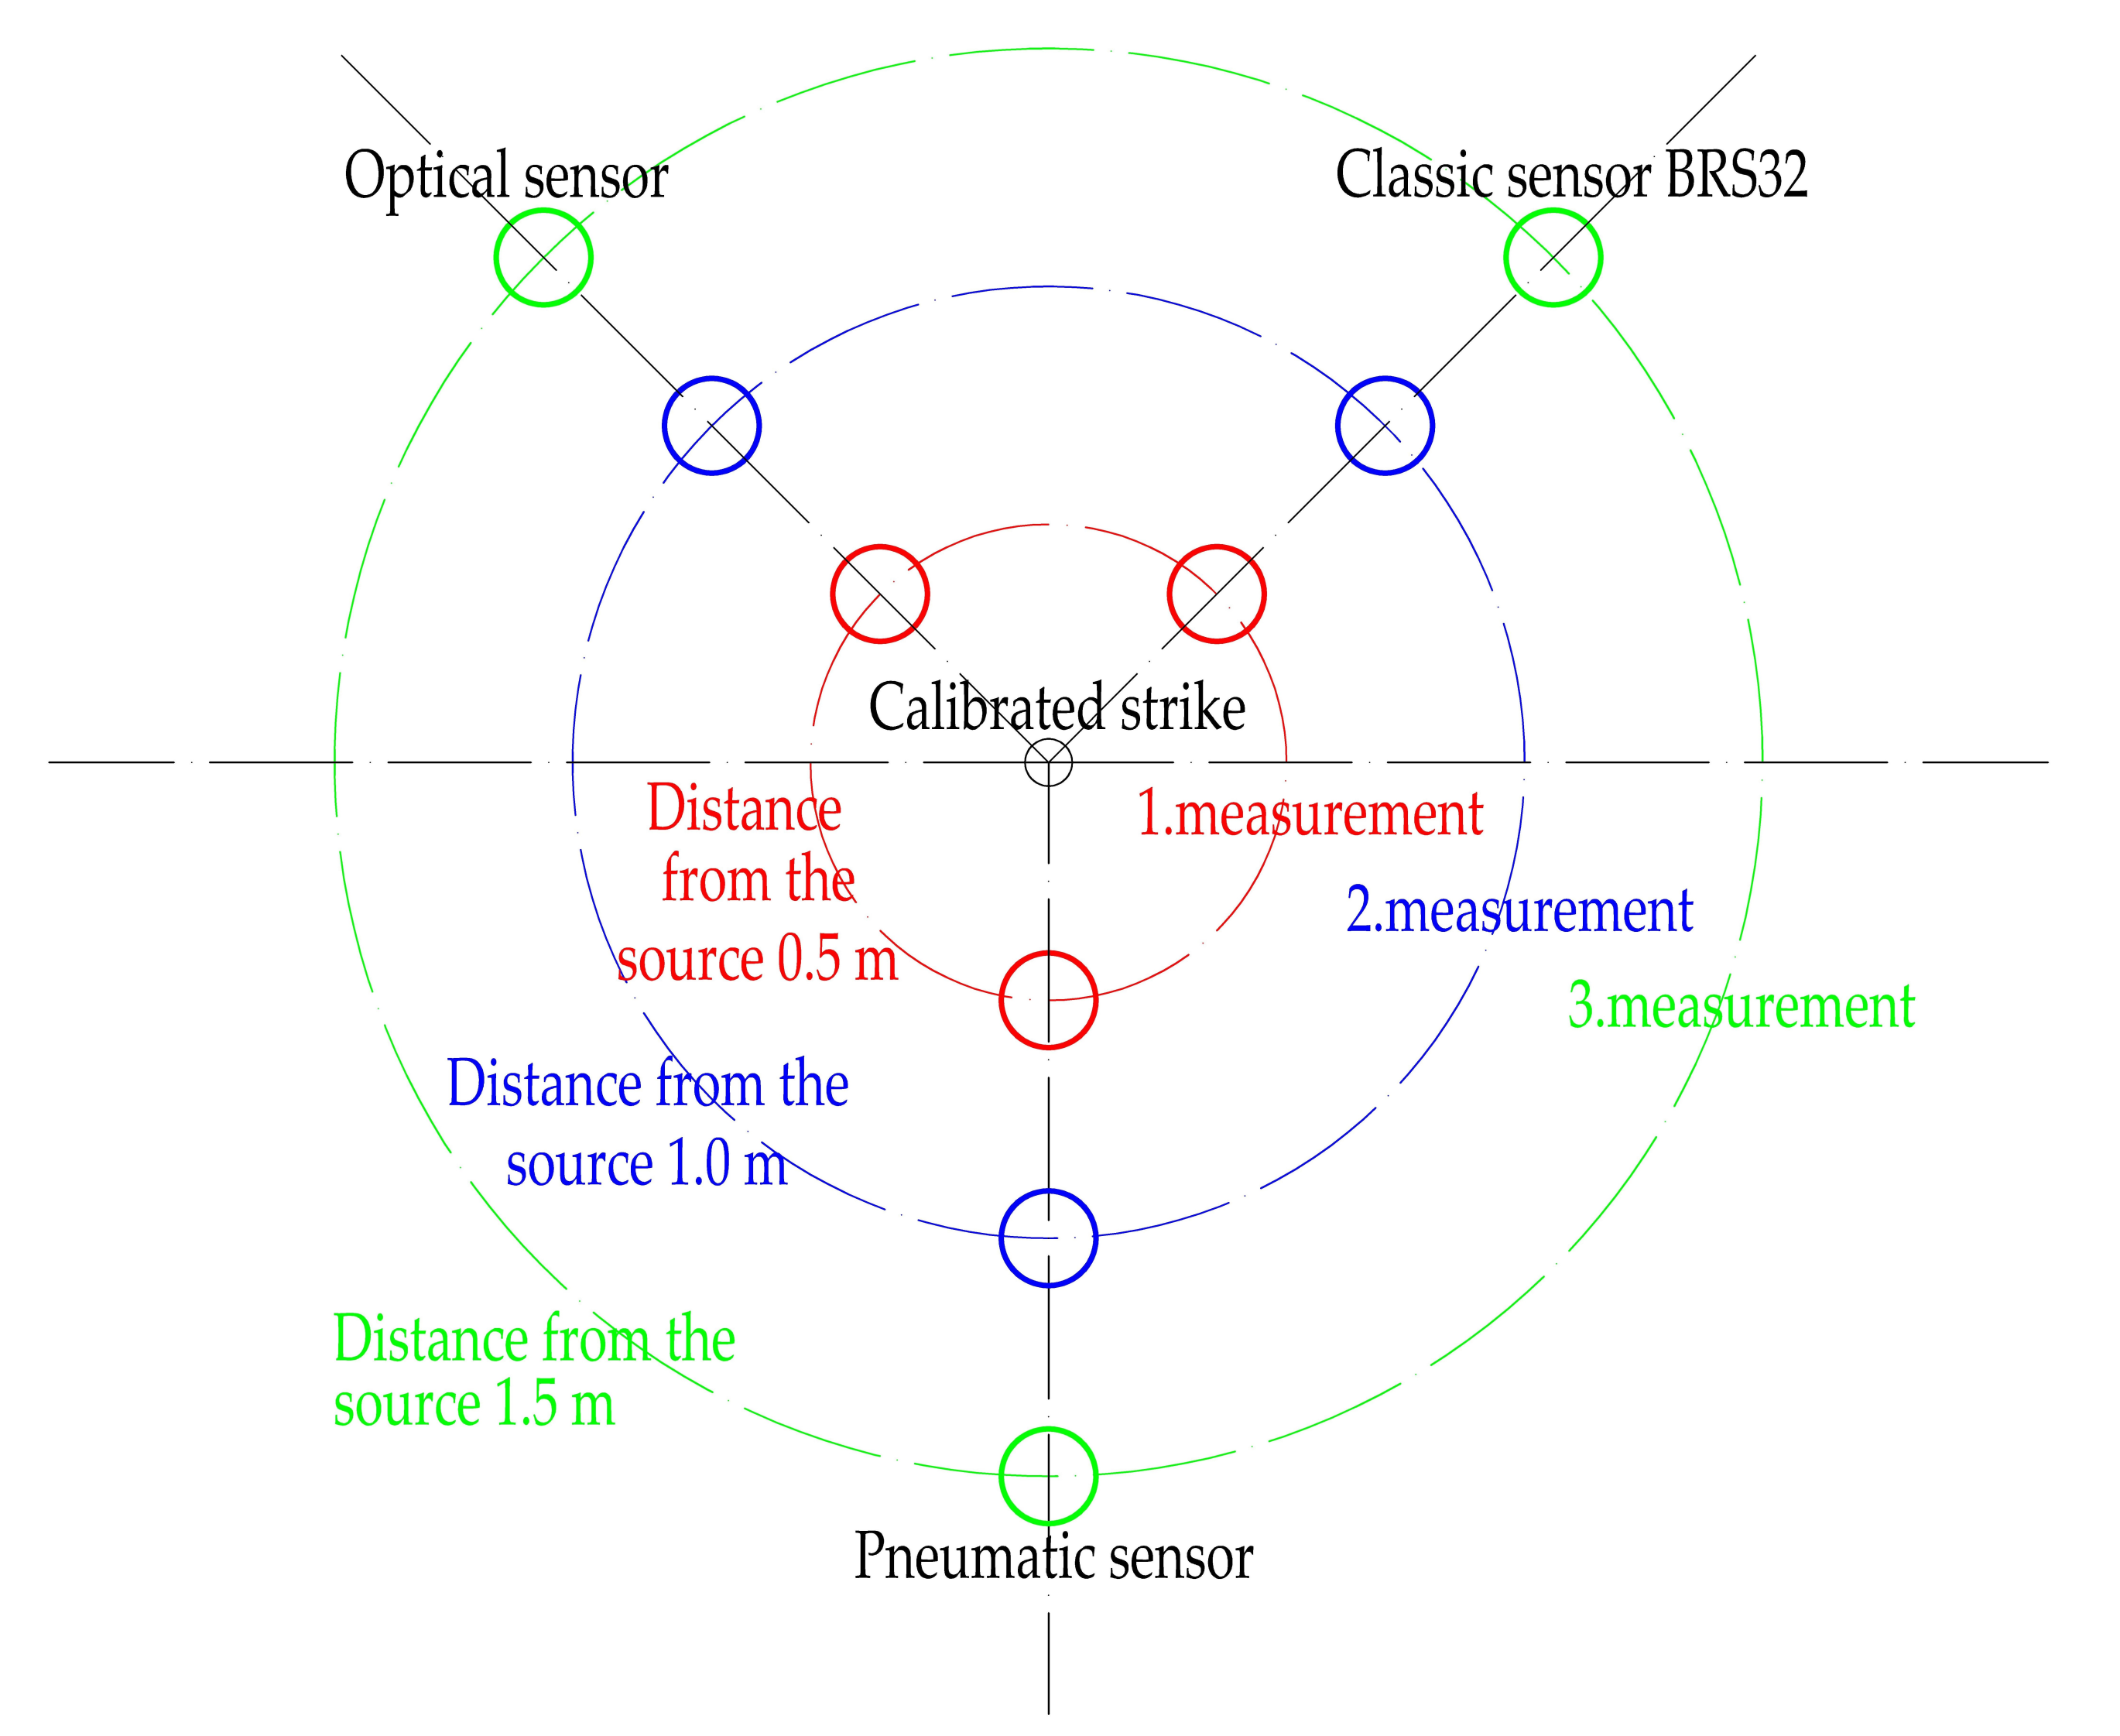
The experiment was conducted in the heavy laboratories of the Faculty of Civil Engineering, VSB-Technical University of Ostrava, on a massive, poured concrete floor in the basement of the building. Two BRS32 seismic stations, two experimentally developed interferometers for vibration measurement, five pneumatic sensors and one tri-axial accelerometer were used throughout the experiment (not all results from all devices from this comparative measurement are presented in this paper). For further processing, for the purposes of this publication, data from only one BRS32 seismic station, one interferometric sensor and one pneumatic sensor (marked in red) were used. The distance of the sensors from the source of the calibrated stroke was 0.5 m (
Figure 6a), or 1.0 m (
Figure 6b), or 1.5 m (
Figure 6c). The diagram of the entire calibration experiment is shown in
Figure 7.
The source of the calibrated stroke consisted of a drop weight weighing 10 kg and falling from a height of 0.7 m on a circular impact plate with a diameter of 0.3 m and a weight of 5 kg. The induced impulse of force of the weight is 7.1 kN and the duration of the impulse is 45 ms.
In each stage of the measurement, at a distance of 0.5 m to 1.5 m, 100 strokes were performed. A time delay of at least 5 s was allowed between each stroke. After each stroke, the recordings from the experimental sensors were stored and marked with the appropriate time according to GPS for the purpose of unambiguous identification. The BRS32 seismic station was started in a continuous recording mode, which is synchronized with GPS.
5. Results of Experiments
In the following section, the results from experimental measurements in the time domain, which were obtained both from the BRS32 seismic station and from both sensory devices being developed, will be presented and described in detail.
Figure 8 shows a time recording of the calibrated stroke at a distance of 1 m from the BRS32 seismic station. The horizontal axis represents GPS time, while the vertical axis represents amplitude of the oscillation velocity [mm.s
−1]. A calibrated stroke was recorded at time “T”. After a rapid and sharp increase to the maximum, there was very quick attenuation. This is a typical manifestation of such an isolated dynamic phenomenon in the time domain. In general, seismic station BRS32 records in three perpendicular directions (vertical, horizontal radial and horizontal transversal). The comparative experiment was simplified with dynamic impulse in vertical direction, in the near zone also we can expect the main dynamic response in vertical direction, thus only the vertical component was compared with experimentally developed devices.
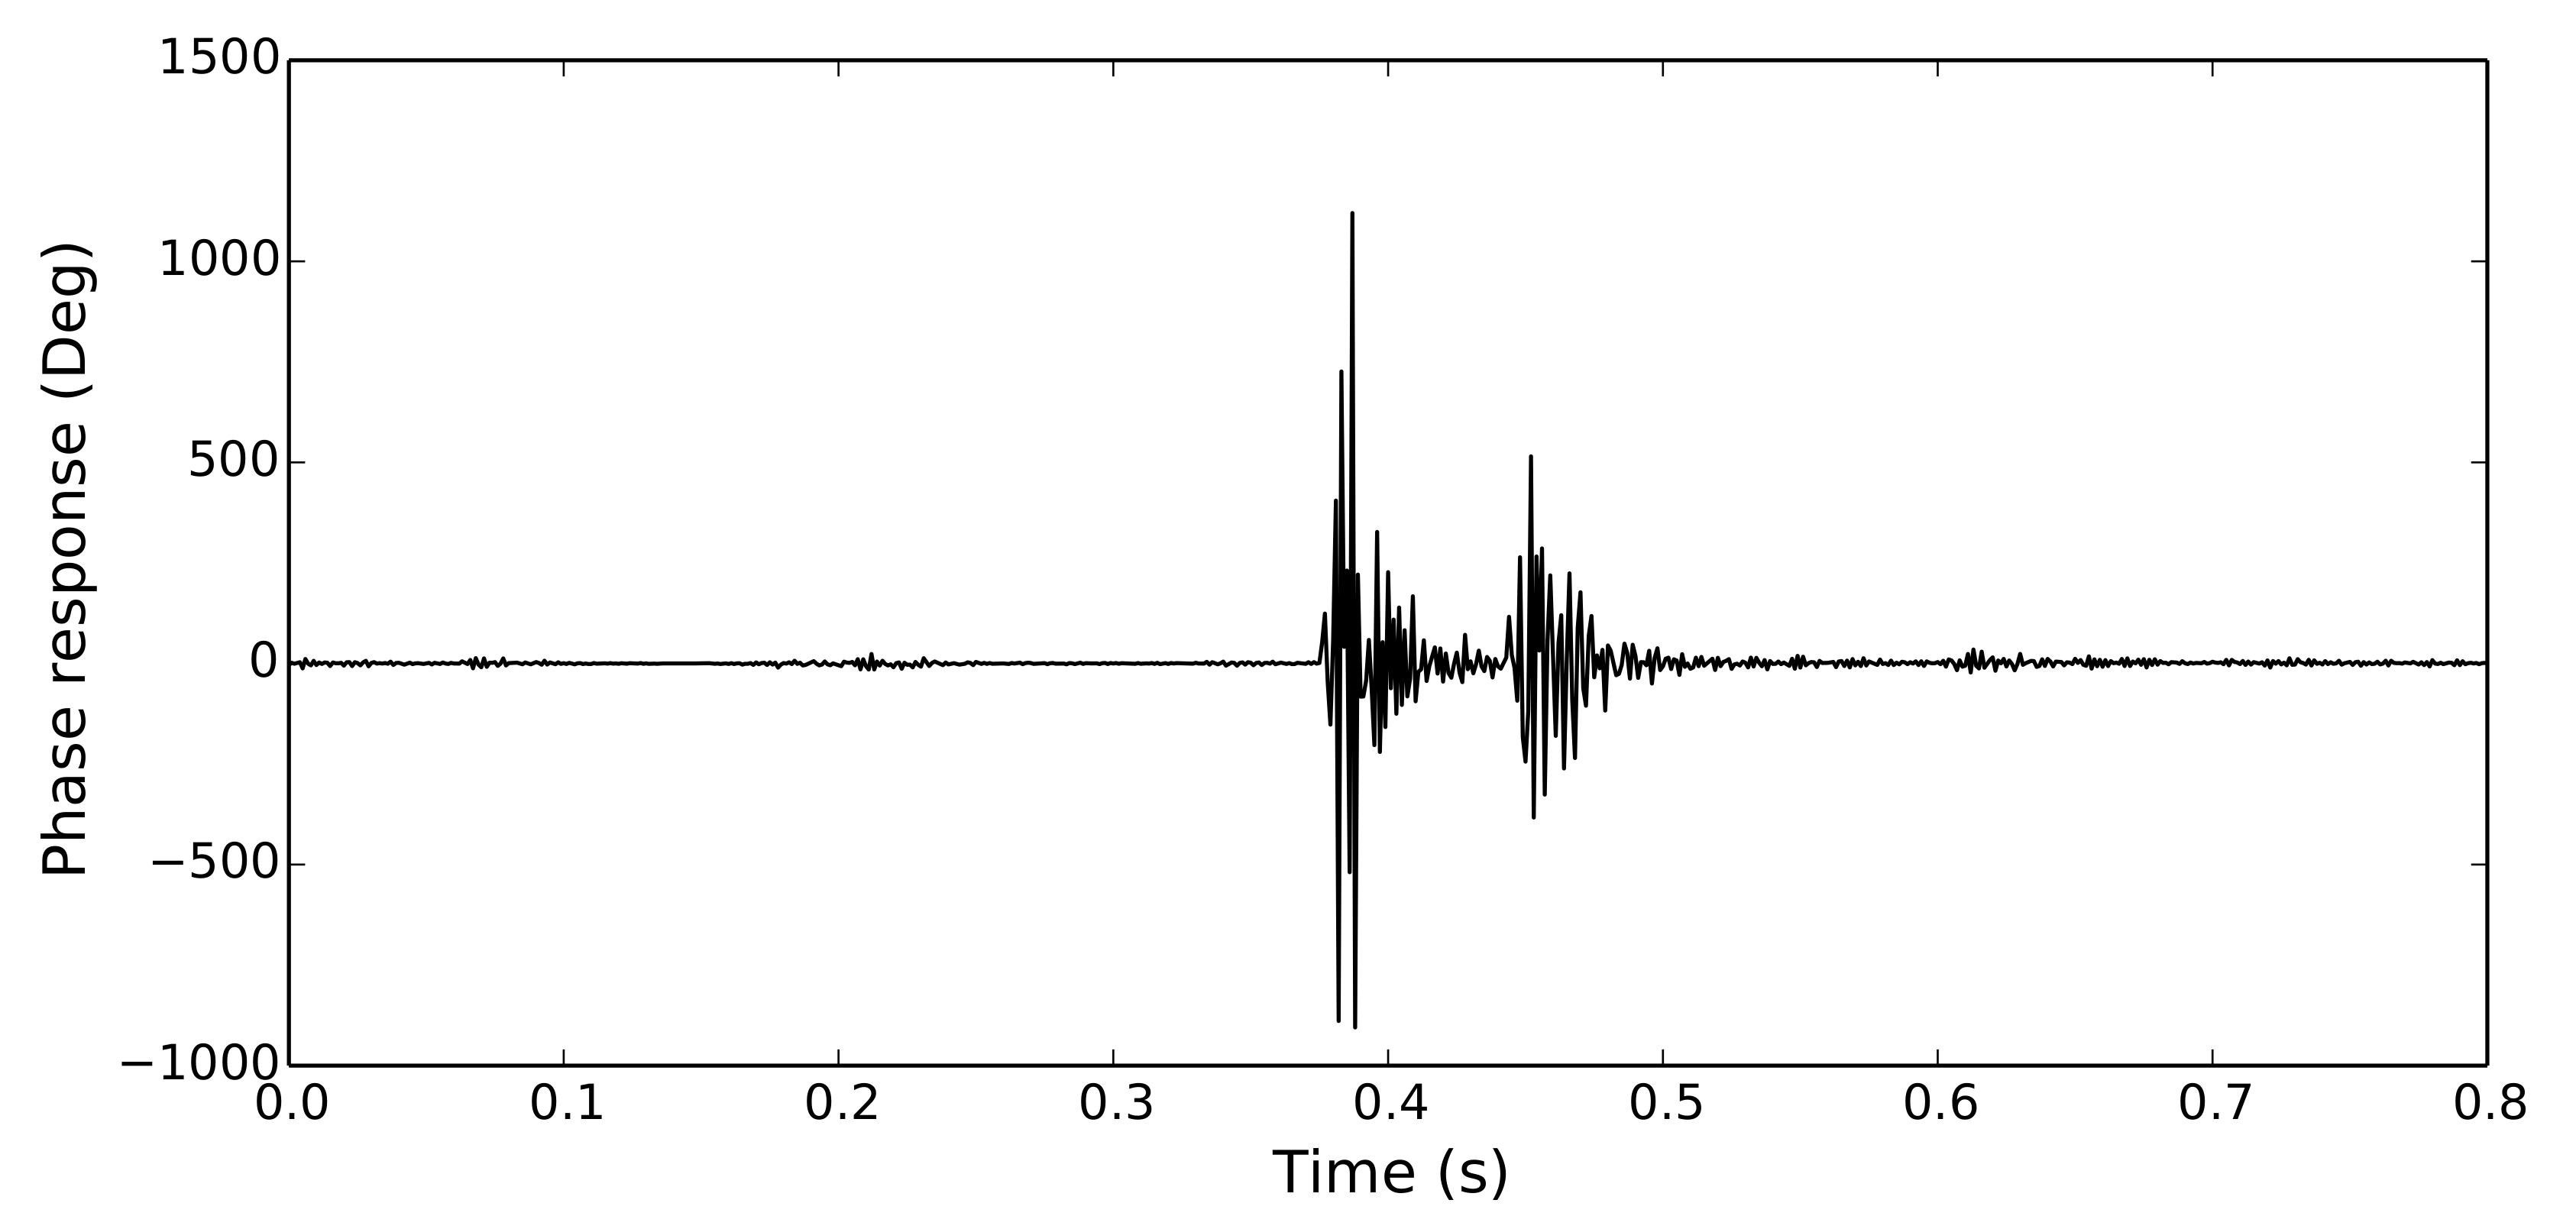
Figure 9 shows a time recording of one calibrated stroke at a distance of 1 m from the interferometric sensor being developed. The horizontal axis represents time, while the vertical axis represents phase response [Deg]. A calibrated stroke was recorded at time “T”. After a rapid and sharp increase to the maximum, there was very quick attenuation and at time T + 0.045 s a second impulse of a very similar nature was recorded, only with a lower maximum. The first maximum is a manifestation of the impact of the drop weight on the circular impact plate, the second maximum is a manifestation of the plate in contact with the concrete base. The time difference between the two maxima corresponds exactly to the impact time of the drop weight, which is 45 ms. This is a phenomenon that can be observed when placing the place on a relatively very rigid layer (e.g., a concrete floor). If the plate is placed on a less solid surface (e.g., soil) then the second maximum is significantly smaller.
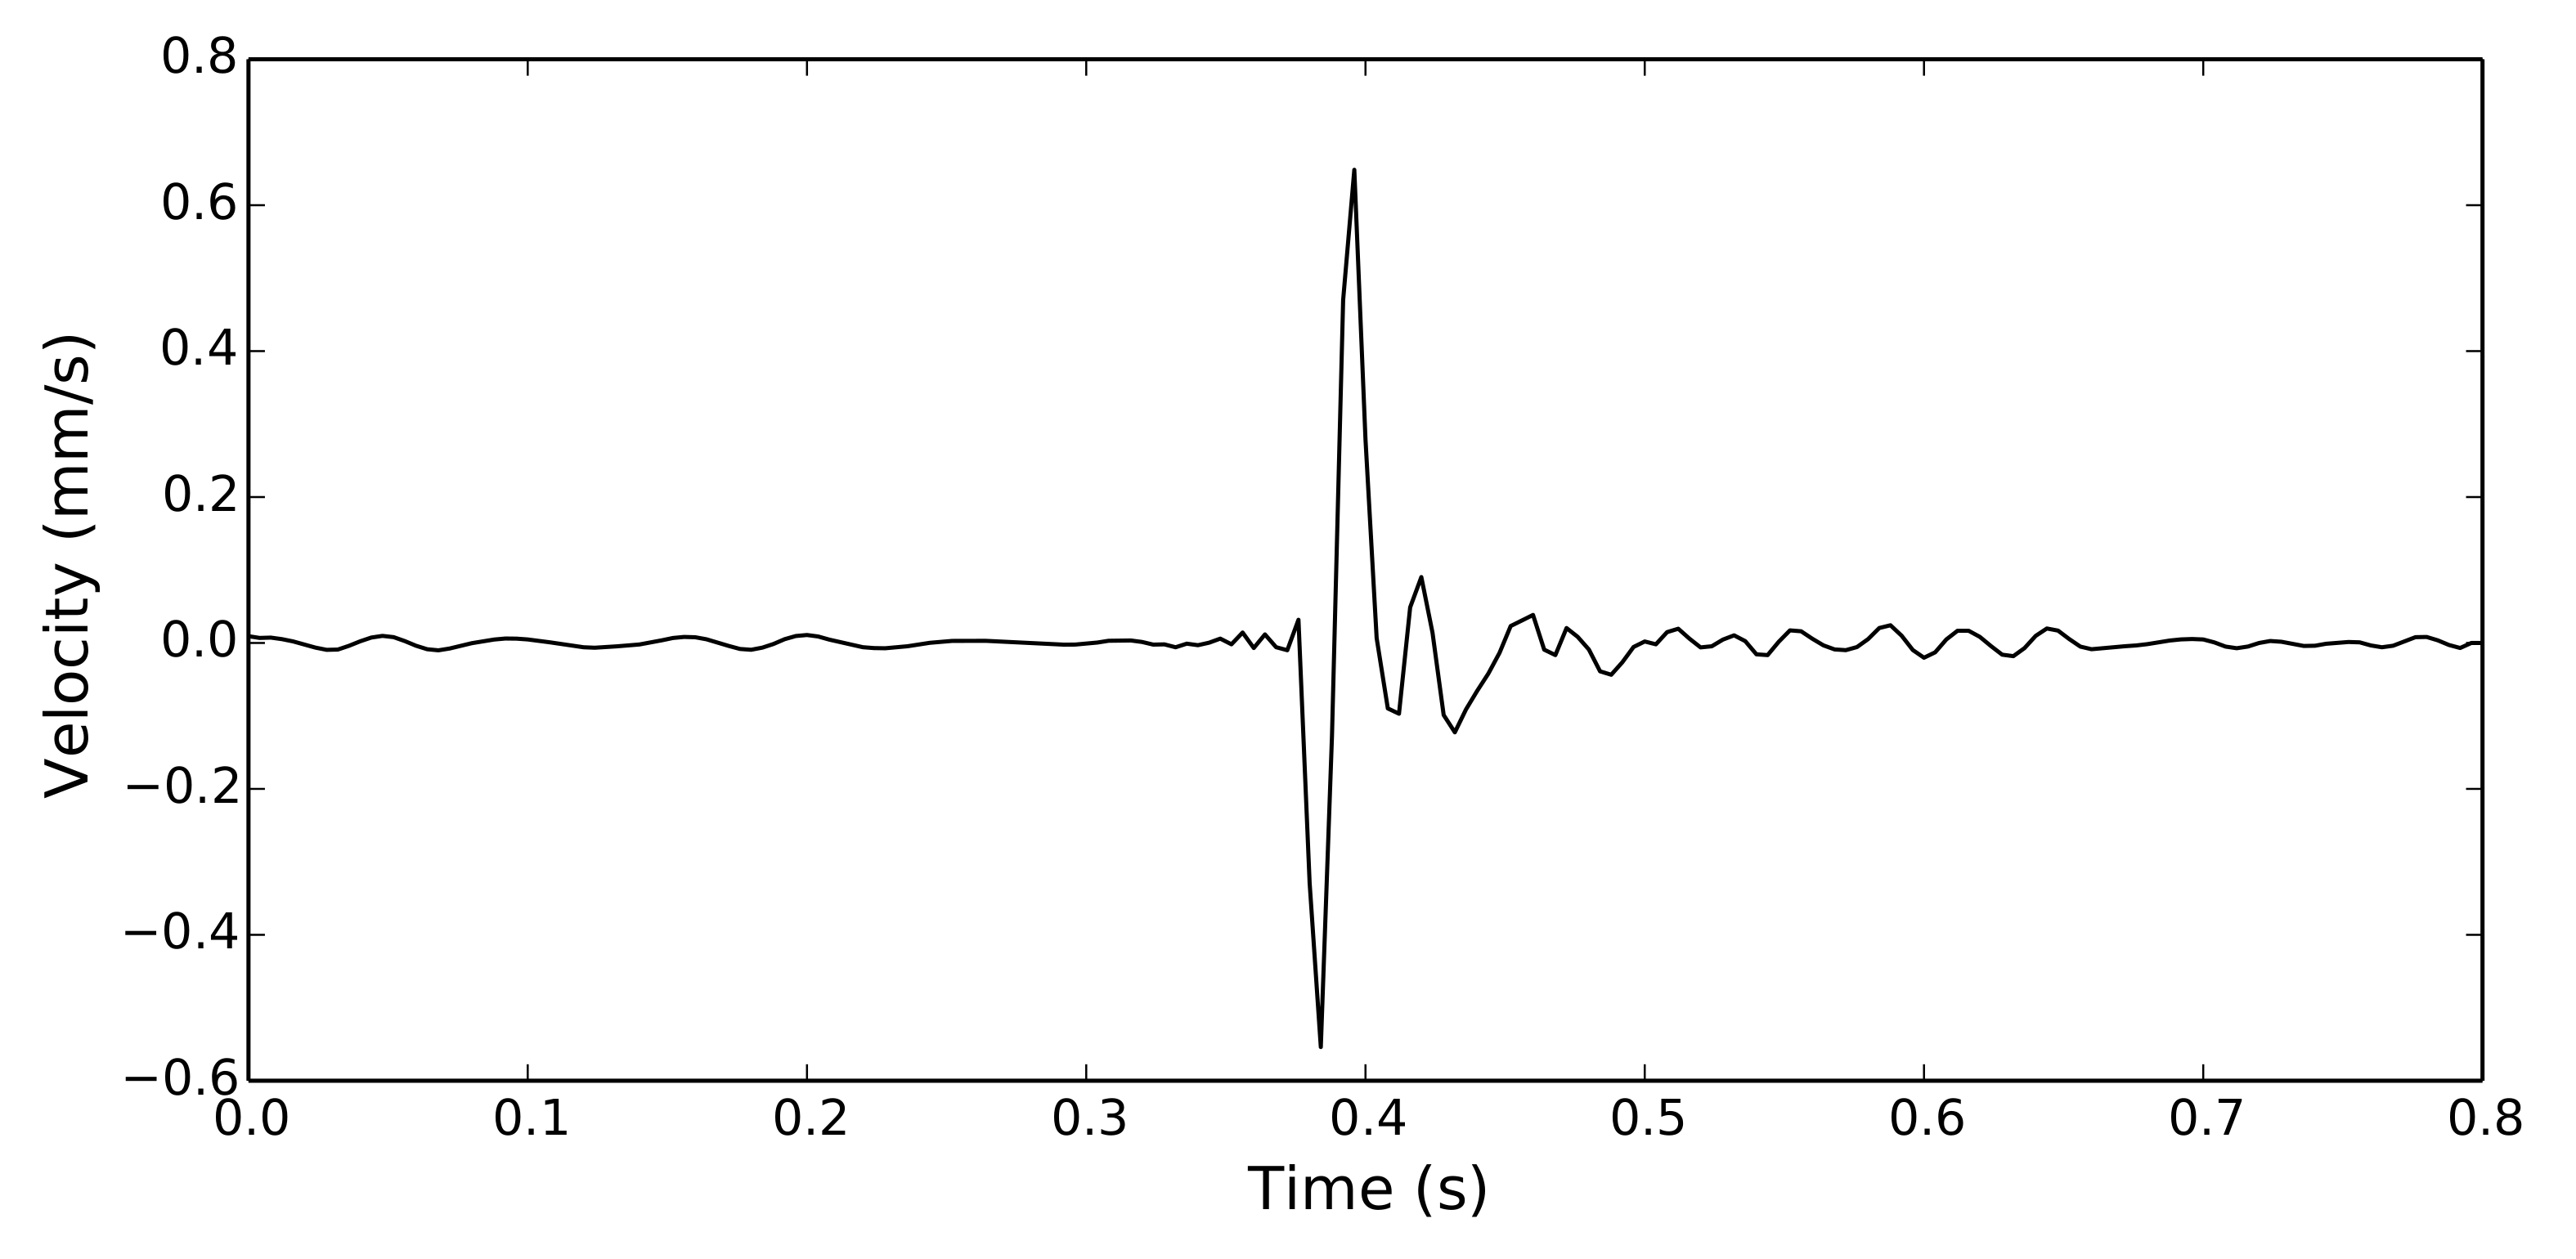
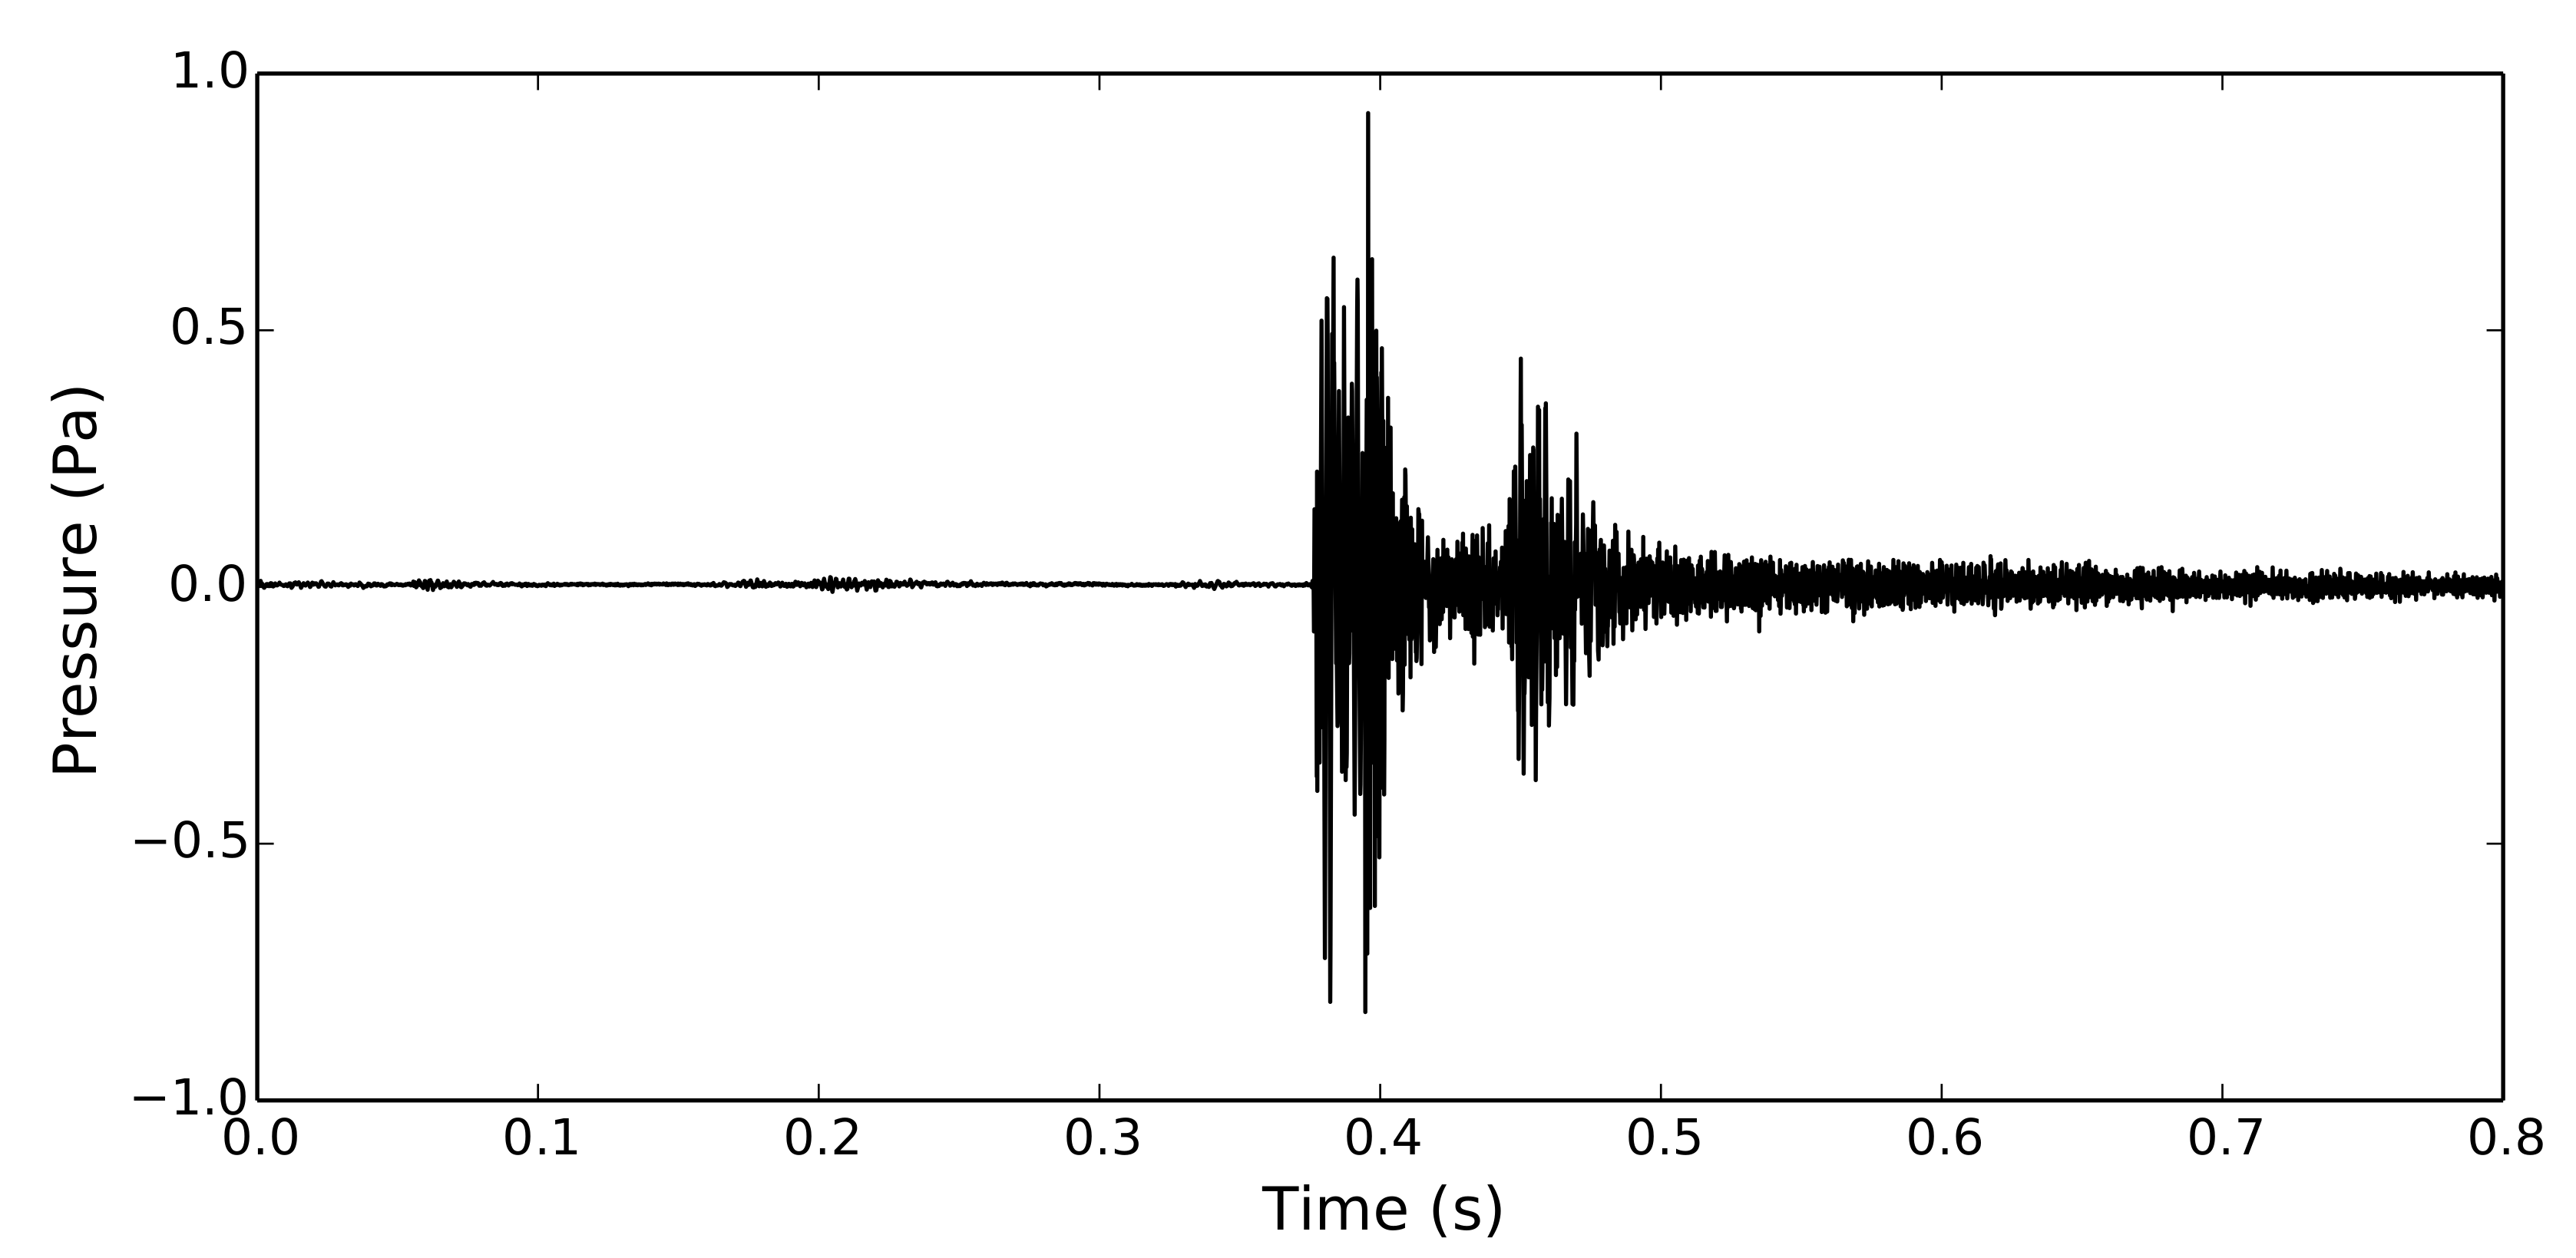
Figure 10 shows a time recording of one calibrated stroke at a distance of 1 m from the pneumatic sensor being developed. The horizontal axis represents time, while the vertical axis represents pressure [Pa]. A calibrated stroke was recorded at time “T”. After a rapid and sharp increase to the maximum, there was attenuation, but before the pulse was completely attenuated, so, at time T + 0.045 s, a second impulse of a very similar nature was recorded again, and again only with a lower maximum. The first maximum is, as with the interferometric sensor, a manifestation of the impact of the falling weight on the circular impact plate; only this manifestation was not so quickly attenuated, which is related to the construction of the pneumatic sensor; and the second maximum is again a manifestation of the plate in contact with the base. As with the previous recording, the time difference is 45 ms.
Time recordings from all 300 strokes at distances of 0.5 m, 1.0 m and 1.5 m were always of the same nature for the BRS32 seismic station as well as for both sensory devices being developed, both in terms of the length of each phenomenon and in terms of the size of the maxima. As the distance from the calibrated stroke increased, only the maxima measured decreased.
6. Basic Recalculation of Measured Values between Fiber-optic Interferometric Sensor and Pneumatic Sensor, Respectively and Seismic Station
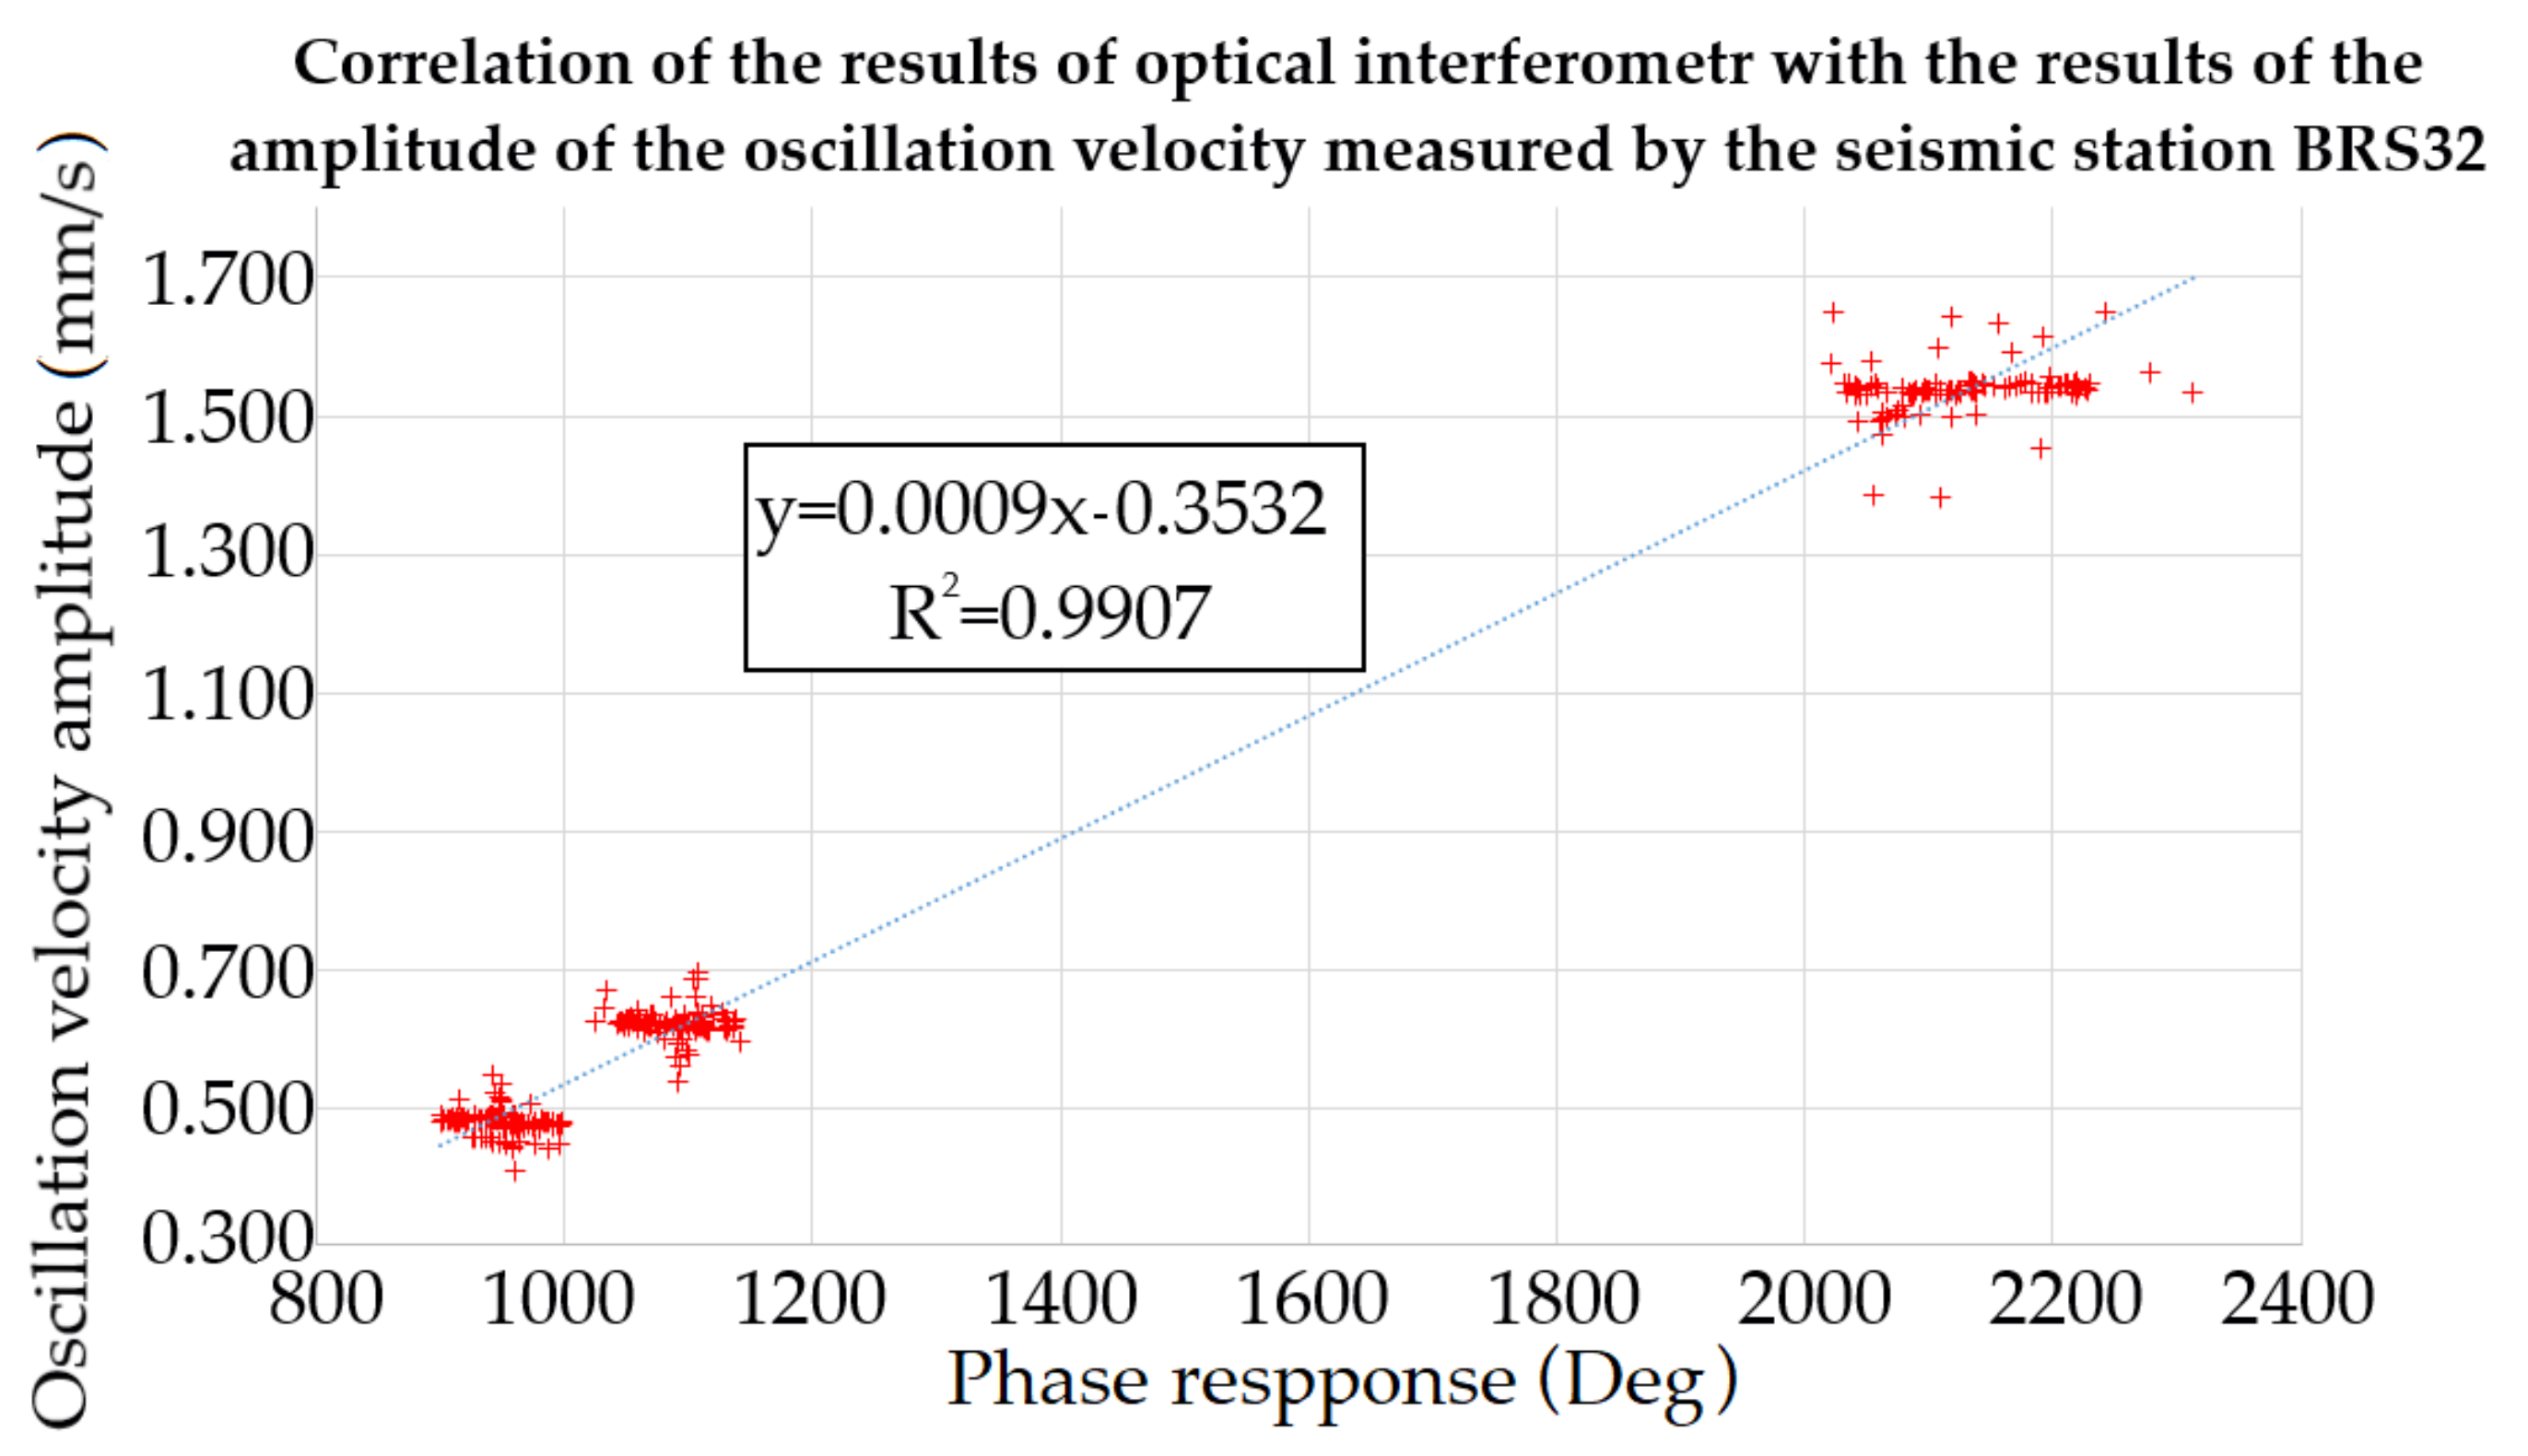
To the finding of the mathematical relationship between the values of optical measurement system and the oscillation velocity measurements, an analysis of the subsets of the measured data for each distance and each dynamic stroke was first performed. From each of the two corresponding partial recordings of the oscillation velocity and the phase response for a certain distance and a certain stroke, we obtain a pair of values, which correspond to the absolute maxima of these two recordings mentioned. Maxima are not exactly at the same time. This does not allow neither an environment of experiment, nor a completely different design of sensors working on other physical principles and with a different sampling frequency. By merging the results of the primarily processed subsets, we then receive a global set of results—maximum values obtained by optical measurement (independent variable in the regression analysis) and corresponding maximum absolute values of oscillation velocity (dependent variable in the regression function). Using the least squares method, the regression function with the highest coefficient of determination
, was determined. In this case, a linear regression function was the best:
v—amplitude of the oscillation velocity,
x—maximum phase response obtained from optical measurements,
a, b—constants.
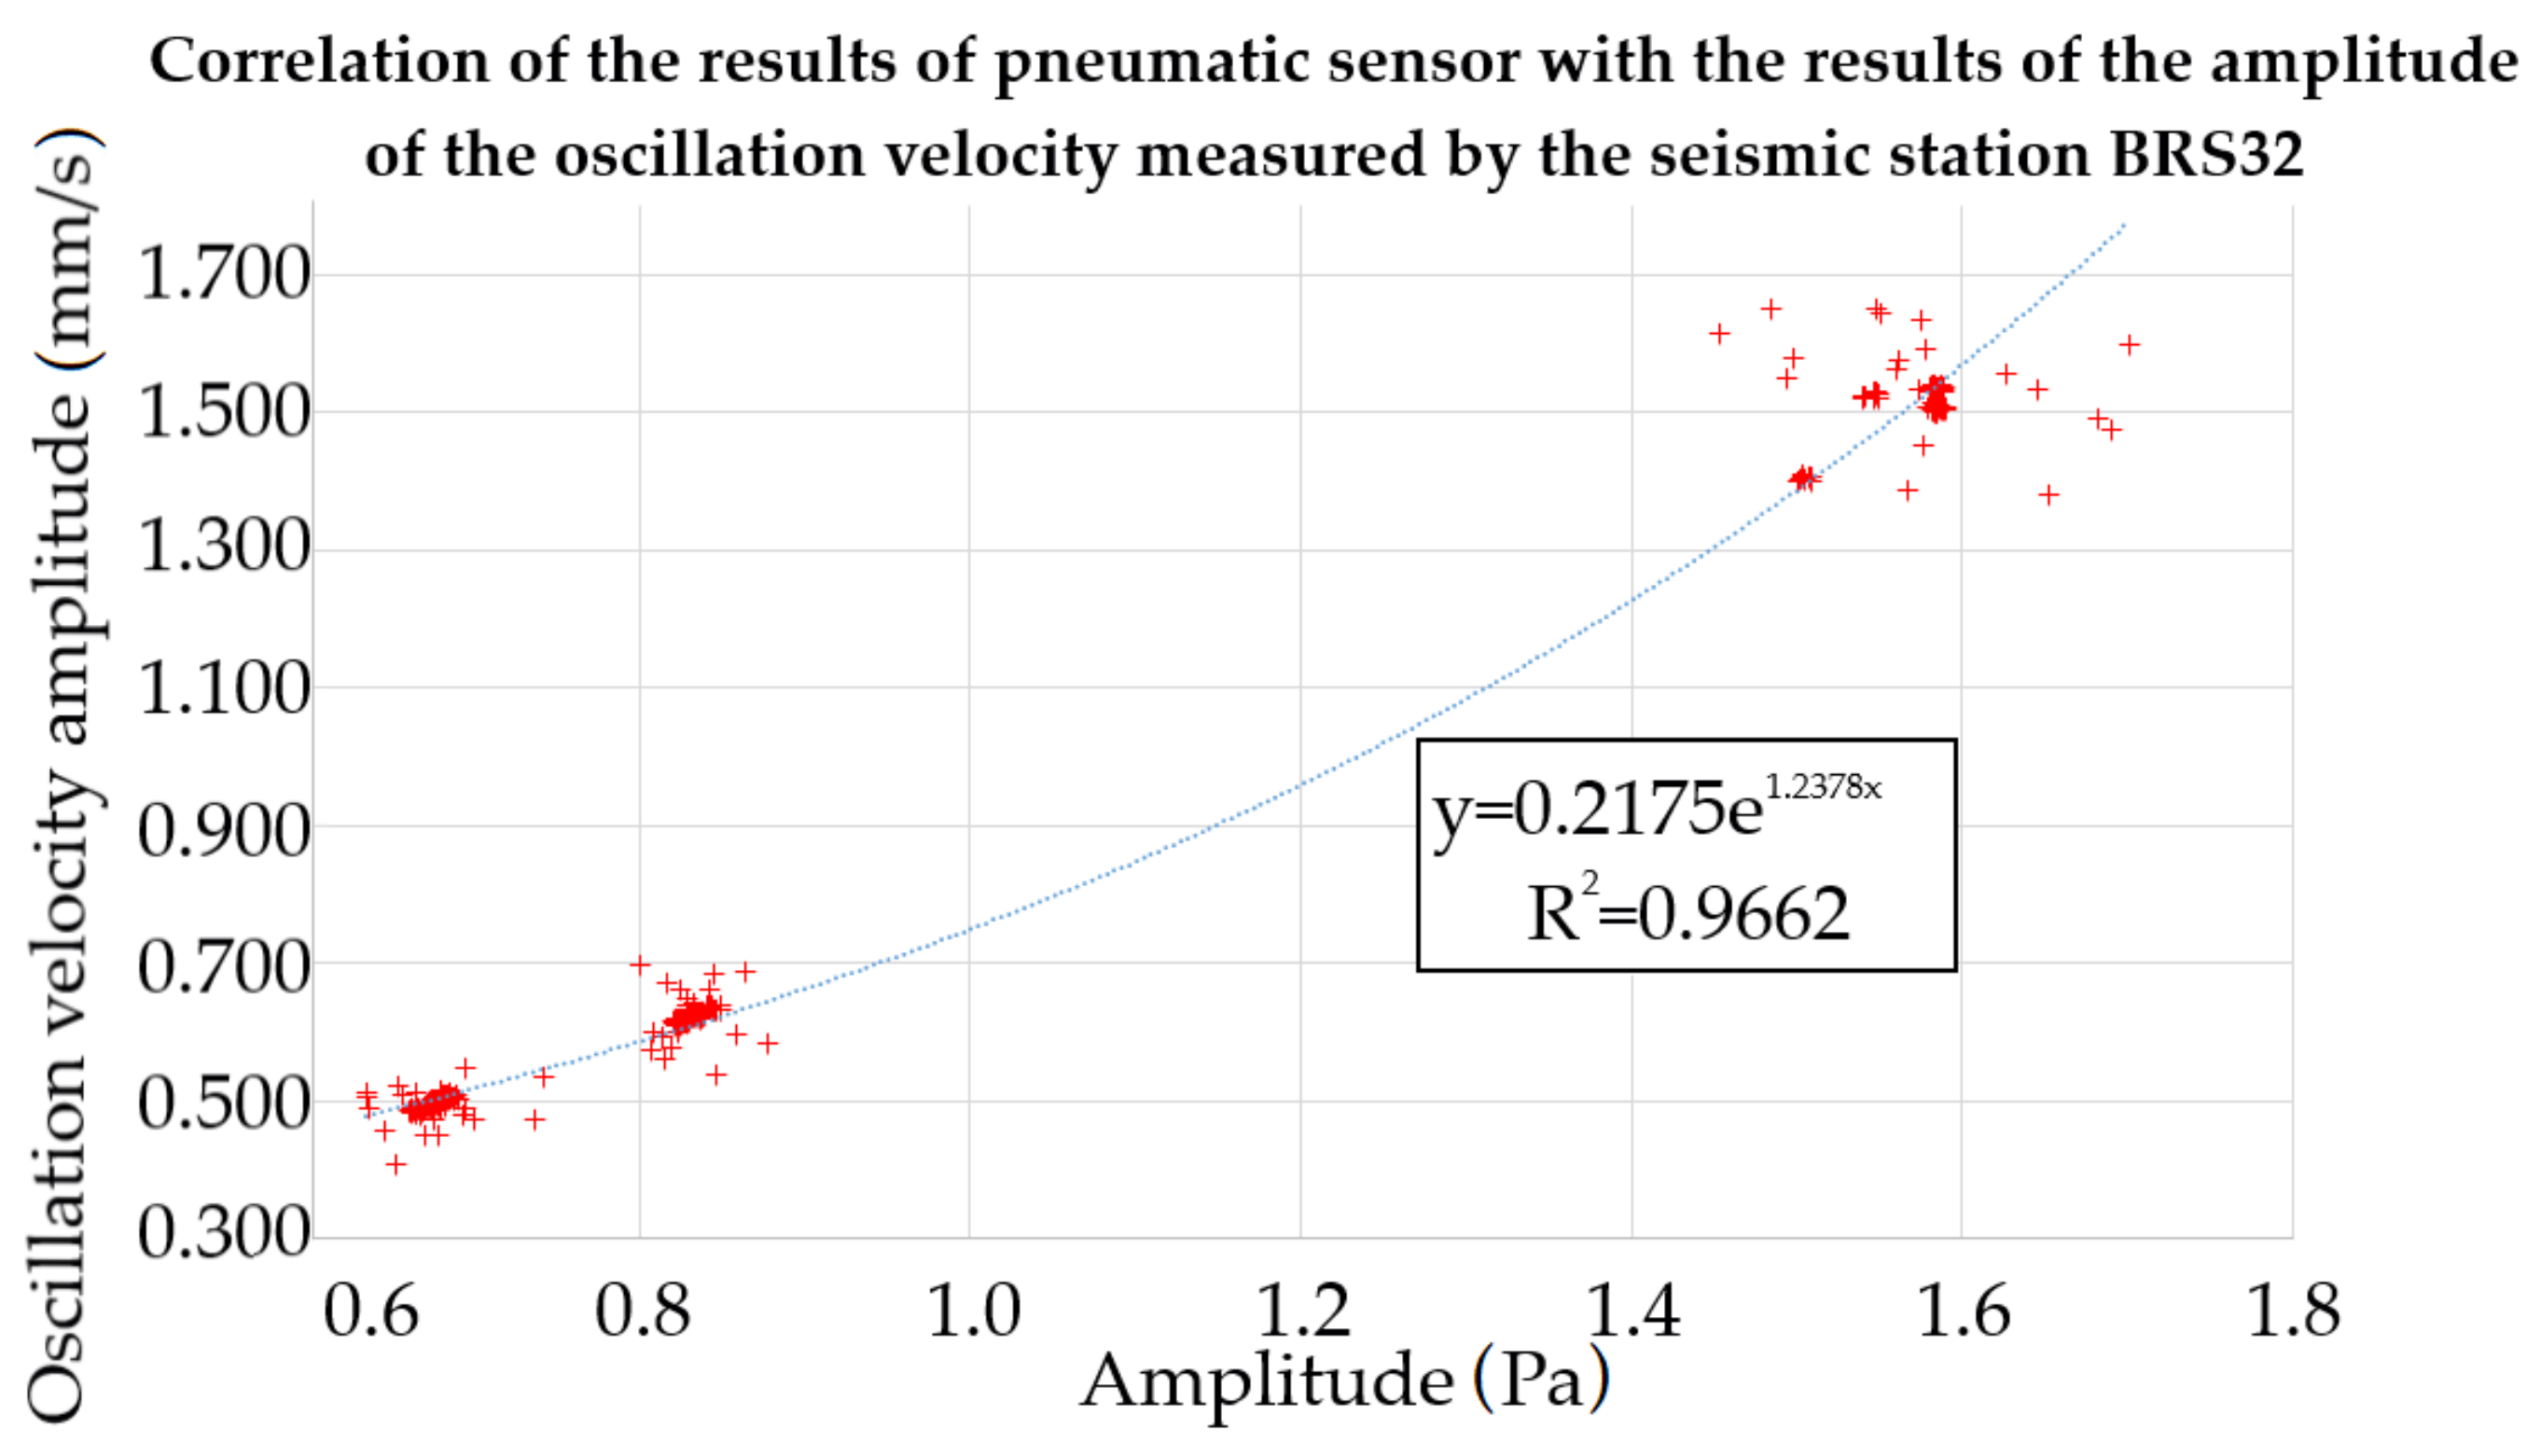
In the case of the finding of the mathematical relationship between the results of pneumatic measurements and the measurement of oscillation velocity, an analogous approach was applied to determine the optimal shape of the regression function with the highest determination coefficient
. The exponential regression curve is the best:
v—amplitude of the oscillation velocity,
x—maximum value of pneumatic measurements,
a, b—constants.
The results of both mathematical relationships for the optical interferometer and the seismic station, and the pneumatic sensor and the seismic station are presented in
Figure 11 and
Figure 12, respectively. Both dependences show a very high correlation coefficient
.
Table 3 then summarizes the main results from the entire experiment, i.e., the correlation relations for both sensory devices being developed, the relevant correlation coefficients and the deviations from the measured values of the amplitude of the oscillation velocity obtained from the seismic station.
7. Discussion
This paper describes the first basic laboratory experiment with the finding of the mathematical relationship between the measured values of the alternative sensory devices being developed working on a different physical principle than it is still common in the field of vibration measurement. The comparative measurements were performed in simplified conditions. In these conditions, all measuring instrumentation was placed as well as the source of vibrations, which was placed on a homogeneous base at a relatively small mutual distance. However, in conventional in situ measurements, the distances are significantly greater, in the order of tens to hundreds of meters, and the environment in which the vibrations propagate is always fairly heterogeneous. Likewise, a calibrated stroke is the simplest form of a possible source of vibrations, where commonly monitored vibrations have a much more complex character. Climate conditions will certainly be another, not insignificant factor influencing the measurement results. In contrast, it is also possible to perform the entire comparative process in a much more sophisticated manner, using a vibrating table in a vacuum chamber, which will be the next step in the research. Similarly, the next step of the research will include verification of the currently obtained correlation equations outside the laboratory, in situ, on seismic phenomena caused by, for example, transport, construction equipment or blasting work.
The team of author has already started this experimental verification of laboratory-obtained correlation equations by means of pilot measurements of vibrations from tram transport.
One of the main benefits of alternative systems may be, among other things, the higher explanatory power of measurement without human access to the monitored site, i.e., shortening the necessary downtime or unavailability time only for the period necessary for instrumentation installation. The indisputable advantage of the alternative fiber-optic solution is the possibility of control monitoring in areas with interfering electromagnetic fields (increased safety), the possibility of measuring without access to the monitored site, data acquisition to streamline the design of monitored structures, minimizing risks in construction and operation. The users may also benefit from the access to the measurement data evaluated in an almost online mode. The synergy of the aforementioned aspects may increase the ability of the contractor to accurately and operatively respond to the direct consequences of the work being carried out on the environment and the built-up area—it will be possible to optimize blasting, the material used, to implement maximum procedures, thus achieving greater efficiency, safety and reduction of the impact of construction on the environment in contrast to the contractors offering their work in conjunction with the currently used conventional measuring systems.
The degree of sensitivity of the sensors being developed was an interesting item of verification resulting from this comparative measurement, which is demonstrated by capturing even the secondary manifestation of the impact of the weight. Capturing the reflection of the plate from stiffer subsoil by an interferometric, or pneumatic, sensory device is enabled due to a significantly higher sampling frequency. The original sampling rate for interferometric signal was 100 kHz to make the demodulation with maximum precision. The original pre-demodulation sampling rate is always much higher. After the signal processing (demodulation) the phase response was down sampled to 1 kHz for the comparison and display. Pneumatic sensor has sampling frequency 10.24 kHz. For the BRS32 seismic station, the sampling frequency is 250 Hz, which is a commonly used sampling frequency for monitoring and subsequent analysis of seismic loading in engineering practice. The pneumatic and interferometric sensor being developed offers a higher frequency range and, as a result, it is sampled at higher frequencies, which can enable a much more detailed analysis of the seismic recording.
Regarding common engineering practice, the results are very interesting, because technical standards (e.g., [
38]) state the limit values of effective velocity in tenths, while we achieved the average deviation from the measured values of the amplitude of the oscillation velocity of 0.022 and even 0.002 for the optical interferometer and the pneumatic sensor respectively.
8. Conclusions
The primary benefit of this paper is to present new alternative sensor systems suitable for seismic monitoring and the results of data mathematical processing. This experimental comparative study took place in simplified conditions and a total of 300 seismic phenomena were processed and evaluated in the time domain. All phenomena captured were of similar nature in the time domain.
Correlation equations in a general form were created for both sensory devices being developed, specifically for the fiber-optic sensor and for the pneumatic sensor. Correlation coefficients for both equations were high, 0.9907 for the optic fiber sensor and 0.9662 for the pneumatic sensor. The average deviations from the measured values of the amplitude of the oscillation velocity were very low, specifically 0.022 for the optic fiber sensor and 0.002 for the pneumatic sensor.
This initial basic laboratory comparative study showed that even with the use of a completely different physical principle, it is possible to find a very cost-effective alternative method for the purpose of measuring vibrations, but so far only in simplified conditions. Results of this experimental measurement has shown that both the fiber-optic sensor and the pneumatic sensor are able to replace a standard seismic device while using a given solution and input boundary conditions.
Author Contributions
M.S., J.N., R.M., J.K. and S.K. proposed the system idea and edited the manuscript. S.K., M.S., J.N., R.M., E.H., J.K. and M.P. developed, tested, and validated the data. J.N., S.K., R.M., M.S. and J.K. wrote the manuscript. S.K., M.S., R.M., E.H. and J.N. critically evaluated the quality of the research data and experimental methods used to generate/acquire them, as well as the soundness/validity of the scientific and engineering techniques, wrote the manuscript, and performed its final edits. All authors have read and agreed to the published version of the manuscript.
Funding
The paper has been funded with the support of conceptual development of science, research, and innovation in 2020, assigned to the VSB-Technical University of Ostrava, the ministry of Education, Youth and Sports in the Czech Republic. This work was supported by the European Regional Development Fund in Research Platform focused on Industry 4.0 and Robotics in Ostrava project, CZ.02.1.01/0.0/0.0/17_049/0008425 within the Operational Programme Research, Development, and Education. This work was supported by SP2021/45, SP2021/119, and SP2021/32. This article was supported by the Technology Agency of the Czech Republic FW03010207 project entitled “Monitoring of parameters of rocks disintegration of small and large in scale by fiber-optic sensors”.
Institutional Review Board Statement
Not applicable.
Informed Consent Statement
Not applicable.
Data Availability Statement
This study did not report any data.
Conflicts of Interest
The authors declare no conflict of interest.
References
- Scheeper, P.; Gulløv, J.O.; Kofoed, L.M. A piezoelectric triaxial accelerometer. J. Micromech. Microeng. 1996, 6, 131–133. [Google Scholar] [CrossRef]
- Jiang, N.; Gao, T.; Zhou, C.; Luo, X. Effect of excavation blasting vibration on adjacent buried gas pipeline in a metro tunnel. Tunn. Undergr. Space Technol. 2018, 81, 590–601. [Google Scholar] [CrossRef]
- Czech, K.; Gosk, W. Analysis of the Vibration Propagation Induced by Pulling out of Sheet Pile Wall in a Close Neighbourhood of Existing Buildings. Procedia Eng. 2016, 143, 1460–1467. [Google Scholar] [CrossRef] [Green Version]
- Xiao, Y.J.; Chen, F.Q.; Lin, L.Q. Study of ground vibration and vibration isolation due to sleeve of cast-in-place piles installed by vibratory driving. Yantu Lixue/Rock Soil Mech. 2017, 38, 705–713. [Google Scholar] [CrossRef]
- Varughese, A.; Kumar, R. Vibration monitoring for surface compaction—A case study. Water Energy Int. 2017, 59, 56–59. [Google Scholar]
- Hiller, D.M.; Crabb, G.I. Groundborne Vibration Caused by Mechanised Construction Works. Noise Vib. Worldw. 2001, 32, 9–14. [Google Scholar] [CrossRef]
- Zou, C.; Wang, Y.; Wang, P.; Guo, J. Measurement of ground and nearby building vibration and noise induced by trains in a metro depot. Sci. Total Environ. 2015, 536, 761–773. [Google Scholar] [CrossRef]
- Nedoma, J.; Stolarik, M.; Fajkus, M.; Pinka, M.; Hejduk, S. Use of Fiber-Optic Sensors for the Detection of the Rail Vehicles and Monitoring of the Rock Mass Dynamic Response Due to Railway Rolling Stock for the Civil Engineering Needs. Appl. Sci. 2019, 9, 134. [Google Scholar] [CrossRef] [Green Version]
- Nedoma, J.; Stolarik, M.; Kepak, S.; Pinka, M.; Martinek, R.; Frnda, J.; Fridrich, M. Alternative Approaches to Measurement of Ground Vibrations Due to the Vibratory Roller: A Pilot Study. Sensors 2019, 19, 5420. [Google Scholar] [CrossRef] [Green Version]
- Kepak, S.; Stolarik, M.; Nedoma, J.; Martinek, R.; Kolarik, J.; Pinka, M. Alternative Approaches to Vibration Measurement Due to the Blasting Operation: A Pilot Study. Sensors 2019, 19, 4084. [Google Scholar] [CrossRef] [Green Version]
- Lopez-Higuera, J.M. Handbook of Optical Fibre Sensing Technology; Wiley: New York, NY, USA, 2002. [Google Scholar]
- Nesterov, V.; Nasonkin, V. Characteristics of orientation of long-baseline laser interferometry seismic deformographs. Geophys. J. 1997, 16, 561–568. [Google Scholar]
- Teisseyre, R.; Majewski, E.; Takeo, M.; Schreiber, K.; Stedman, G.; Igel, H.; Flaws, A. Ring Laser Gyroscopes as Rotation Sensors for Seismic Wave Studies; Springer: Berlin/Heidelberg, Germany, 2006. [Google Scholar] [CrossRef]
- Grigorie, T.; Adochiei, I.; Adochiei, F. Trends in the development of miniature optical accelerometers. Int. Multidiscip. Sci. GeoConf. Surv. Geol. Min. Ecol. Manag. 2014, 1, 197–204. [Google Scholar]
- Liang, T.C.; Lin, Y.L. A fiber-optic sensor for the ground vibration detection. Opt. Commun. 2013, 306, 190–197. [Google Scholar] [CrossRef]
- Zumberge, M.; Berger, J.; Hatfield, W.; Wielandt, E. A Three-Component Borehole Optical Seismic and Geodetic Sensor. Bull. Seismol. Soc. Am. 2018, 108, 2022–2031. [Google Scholar] [CrossRef]
- Brown, D.A. Fiber optic accelerometers and seismometers. In AIP Conference Proceedings; AIP: College Park, MD, USA, 1996; pp. 260–273. [Google Scholar] [CrossRef]
- Kamenev, O.T.; Kulchin, Y.N.; Petrov, Y.S.; Khiznyak, R.V.; Romashko, R.V. Fiber-optic seismometer on the basis of Mach-Zehnder interferometer. Sens. Actuators A Phys. 2016, 244, 133–137. [Google Scholar] [CrossRef]
- Papp, B.; Donno, D.; Martin, J.E.; Hartog, A.H. A study of the geophysical response of distributed fibre optic acoustic sensors through laboratory-scale experiments. Geophys. Prospect. 2016, 65, 1186–1204. [Google Scholar] [CrossRef] [Green Version]
- Wada, A.; Ikuma, K.; Tanaka, S.; Takahashi, N. Experimental investigation of dynamic characteristics of wavelength of DFB-LD for FBG-FPI vibration sensor based on wavelength-to-time mapping. In Proceedings of the OFS2012 22nd International Conference on Optical Fiber Sensors, Beijing, China, 14–19 October 2012; Volume 8421, pp. 820–823. [Google Scholar] [CrossRef]
- Papp, B.; Donno, D.; Martin, J.; Hartog, A. Fundamentals of Vibration Sensing with Distributed Fibre Optic Sensors through Downscaled Experiments. In Proceedings of the 76th EAGE Conference and Exhibition 2014, Amsterdam, The Netherlands, 16–19 June 2014; p. 622. [Google Scholar] [CrossRef]
- Zaanen, L.V.; Bona, A.; Correa, J.; Tertyshnikov, K.; Dean, T.; Pevzner, R. A comparison of borehole seismic receivers. In SEG Technical Program Expanded Abstracts 2017; Society of Exploration Geophysicists (SEG): Houston, TX, USA, 2017; pp. 5974–5978. [Google Scholar] [CrossRef]
- Busca, G.; Cigada, A.; Mazzoleni, P.; Zappa, E. Vibration Monitoring of Multiple Bridge Points by Means of a Unique Vision-Based Measuring System. Exp. Mech. 2013, 54, 255–271. [Google Scholar] [CrossRef]
- Araya, A.; Takamori, A.; Morii, W.; Miyo, K.; Ohashi, M.; Hayama, K.; Uchiyama, T.; Miyoki, S.; Saito, Y. Design and operation of a 1500-m laser strainmeter installed at an underground site in Kamioka, Japan. Earth Planets Space 2017, 69. [Google Scholar] [CrossRef] [Green Version]
- Guo, T.; Zhang, T.; Li, Y.; Qiao, X. Highly Sensitive FBG Seismometer With a 3D-Printed Hexagonal Configuration. J. Light. Technol. 2020, 38, 4588–4595. [Google Scholar] [CrossRef]
- Reed, J.W.; Colquitt, R. Acoustic Pulse Transfer System for Event Counting. U.S. Patent No. 7,022,925, 4 April 2006. [Google Scholar]
- Newmeyer, R. Sensor for Vehicular Traffic Data Accumulating Systems. U.S. Patent No. 3,949,355, 6 April 1976. [Google Scholar]
- Tyburski, R. Roadway Sensor Systems. U.S. Patent No. 3,949,355, 12 September 1995. [Google Scholar]
- Enoksson, P.; Stemme, G.; Stemme, E. Fluid density sensor based on resonance vibration. Sens. Actuators A Phys. 1995, 47, 327–331. [Google Scholar] [CrossRef]
- Krantz, W.B.; Bilodeau, R.R.; Voorhees, M.E.; Elgas, R.J. Use of axial membrane vibrations to enhance mass transfer in a hollow tube oxygenator. J. Membr. Sci. 1997, 124, 283–299. [Google Scholar] [CrossRef]
- Whitmore, S.A.; Wilson, M.D. Wiener Deconvolution for Reconstruction of Pneumatically Attenuated Pressure Signals. AIAA J. 2011, 49, 890–897. [Google Scholar] [CrossRef]
- Broz, M.; Strunc, J.; Malek, J.; Linda, M. New generation seismological datalogger BRS32-USB and its application in induced seismicity monitoring. EGRSE 2014, XXI/1, 35–47. [Google Scholar]
- Krohn, D.A.; MacDougall, T.W.; Mendez, A. Fiber Optic Sensors: Fundamentals and Applications; Society of Photo-Optical Instrumentation Engineers (SPIE): Bellingham, WA, USA, 2014. [Google Scholar] [CrossRef] [Green Version]
- Udd, E.; Spillman, W.B. Fiber Optic Sensors: An Introduction for Engineers and Scientists, 2nd ed.; Wiley: Hoboken, NJ, USA, 2011. [Google Scholar]
- Todd, M.; Johnson, G.; Chang, C. Passive, light intensity-independent interferometric method for fibre Bragg grating interrogation. Electron. Lett. 1999, 35, 1970. [Google Scholar] [CrossRef]
- Kepak, S.; Cubik, J.; Doricak, J.; Vasinek, V.; Siska, P.; Liner, A.; Papes, M. The arms arrangement influence on the sensitivity of Mach–Zehnder fiber optic interferometer. In Optical Sensors 2013; Baldini, F., Homola, J., Lieberman, R.A., Eds.; International Society for Optics and Photonics, SPIE: Washington, DC, USA, 2013; Volume 8774, pp. 249–256. [Google Scholar] [CrossRef]
- Kolarik, J.; Kahankova, R.; Brablik, J.; Martinek, R. Comparison of SCG and ECG Based Cardiac Activity Monitoring in Laboratory Conditions. IFAC-PapersOnLine 2019, 52, 550–555. [Google Scholar] [CrossRef]
- European Standard. CSN 73 0040: Loads of Technical Structures by Technical Seismicity; Technical Report; Czech Office for Standards, Metrology and Testing: Prague, Czech Republic, 1996. (In Czech) [Google Scholar]
| Publisher’s Note: MDPI stays neutral with regard to jurisdictional claims in published maps and institutional affiliations. |
© 2021 by the authors. Licensee MDPI, Basel, Switzerland. This article is an open access article distributed under the terms and conditions of the Creative Commons Attribution (CC BY) license (https://creativecommons.org/licenses/by/4.0/).

 ,
, 


