Probing Small Distances in Live Cell Imaging


1
Institute of Applied Research, Aalen University, Beethovenstr. 1, 73430 Aalen, Germany
2
School of Engineering, University of Applied Sciences Upper Austria, 4600 Wels, Austria
3
Austrian Competence Center for Feed and Food Quality, Safety and Innovation, 4600 Wels, Austria
*
Author to whom correspondence should be addressed.
Photonics 2021, 8(6), 176; https://0-doi-org.brum.beds.ac.uk/10.3390/photonics8060176
Submission received: 22 April 2021
/
Revised: 17 May 2021
/
Accepted: 20 May 2021
/
Published: 21 May 2021
(This article belongs to the Special Issue Topical Problems of Biophotonics)
Abstract
:For probing small distances in living cells, methods of super-resolution microscopy and molecular sensing are reported. A main requirement is low light exposure to maintain cell viability and to avoid photobleaching of relevant fluorophores. From this point of view, Structured Illumination Microscopy (SIM), Axial Tomography, Total Internal Reflection Fluorescence Microscopy (TIRFM) and often a combination of these methods are used. To show the high potential of these techniques, measurements on cell-substrate topology as well as on intracellular translocation of the glucose transporter GLUT4 are described. In addition, molecular parameters can be deduced from spectral data, fluorescence lifetimes or non-radiative energy transfer (FRET) between a donor and an acceptor molecule. As an example, FRET between the epidermal growth factor receptor (EGFR) and the growth factor receptor-bound protein 2 (Grb2) is described. Since this interaction, as well as further processes of cellular signaling (e.g., translocation of GLUT4) are sensitive to stimulation by pharmaceutical agents, methods (e.g., TIRFM) are transferred from a fluorescence microscope to a multi-well reader system for simultaneous detection of large cell populations.
1. Introduction
Probing small distances is a continuous challenge in life cell imaging. Optical microscopy plays a predominant role in this field as it provides several non-destructive techniques for imaging and sensing applications. Methods of transmission, scattering or fluorescence microscopy have been reported for many years, however, their resolution is generally limited to about 200 nm. Only in the last 30 years, this so-called Abbe limit has been overcome by super-resolution techniques, where resolutions below 100 nm have been attained. This offers new insights into many compartments or organelles of a cell, e.g., nuclei, mitochondria, lysosomes and further vesicles, as outlined in Table 1. Specific techniques, e.g., Total Internal Reflection Fluorescence Microscopy (TIRFM) even allow for selective imaging of cell membranes whose thickness is only about 5 nm [1,2]. Imaging options in the range of only a few nanometers are limited, however, information about the micro-environment of specific molecules, e.g., proteins, can be obtained from sensing additional parameters, e.g., fluorescence spectra or lifetimes. In this context measurement of Förster Resonance Energy Transfer (FRET) [3] from a so-called donor to an acceptor molecule plays a predominant role not only for fluorescence staining, but also for measuring intra-molecular or intermolecular distances in the nanometer range (for an overview see [4,5,6]). This manuscript gives an overview on high resolution microscopy as well as on nanometer sensing.
2. Microscopy
The lateral resolution Δx of a common (wide-field) microscope is defined either by the Abbe criterion (for coherent illumination)
or by the Rayleigh criterion (for a luminescent object or incoherent illumination)
with the wavelength λ and the numerical aperture AN of the microscope objective lens. In both cases values around 200 nm are achieved for numerical apertures AN ≥ 1.30 at λ = 500 nm. Often the axial resolution is related to the depth of focus
resulting in Δz ≈ 400 nm for the refractive index n = 1.50, λ = 500 nm and AN = 1.40. In comparison with wide-field microscopy, (confocal or multiphoton) laser scanning microscopy offers numerous advantages concerning contrast and optical sectioning. However, for an increase of resolution in confocal microscopy a pinhole is required that selects only a small part of the diffraction pattern (“Airy disk”) of individual points, thus reducing the detection sensitivity considerably. Alternatively, an array of several pinholes with individual detectors (Airy Scan Microscopy), an ultrasensitive camera chip (image scan microscopy) or a pinhole with a scanning device (Re-Scan Confocal Microscopy [7]) may replace the original pinhole (for an overview see e.g., [8]). These alternatives, however, make the whole setup rather complex and expensive. Therefore, to increase resolution and limit the complexity of the optical system, several super-resolution or super-localization methods have been developed.
Δx ≥ λ/2AN
Δx = 0.61 λ/AN
Δz = n λ/AN²
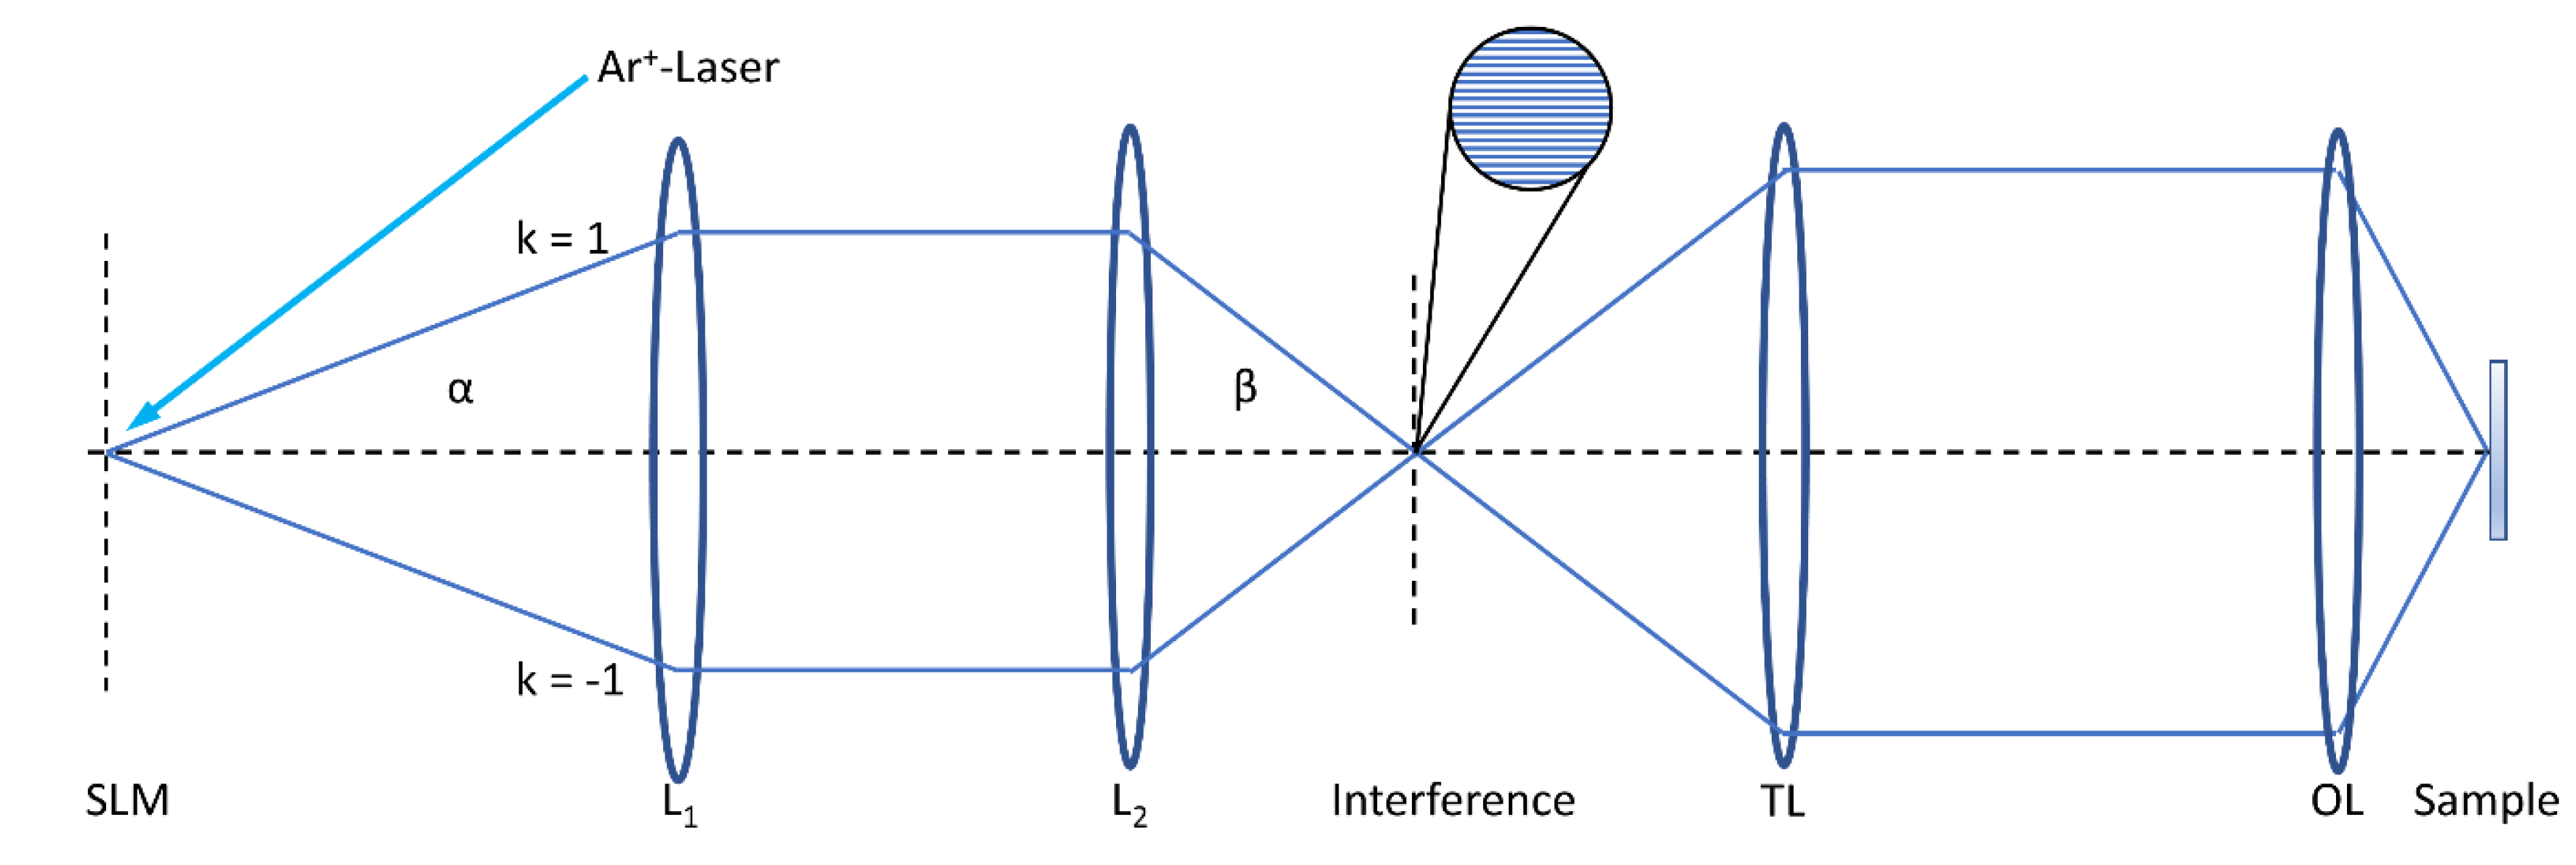
Structured Illumination Microscopy (SIM) [9,10,11] with a periodically modulated illumination pattern leads to a resolution enhancement around a factor of 2 in the lateral direction compared to the value given by the Abbe criterion. Here, the sample is illuminated by 2 interfering laser beams creating a sinusoidal pattern (Figure 1) that may be rotated to obtain isotropic resolution enhancement in the lateral plane. Images are recorded for at least 3 rotation angles and 3 phases (0, 2π/3, 4π/3) of the interference pattern, and a super-resolution image is calculated from a minimum of 9 individual images. While 2 interfering beams are sufficient for enhanced resolution in the lateral dimension, 3 interfering beams are needed for increasing resolution in all 3 dimensions. It should be mentioned that resolution can be enhanced even by more than a factor 2, if the emission rate of the sample responds non-linearly to the illumination intensity, using e.g., saturation effects or photo-switching of a fluorescent protein [12].
In some cases, especially for larger specimens, Lattice Light Sheet Microscopy, a combination of Light Sheet Microscopy and SIM, is a useful tool for observing subcellular processes in three dimensions. This technique achieves high resolution (Δx = 150 nm, Δz = 280 nm) and contrast at high image acquisition speed, thus minimizing damage of cells due to phototoxicity [13,14].
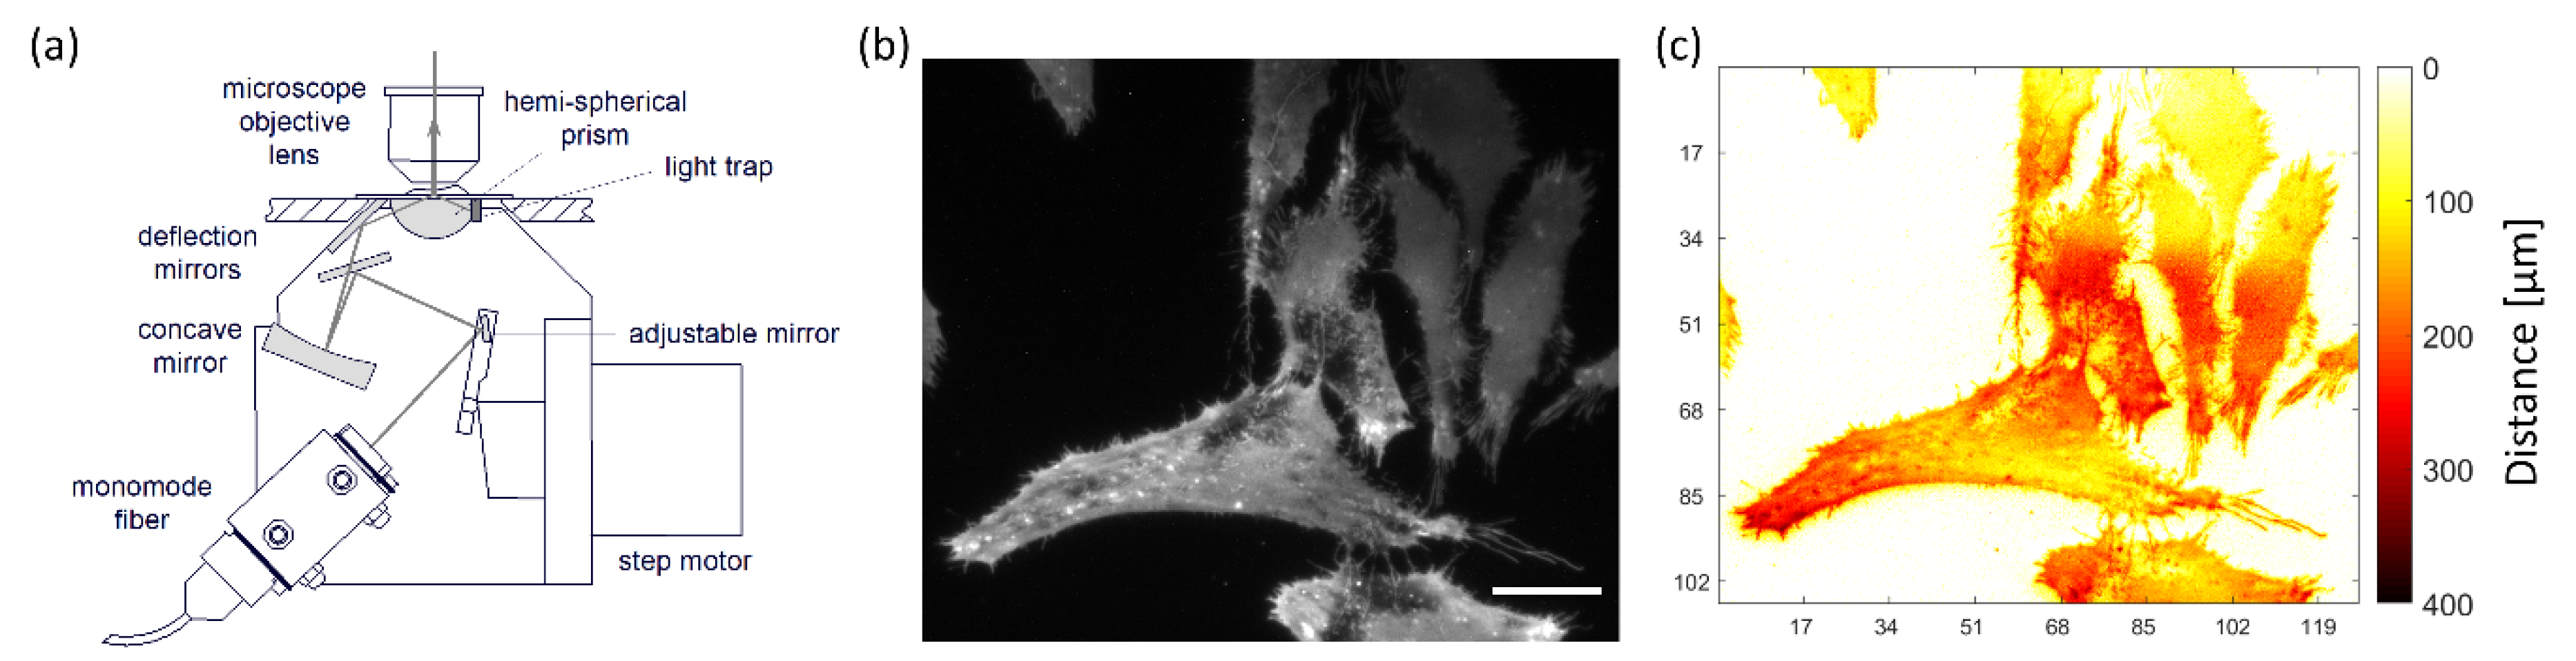
Total Internal Reflection Fluorescence Microscopy (TIRFM) is a wide-field technique that permits selective detection of surfaces, e.g., plasma membranes. When a light beam propagating through a medium of refractive index n1 (e.g., glass) meets a second medium of refractive index n2 < n1 (e.g., cell membrane or cytoplasm), total internal reflection occurs at all angles of incidence Θ, which are greater than a critical angle Θc = arcsin (n2/n1). Thereby, an evanescent electromagnetic field is generated that penetrates about 100 nm into the sample and permits selective excitation of membrane proximal fluorophores. “Prism-type TIRF”, based on light incidence via a glass or quartz prism whose refractive index exceeds that of the specimen, has been used for live cell measurements for almost 40 years [1,2]. By variation of the angle of incidence (“VA-TIRFM”), an axial resolution of only a few nanometers becomes possible, which permits studies of cell-substrate topology, e.g., upon application of cytotoxic or phototoxic agents or in studies of diseases. An illumination device (microscope condenser) for variable-angle TIRFM is depicted in Figure 2a, an application to Chinese Hamster Ovary (CHO) cells expressing a membrane-associated Green Fluorescence Protein (GFP) in Figure 2b,c. While the penetration depth d (Θ) of the evanescent electromagnetic wave depends on the angle of incidence Θ, the fluorescence intensity of the TIRFM signal for a homogenously fluorescent layer of thickness t can be calculated as
with a constant A, a transmission factor T(Θ) through the cell-substrate interface, a penetration depth d(Θ) of the evanescent wave and a distance Δ between a cell and its substrate [16]. Variation of the angle Θ permits imaging of this distance Δ for the whole specimen (cell-substrate topology), and arbitrary objective lenses can be used for image detection.
IF (Θ) = A T(Θ) t e−Δ/d(Θ)
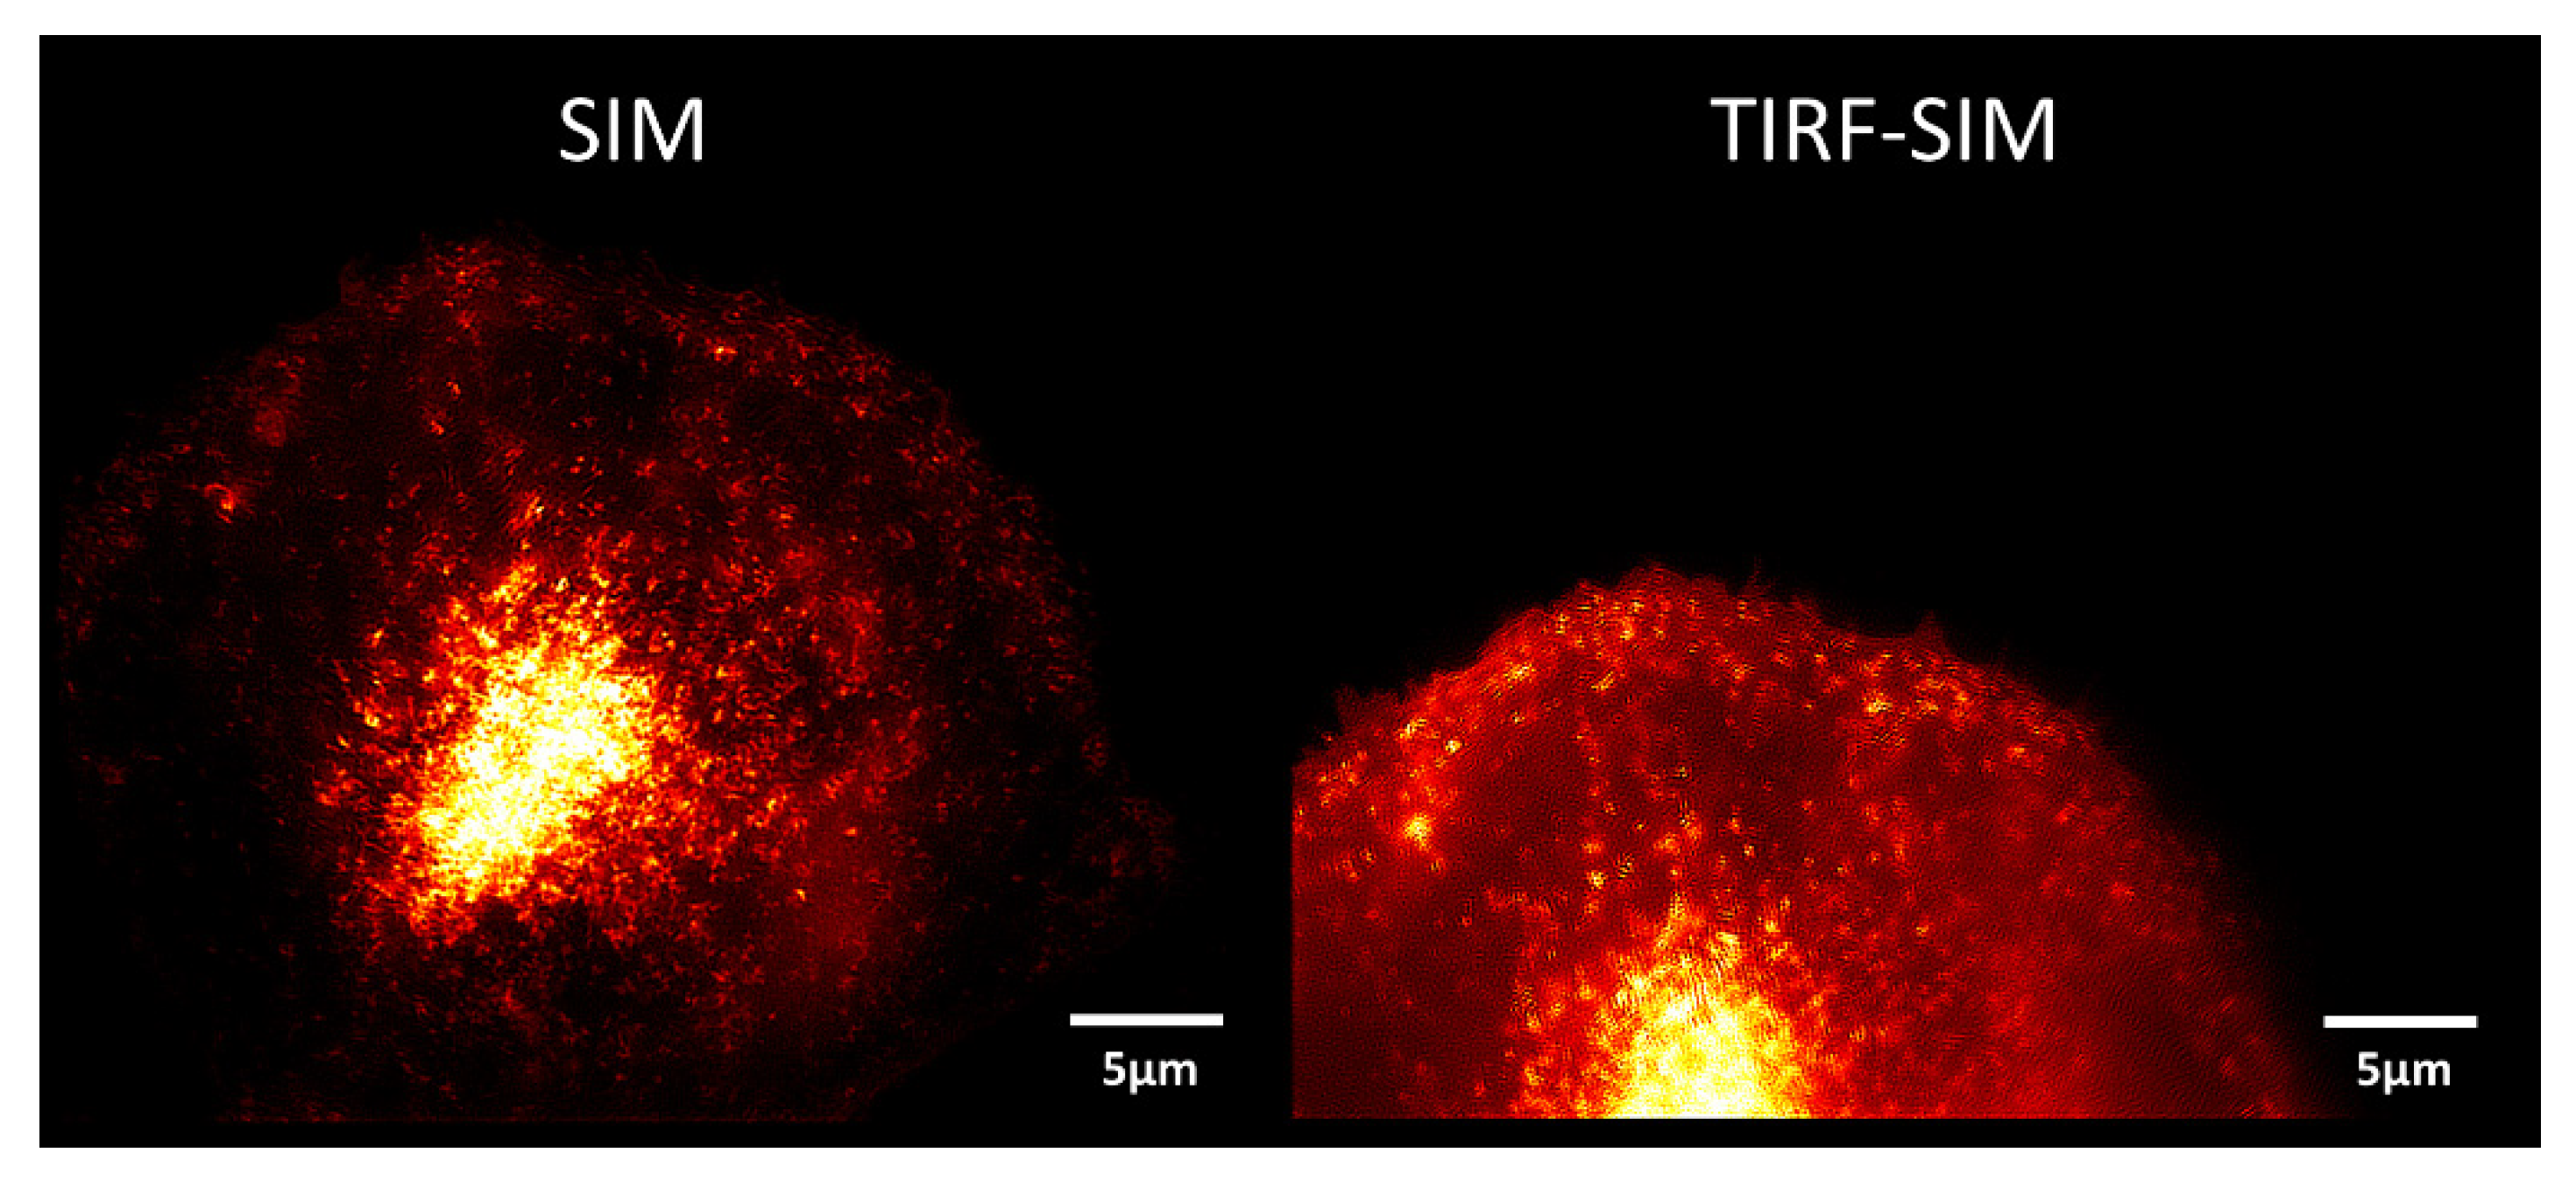
In “Objective-type TIRF”, which became available 20 years later than prism-type TIRFM, the illumination beam is focused close to the edge of the aperture of a microscope objective lens with very high numerical aperture, so that illumination occurs under total internal reflection [17]. Alternatively, the focused spot may be scanned in a circular orbit for homogeneous illumination of the sample under various directions during short exposure times (HILO technique [18]). Objective-type TIRF can be combined with structured illumination microscopy (SIM) using up to 6 interfering laser beams to achieve super-resolution in three dimensions (see Figure 1) [18,19,20,21]. A comparison of SIM and TIRF-SIM is shown in Figure 3 for a Chinese Hamster Ovary (CHO) cell transfected with GFP-tagged glucose transporter 4 (GLUT4). Insulin as well as insulin-mimetic compounds, e.g., tannic acid or an extract of Bellis perennis (common daisy) [22], are presently used as stimulating agents to trigger translocation of GLUT4 from intracellular compartments to the plasma membrane, as further described in line 209 ff.. As depicted Figure 3 (left), we observed fluorescence arising primarily from small vesicles by SIM. When we measured the plasma membrane almost exclusively by TIRF-SIM (Figure 3, right), we observed a more even distribution of fluorescence intensity over the whole cell surface.
An alternative method to TIRFM deserves mentioning. It is called “Supercritical angle fluorescence microscopy” (SAF) and is based on full-field excitation of the sample and selective detection of fluorescence above the critical angle Θc [23,24]. A main advantage of this method is that membrane associated fluorescence (above Θc) and whole cell fluorescence (below Θc) can be observed simultaneously, but a disadvantage is that the total light exposure is higher than for TIRFM experiments. Also variation of the angle Θ is difficult to realize.
Stimulated Emission Depletion (STED) microscopy is a laser scanning technique that overcomes the diffraction limited resolution of confocal and multiphoton microscopes. The enhancement of resolution is due to suppression of fluorescence of the dye molecules in the outer regions of a diffraction limited illumination spot by stimulated emission using a (second) donut shaped laser beam. While a resolution of 30–70 nm can thus be achieved [25], the irradiance exceeds that of a conventional fluorescence microscope by a factor 104–105 and may cause severe damages to living specimens. This problem was minimized with the introduction of MINFLUX nanoscopy, a technique based on localization and tracking of single molecules in the intensity minimum of a donut-shaped laser beam. MINFLUX achieves nanometer resolution (isotropic: ≥ 2 nm) at moderate light exposure, which is comparable to confocal laser scanning microscopy [26].
Super-resolution may further result from single molecule localization microscopy (SMLM) within a thin illuminated layer of a sample [27,28,29,30]. If a single molecule is detected n times, its localization can be determined with a precision Δx = Δx0/√n with Δx0 ~200 nm according to the Rayleigh criterion. Therefore, a precision of localization Δx = 20 nm results from n = 100 and Δx = 10 nm from n = 400. Methods based on super-localization microscopy include Stochastic Optical Reconstruction Microscopy (STORM), Photoactivation Localization Microscopy (PALM) and related techniques. Generally, SMLM techniques need an irradiance, which is about 100 times larger than for conventional microscopy and a prolonged exposure time of at least a few seconds, so that the risk of cell damage is again very high.
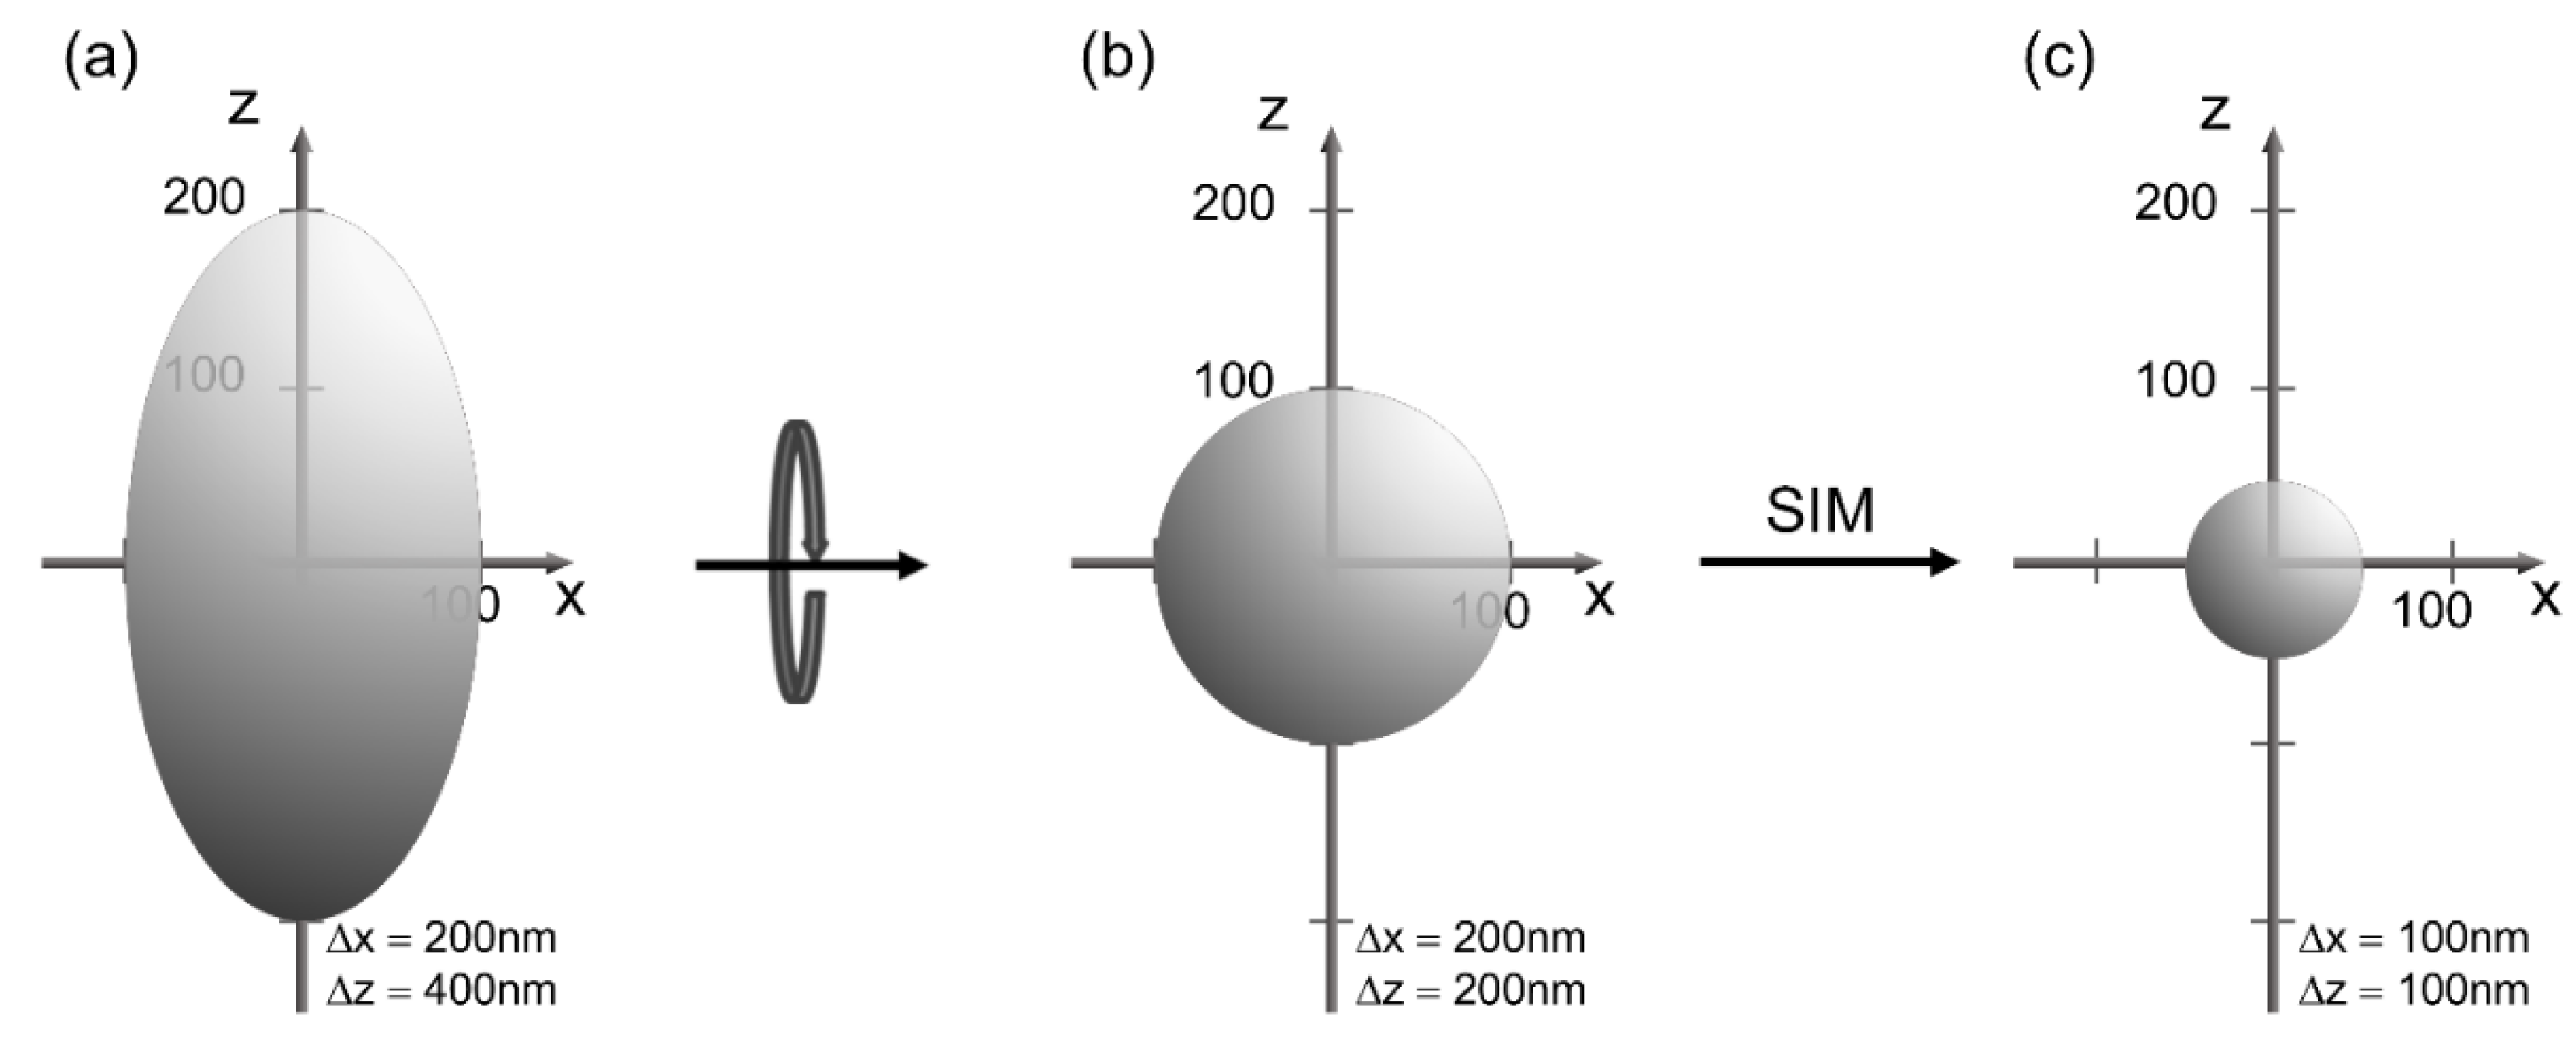
Most microscopy techniques can also be combined with Axial Tomography to overcome the anisotropy of optical resolution. As shown by the point spread function in Figure 4a the lateral resolution is generally higher than the axial resolution. However, after rotation always the optimal (lateral) resolution can be used as depicted in Figure 4b. A combination with super-resolution microscopy gives an extremely high isotropic resolution, e.g., about 100 nm in the case of SIM (Figure 4c). Rotation of samples needs specific sample holders and preparation techniques, e.g., cells embedded in a gel within a rotatable capillary, whose refractive index can be adapted to that of water or oil when using an immersion lens of high magnification [31]. A sample holder with fine tuning of rotation angles over 360° has been reported previously [32]. It can be easily adapted to a great variety of common light microscopes and is suitable for various applications in life science.
In every optical system, light emitted from each point in the object is convolved with the point spread function (PSF) of the system to produce the final image. This convolution causes points in the object plane to become blurred regions in the image plane, thus degrading imaging quality. Deconvolution is a post-acquisition image processing technique used to reverse this process to partially restore lost resolution and improve contrast. However, as with all analytical tools, it must be applied with care to maximize reliability and avoid artifacts [33,34].
3. Sensing
Depending on the method of microscopy, resolution is limited to 10–100 nm, i.e., smaller structures cannot be resolved in an image. However, it is well known that fluorescence spectra as well as fluorescence lifetimes depend on the microenvironment of a relevant fluorophore, including pH, viscosity, and polarity [35,36]. In particular, after excitation of a molecular species by a short light pulse its fluorescence often shows an exponential decay with the time constant
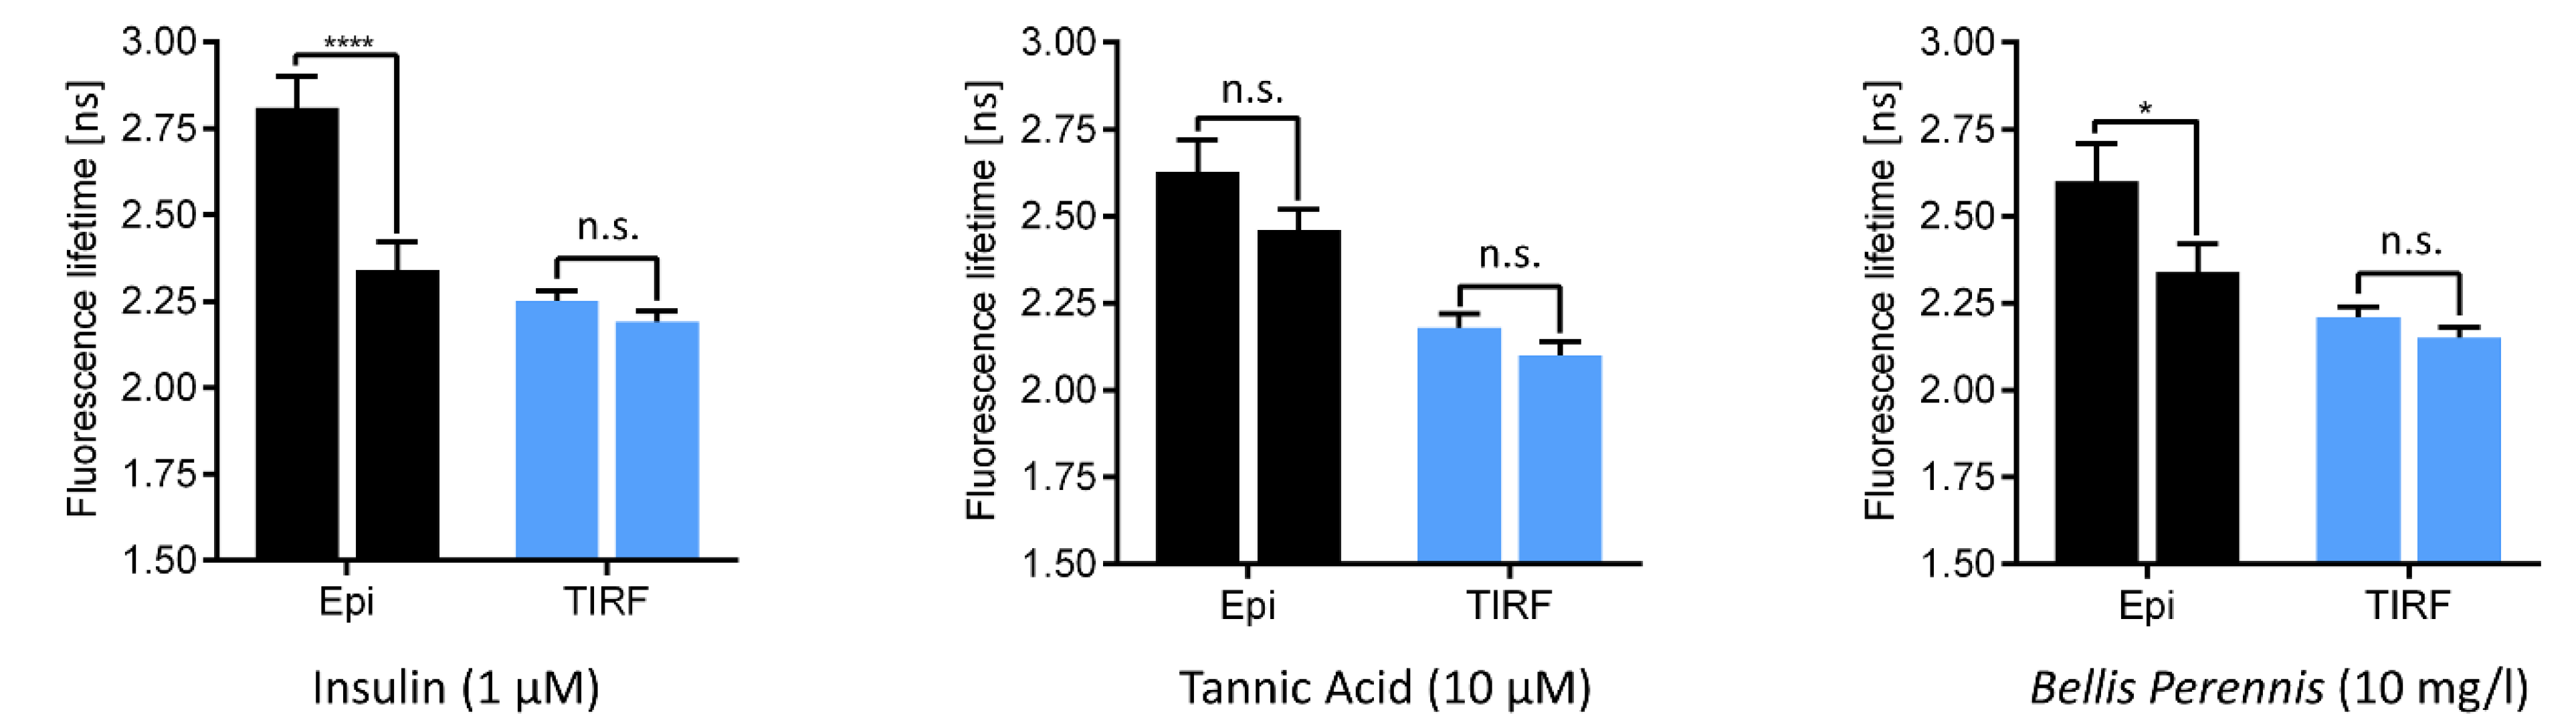
where kF represents the rate of radiative (fluorescent) transitions and knr that of non-radiative transitions from an excited molecular state. knr depends on various parameters, e.g., molecular conformation, intersystem crossing between excited singlet and triplet states or the molecule’s microenvironment. Coming back to the stimulus-dependent translocation of GLUT4 from intracellular storage compartments to the plasma membrane (see Figure 3), we measured the fluorescence lifetime of GLUT4-GFP prior to and subsequent to stimulation with insulin or the insulin-mimetic substances tannic acid or Bellis perennis extract. Here, we illuminated either whole cells or their plasma membranes at an angle of 62° (epi-illumination) or 66° (TIRF), as depicted in Figure 5.
τ = (kF + knr)−1
According to Figure 5, fluorescence lifetimes were around 2.2 ns upon TIRF illumination and remained almost constant after stimulation. These values reflect membrane associated GLUT4-GFP fluorescence with increasing intensity, but almost constant lifetime after stimulation. In contrast, fluorescence lifetimes of 2.5–2.8 ns within whole cells decreased upon stimulation to 2.3–2.4 ns, thus approaching the values measured within the plasma membrane. This decrease was significant for stimulation by insulin and Bellis perennis extract and indicated a trend for tannic acid. Therefore, fluorescence lifetime may represent a quantitative molecular parameter for fluorescence re-distribution from intracellular vesicles to the plasma membrane as observed in the SIM/TIRF-SIM images. In this context it should be mentioned that some shortening of GFP lifetime in close vicinity to a cell-glass interface has been reported in the literature [37].
In the case of non-radiative energy transfer from an excited donor molecule to an acceptor molecule (FRET [3]) the energy transfer rate kET contributes to the rate knr and may cause a pronounced decrease of the fluorescence lifetime τ of the donor molecule. This effect has been used frequently to measure changes of molecular conformations (“intramolecular FRET”) as well as intermolecular interactions of the optical transition dipoles of specific chromophores. Examples of intramolecular FRET are calcium signaling [38] or cyclic AMP signaling using a so-called EPAC sensor ([39] and references therein). Examples for intermolecular FRET are manifold. They include intrinsic fluorophores as well as fluorescent membrane probes (for a review see [6]), but since the introduction of GFP [40] and its variants for the blue, yellow and red spectral range, cellular proteins fused with one of these GFP variants are often used as energy donors or acceptors. Relevant topics include interactions of cellular growth factor proteins [41,42] as well caspase driven molecular interactions upon apoptosis [43,44]. Furthermore, FRET experiments are used increasingly for studies of pathogenesis of various diseases, e.g., tumors [45] or Alzheimer’s disease [46]. Altogether, FRET can be evaluated on the basis of spectral data (e.g., ratio measurements of donor and acceptor fluorescence), fluorescence lifetimes and polarization measurements, which are of particular interest, if donors and acceptors represent the same type of molecules (homo-FRET [47]). A major restriction of ratio measurements may be the spectral overlap of donor and acceptor emission (which requires some deconvolution and background subtraction) and the often unknown fluorescence quantum yields, while the main problem of fluorescence lifetime measurements may be the appropriate reference of a sample without acceptor or with a photo-bleached acceptor (for further details see [4,5,6].
When FRET is combined with TIR-illumination, cell membranes and protein-protein interactions close to the plasma membrane can be examined selectively. A recent application of TIR-FRET is depicted in Figure 6 showing the interaction between the epidermal growth factor receptor (EGFR), fused with Cyan Fluorescent Protein (CFP), and the growth factor receptor-bound protein 2 (Grb2), fused with Yellow Fluorescent Protein (YFP). The EGFR regulates important pathways such as growth, survival, proliferation and differentiation in mammalian cells, and has become a major drug target, as EGFR signaling is critical for the development of many types of cancer [48]. In Figure 6, membrane specific donor and acceptor fluorescence is depicted (top), and fluorescence lifetime images of the donor EGFR-CFP are shown in absence and in presence of the acceptor Grb2-YFP (bottom). Pronounced shortening of the fluorescence lifetime is observed in the second case due to FRET. Furthermore, the efficiency of energy transfer from EGFR-CFP to Grb2-YFP increased after stimulation of the cells with the epidermal growth factor (EGF) [49].
As a valuable contribution to the growing field of high throughput screening, the TIR-FRET technique was transferred from a fluorescence microscope to a multi-well reader system for simultaneous detection of large cell populations grown in adapted microtiter plates. A 96-well plate reported earlier [50] was modified for this purpose, and in addition to TIR-FRET experiments this fluorescence reader was used to quantify GLUT 4 translocation from intracellular storage compartments to the plasma membrane. Stimulation by insulin could thus be measured quantitatively in a large concentration range between 10–12 and 10–6 mol/L [51], and insulin mimetic compounds are further evaluated in view of their efficacy for treatment of type 2 diabetes mellitus.
4. Discussion
Methods for probing small distances in life cell imaging—including super-resolution microscopy and molecular sensing—are reported. Super-resolution techniques, however, should be applied with care in order to avoid photochemical damages of the cells as well as photobleaching of fluorescent specimens. Presently, SIM with a lateral resolution around 100 nm seems to fulfill the requirement of low or moderate light exposure. MINFLUX technology with a resolution of only a few nanometers may be a promising alternative in the near future. For cell membrane studies with high axial resolution, TIRFM appears to be the method of choice, since by variation of the angle of incidence (VA-TIRFM) cell-substrate distances can be determined with a precision of a few nanometers. Prism-type TIRFM may be advantageous for selection of a wide angular range in comparison to objective-type TIRFM. In addition, prism-type TIRFM has the advantage that any kind of objective lens (with arbitrary aperture and magnification) can be used. Prism-type TIRF technology can also be applied in new fields, e.g., fluorescence screening of larger cell collectives in microtiter plates, which has a high potential in pharmaceutical sciences. In addition, various combinations of methods, e.g., TIRF-SIM with a high lateral and axial resolution, as well a combination of axial tomography with further super-resolution methods, appear promising. Whenever small dimensions within a sample cannot be visualized in a microscope, fluorescent molecules can be localized and molecular distances can be estimated on the basis of spectral data, fluorescence lifetimes or FRET between a donor and an acceptor molecule. FRET data (spectra, fluorescence lifetimes or FRET efficiencies) can also be displayed as high resolution images.
Author Contributions
Conceptualization, H.S.; methodology, H.S., V.R. and P.L.; software, V.R. and P.L.; validation, H.S., V.R. and P.L.; investigation, V.R.; resources, H.S.; data curation, V.R.; writing—original draft preparation, H.S. and V.R.; writing—review and editing, H.S. and J.W.; visualization, V.R.; supervision, H.S. and J.W.; funding acquisition, H.S. and J.W. All authors have read and agreed to the published version of the manuscript.
Funding
This research was funded by Christian Doppler Forschungsgesellschaft (Josef Ressel Center for Phytogenic Drug Research, Wels, Austria) as well as by the province of Upper Austria as part of the FH Upper Austria Center of Excellence for Technological Innovation in Medicine (TIMed CENTER).
Institutional Review Board Statement
Not applicable.
Informed Consent Statement
Not applicable.
Data Availability Statement
Not applicable.
Acknowledgments
The authors thank Michael Wagner for his cooperation and Claudia Hintze for skillful technical assistance.
Conflicts of Interest
The authors declare no conflict of interest.
References
- Axelrod, D. Cell-substrate contacts illuminated by total internal reflection fluorescence. J. Cell Biol. 1981, 89, 141–145. [Google Scholar] [CrossRef] [Green Version]
- Schneckenburger, H. Total internal reflection fluorescence microscopy: Technical innovations and novel applications. Curr. Opin. Biotechnol. 2005, 16, 13–18. [Google Scholar] [CrossRef]
- Förster, T. Zwischenmolekulare Energiewanderung und Fluoreszenz. Ann. Phys. 1948, 437, 55–75. [Google Scholar] [CrossRef]
- Masters, B.R. Paths to Förster’s resonance energy transfer (FRET) theory. Eur. Phys. J. 2014, H39, 87–139. [Google Scholar] [CrossRef]
- Clegg, R.M.; Sener, M. From Foerster resonance energy transfer to coherent resonance energy transfer and back. In Optical Biopsy VII; Alfano, R.R., Ed.; SPIE Bios: San Francisco, CA, USA, 2010; pp. 59–79. [Google Scholar] [CrossRef]
- Schneckenburger, H. Förster resonance energy transfer–What can we learn and how can we use it? Methods Appl. Fluoresc. 2019, 8, 013001. [Google Scholar] [CrossRef]
- De Luca, G.M.R.; Breedijk, R.M.P.; Brandt, R.A.J.; Zeelenberg, C.H.C.; de Jong, B.E.; Timmermans, W.; Azar, L.N.; Hoebe, R.A.; Stallinga, S.; Manders, E.M.M. Re-scan confocal microscopy: Scanning twice for better resolution. Biomed. Opt. Express 2013, 4, 2644–2656. [Google Scholar] [CrossRef]
- Schneckenburger, H.; Richter, V. Laser Scanning versus Wide-Field−Choosing the Appropriate Microscope in Life Sciences. Appl. Sci. 2021, 11, 733. [Google Scholar] [CrossRef]
- Heintzmann, R.; Cremer, C. Laterally modulated excitation microscopy: Improvement of resolution by using a diffraction grating. In Optical Biopsies and Microscopic Techniques III; In Proceedings of the SPIE 3568, Stockholm, Sweden, 8–12 September 1998; SPIE: Bellingham, WA, USA, 1999; pp. 185–196. [Google Scholar] [CrossRef]
- Gustafsson, M.G.L.; Shao, L.; Carlton, P.M.; Wang, C.J.R.; Golubovskaya, I.N.; Cande, W.Z.; Agard, D.A.; Sedat, J.W. Three-dimensional resolution doubling in wide-field fluorescence microscopy by structured illumination. Biophys. J. 2008, 94, 4957–4970. [Google Scholar] [CrossRef] [Green Version]
- Hirvonen, L.M.; Wicker, K.; Mandula, O.; Heintzmann, R. Structured illumination microscopy of a living cell. Eur. Biophys. J. 2009, 38, 807–812. [Google Scholar] [CrossRef]
- Rego, E.H.; Shao, L.; Macklin, J.J.; Winoto, L.; Johansson, G.A.; Kamps-Hughes, N.; Davidson, M.W.; Gustafsson, M.G. Nonlinear structured-illumination microscopy with a photoswitchable protein reveals cellular structures at 50-nm resolution. Proc. Natl. Acad. Sci. USA 2012, 109, E135–E143. [Google Scholar] [CrossRef] [Green Version]
- Bi-Chang, C.; Legant, W.R.; Wang, K.; Shao, L.; Milkie, D.E.; Davidson, M.W.; Janetopoulos, C.; Wu, X.S.; Hammer, J.A., 3rd; Liu, Z. Lattice light-sheet microscopy: Imaging molecules to embryos at high spatiotemporal resolution. Science 2014, 346, 1257998. [Google Scholar] [CrossRef] [Green Version]
- O’Shaughnessy, E.C.; Stone, O.J.; LaFosse, P.K.; Azoitei, M.L.; Tsygankov, L.; Heddleston, J.M.; Legant, W.R.; Wittchen, E.S.; Burridge, K.; Elston, T.C. Software for lattice light-sheet imaging of FRET biosensors, illustrated with a new Rap1 biosensor. J. Cell Biol. 2019, 218, 3153–3160. [Google Scholar] [CrossRef] [PubMed] [Green Version]
- Richter, V.; Lanzerstorfer, P.; Weghuber, J.; Schneckenburger, H. Super-resolution live cell microscopy of membrane-proximal fluorophores. Int. J. Mol. Sci. 2020, 21, 7099. [Google Scholar] [CrossRef] [PubMed]
- Stock, K.; Sailer, R.; Strauss, W.S.L.; Lyttek, M.; Steiner, R.; Schneckenburger, H. Variable-angle total internal reflection fluorescence microscopy (VA-TIRFM): Realization and application of a compact illumination device. J. Microsc. 2003, 211, 19–29. [Google Scholar] [CrossRef]
- Axelrod, D. Selective imaging of surface fluorescence with very high aperture microscope objectives. J. Biomed. Opt. 2001, 6, 6–13. [Google Scholar] [CrossRef]
- Van’t Hoff, M.; de Sars, V.; Oheim, M. A programmable light engine for quantitative single molecule TIRF and HILO imaging. Opt. Express 2008, 16, 18495–18504. [Google Scholar] [CrossRef]
- Brunstein, M.; Wicker, K.; Hérault, K.; Heintzmann, R.; Oheim, M. Full-field dual-color 100-nm super-resolution imaging reveals organization and dynamics of mitochondrial and ER networks. Opt. Express 2013, 21, 26162–26173. [Google Scholar] [CrossRef]
- Young, L.J.; Ströhl, F.; Kaminski, C.F. A Guide to Structured Illumination TIRF Microscopy at high speed with multiple colors. J. Vis. Exp. 2016, 111, e53988. [Google Scholar] [CrossRef]
- Guo, M.; Chandris, P.; Giannini, J.P.; Trexler, A.J.; Fischer, R.; Chen, J.; Vishwasrao, H.D.; Rey-Suarez, I.; Wu, Y.; Wu, X.; et al. Single-shot super-resolution total internal reflection fluorescence microscopy. Nat. Methods 2018, 15, 425–428. [Google Scholar] [CrossRef]
- Lanzerstorfer, P.; Stadlbauer, V.; Chtcheglova, L.A.; Haselgrübler, R.; Borgmann, D.; Wruss, J.; Hinterdorfer, P.; Schröder, K.; Winkler, S.M.; Höglinger, O.; et al. Identification of novel insulin mimetic drugs by quantitative total internal reflection fluorescence (TIRF) microscopy. Br. J. Pharmacol. 2014, 171, 5237–5251. [Google Scholar] [CrossRef] [Green Version]
- Ruckstuhl, T.; Verdes, D. Supercritical angle fluorescence (SAF) microscopy. Opt. Express 2004, 12, 4246–4254. [Google Scholar] [CrossRef] [PubMed]
- Barroca, T.; Balaa, K.; Delahaye, J.; Lévêque-Fort, S.; Fort, E. Full-field supercritical angle fluorescence microscopy for live cell imaging. Opt Lett. 2011, 36, 3051–3053. [Google Scholar] [CrossRef] [PubMed] [Green Version]
- Wildanger, D.; Medda, R.; Kastrup, L.; Hell, S.W. A compact STED microscope providing 3D nanoscale resolution. J. Microsc. 2009, 236, 35–43. [Google Scholar] [CrossRef]
- Balzarotti, F.; Eilers, Y.; Gwosch1, K.C.; Gynnå, A.H.; Westphal, V.; Stefani, F.D.; Elf, J.; Hell, S.W. Nanometer resolution imaging and tracking of fluorescent molecules with minimal photon fluxes. Science 2017, 355, 606–612. [Google Scholar] [CrossRef] [Green Version]
- Betzig, E.; Patterson, G.H.; Sougrat, R.; Lindwasser, O.W.; Olenych, S.; Bonifacino, J.S.; Davidson, M.W.; Lippincott-Schwartz, J.; Hess, H.F. Imaging intracellular fluorescent proteins at nanometer resolution. Science 2006, 313, 1642–1645. [Google Scholar] [CrossRef] [Green Version]
- Rust, M.J.; Bates, M.; Zhuang, X. Sub-diffraction-limit imaging by stochastic optical reconstruction microscopy (STORM). Nat. Methods 2006, 3, 793–796. [Google Scholar] [CrossRef] [Green Version]
- Hess, S.T.; Girirajan, T.P.; Mason, M.D. Ultra-high resolution imaging by fluorescence photoactivation localization microscopy. Biophys. J. 2006, 91, 4258–4272. [Google Scholar] [CrossRef] [Green Version]
- Cox, S.; Rosten, E.; Monypenny, J.; Jovanovic-Talisman, T.; Burnette, D.T.; Lippincott-Schwartz, J.; Jones, G.E.; Heintzmann, R. Bayesian localization microscopy reveals nanoscale podosome dynamics. Nat. Methods 2011, 9, 195–200. [Google Scholar] [CrossRef]
- Richter, V.; Bruns, S.; Bruns, T.; Weber, P.; Wagner, M.; Cremer, C.; Schneckenburger, H. Axial Tomography in Live Cell Laser Microscopy. J. Biomed. Opt. 2017, 22, 91505. [Google Scholar] [CrossRef] [Green Version]
- Bruns, T.; Schickinger, S.; Schneckenburger, H. Sample holder for axial rotation of specimens in 3D Microscopy. J. Microsc. 2015, 260, 30–36. [Google Scholar] [CrossRef]
- Verdaasdonk, J.S.; Stephens, A.D.; Haase, J.; Bloom, K. Bending the rules: Widefield microscopy and the Abbe limit of resolution. J. Cell. Physiol. 2014, 229, 132–138. [Google Scholar] [CrossRef] [PubMed] [Green Version]
- Swedlow, J.R. Quantitative fluorescence microscopy and image deconvolution. Methods Cell Biol. 2013, 114, 407–426. [Google Scholar] [CrossRef] [PubMed]
- Yan, L.; Rueden, C.T.; White, J.G.; Eliceiri, K.W. Applications of combined spectral lifetime microscopy for biology. Biotechniques 2006, 41, 249–257. [Google Scholar] [CrossRef]
- Zhu, H.; Fan, J.; Du, J.; Peng, X. Fluorescent Probes for Sensing and Imaging within Specific Cellular Organelles. Acc. Chem. Res. 2016, 49, 2115–2126. [Google Scholar] [CrossRef]
- Tregidgo, C.; Levitt, J.A.; Suhling, K. Effect of refractive index on the fluorescence lifetime of green fluorescent protein. J. Biomed. Opt. 2008, 13, 031218. [Google Scholar] [CrossRef] [PubMed]
- Mehta, S.; Zhang, J. Dynamic visualization of calcium-dependent signaling in cellular microdomains. Cell Calcium 2015, 58, 333–341. [Google Scholar] [CrossRef] [PubMed] [Green Version]
- Schneckenburger, H.; Weber, P.; Wagner, M.; Enderle, S.; Kalthof, B.; Schneider, L.; Herzog, C.; Weghuber, J.; Lanzerstorfer, P. Combining TIR and FRET in molecular test systems. Int. J. Mol. Sci. 2019, 20, 648. [Google Scholar] [CrossRef] [PubMed] [Green Version]
- Heim, R.; Tsien, R.Y. Engineering green fluorescent protein for improved brightness, longer wavelengths and fluorescence resonance energy transfer. Curr. Biol. 1996, 6, 178–182. [Google Scholar] [CrossRef] [Green Version]
- Sorkin, A.; McClure, M.; Huang, F.; Carter, R. Interaction of EGF receptor and Grb2 in living cells visualized by fluorescence resonance energy transfer (FRET) microscopy. Curr. Biol. 2000, 10, 1395–1398. [Google Scholar] [CrossRef] [Green Version]
- Verveer, P.J.; Wouters, F.S.; Reynolds, A.R.; Bastiaens, P.I. Quantitative imaging of lateral ErbB1 receptor signal propagation in the plasma membrane. Science 2000, 290, 1567–1570. [Google Scholar] [CrossRef]
- Mahajan, N.P.; Harrison-Shostak, D.C.; Michaux, J.; Herman, B. Novel mutant green fluorescent protein protease substrates reveal the activation of specific caspases during apoptosis. Chem. Biol. 1999, 6, 401–409. [Google Scholar] [CrossRef] [Green Version]
- Angres, B.; Steuer, H.; Weber, P.; Wagner, M.; Schneckenburger, H. A membrane-bound FRET-based caspase sensor for detection of apoptosis using fluorescence lifetime and total internal reflection microscopy. Cytometry A 2009, 75, 420–427. [Google Scholar] [CrossRef]
- Kiyokawa, E.; Hara, S.; Nakamura, T.; Matsuda, M. Fluorescence (Förster) resonance energy transfer imaging of oncogene activity in living cells. Cancer Sci. 2006, 97, 8–15. [Google Scholar] [CrossRef] [Green Version]
- Von Arnim, C.A.; von Einem, B.; Weber, P.; Wagner, M.; Schwanzar, D.; Spoelgen, R.; Strauss, W.L.; Schneckenburger, H. Impact of cholesterol level upon APP and BACE proximity and APP cleavage. Biochem. Biophys. Res. Commun. 2008, 370, 207–212. [Google Scholar] [CrossRef]
- Levitt, J.A.; Matthews, D.R.; Ameer-Beg, S.M.; Suhling, K. Fluorescence lifetime and polarization-resolved imaging in cell biology. Curr. Opin. Biotechnol. 2009, 20, 28–36. [Google Scholar] [CrossRef]
- Grewal, T.; Enrich, C. Annexins-modulators of EGF receptor signalling and trafficking. Cell Signal. 2009, 21, 847–858. [Google Scholar] [CrossRef]
- Schneckenburger, H.; Weber, P.; Wagner, M.; Enderle, S.; Weghuber, J.; Lanzerstorfer, P. Combining TIR and FRET: From fluorescence microscopy to a multi-well reader system. Adv. Microsc. Imaging Proc. SPIE-OSA 2019, 11076, 110761C. [Google Scholar] [CrossRef]
- Bruns, T.; Strauss, W.S.L.; Sailer, R.; Wagner, M.; Schneckenburger, H. Total internal reflectance fluorescence reader for selective investigations of cell membranes. J. Biomed. Opt. 2006, 11, 34011. [Google Scholar] [CrossRef]
- Stadlbauer, V.; Lanzerstorfer, P.; Neuhauser, C.; Weber, F.; Stübl, F.; Weber, P.; Wagner, M.; Plochberger, B.; Wieser, S.; Schneckenburger, H.; et al. Fluorescence Microscopy-Based Quantitation of GLUT4 Translocation: High Throughput or High Content? Int. J. Mol. Sci. 2020, 21, 7964. [Google Scholar] [CrossRef]
Figure 1.
SIM (schematic) with spatial light modulator SLM (illuminated by an argon ion laser), telescope lenses L1, L2, tube lens TL and objective lens OL. Further components (λ/4 plate, pinhole plate, polarizer, dichroic mirror and camera are omitted). If the two interfering laser beams are incident close to the edges of a high aperture OL, SIM may be combined with Total Internal Reflection Microscopy (TIRFM), as reported below. Reproduced from [15] with modifications.

Figure 2.
Condenser for TIR illumination under variable angle (schematic, (a)); TIRFM image of CHO cells expressing a membrane-associated green Fluorescent Protein (GFP) recorded at Θ = 66° (b); cell-substrate distances in the range of 0–400 nm calculated from VA-TIRFM according to Equation (1) and shown by color code (c) (excitation wavelength: 476 nm, detection range: λ ≥ 490 nm; scale bar: 20 µm).

Figure 3.
Comparison of SIM (left) and SIM-TIRFM (right): CHO-K1-hIR-myc-GLUT4-GFP cell, excitation wavelength: λex = 488 nm; detection range: λD ≥ 515 nm; Plan Neofluar 40×/1.30 oil immersion lens (left) or Plan Apochromat 63×/1.46 oil immersion objective lens (right). GFP fluorescence arising from intracellular vesicles (left) or the whole plasma membrane (right). Reproduced from [15] with modifications.

Figure 4.
Point spread function for high resolution wide-field microscopy (a), axial tomography (b) and a combination of axial tomography with Structured Illumination Microscopy (SIM) (c).
Figure 4.
Point spread function for high resolution wide-field microscopy (a), axial tomography (b) and a combination of axial tomography with Structured Illumination Microscopy (SIM) (c).

Figure 5.
Fluorescence lifetime of CHO-K1 hIR/GLUT4-myc-GFP cells prior to (left columns) and subsequent to (right columns) 30 min stimulation with insulin, tannic acid or Bellis perennis extract. Results show means ± standard deviations of 13 (insulin) or 14 (tannic acid, Bellis perennis) cell specimens upon whole cell (“EPI”) or TIRF illumination. Levels of significance: * p < 0.01, **** p < 0.0001, and n.s. no significant difference for comparison of epi- and TIR illumination (reproduced from [15], Supplementary Information, with modifications).

Figure 6.
TIR fluorescence images of HeLa cells transfected with EGFR-CFP and Grb2-YFP in the spectral ranges of donor (450–490 nm) and acceptor (λ ≥ 510 nm) emission (top); fluorescence lifetimes of the donor EGFR-CFP in absence (bottom, left) and presence (bottom, right) of the acceptor; excitation wavelength: 420–440 nm; image size: 60 µm × 60 µm (top), 100 µm × 100 µm (bottom). Reproduced from [39] with modifications.


Table 1.
Typical size of cell organelles and related super-resolution techniques.
| Organelle | Diameter (typ.) | Technique |
|---|---|---|
| nucleus | 6–12 µm | SIM 1 |
| mitochondrium | 0.5–1.5 µm | |
| lysosome | 0.1–1.2 µm | |
| microtubule | ~25 nm | STED/MINFLUX/SMLM 1 |
| Actin filament | ~7 nm | |
| membrane | 4–5 nm | TIRFM |
| protein | 3–6 nm |
1 Techniques are further described in Section 2.
Publisher’s Note: MDPI stays neutral with regard to jurisdictional claims in published maps and institutional affiliations. |
© 2021 by the authors. Licensee MDPI, Basel, Switzerland. This article is an open access article distributed under the terms and conditions of the Creative Commons Attribution (CC BY) license (https://creativecommons.org/licenses/by/4.0/).
Share and Cite
MDPI and ACS Style
Richter, V.; Lanzerstorfer, P.; Weghuber, J.; Schneckenburger, H. Probing Small Distances in Live Cell Imaging. Photonics 2021, 8, 176. https://0-doi-org.brum.beds.ac.uk/10.3390/photonics8060176
AMA Style
Richter V, Lanzerstorfer P, Weghuber J, Schneckenburger H. Probing Small Distances in Live Cell Imaging. Photonics. 2021; 8(6):176. https://0-doi-org.brum.beds.ac.uk/10.3390/photonics8060176
Chicago/Turabian StyleRichter, Verena, Peter Lanzerstorfer, Julian Weghuber, and Herbert Schneckenburger. 2021. "Probing Small Distances in Live Cell Imaging" Photonics 8, no. 6: 176. https://0-doi-org.brum.beds.ac.uk/10.3390/photonics8060176
Note that from the first issue of 2016, this journal uses article numbers instead of page numbers. See further details here.