Article

High Sensitivity Fiber Gas Pressure Sensor with Two Separated Fabry–Pérot Interferometers Based on the Vernier Effect

1
College of Electronics Engineering, Heilongjiang University, Harbin 150080, China
2
Department of Optoelectronics Science, Harbin Institute of Technology at Weihai, Weihai 264209, China
*
Author to whom correspondence should be addressed.
Submission received: 23 November 2021 / Revised: 29 December 2021 / Accepted: 30 December 2021 / Published: 4 January 2022
(This article belongs to the Special Issue Optical Sensing)

Abstract

:
A high sensitivity optical fiber gas pressure sensor based on paralleled Fabry–Pérot interferometers (FPIs) was demonstrated. One micro-cavity FPI is used as a reference FPI (FPI-1) to generate a Vernier effect and the other FPI (FPI-2) is used as a sensing tip. Both FPIs are connected by a 3-dB coupler to form a paralleled structure. The FPI-1 was fabricated by fusion splicing a piece of hollow core fiber (HCF) between two sections of single-mode fibers (SMF), whereas FPI-2 was formed by fusion splicing a section of HCF between SMF and a piece of HCF with a slightly smaller inner diameter for sensing pressure. The gas pressure sensitivity was amplified from 4 nm/MPa of single FPI to 45.76 nm/MPa of paralleled FPIs with an amplification factor of 11.44 and a linearity of 99.9%. Compared with the traditional fiber gas pressure sensors, the proposed sensor showed great advantages in sensitivity, mechanical strength, cost, and temperature influence resistant, which has potential in adverse-circumstance gas pressure sensing.

Graphical Abstract

1. Introduction

Optical fiber gas pressure sensors have been widely used in automatic production, aerospace, military, and medical diagnosis fields due to their advantages of compactness, anti-interference, and high-accuracy [1,2,3]. Various optical fiber sensors, such as long-period fiber gratings (LPFGs) [4,5], fiber Bragg gratings (FBGs) [6,7], Mach–Zehnder interferometers (MZIs) [8,9], and FPIs [10,11] have been developed to measure gas pressure, and among them, FPI is very promising owing to its flexible manufacturing, easy operation, and convenient combination.
The mechanism of FPI sensors for measuring gas pressure is to obtain the gas pressure variation tendency by observing the change of the fiber refractive index (RI) or the F–P cavity length. In the open cavity structure, the F–P cavity is directly in touch with the external environment, and the gas pressure can be detected by monitoring the shift of the reflection spectrum, which is induced by the change of the RI distribution [12,13]. In 2015, Wang et al. reported an F–P gas pressure sensor based on a side-opened channel structure, which realized the gas pressure sensitivity of 4.24 nm/MPa [14]. In 2016, Hou et al. demonstrated a gas pressure sensor based on an anti-resonant reflecting guidance mechanism with a single HCF, whose gas pressure sensitivity was 3.59 nm/MPa [15]. In fact, the theoretical analysis reported in [16] showed that the sensitivity of the open structure gas pressure sensor is low, which is predicted to be less than 5 nm/MPa. However, by using the closed cavity structure, the gas pressure difference between inside and outside the cavity can result in the change of the F–P cavity length so that the gas pressure can be retrieved by the spectral drifting under this condition [17,18]. In 2019, Cui et al. reported an FPI gas pressure sensor fabricated by an exfoliated ultrathin graphene atomic layer, and a sensitivity of 9620 nm/MPa was obtained [19]. In 2021, Wang et al. utilized Ecoflex0030 silicone rubber/Polydimethylsiloxane as the end face of the closed F–P cavity, and a sensitivity of 30.2 nm/MPa was realized [20]. However, the mechanical strength and the measuring range of the closed cavity gas pressure sensor are always blamed due to the fact that the thin membrane attached at the fiber end can be easily cracked and further applications will be restricted. Therefore, ensuring a wide measurement range while still maintaining high sensitivity has always been the goal pursued in the field of gas pressure measurement.
The Vernier effect has been proven to be an effective method to promote the sensitivity of an optical fiber sensor. The principle of the Vernier effect is to make two interferometers with small free spectral range (FSR) differences generate a superimposed spectrum, which will raise the sensitivity by measuring the response of the envelope. The key point of realizing the Vernier effect is to make FSRs of the two interferometers similar but not completely equal [21]. At present, the cascaded FPIs [22,23,24], cascaded MZIs [25,26], cascaded Sagnac interferometers (SIs) [27,28], and cascaded ring resonators [29] have successfully realized the Vernier effect. For gas pressure sensing, the Vernier effect based on MZIs [30] and FPIs [31] have been proposed and exhibited an ultra-high sensitivity of 82.131 nm/MPa and 86.64 nm/MPa, but the sensors were fabricated by a femtosecond laser (Fs), which greatly increased the cost and the difficulty of manufacturing, and the temperature crosstalk cannot be ignored.
In this paper, a high sensitivity gas pressure sensor using paralleled FPIs based on the Vernier effect is demonstrated. Two separated F–P cavities with slight length difference are connected by a 3-dB coupler for sensing and referencing. The optical paths of these two FPIs are approximately equal, so the Vernier effect can be generated. By using the Vernier effect, the gas pressure sensitivity of the proposed sensor has been greatly improved. Experimental results show that gas pressure sensitivity is enhanced to 45.76 nm/MPa by the Vernier effect with an amplification factor of 11.44 and linearity of 99.9%. In addition, the reference FPI can be isolated from the sensing FPI and detection environment due to the separated structure. Thus, reference FPI cannot be affected by external environmental temperature. Only the temperature response of sensing FPI can be amplified, due to the extremely low thermo-optical coefficient and thermal expansion coefficient of air, leading to a temperature crosstalk of 0.097 KPa/°C. The proposed gas pressure sensor is expected to be used in broader areas for its high sensitivity, low cost, high mechanical strength, and temperature influence resistance.

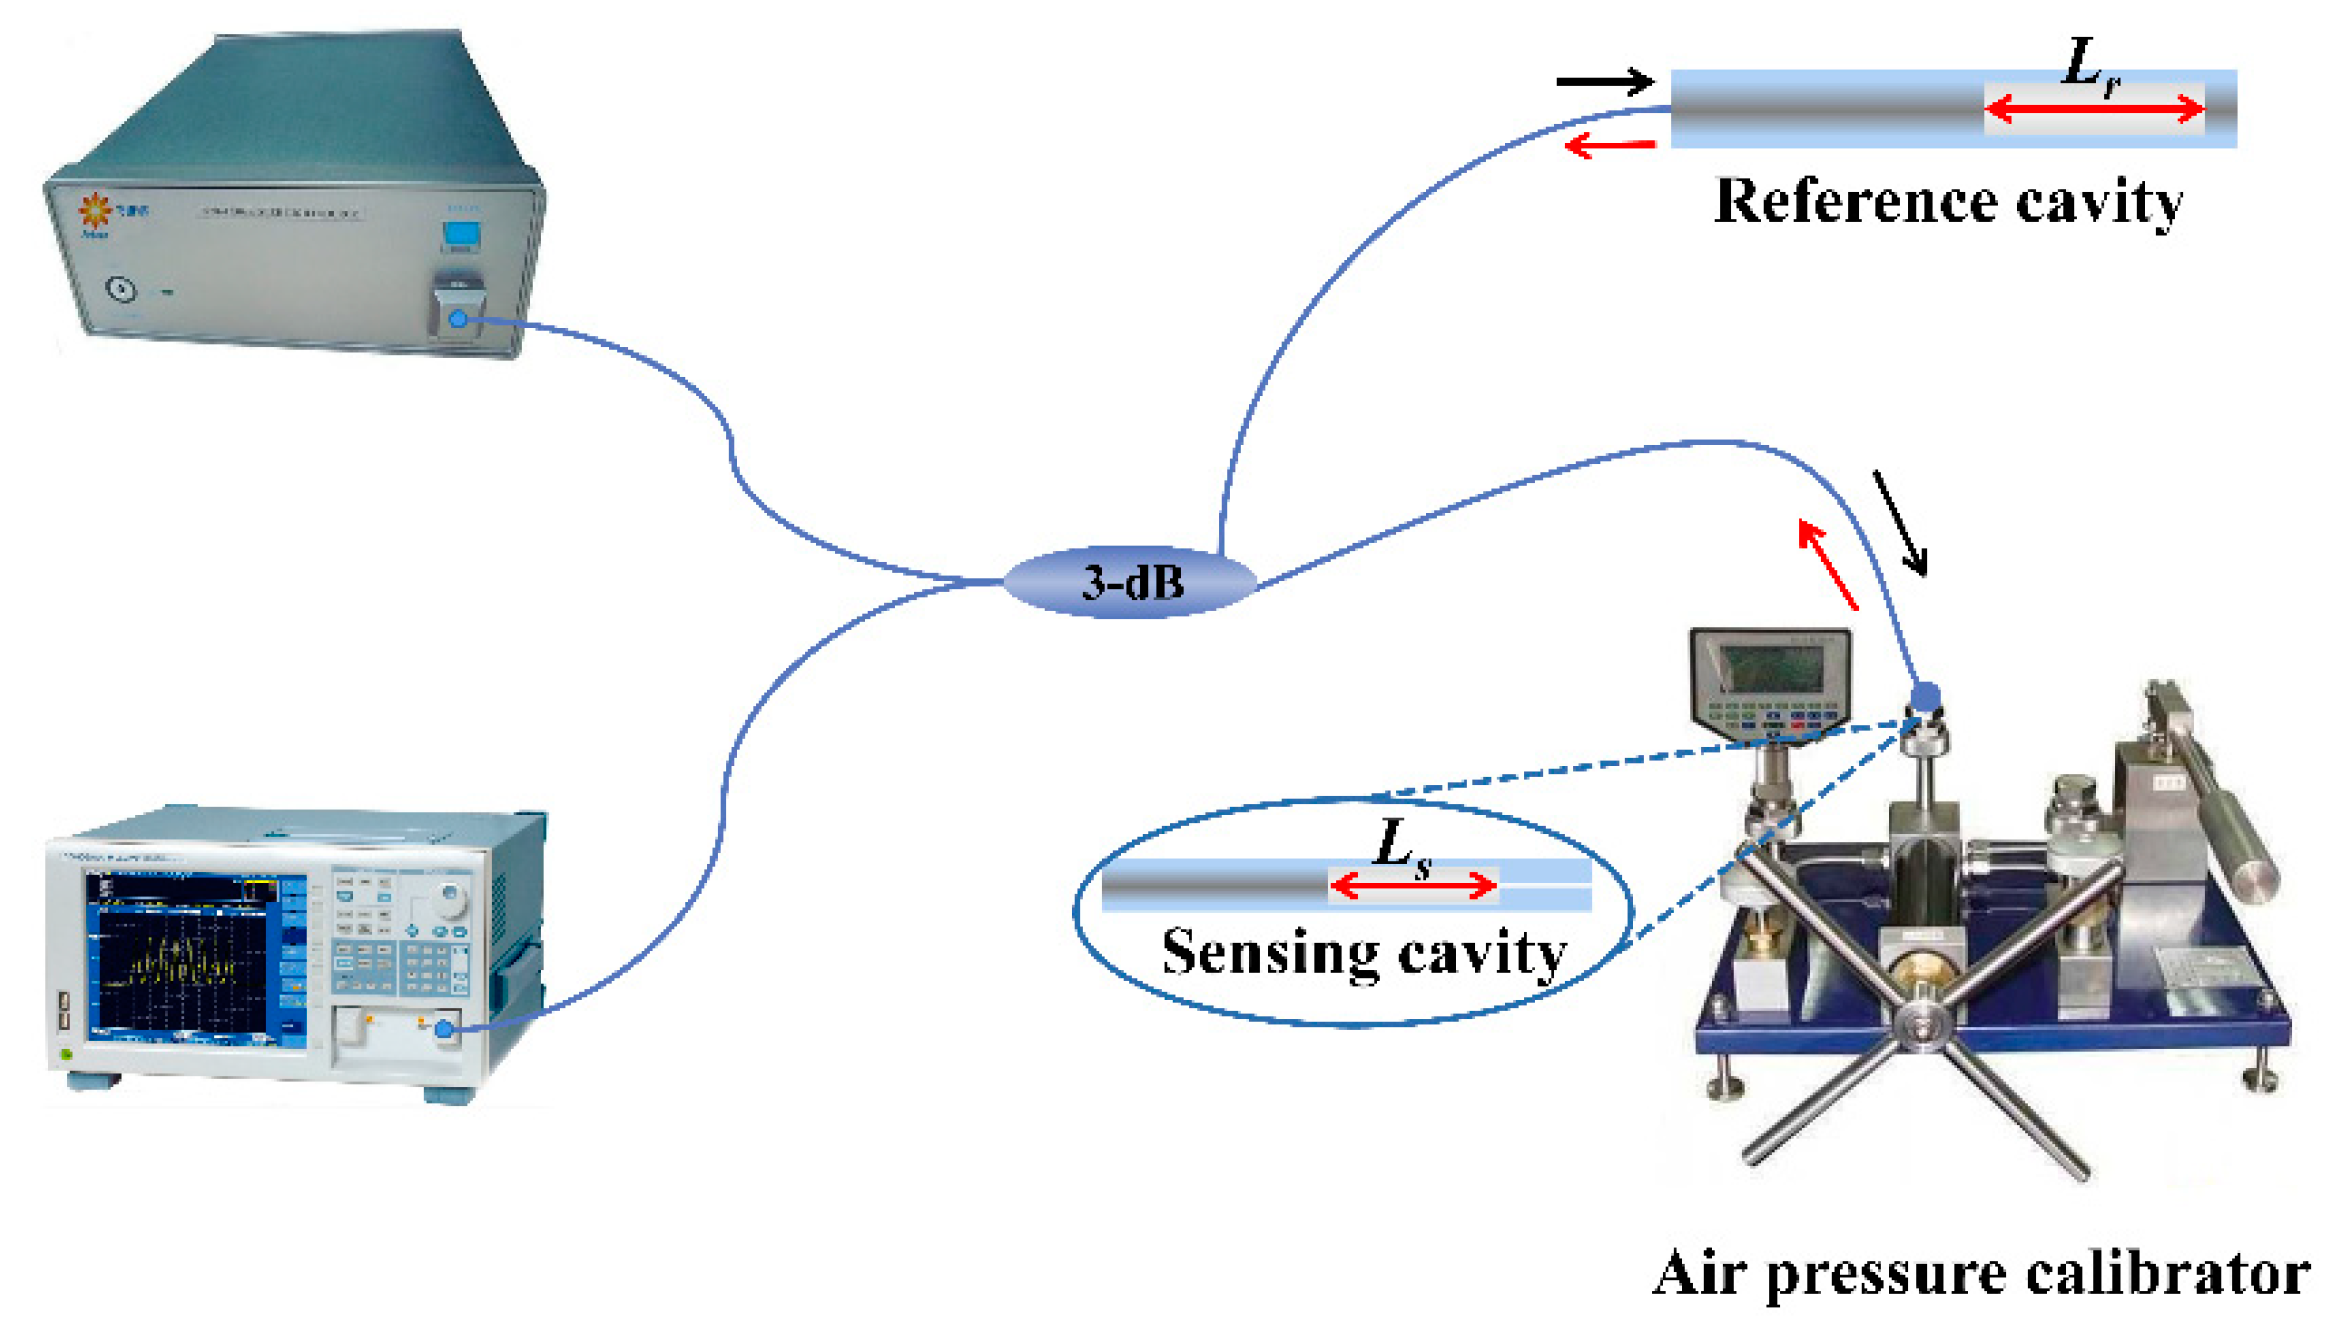
2. Fabrication and Principle

The schematic of the proposed gas pressure sensor is shown in Figure 1. It is constructed by two paralleled F–P cavities. Figure 1a,c show the schematic of the two FPIs. The first F–P cavity fabricated by fusion splicing a section of HCF (Polymicro Technologies, TSP050125) between two sections of SMF (Corning, SMF28) is used as a reference, as shown in Figure 1a. The second is fabricated by fusion splicing a piece of HCF between SMF and HCF with the slightly smaller inner diameter in order to make the micro-cavity connect to the external environment for sensing the gas pressure, as shown in Figure 1c. Figure 1b,d are the microscope images of the two cavities. The core and the cladding diameters of SMF are 8.3 μm and 125 μm. The inner diameter and outer diameter of the first section of HCF in sensing FPI are 50 μm and 125 μm, and those of the second section of HCF in sensing FPI are 5 μm and 125 μm. Two FPIs are connected by a 3-dB coupler so that the incident light from the broadband light source (BBS, 1400–1600 nm) can be divided into two parts and the reflected light can be coupled into a 3-dB coupler, and then transmitted into an optical spectrum analyzer (OSA, with a resolution of 0.02 nm), as shown in Figure 1e.
The single sensing FPI is shown in Figure 1c. The incident light beams were reflected by two splicing surfaces S3 and S4 to form an optical path difference, and the generated spectrum could be detected by OSA. The center wavelength of the m order interference dip can be expressed as:
λ m = 4 L s 2 m + 1 n s
where Ls and ns represent the length and the RI of the F–P sensing cavity, respectively. Since the gas pressure results in RI changes of the F–P cavity without influence on the cavity length, the influence of the gas pressure on the cavity length variation can be ignored. The gas pressure sensitivity can be derived as [32,33]:
S P single = λ m P = 4 L s 2 m + 1 n s P + 4 n s 2 m + 1 L s P = λ m ( n s n s P + L s L s P ) λ m n s n s P
Combining two FPIs with a 3-dB coupler, the total output light intensity can be considered as a simple superposition of every single FPI output signal. The output light intensity of two paralleled FPIs is given by [34]:
I ( λ ) = 1 2 i = 1 2 2 R [ 1 cos ( 4 π L i λ 0 ) ] I 0
where R represents reflectance of the reflective surface, which can be calculated to be 0.04. Li represents the length of the F–P reference cavity; I0 is the incident light source intensity; λ0 is the central wavelength. It is well known that the maximum (minimum) value of the superimposed spectrum will appear when the peak (dip) of the reflection spectrum of the reference cavity and the peak (dip) of the reflection spectrum of the sensing cavity overlap. The FSRr or FSRs of the two reflection spectra can be defined as:
F S R r = λ 2 Δ n r L r , F S R s = λ 2 Δ n s L s
Due to the tiny difference between the length of reference cavity and sensing cavity, FSRr and FSRs is similar but not equal, which makes the spectrum of the paralleled FPIs present an envelope. The FSR of the envelope can be expressed as:
F S R e n v e l o p e = F S R r F S R s | F S R r F S R s |
With the changes of the external gas pressure, the RI of the gas in sensing FPI will change, while that of the reference FPI will remain the same so that a shift in the envelope spectrum will appear. The pressure sensitivity of the envelope spectrum is given by:
S P e n v e l o p e = λ P
According to Equations (4) and (6), it can be concluded that the gas pressure sensitivity of the envelope spectrum at the central wavelength is:
S P e n v e l o p e = λ m ( L s P 1 L s + n s P 1 n s ) F S R r | F S R r F S R s |
Compared with Equation (2), the gas pressure sensitivity is magnified M times by the Vernier effect than that of single sensing FPI. The amplification factor is defined as:
M = | S P e n v e l o p e S P single | = F S R r | F S R r F S R s |

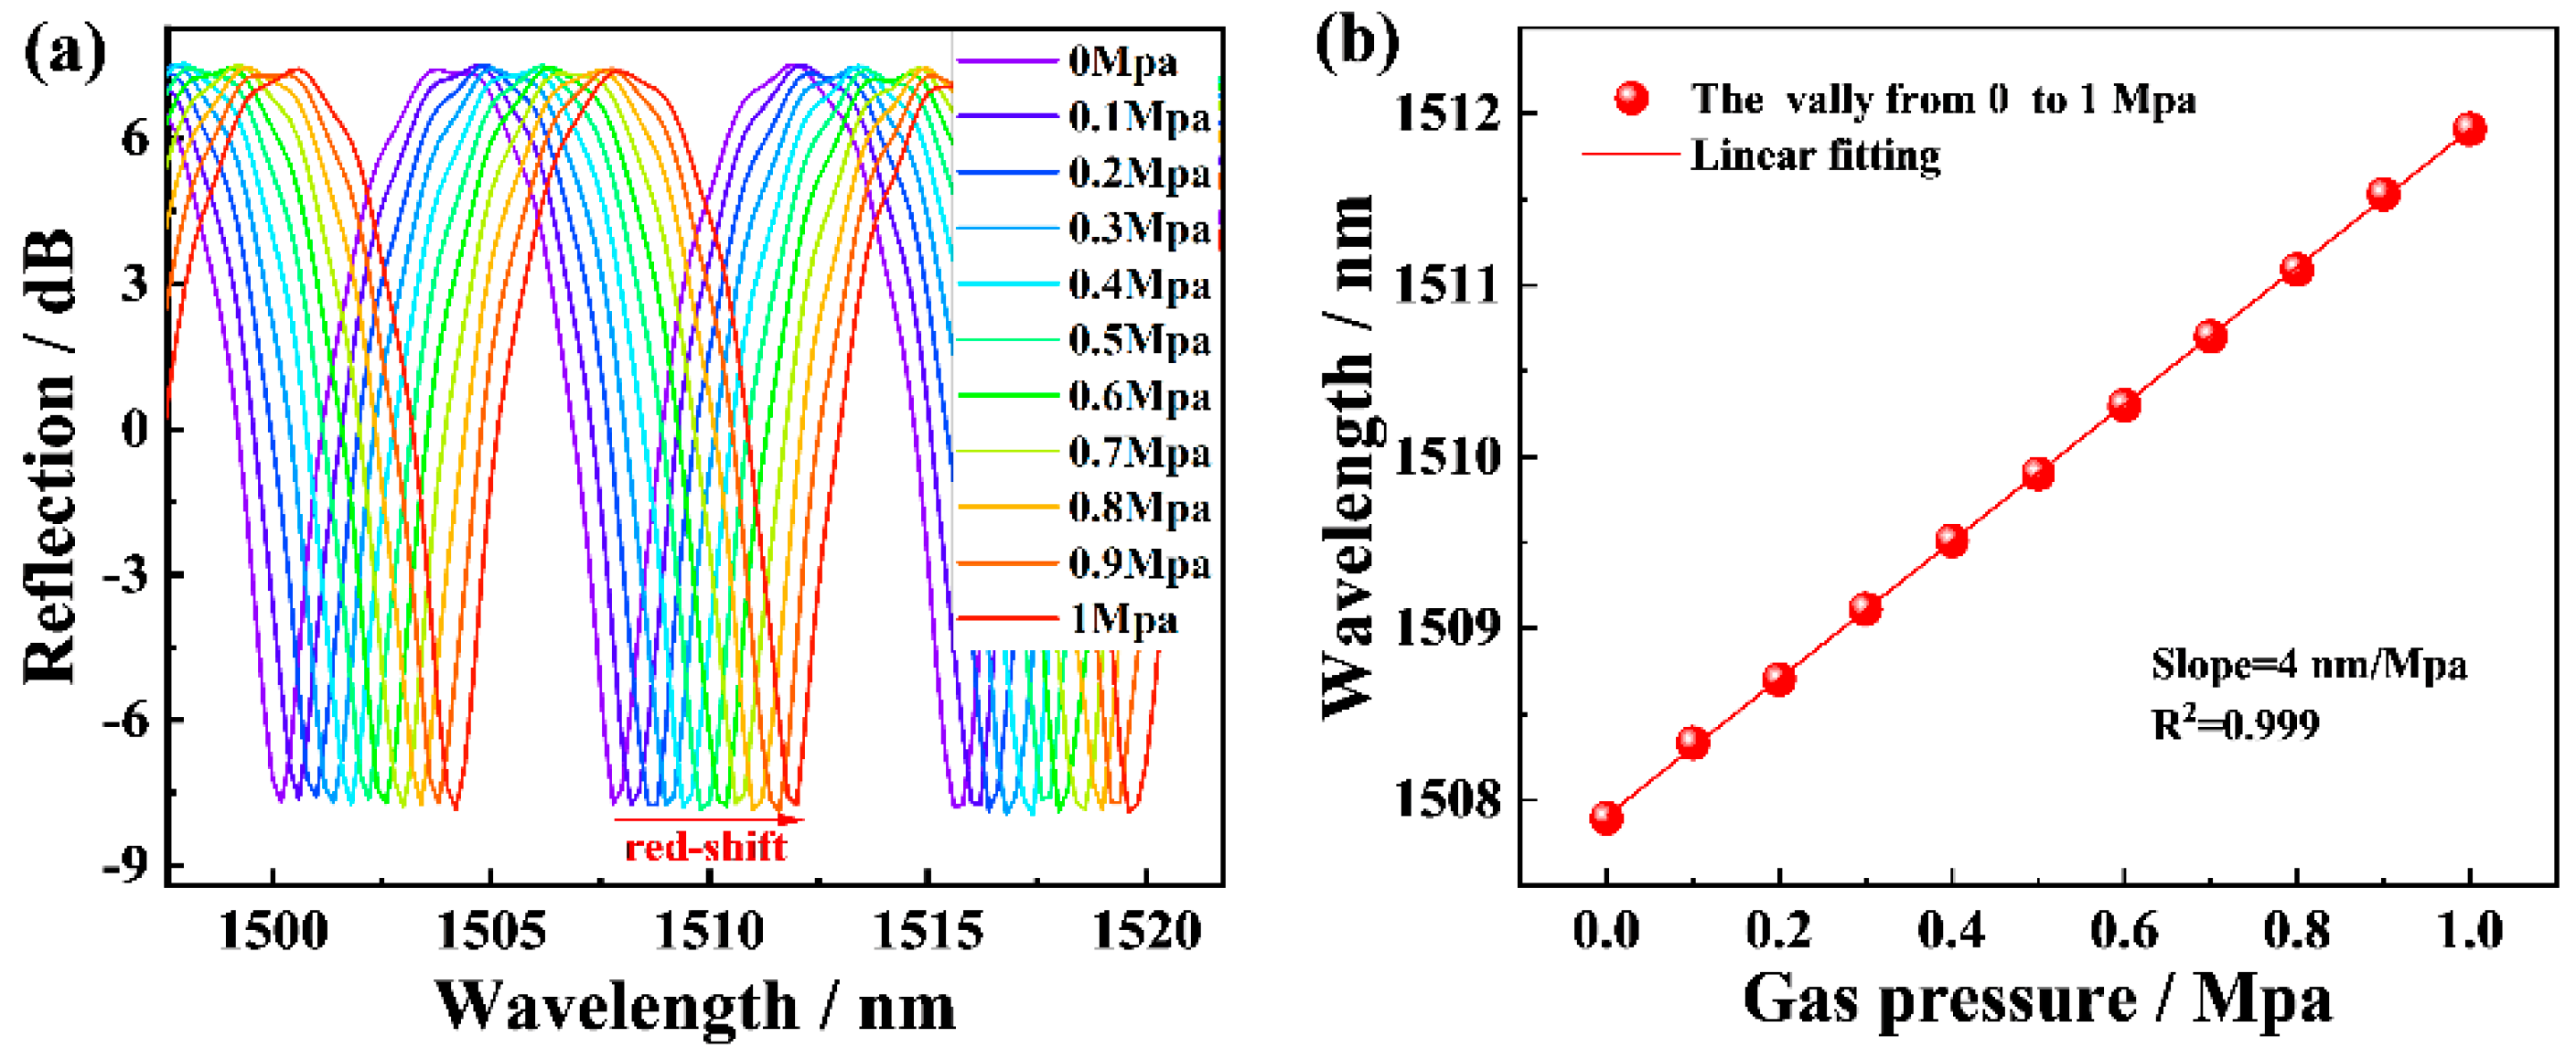
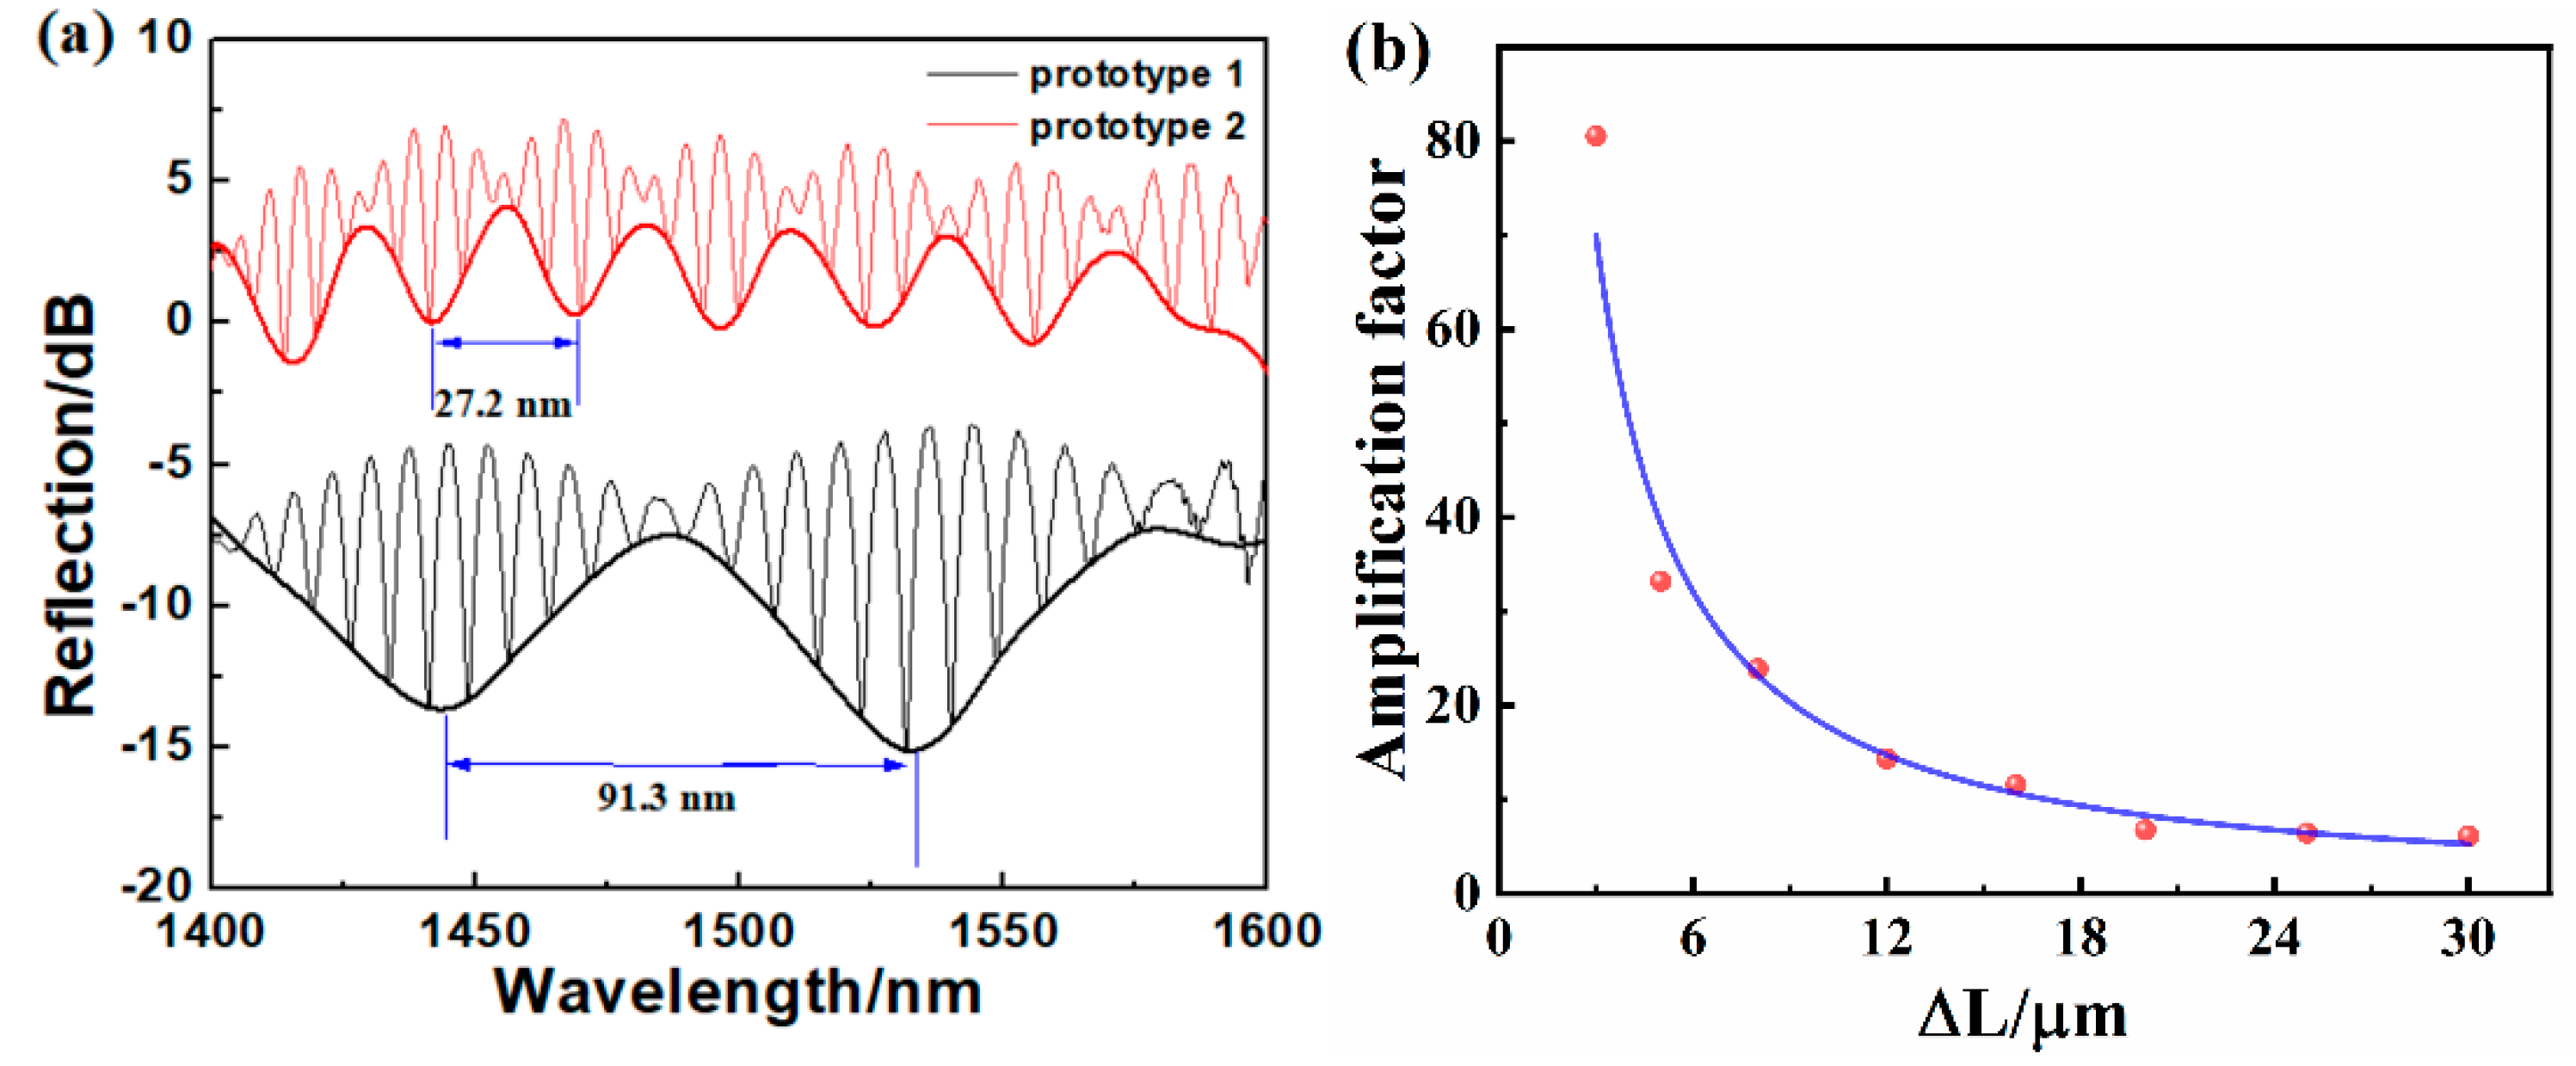
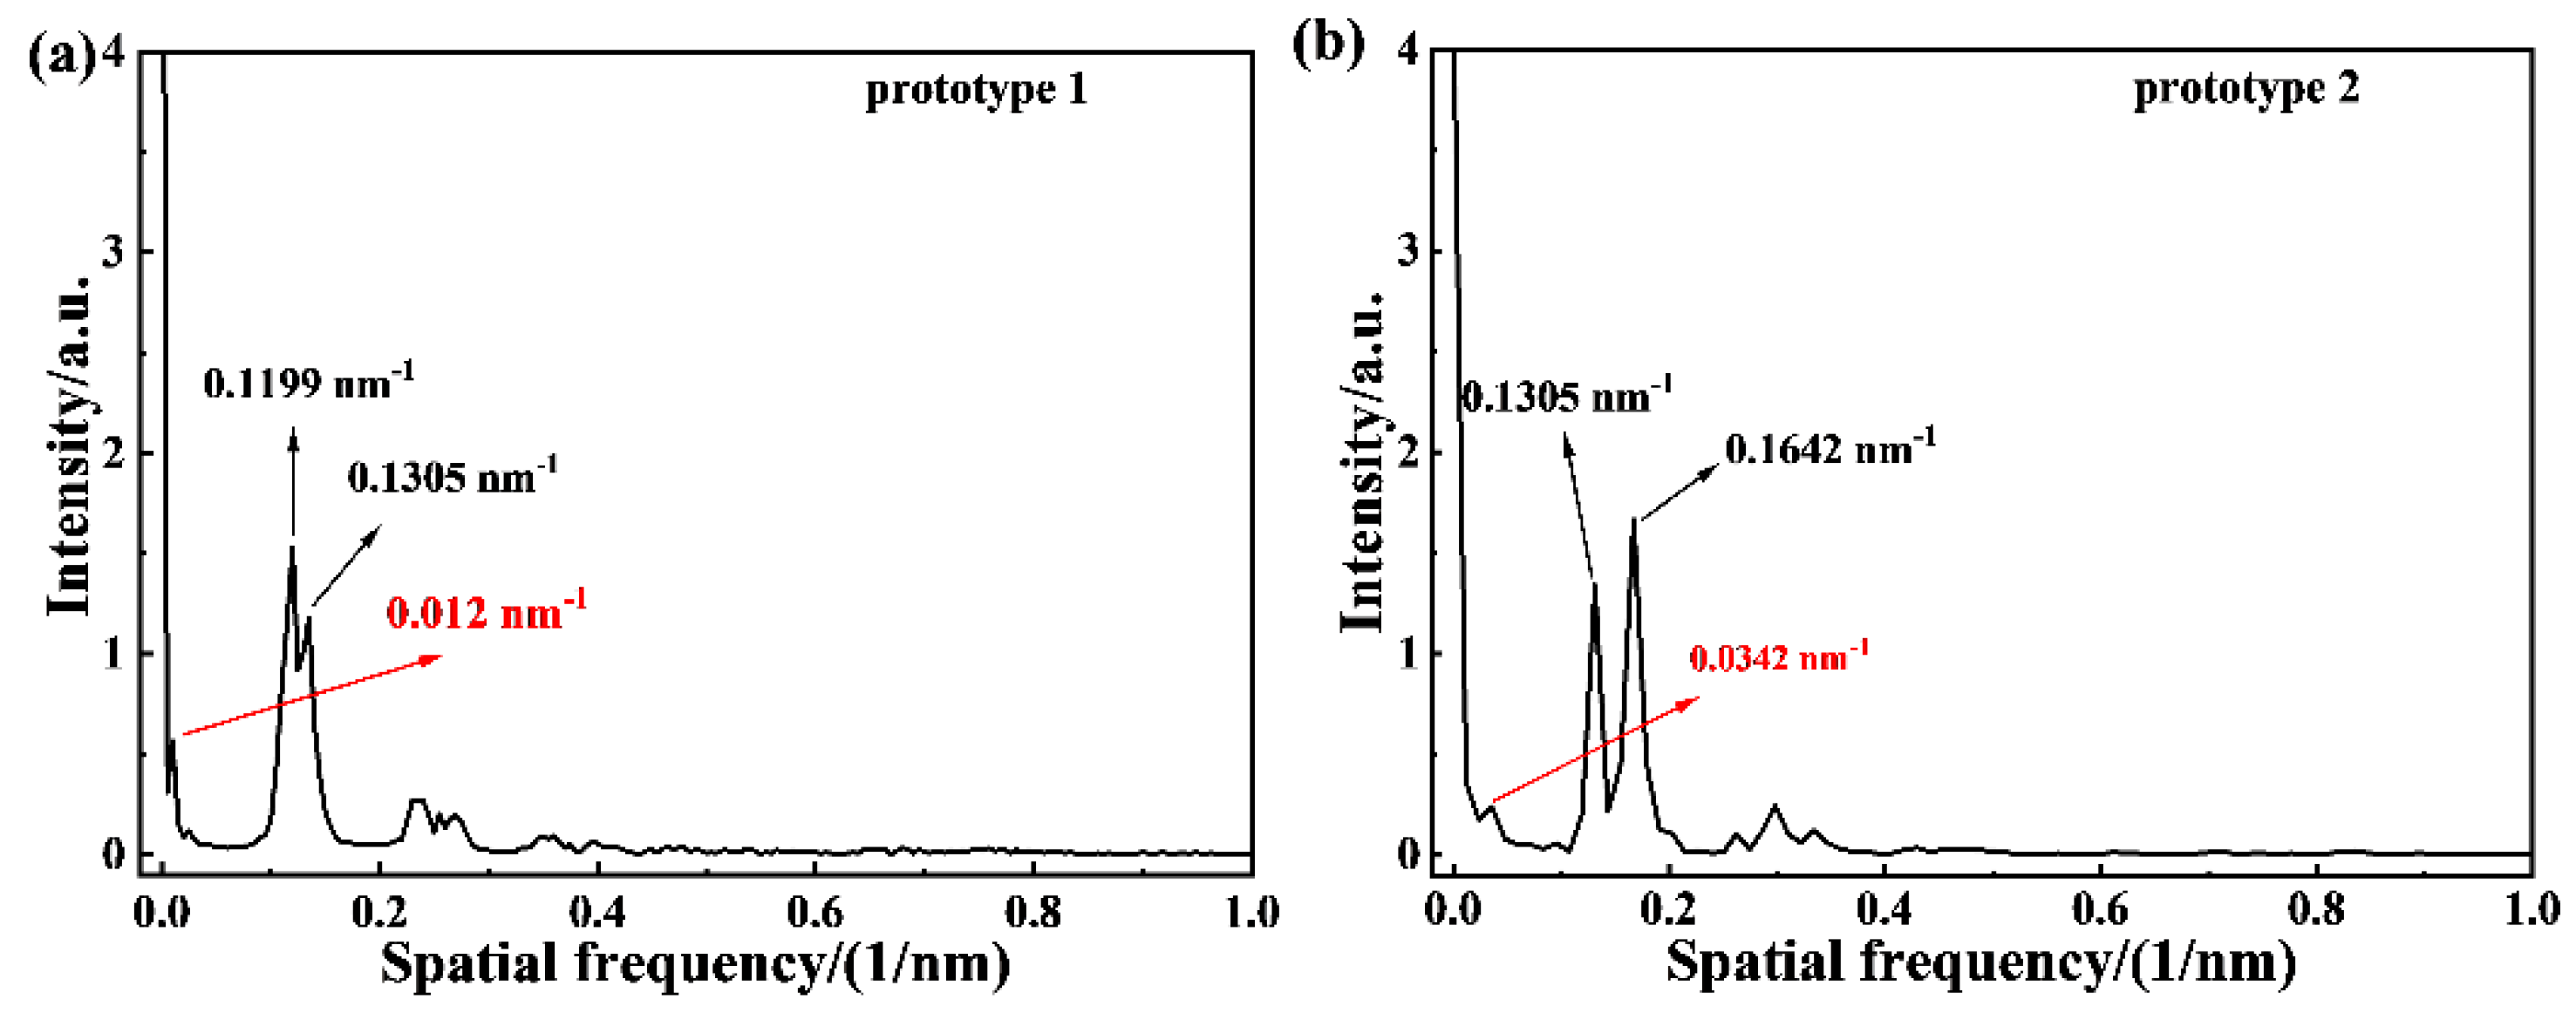
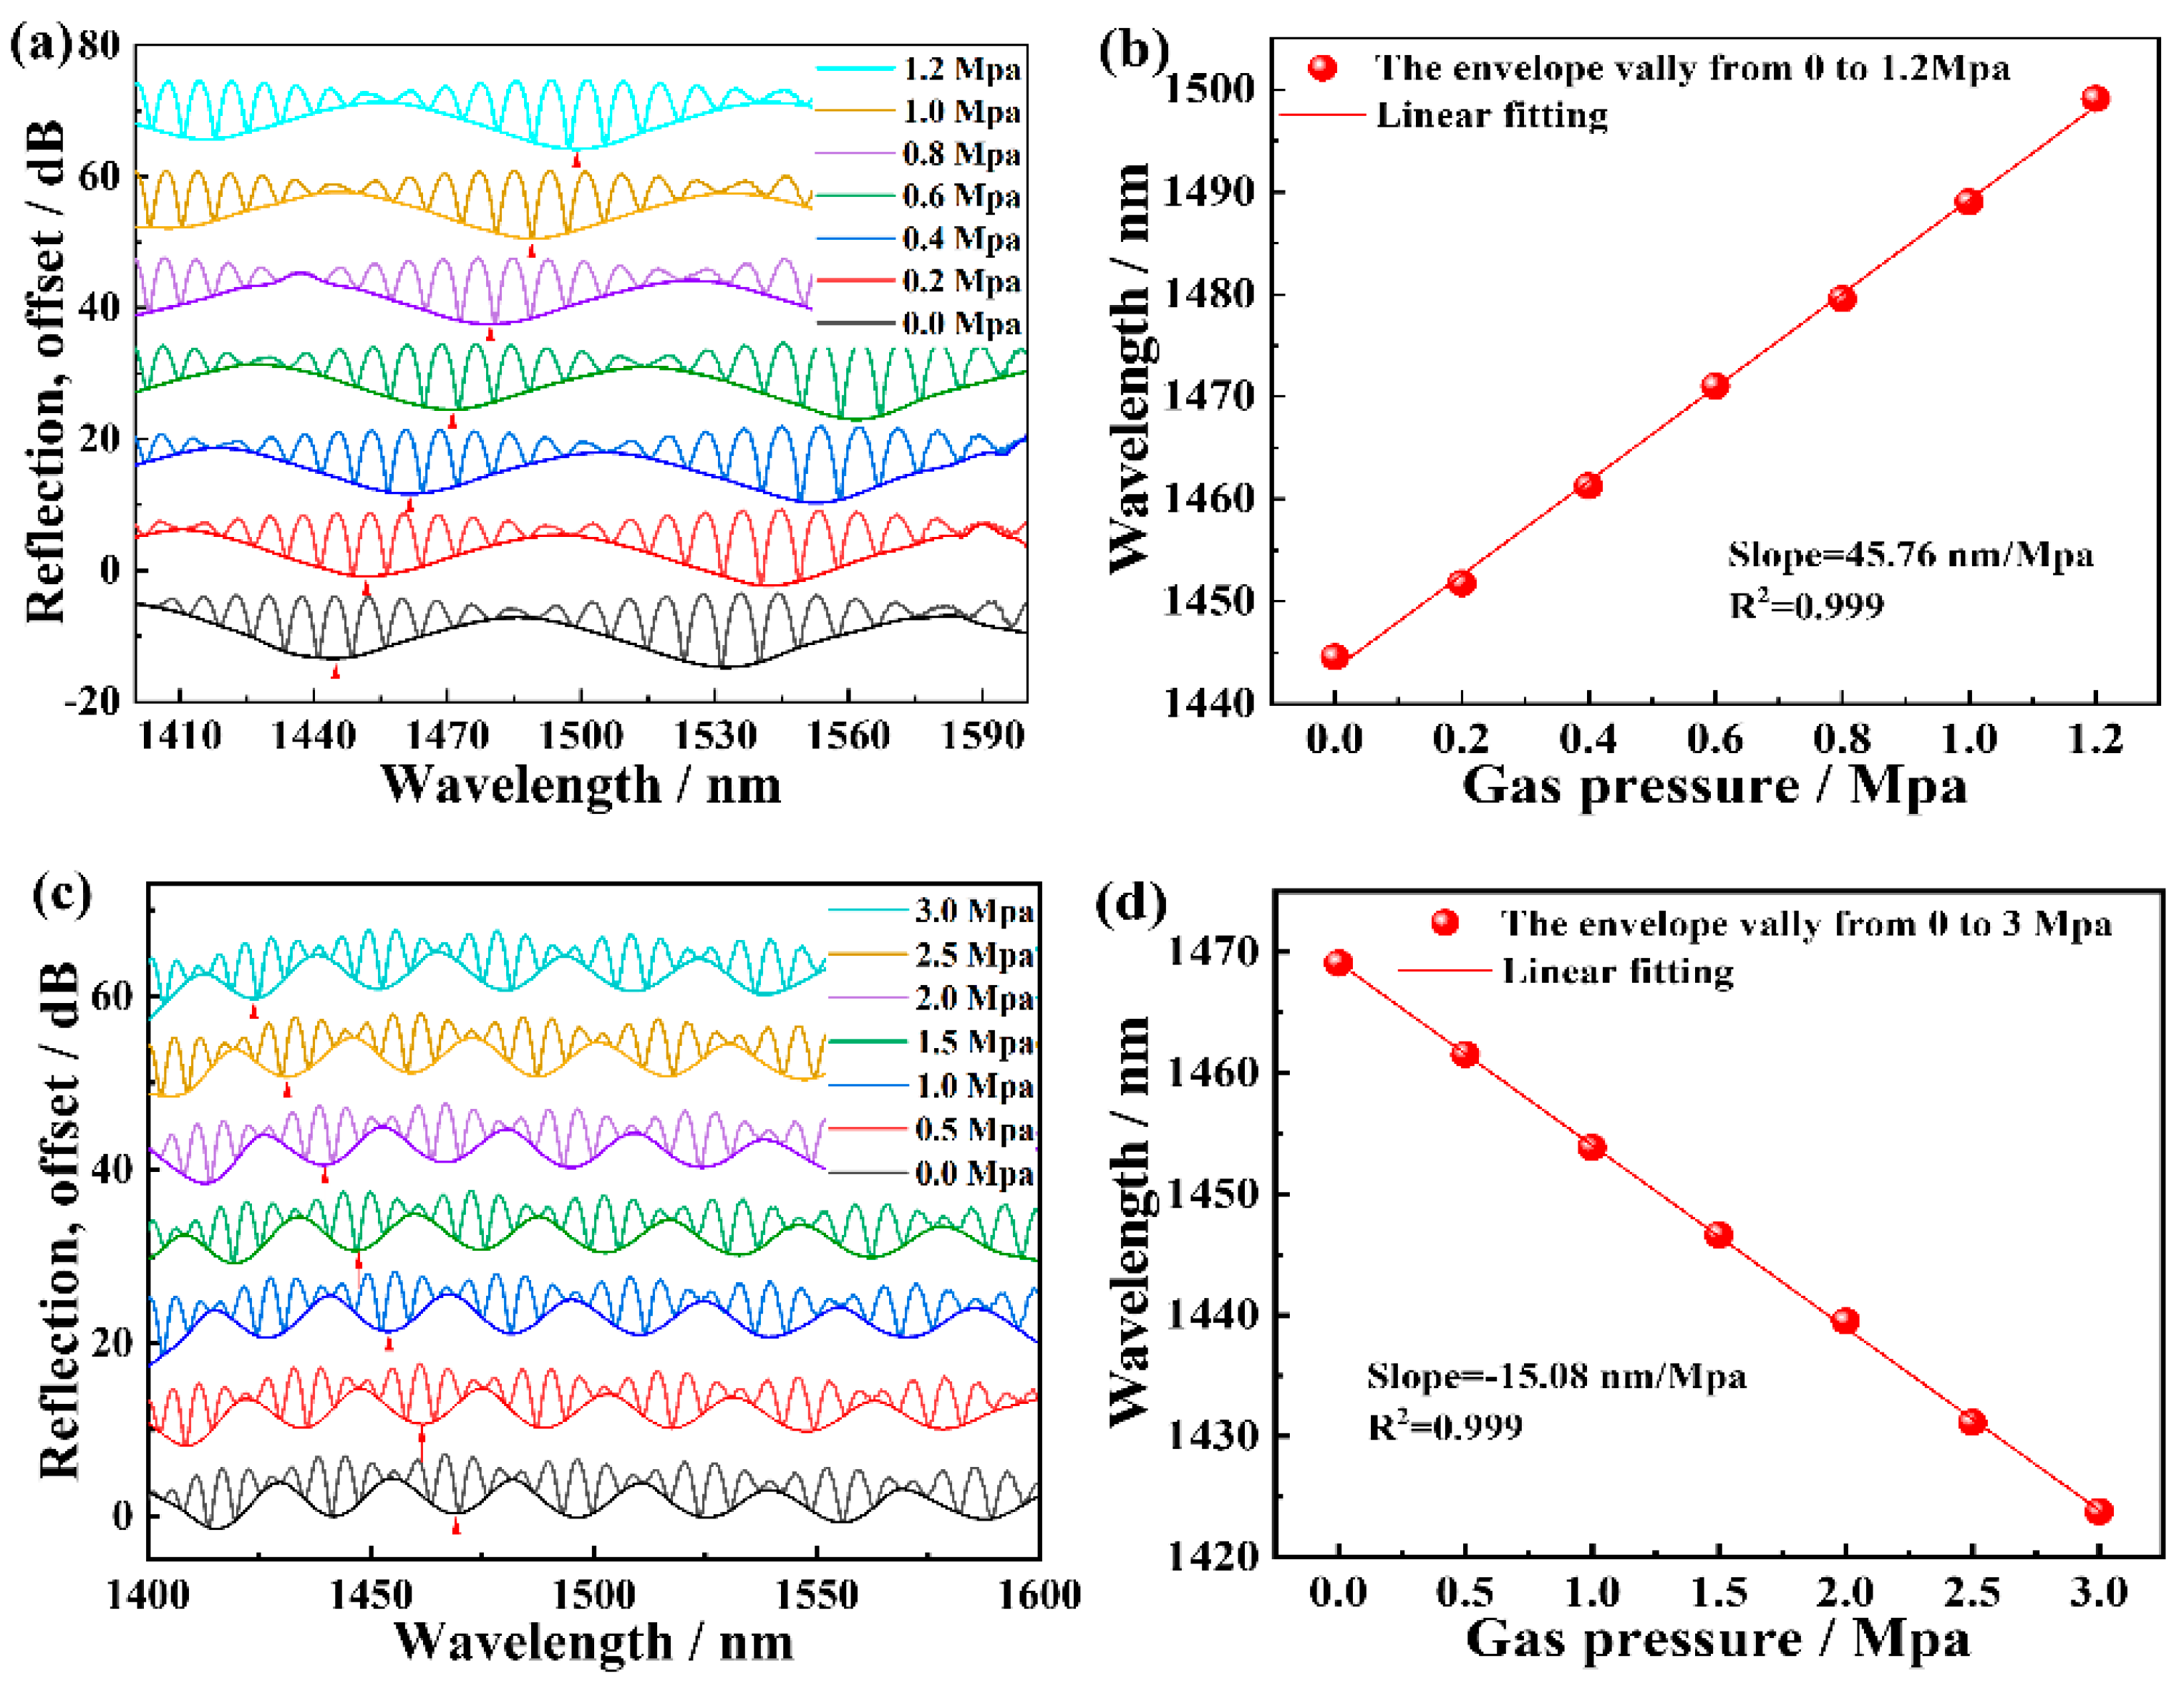
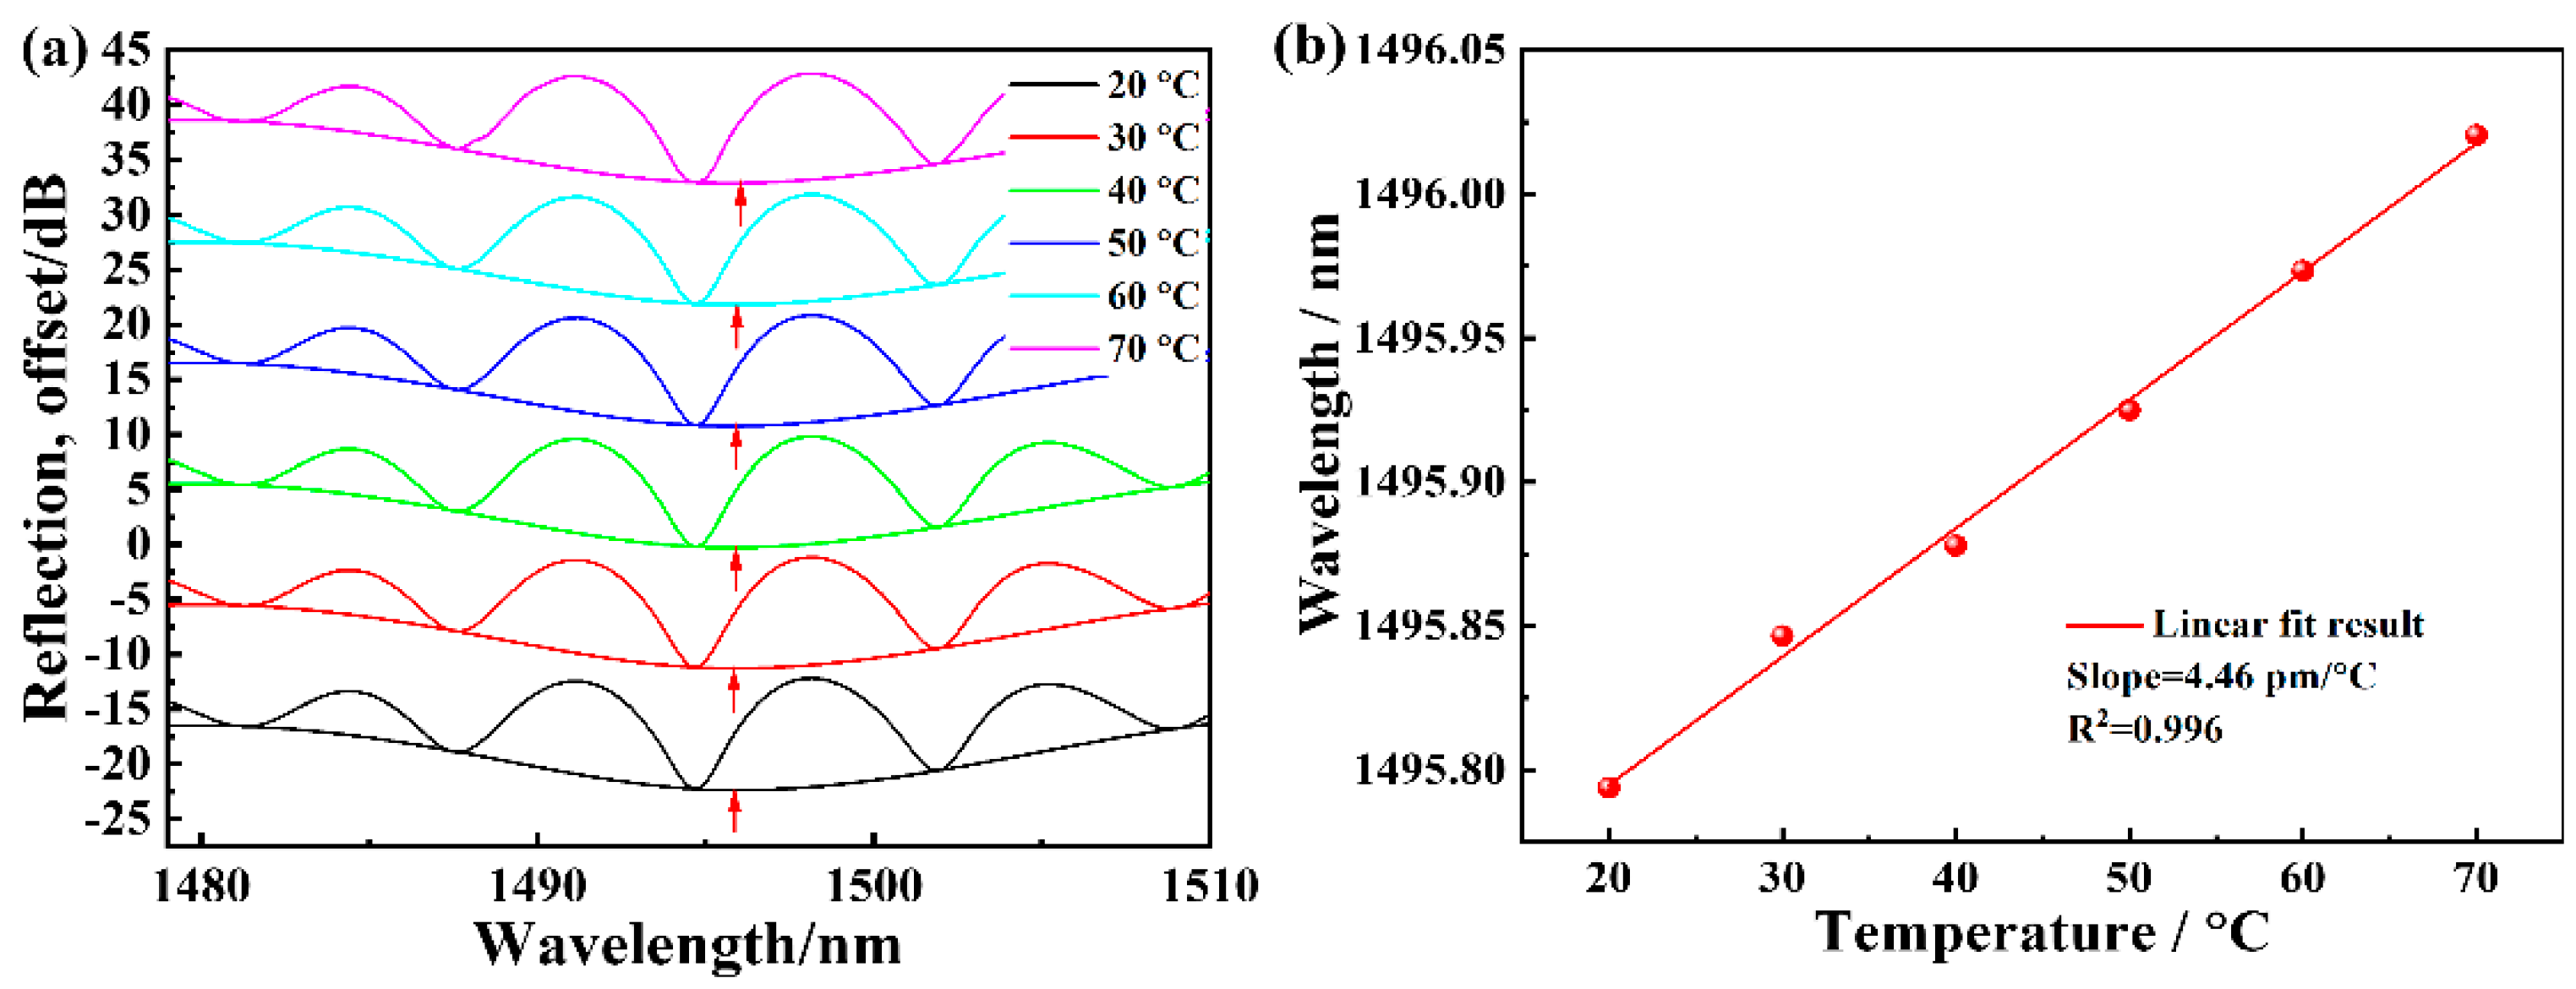
3. Experimental Results
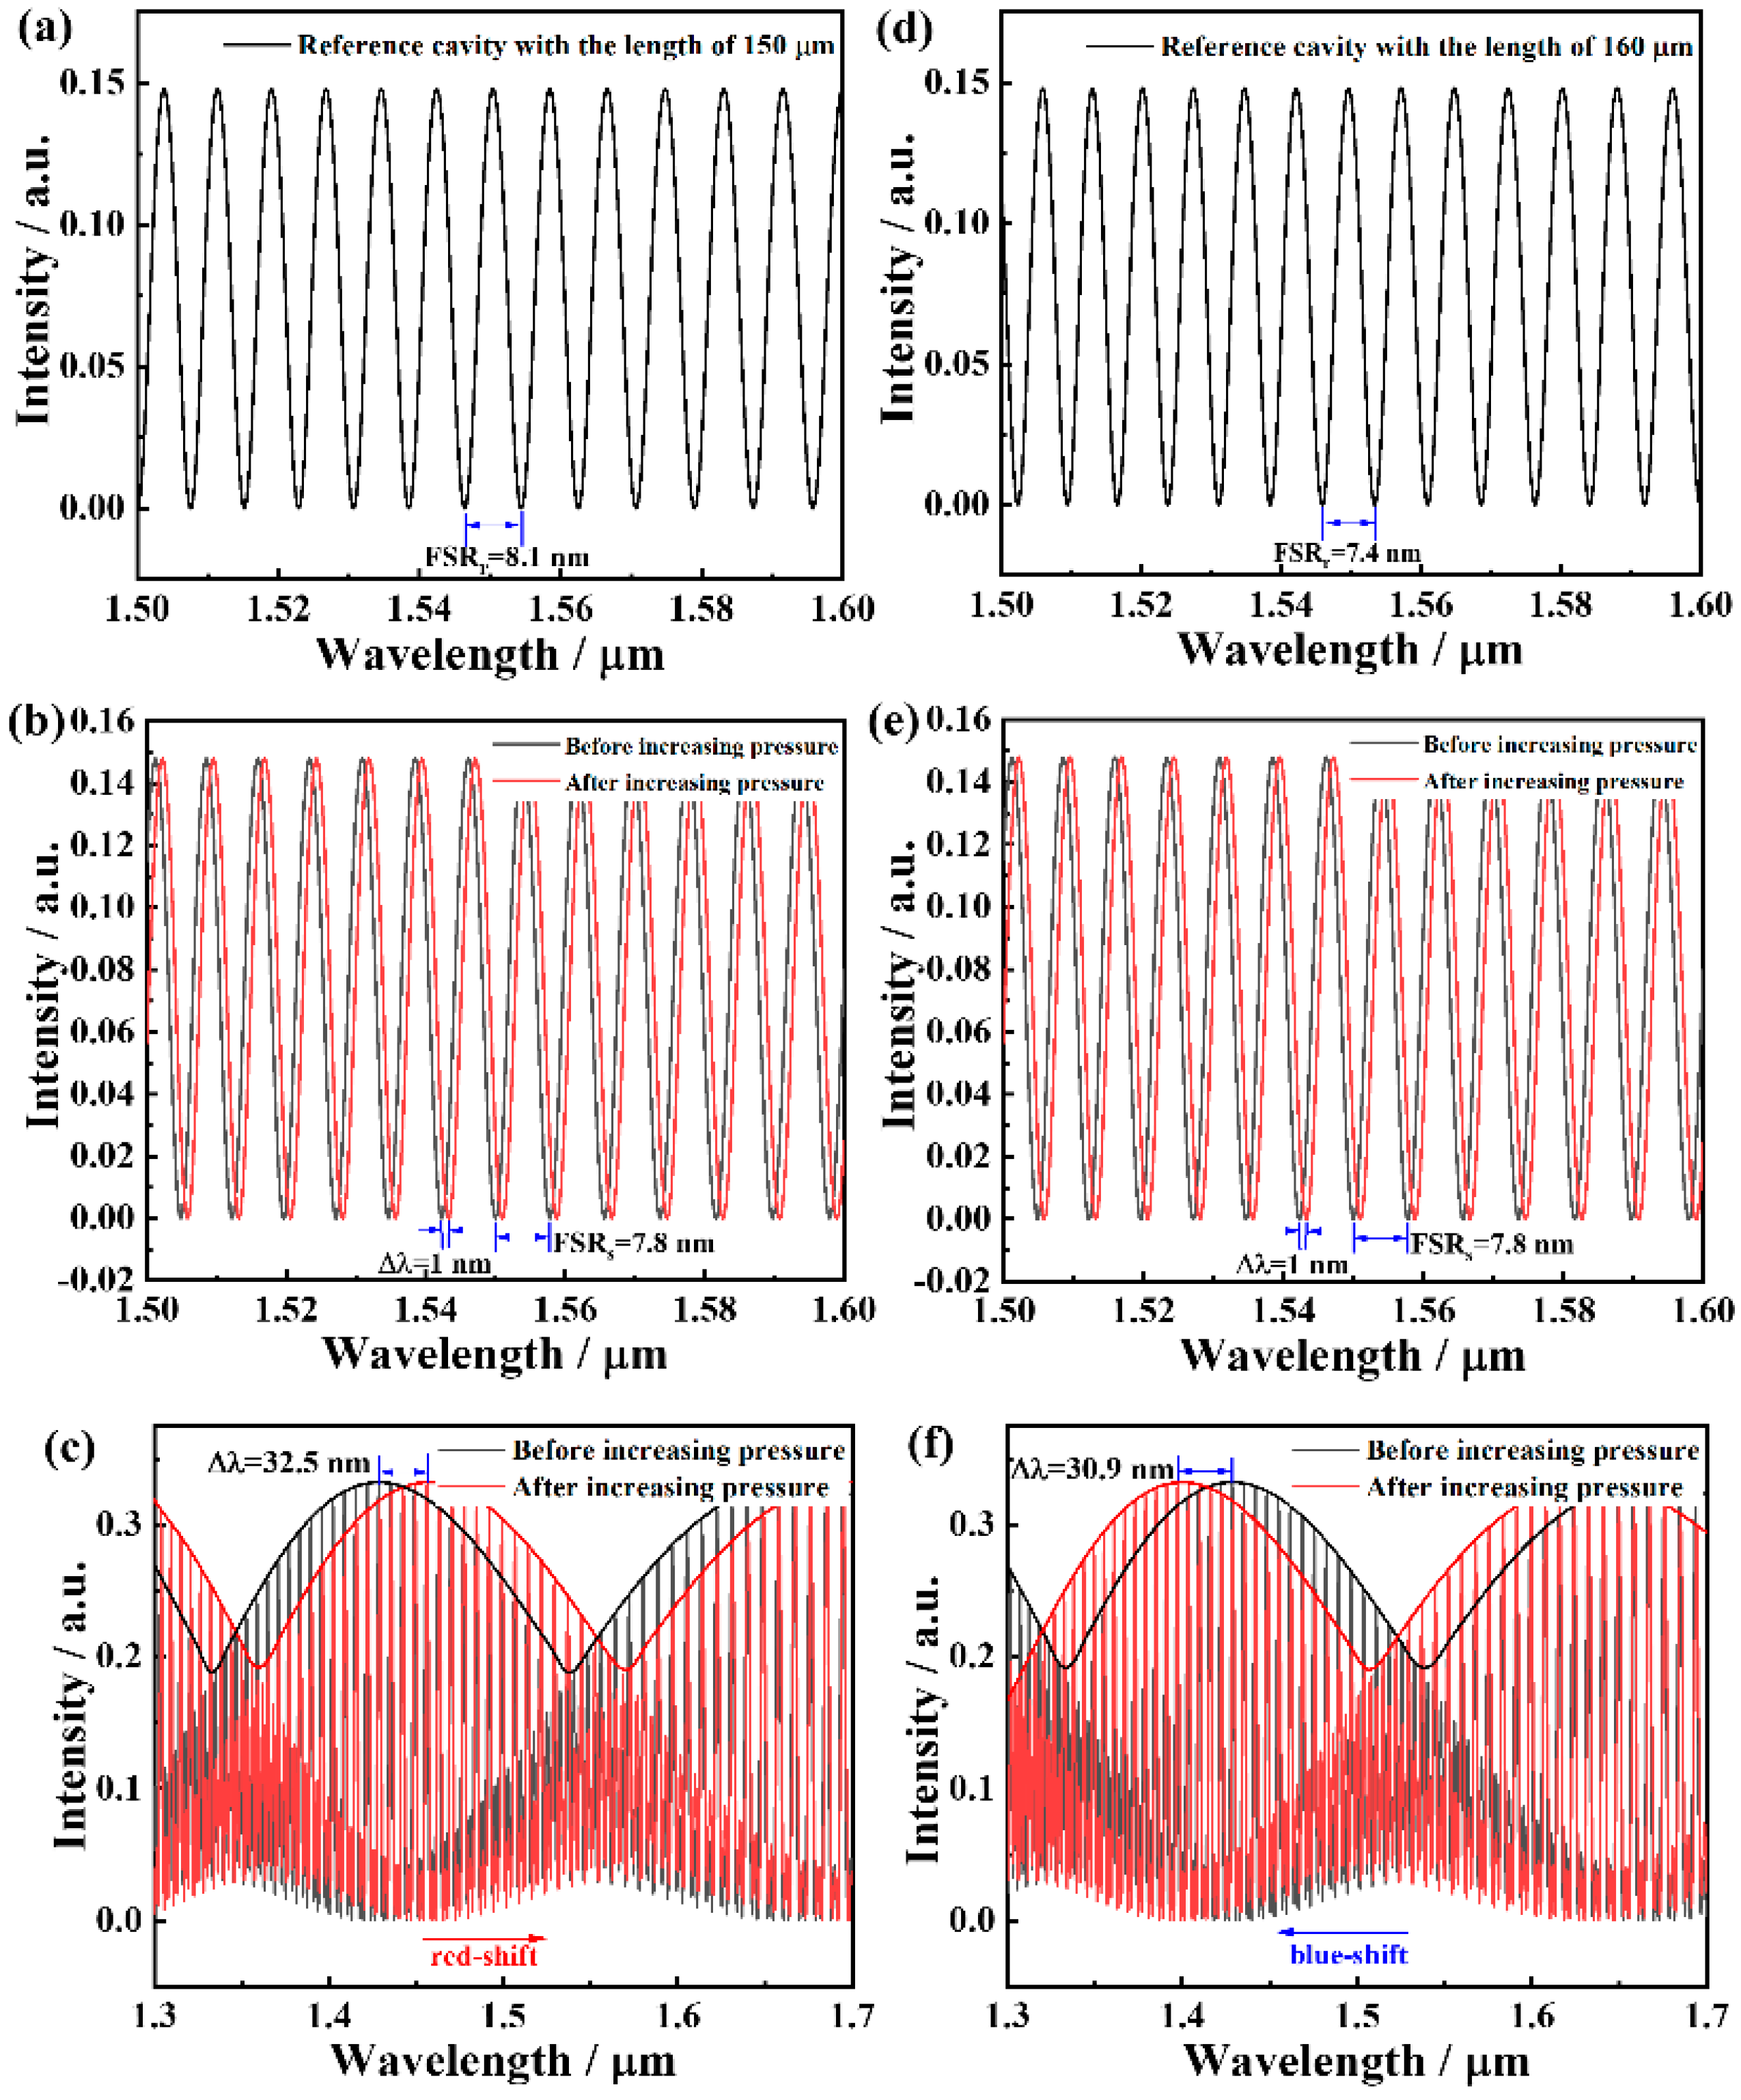
In order to investigate the influence of the F–P cavity length on the extinction ratio of the interference spectrum, we prepared the F–P cavity lengths of 50/150/200/250/300 μm, respectively. The reflection spectrum was tested, and the results are shown in Figure 2.
As shown in Figure 2, as the cavity length increased from 50 to 300 μm, the extinction ratio of the reflection spectrum decreased accordingly. The reason is that the transmission loss increased with the increase of the cavity length. The Vernier envelope with a high extinction ratio (>5 dB) required precise energy matching and cavity length matching. From Figure 2, a 150 μm cavity length with suitable FSR and extinction ratio was selected as the sensing cavity in the following experiments.
Before the pressure measurement of paralleled F–P cavities, the response of the single sensing cavity with the inner diameter of 50 μm and the cavity length of 150 μm was first tested. The sensing mechanism was that the change of the external pressure caused the variety of the RI in the F–P cavity, which led to the wavelength shift of the interference spectrum. According to the Edlen equation [35], ns is a function of the pressure and the temperature as ns = 1 + (2.8793 × 10⁻⁹ × P)/(1 + 0.003671 × T). Thus, ∂ns/∂P can be regarded as a constant (2.8791 × 10⁻⁹) at room temperature (25 °C). Combined with Equation (4), it can be concluded that the drift of the interference spectrum is approximately linear with the increase of the gas pressure. The spectrum response and the wavelength shift of the single FPI versus the gas pressure are shown in Figure 3, where we can observe that the resonant dip exhibited a red shift with the increase of gas pressure with a sensitivity of 4 nm/MPa. The corresponding linearity was 99.9%.
The paralleled FPI structure with the Vernier effect was fabricated to obtain the highly sensitive gas pressure sensor. The experimental setup for pressure measurement is shown in Figure 4. The incident light from the BBS was guided into a 3-dB coupler and was divided into two parts. One part passed through the reference cavity and another part passed through the sensing cavity. The sensing cavity was put into the air pressure calibrator (ALKT702, with the range and resolution of 0~10 MPa and 0.001 MPa), which had a pin hole connected to the outside, and then the pin hole was sealed up by sealant. The reflected lights were transmitted into an OSA by a 3-dB coupler.
To investigate the amplification factor, two prototypes were fabricated and experimentally tested: the lengths of reference and sensing HCFs in prototype 1 were 136 μm and 147 μm, while in prototype 2 were 186 μm and 147 μm, respectively. The reflection spectra are shown in Figure 5a, from which we can see that the FSRs of two prototypes were 91.3 nm and 27.2 nm. According to Equations (4) and (5), it can be calculated theoretically that the FSRs of these two prototypes are 102.2 nm and 27.3 nm, respectively. Obviously, the experimental results agree well with the theoretical ones. Thus, as the cavity length difference (ΔL) decreases, the FSR of the envelope becomes larger, and according to Equation (8), the amplification factor will be larger, too. Figure 5b shows the simulated amplification factor under different cavity length differences. It can be obviously seen that the amplification factor decreased with the increase of ΔL.
In order to verify the number of the interference light of the two prototypes, Figure 6 gives a Fast Fourier Transform (FFT) of the reflection spectrum in Figure 5a. As can be seen in Figure 6a, there were two dominant peaks, 0.1199 nm−1 and 0.1305 nm−1, indicating that two kinds of interference might exist. According to Equation (4) and FSR = 1/f, it can be calculated that the frequencies of the reference cavity and sensing cavity are 0.119 nm−1 and 0.1292 nm−1. Thus, these two peaks were formed by the interference of the reference cavity and sensing cavity, respectively. From Figure 6b, we can also conclude the existence of two dominant kinds of interference corresponding to the peaks of 0.1305 nm−1 and 0.1642 nm−1, which are consistent with the theoretical values 0.1292 nm−1 and 0.1639 nm−1. Additionally, two tiny peaks located at 0.0119 nm−1 in Figure 6a and 0.0342 nm−1 in Figure 6b represent the envelope spectrum of superimposition in two prototypes. In conclusion, the output spectra of these two prototypes are formed by two FPIs, namely multi-beam interference.
The responses of the two prototypes to the gas pressure are shown in Figure 7. From Figure 7a, we can observe that the envelope profile of prototype 1 suffered a red shift when the gas pressure increased from 0 to 1.2 MPa, corresponding to a gas pressure sensitivity of 45.76 nm/MPa and a linearity of 99.9%. The corresponding magnification was 11.44, which is basically consistent with the theoretical value under the 11 μm cavity length difference in Figure 5b. The points are linearly fitted, as shown in Figure 7b. From Figure 7c, when gas pressure increased from 0 to 3 MPa, the envelope profile of prototype 2 showed a blue shift, corresponding to a gas pressure sensitivity of −15.08 nm/MPa and a linearity of 99.9%. The points are linearly fitted, as shown in Figure 7d.
To investigate the temperature crosstalk, the paralleled FPI structure was placed into the temperature chamber (LICHEN, 202-00T, with a solution of 0.5 °C), which was heated from 20 to 70 °C with an interval of 10 °C under atmospheric pressure. Figure 8a shows the reflection spectrum under different temperatures, and Figure 8b shows the linear fit result of the envelope wavelength shifting. It is obvious that the envelope exhibited a little wavelength shifting with a sensitivity of 4.46 pm/°C because the thermo-optic coefficient of air is so small that the temperature has little effect on RI of the air in the low temperature range [36]. Moreover, the slight difference of intensity is caused by fluctuation of the light source power [37]. The temperature experimental results indicate that the proposed sensor corresponded to a temperature crosstalk as low as 0. 097 KPa/°C.

4. Discussions

The reason why the envelope moved in the opposite direction is explained as follows. For prototype 1, the sensing cavity length was larger than the reference cavity length so that the FSR of the sensing cavity was smaller than the FSR of the reference cavity. Prototype 2 was just the opposite. Assuming that a peak of the envelope is located at λ0, when the sensing cavity spectrum shifts by |FSRrFSRs|, the sensing FPI peaks in prototype 1 and prototype 2 will overlap with the λ0FSRr and λ0 + FSRr of the reference cavity, respectively. Therefore, the envelope moving directions of the two prototypes are different. The reflection spectra of the two sets of paralleled F–P cavities with different lengths were simulated to characterize the shift directions of the spectrum, as shown in Figure 9. The FSRs of reference cavity were set to be 8.1 nm and 7.4 nm, respectively, while that of the sensing cavity was 7.8 nm. Due to the tiny difference of FSRs, an envelope will be arisen by the superimposed spectra of two FPIs. From Figure 9a–c, when the FSR of the reference cavity is larger than that of the sensing cavity, with the increasing of the pressure, the drift direction of the envelope is consistent with the drift direction of the reflection spectrum of a single sensing cavity, and both are red-shifted. Moreover, when the FSR of the reference cavity is smaller than that of the sensing cavity, the drift direction of the envelope is opposite to the drift direction of the reflection spectrum of a single sensing cavity, as shown in Figure 9d–f.
Besides, the performance comparisons among the reported pressure sensors are shown in Table 1. It is obvious that compared with [14,15,18], the sensitivity of our sensor was improved by an order of magnitude. Meanwhile, compared with [20,30,31,32,38,39], our sensor achieved a wide linear response range and good temperature influence resistance. Additionally, compared with other sensors, the preparation of the proposed structure can be completed by directly splicing the HCFs with different inner diameters by arc discharge technology, so it is simple to prepare and cost-effective.

5. Conclusions

In summary, we proposed a high sensitivity fiber gas pressure sensor based on paralleled F–P cavities with the Vernier effect. The gas pressure sensitivity can be improved from 4 nm/MPa to 45.76 nm/MPa with an amplification factor of 11.44, and the corresponding linearity is 99.9%. Additionally, the sensor is resistant to the temperature fluctuation, and the temperature crosstalk is negligible in the gas pressure measurement process under the low temperature range. Benefitting from its characteristics of high sensitivity, low cost, good mechanical strength, and temperature resistance, this gas pressure sensor can find applications in more fields, especially in harsh-circumstance barometric monitoring.

Author Contributions

Conceptualization, X.S., L.H., Y.L. and L.R.; methodology, X.S. and L.H.; software, X.W.; validation, H.S. and C.L.; formal analysis, X.S. and L.R.; investigation, L.H. and Y.L.; resources, L.H. and Y.L.; data curation, X.S. and L.H.; writing—original draft preparation, X.S.; writing—review and editing, X.S., L.H., H.S., Y.L. and L.R.; visualization, X.W. and C.L.; supervision, Y.L. and L.R. All authors have read and agreed to the published version of the manuscript.

Funding

This work was supported by the National Natural Science Foundation of China (11874133), the project of the central government supporting the reform and development of local colleges and universities (2020YQ01).

Institutional Review Board Statement

Not applicable.

Informed Consent Statement

Not applicable.

Data Availability Statement

The data presented in this study are available on request from the corresponding author. The data are not publicly available due to privacy.

Acknowledgments

We are very grateful to the relevant funds for their support of this paper.

Conflicts of Interest

The authors declare no conflict of interest.

References

  1. Wu, C.; Fu, H.Y.; Qureshi, K.K.; Guan, B.O.; Tam, H.Y. High-pressure and high-temperature characteristics of a Fabry-Perot interferometer based on photonic crystal fiber. Opt. Lett. 2011, 36, 412–414. [Google Scholar] [CrossRef] [Green Version]
  2. Dong, Q.; Bae, H.; Zhang, Z.; Chen, Y.; Wen, Z.; Olson, D.A.; Yu, M.; Liu, H. Miniature Fiber Optic Acoustic Pressure Sensors with Air-Backed Graphene Diaphragms. J. Vib. Acoust. 2019, 141, 041003. [Google Scholar] [CrossRef] [PubMed]
  3. Zhao, Y.; Chen, M.Q.; Xia, F.R.; Lv, Q. Small in-fiber Fabry-Perot low-frequency acoustic pressure sensor with PDMS diaphragm embedded in hollow-core fiber. Sens. Actuators A 2018, 270, 162–169. [Google Scholar] [CrossRef]
  4. Gu, Z.; Xu, Y.; Gao, K. Optical fiber long-period grating with solgel coating for gas sensor. Opt. Lett. 2006, 31, 2405–2407. [Google Scholar] [CrossRef] [PubMed]
  5. Jian, T.; Yin, G.; Shen, L. CO2 laser writing of long period fiber grating in air-core photonic bandgap fiber as gas pressure sensor. In Proceedings of the 2015 Optoelectronics Global Conference (OGC), Shenzhen, China, 29–31 August 2015. [Google Scholar]
  6. Stephens, A.F.; Busch, A.; Salamonsen, R.F.; Gregory, S.D.; Tansley, G.D. A novel fibre Bragg grating pressure sensor for rotary ventricular assist devices. Sens. Actuators A 2019, 295, 474–482. [Google Scholar] [CrossRef]
  7. Huang, J.; Zhou, Z.D.; Wen, X.Y.; Zhang, D.S. A diaphragm-type fiber Bragg grating pressure sensor with temperature compensation. Measurement 2013, 46, 1041–1046. [Google Scholar] [CrossRef]
  8. Wu, Y.; Wang, S.; Meng, F.Y.; Song, Y.M.; Zhu, L.Q. Compact Mach-Zehnder interferometer based on processed hollow-core fiber for gas pressure sensing. J. Nano-Photonics 2019, 13, 036013. [Google Scholar] [CrossRef]
  9. Li, Z.Y.; Liao, C.R.; Wang, Y.P.; Lu, L.; Wang, D.N.; Dong, X.P.; Liu, S.; Wang, Q.; Yang, K.M.; Zhou, J.T. Highly-sensitive gas pressure sensor using twin-core fiber based in-line Mach-Zehnder interferometer. Opt. Express 2015, 23, 6673–6678. [Google Scholar] [CrossRef]
  10. Silva, S.; Coelho, L.; Frazão, O. An all-fiber Fabry-Pérot interferometer for pressure sensing in different gaseous environments. Measurement 2014, 47, 418–421. [Google Scholar] [CrossRef]
  11. Zhou, X.; Yu, Q.; Peng, W. Fiber-optic Fabry-Perot pressure sensor for down-hole application. Opt. Lasers Eng. 2019, 121, 289–299. [Google Scholar] [CrossRef]
  12. Xu, B.; Wang, C.; Wang, D.N.; Liu, Y.M.; Li, Y. Fiber-tip gas pressure sensor based on dual capillaries. Opt. Express 2015, 23, 23484–23492. [Google Scholar] [CrossRef]
  13. Gao, H.C.; Jiang, Y.; Zhang, L.C.; Yi, C.; Jiang, Y.; Jia, J.S.; Liang, J. Anti-resonant mechanism based self-temperature-calibrated fiber optic Fabry-Perot gas pressure sensors. Opt. Express 2019, 27, 22181–22189. [Google Scholar] [CrossRef] [PubMed]
  14. Tang, J.; Yin, G.L.; Liao, C.R.; Liu, S.; Li, Z.Y.; Zhong, X.Y.; Wang, Q.; Zhao, J.; Yang, K.M.; Wang, Y.P. High-sensitivity gas pressure Sensor based on Fabry-Pérot interferometer with a side-opened channel in hollow-core photonic bandgap fiber. IEEE Photonics J. 2015, 7, 6803307. [Google Scholar] [CrossRef]
  15. Hou, M.X.; Zhu, F.; Wang, Y.; Wang, Y.P.; Liao, C.R.; Liu, S.; Lu, P.X. Anti-resonant reflecting guidance mechanism in hollow-core fiber for gas pressure sensing. Opt. Express 2016, 24, 27890–27898. [Google Scholar] [CrossRef] [Green Version]
  16. Xiao, G.Z.; Adnet, A.; Zhang, Z.Y.; Lu, Z.G.; Grover, C.P. Fiber optic Fabry-Perot interferometer gas pressure sensors embedded in pressure fittings. Microw. Opt. Technol. Lett. 2004, 42, 486–489. [Google Scholar] [CrossRef]
  17. Zhao, C.L.; Hou, L.Y.; Kang, J.; Mao, B.N.; Shen, C.Y. High-sensitivity hydraulic pressure sensor based on Fabry-Perot interferometer filled with polydimethylsiloxane film. Rev. Sci. Instrum. 2019, 90, 095002. [Google Scholar] [CrossRef]
  18. Liao, C.R.; Liu, S.; Xu, L.; Wang, C.; Wang, Y.P.; Li, Z.Y.; Wang, Q.; Wang, D.N. Sub-micron silica diaphragm-based fiber-tip Fabry-Perot interferometer for pressure measurement. Opt. Lett. 2014, 39, 2827–2830. [Google Scholar] [CrossRef] [PubMed] [Green Version]
  19. Cui, Q.; Thakur, P.; Rablau, C.; Avrutsky, L. Miniature optical fiber pressure sensor with exfoliated graphene diaphragm. IEEE Sens. J. 2019, 19, 5621–5631. [Google Scholar] [CrossRef]
  20. Wang, J.; Li, L.; Liu, S.; Wu, D.; Wang, W.; Song, M.; Wang, G.; Huang, M. Investigation of composite structure with dual Fabry–Perot cavities for temperature and pressure sensing. Photonics 2021, 8, 138. [Google Scholar] [CrossRef]
  21. Lin, H.F.; Liu, F.F.; Guo, H.Y.; Zhou, A.; Dai, Y.T. Ultra-highly sensitive gas pressure sensor based on dual side-hole fiber interferometers with Vernier effect. Opt. Express 2018, 26, 28763–28772. [Google Scholar] [CrossRef]
  22. Li, Z.; Zhang, Y.X.; Zhang, W.G.; Kong, L.X.; Yan, T.Y.; Geng, P.C.; Wang, B. High-sensitivity gas pressure Fabry–Perot fiber probe with micro-channel based on Vernier Effect. J. Lightwave Technol. 2019, 37, 3444–3451. [Google Scholar] [CrossRef]
  23. Zhou, P.; Liao, C.R.; Li, Z.Y.; Liu, S.; Wang, Y.P. In-fiber cascaded F-P interferometer fabricated by chemical-assisted femtosecond laser micromachining for micro-fluidic sensing. J. Lightwave Technol. 2019, 37, 3214–3221. [Google Scholar] [CrossRef]
  24. Nan, T.; Liu, B.; Wu, Y.F.; Wang, J.F.; Mao, Y.Y.; Zhao, L.L.; Sun, T.T.; Wang, J. Ultrasensitive strain sensor based on Vernier-effect improved parallel structured fiber-optic Fabry-Perot interferometer. Opt. Express 2019, 27, 17239–17250. [Google Scholar] [CrossRef] [PubMed]
  25. Liao, H.; Lu, P.; Fu, X.; Jiang, X.Y.; Ni, W.J.; Liu, D.M.; Zhang, J.S. Sensitivity amplification of fiber-optic in-line Mach–Zehnder interferometer sensors with modified Vernier-effect. Opt. Express 2017, 25, 26898–26909. [Google Scholar] [CrossRef]
  26. Bhardwaj, V.; Singh, V.K. Fabrication and characterization of cascaded tapered Mach-Zehnder interferometer for refractive index sensing. Sens. Actuators A-Phys. 2016, 244, 30–34. [Google Scholar] [CrossRef]
  27. Yang, Y.Q.; Wang, Y.G.; Zhao, Y.X.; Jiang, J.X.; He, X.J.; Yang, W.L.; Zhu, Z.H.; Gao, W.; Li, L.J. Sensitivity-enhanced temperature sensor by hybrid cascaded configuration of a Sagnac loop and a F-P cavity. Opt. Express 2017, 25, 33290–33296. [Google Scholar] [CrossRef]
  28. Wu, B.; Zhao, C.; Xu, B.; Li, Y. Optical fiber hydrogen sensor with single Sagnac interferometer loop based on vernier effect. Sens. Actuators B Chem. 2018, 255, 3011–3016. [Google Scholar] [CrossRef]
  29. Seyfari, A.K.; Bahadoran, M.; Honarasa, G. Design of micro-optical pressure sensor using cascaded ring resonator. In Proceedings of the Iranian Nano Photonic Conference, Terhran, Iran, 22 March 2021. [Google Scholar]
  30. Lin, H.F.; Liu, F.F.; Dai, Y.T.; Zhou, A. Cascaded fiber Mach–Zehnder interferometers for sensitivity-enhanced gas pressure measurement. IEEE Sens. J. 2019, 19, 2581–2586. [Google Scholar] [CrossRef]
  31. Chen, P.; Dai, Y.T.; Zhang, D.S.; Wen, X.Y.; Yang, M.H. Cascaded-cavity Fabry-Perot interferometric gas pressure sensor based on Vernier Effect. Sensors 2018, 18, 3677. [Google Scholar] [CrossRef] [Green Version]
  32. Guo, X.S.; Ye, W.H.; Jiang, C.; Sun, S.M. High sensitivity gas pressure sensor based on two parallel-connected Fabry–Perot interferometers and Vernier effect. Meas. Sci. Technol. 2021, 32, 125124. [Google Scholar] [CrossRef]
  33. He, H.Y.; Liu, Y.; Liao, Y.Y.; Lang, C.P.; Li, Y.; Qu, S.L. Simple fiber-optic sensor for simultaneous and sensitive measurement of high pressure and high temperature based on the silica capillary tube. Opt. Express 2019, 27, 25777–25788. [Google Scholar] [CrossRef]
  34. Fu, X.H.; Liu, L.X.; Huang, S.M.; Fu, G.W.; Jin, W.; Bi, W.H. Simultaneous measurement of temperature and refractive index with F–P microcavity sensor based on graded-index few mode fiber. Opt. Commun. 2020, 455, 124577. [Google Scholar] [CrossRef]
  35. Birch, K.P.; Downs, M.J. An Updated Edlén Equation for the Refractive Index of Air. Metrologia 1993, 30, 155–162. [Google Scholar] [CrossRef]
  36. Wei, X.Y.; Song, X.K.; Li, C.; Hou, L.T.; Li, Z.J.; Li, Y.; Ran, L.L. Optical fiber gas pressure sensor based on Polydimethylsiloxane microcavity. J. Lightwave Technol. 2021, 39, 2988–2993. [Google Scholar] [CrossRef]
  37. Hou, L.T.; Zhang, X.D.; Yang, J.R.; Kang, J.; Ran, L.L. Simultaneous measurement of refractive index and temperature based on half-tapered SMS fiber structure with fringe-visibility difference demodulation method. Opt. Commun. 2019, 433, 252–255. [Google Scholar] [CrossRef]
  38. Qi, Y.F.; Cong, B.T.; Liu, Z.M.; Gong, C.B.; Li, F.K.; Hu, T.N.; Liu, Y.Y. All-fiber sensitivity-enhanced pressure sensor based on Sagnac and F-P interferometer. Optik 2021, 243, 167359. [Google Scholar] [CrossRef]
  39. Pan, R.; Yang, W.L.; Li, L.J.; Yang, Y.Q.; Yu, X.Y.; Fan, J.Y.; Yu, S.; Xiong, Y.L.; Zhang, L.J. High-sensitive fiber-optic pressure sensor based on Fabry-Perot interferometer filled with ultraviolet glue film and Vernier effect. Opt. Fiber Technol. 2021, 69, 102710. [Google Scholar] [CrossRef]
Figure 1. (a,c) Schematic of the two FPIs. (b,d) The microscope images of the two FPIs. (e) Schematic diagram of experimental setup with paralleled FPIs.
Photonics 09 00031 g001
Figure 2. Reflection spectrum of F–P cavities with different lengths.
Photonics 09 00031 g002
Figure 3. Pressure response of single sensing cavity. (a) Reflection spectrum. (b) Linear fitting.
Photonics 09 00031 g003
Figure 4. Experimental system for paralleled FPI sensor.
Photonics 09 00031 g004
Figure 5. (a) Reflection spectrum of paralleled F–P cavities with different cavity length differences. (b) Simulated amplification factor of different cavity length differences.
Photonics 09 00031 g005
Figure 6. Spectral characteristics of the sensing structure. (a) Prototype 1. (b) Prototype 2.
Photonics 09 00031 g006
Figure 7. Response of paralleled FPI sensor to pressure. Prototype 1: (a) Reflection spectrum under different pressure; (b) linear fitting. Prototype 2: (c) The reflection spectrum under different pressure; (d) linear fitting.
Photonics 09 00031 g007
Figure 8. (a) Response of paralleled F–P cavities to temperature. (b) Linear fitting of wavelength shift versus temperature.
Photonics 09 00031 g008
Figure 9. Simulated wavelength shift of pressure response. (ac) The reflection spectra of the single reference cavity (150 μm), single sensing cavity (155 μm), and paralleled F–P cavities. (df) The reflection spectra of the single reference cavity (160 μm), single sensing cavity (155 μm), and paralleled F–P cavities.
Photonics 09 00031 g009
Table 1. Performance comparisons of different gas pressure sensors.
StructuresSensitivityTemperature CrosstalkLinear Response Range FabricationRefs.
Side-opened channel structure Anti-resonant4.24 nm/MPa-0–2 MPaFs[14]
Reflecting guidance with single-HCF3.59 nm/MPa7.5 KPa/°C0–2 MPaFs[15]
Single-FPI with sub-micron silica diaphragm1.036 nm/MPa0.96 KPa/°C0–2 MPaCoating[18]
Dual FP cavities with composite diaphragm30.2 nm/MPa-0–0.4 MPaCoating[20]
Cascaded MZIs with a micro-machined air cavity in SMS *82.131 nm/MPa0.647 KPa/°C0–0.7 MpaFs[30]
Cascaded FPIs in a glass capillary tube *86.64 nm/MPa5.18 KPa/°C0–0.6 MPaFs[31]
Parallel-connected FPIs with gas hole *47.76 nm/MPa5.1 KPa/°C0–0.45 MPaFs[32]
Separated structures using SI and FPI with a silver film *31.73 nm/MPa-0–1.6 MPaCoating[38]
Paralleled FPIs with a thin layer of UV glue *−38.3 nm/MPa-0.1–0.7 MPaCoating[39]
Paralleled FPIs with HCF *45.76 nm/MPa0.097 KPa/°C0–3 MPaArc dischargeThis work
* Representing the existence of the Vernier effect.
Publisher’s Note: MDPI stays neutral with regard to jurisdictional claims in published maps and institutional affiliations.

