
A Dy(III) Fluorescent Single-Molecule Magnet Based on a Rhodamine 6G Ligand


1
Department of Chemistry, Tsinghua University, Beijing 100084, China
2
Jiangsu Key Laboratory for NSLSCS, School of Physical Science and Technology, Nanjing Normal University, Nanjing 210023, China
*
Authors to whom correspondence should be addressed.
Inorganics 2021, 9(7), 51; https://0-doi-org.brum.beds.ac.uk/10.3390/inorganics9070051
Submission received: 31 May 2021
/
Revised: 25 June 2021
/
Accepted: 26 June 2021
/
Published: 29 June 2021
(This article belongs to the Special Issue Lanthanide Single-Molecule Magnets)
Abstract
:The complexes of lanthanide metals, especially dysprosium, can generally exhibit excellent magnetic properties. By means of modifying ligands, dual functions or even multi-functions can be achieved. Here, we synthesized an eight-coordinate Dy(III) complex 1, [Dy(HL-o)2(MeOH)2](ClO4)3·4.5MeOH, which is single-molecule magnet (SMM), and the introduction of the rhodamine 6G chromophore in the ring-opened ligand HL-o realizes ligand-centered fluorescence in addition to SMM. Magnetic measurements and ab initio calculations indicate that the magnetic relaxation for complex 1 should be due to the Raman relaxation process. Studies on magneto-structural correlationship of the rhodamine salicylaldehyde hydrazone Dy(III) complexes show that the calculated energy of the first Kramers Doublet (EKD1) is basically related to the Ophenoxy-Dy-Ophenoxy bond angle, i.e., the larger Ophenoxy-Dy-Ophenoxy bond angle corresponds to a larger EKD1.

1. Introduction
Since the 1990s, with the development of science and technology, the internet has grown at a very fast speed, changing the face of the world. In recent years, the development of computer and network technology is more prosperous. The massive growth of global data represents the development direction of the future world. However, all these technologies cannot be separated from the update and progress of information storage materials. When supercomputing is popularized on a large scale in the future, the existing storage technologies are far from meeting the data storage requirements. It is urgent to develop new materials with higher information storage density, and under this circumstance the single molecule magnets (SMMs), a novel material with ultra-high density information storage, are the promising molecular material with great potential to solve this century’s problem [1,2,3].
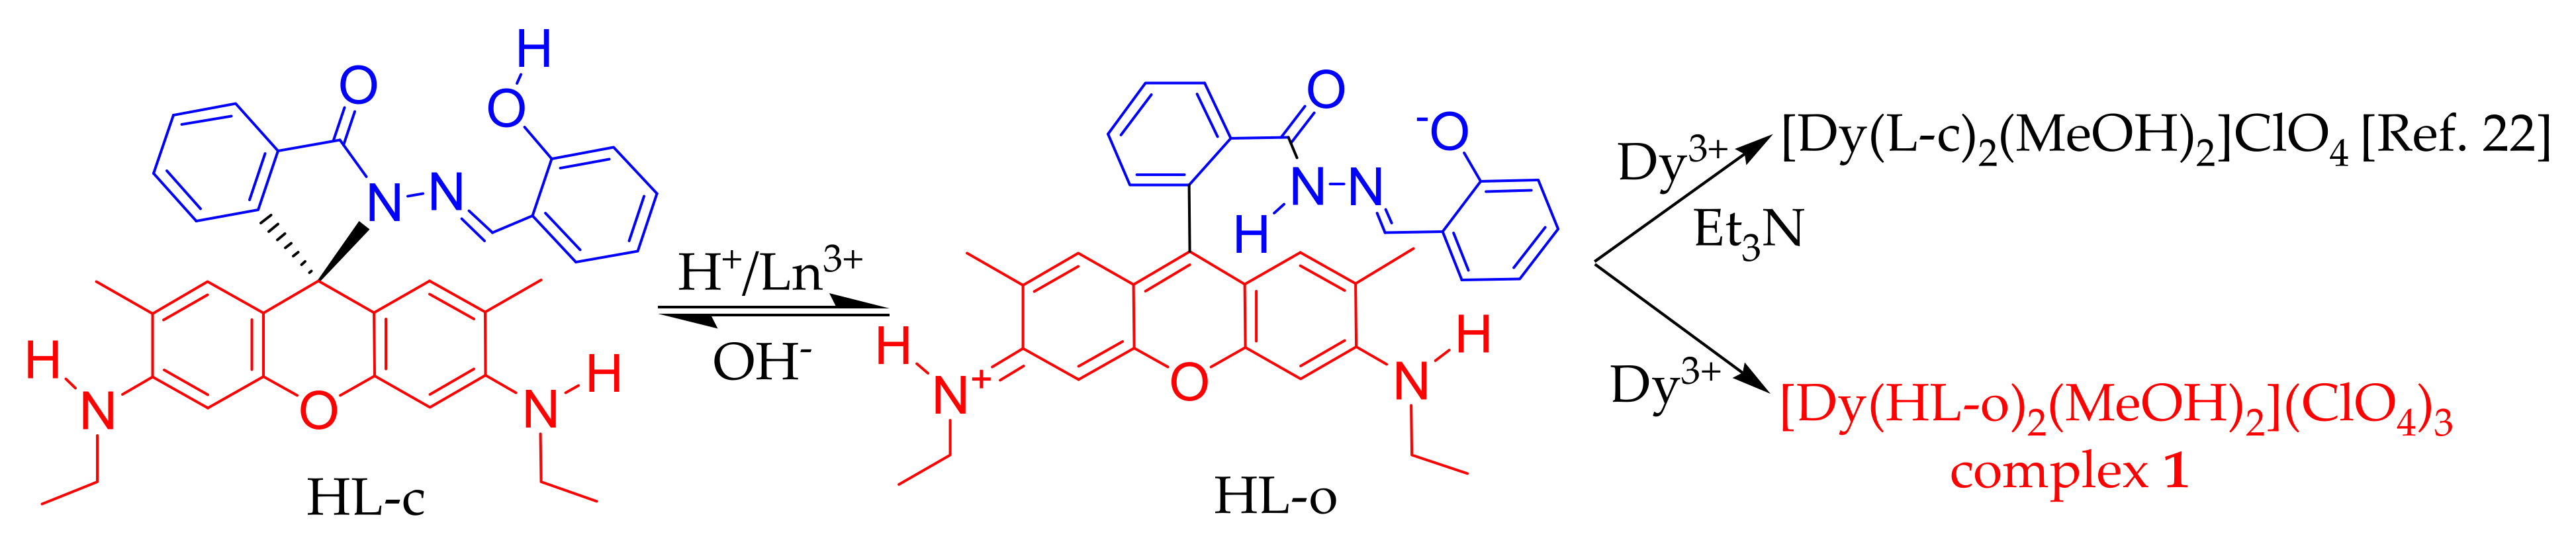
The research of SMMs began in 1993. A transition metal cluster [Mn12] was found to show similar magnetic properties to traditional magnetic materials, and attracted researchers’ attention [4,5]. By 2003, SMMs have developed a new field, that is, building with rare earth ions [6,7,8,9]. Rare earth ions, especially lanthanides, have very large intrinsic magnetic moment and strong spin orbit coupling due to their unique 4f electron arrangement, and can adjust the magnetic anisotropy of rare earth ions in the case of external crystal field. These advantages make lanthanide single molecular magnets an ideal star molecular material for constructing high-energy magnetic relaxation barriers. So far, a lot of work has been done on the assembly of Ln-SMMs, and great progress has been made recently [10]. In addition, the combination of SMM properties with fluorescence and chirality, even mechanochromism, emerges recently [11,12,13,14,15,16,17,18,19,20]. Therefore, we focused on the rhodamine ligand coordination with Dy(III) to construct luminescent SMMs. According to the previous reports [21,22], the HL-c ligand we used shows interesting ring-closed and ring-opened properties under acidic or alkaline conditions (Scheme 1). On the basis of HL-c, a new complex [Dy(HL-o)2(MeOH)2](ClO4)3·4.5MeOH (1) is obtained. The results show that complex 1 exhibits the single molecule magnetic behavior, and a ligand-centered fluorescent emission at 645 nm when excited by 365 nm UV light.
2. Results and Discussion
When aqueous solution of [Dy(ClO4)3] 50 wt.% in H2O was added into a light pink solution of HL-c, the solution became red, indicating formation of ring-opened HL-o. The crystals of 1 suitable for single crystal X-ray diffraction were obtained from the red solution. It is worth noting that no additional acid or alkali was added, and the slightly acidic solution was due to the partial hydrolysis of [Dy(ClO4)3]. Therefore, the ring-opened ligand HL-o was protonated after chelation with Dy(III), or to be exact, HL-o is zwitterionic. It is worth mentioning that when suitable amount of alkaline was added, the ring-closed form [Dy(L-c)2(MeOH)2]ClO4 were generated instead [22] (Scheme 1).
2.1. Crystal Structure
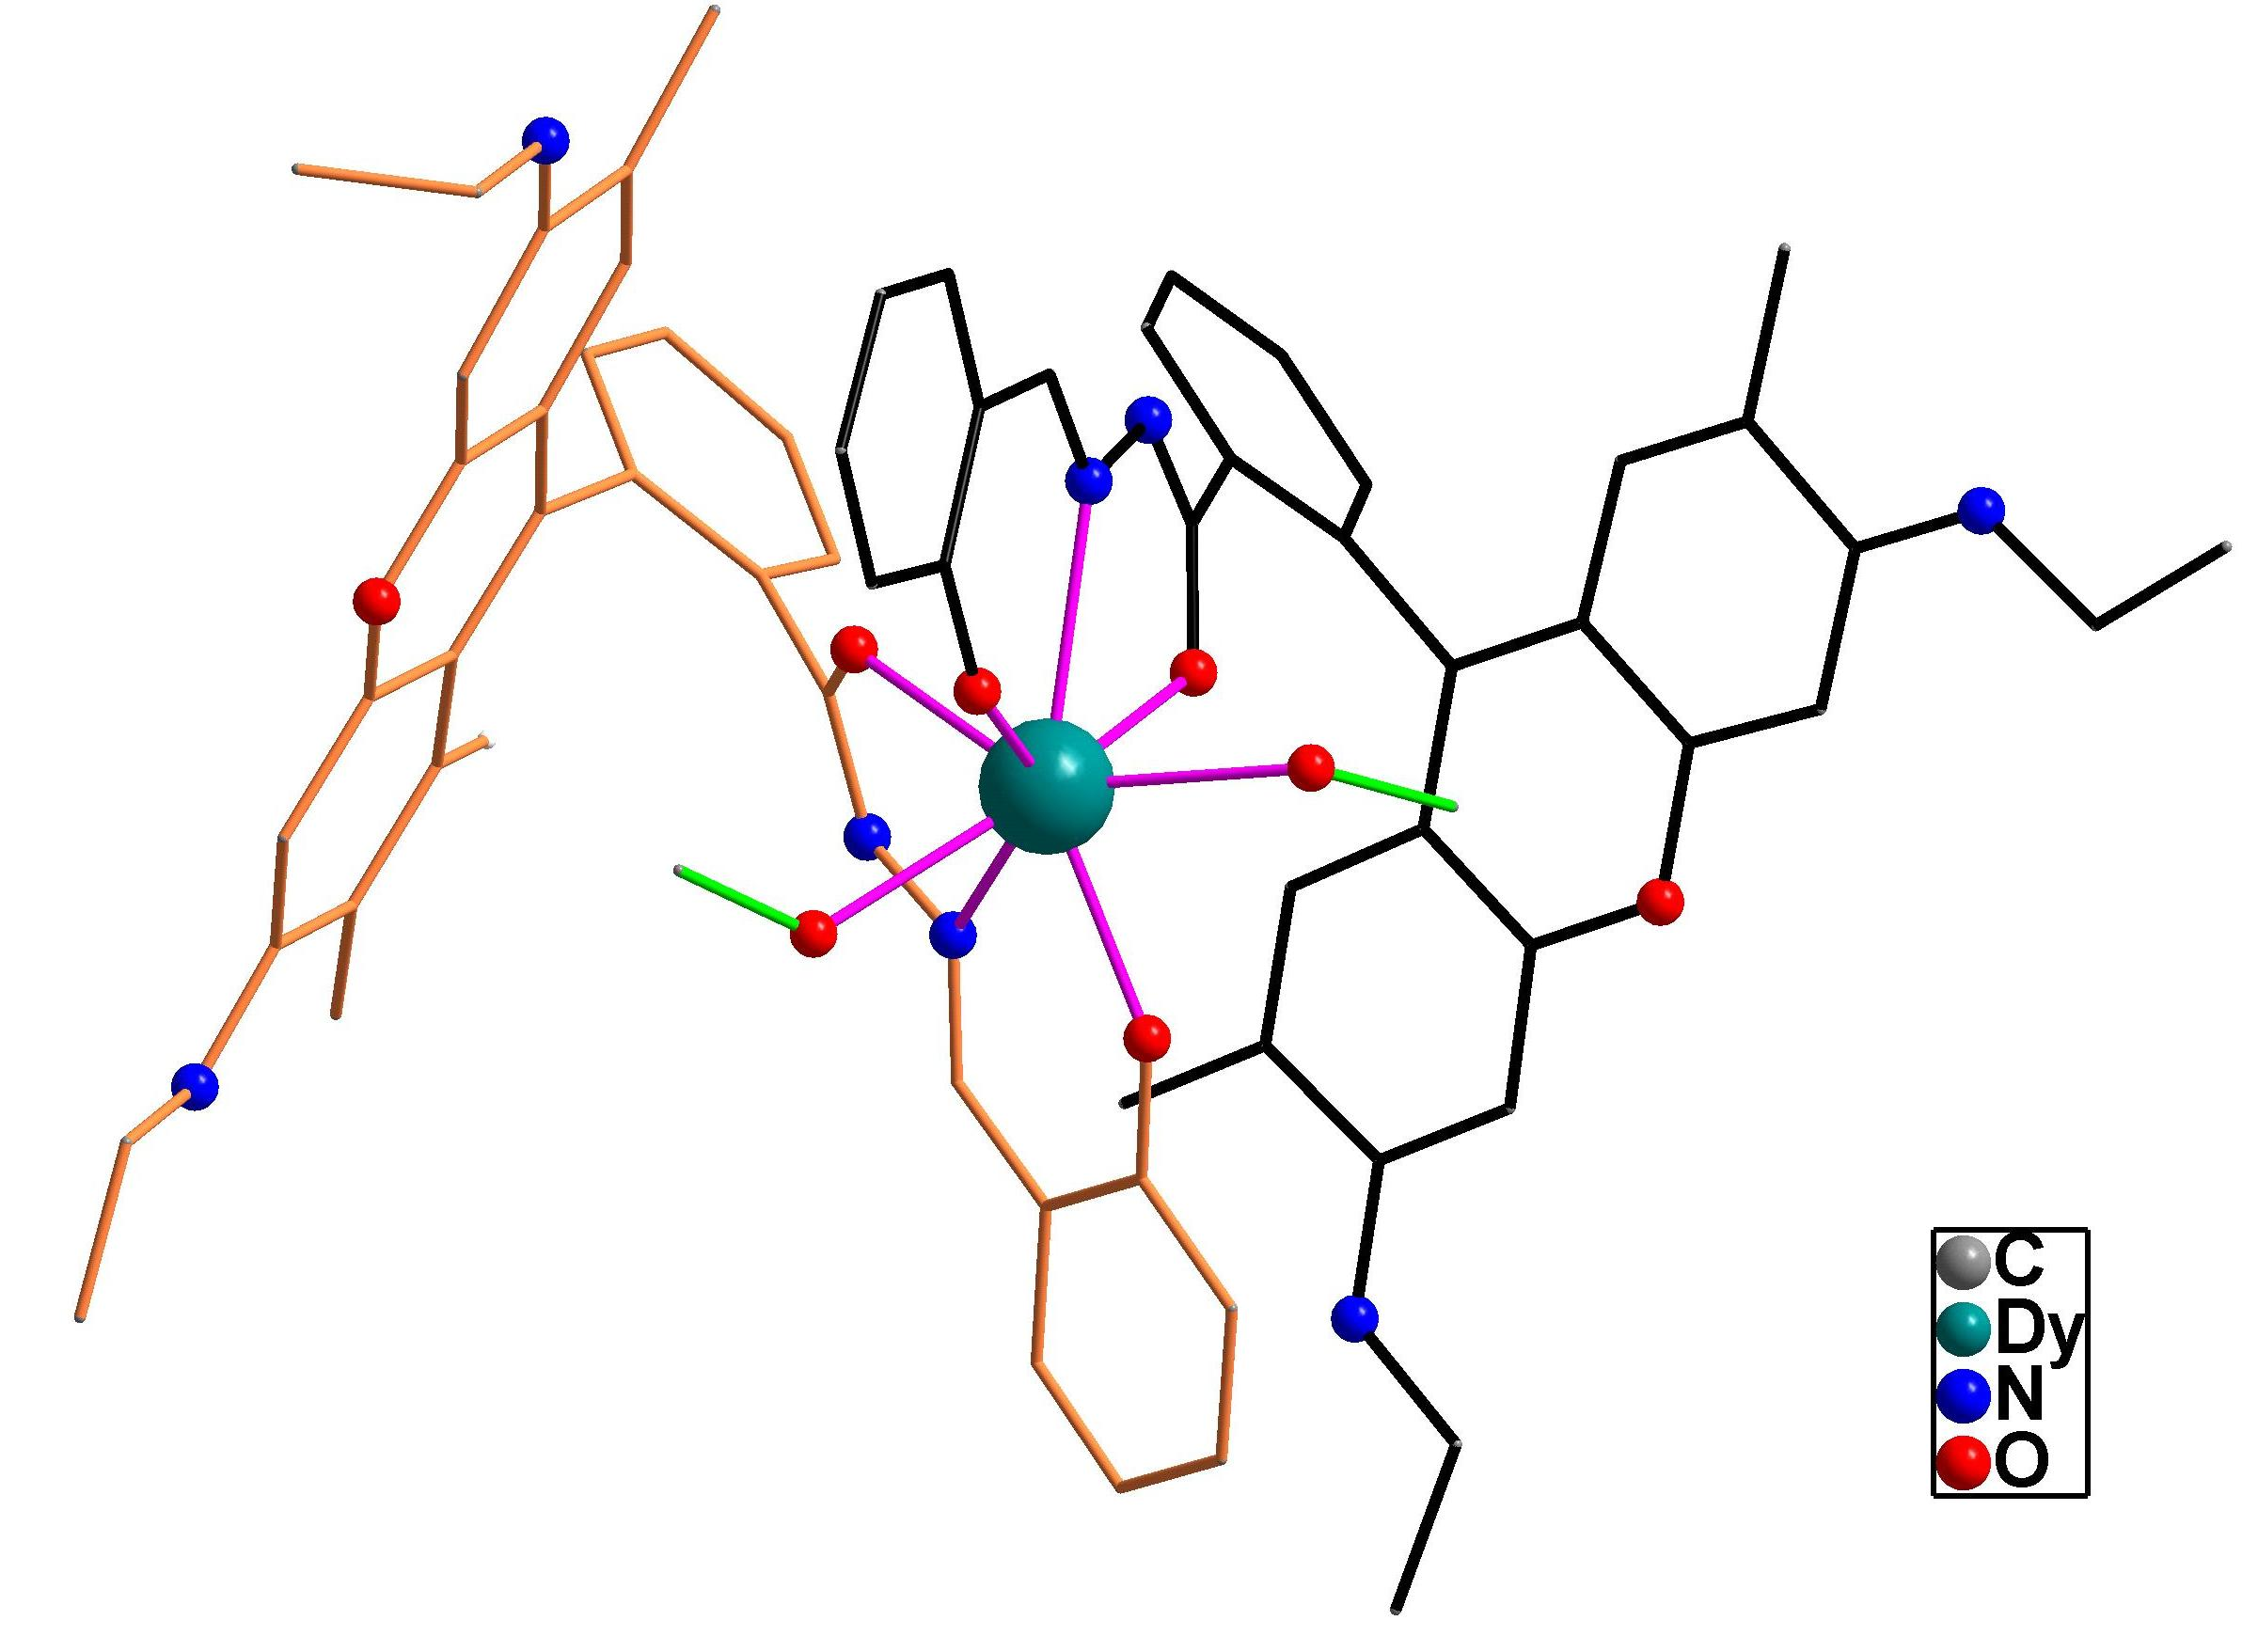
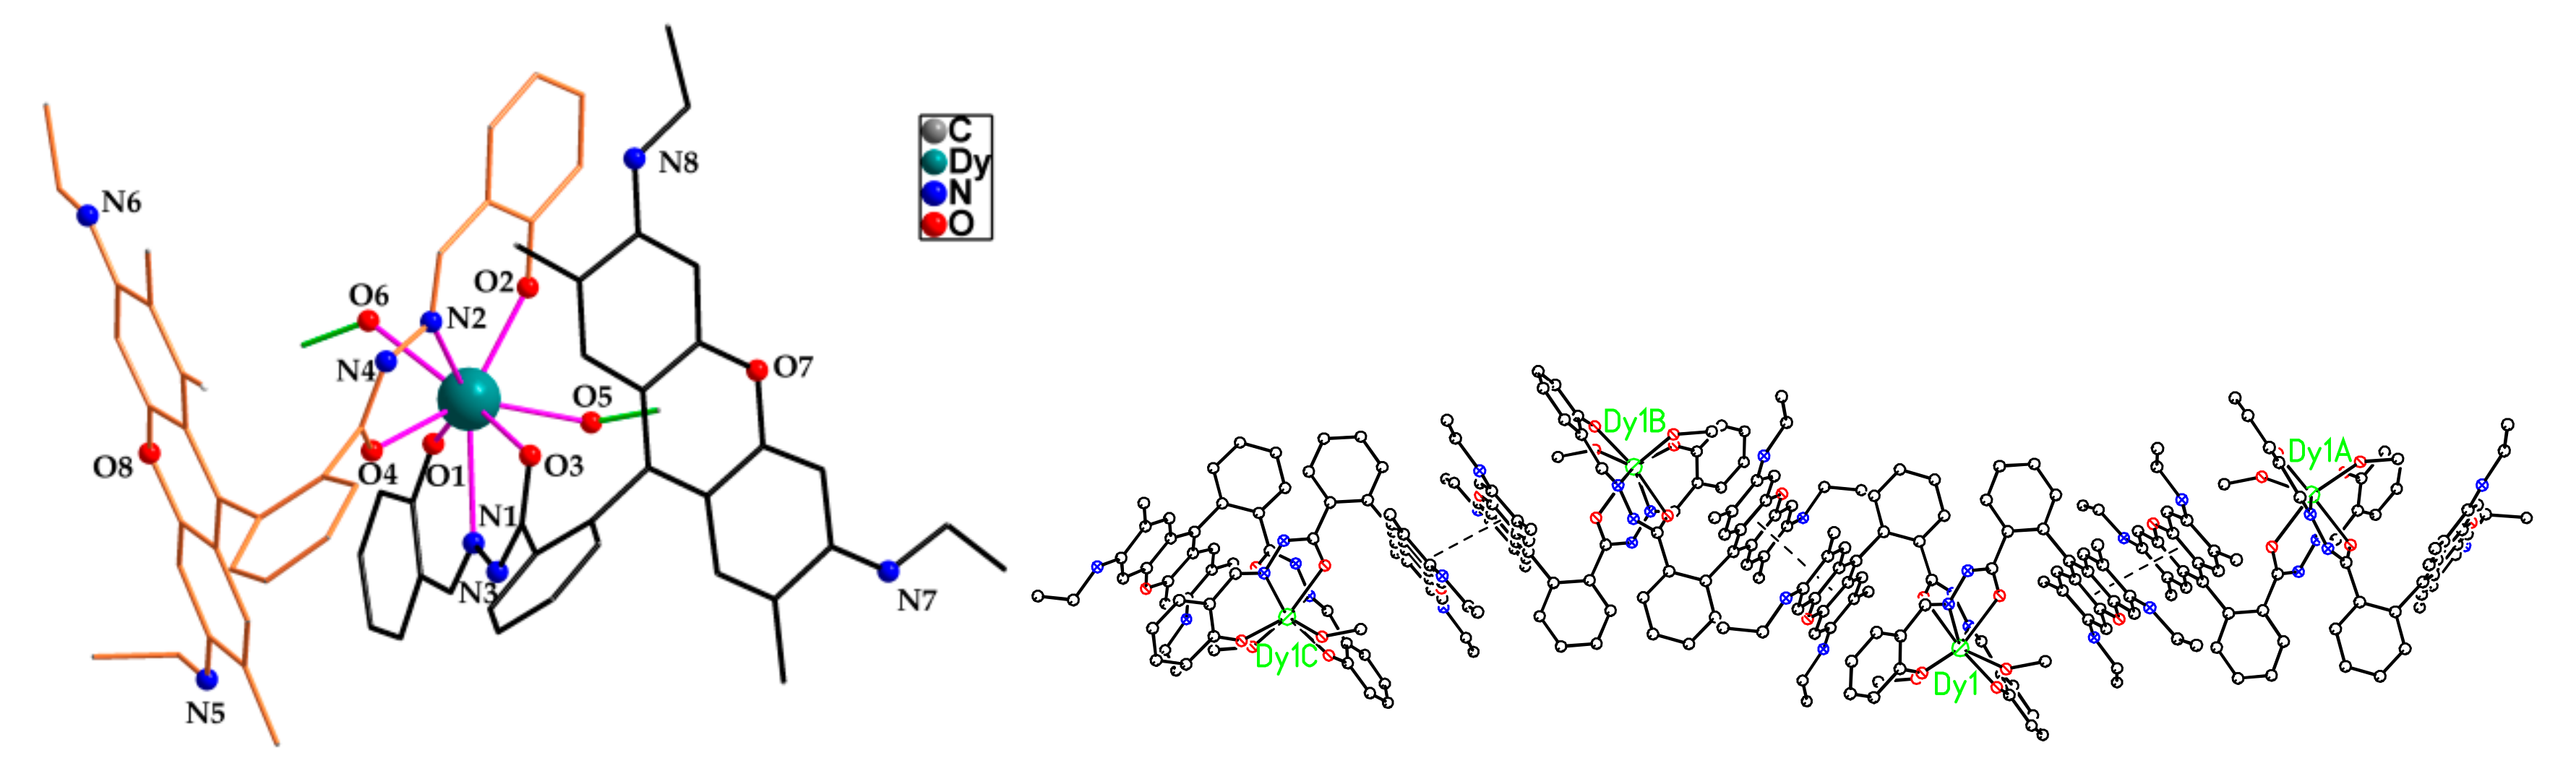
A red single crystal was selected and used for X-ray diffraction at 100 K. The crystalographic data and selected bond distances and angles are given in Table 1 and Table 2. The crystal data show that Complex 1 crystallizes in the triclinic space group of P1−. It consists of a [Dy(HL-o)2(MeOH)2]3+ cation and three ClO4− serve as the charge-balancing anions. The protonation of amide nitrogen atom can be determined from the hydrazide C-N-N bond angle of HL-o, 116.0(5)°–117.7(4)° (Table 2), while the corresponding bond angle for deprotonated hydrazide group is close to 108° [23]. The Dy(III) ion is eight-coordinated by two tridentate zwitterionic ligands HL-o and two methanol molecules, as shown in Figure 1. The coordination environment of the Dy(III) is close to triangular dodecahedron (Table S1: TDD-8, D2d symmetry). In Complex 1, two Dy-Ophenoxy bond lengths (2.181(4) and 2.258(3) Å) are shorter than the lengths of other Dy-N (2.566(5)-2.570(5) Å) and Dy-O bonds (2.372(4)–2.398(4) Å). Compared with previously reported Dy(III) salicyldehyde-rhodamine complexes [16,17,22], the Dy-Ophenoxy bond lengths are obviously different (Table 3). For the ring-closed complex [Dy(L-c)2(MeOH)2]ClO4 [22], two Dy-Ophenoxy bond lengths are 2.170(3) and 2.209(4) Å with a shorter average Dy-Ophenoxy bond length. For [Dy(L1)3] and [Dy(L2)3] [17], three Dy-Ophenoxy bond lengths are similar and all above 2.220 Å, while complex [Dy(HL-o)(H2O)4(MeCN)](ClO4)3 [16] possesses the single Dy-Ophenoxy bond of 2.175(3) Å. The Ophenoxy-Dy-Ophenoxy bond angle (O1-Dy1-O2 = 115.73(14)°) of 1 is larger than that of [Dy(L-c)2(MeOH)2]ClO4 [22], and the O5-Dy1-O6 angle between the two coordinating methanol ligands is also larger in Complex 1 (Table 3). Two chelating HL-o ligands have a planar xanthene group, and show intermolecular π–π stacking with the interplane separations of 3.562 Å and 3.388 Å and the corresponding center—center distances of 3.675 Å and 3.457 Å (Figure 1, right). When the spirolactam bond is broken, the oxaanthracene group connected only by C–C single bond can be twisted at will. As a result, the space occupation of large ligand group and the relative position of coordination atom will be different. The nearest intermolecular Dy–Dy separation is 5.756 Å in 1. The positions of the PXRD peaks well agree with those of the simulated peaks, and some of the missing diffraction peaks may be related to the orientation effect of the stacked grains (Figure S1). The powdered XRD data suggest that other crystalline species do not exist in the sample of Complex 1.
2.2. Solid-State Absorption and Emission Spectra
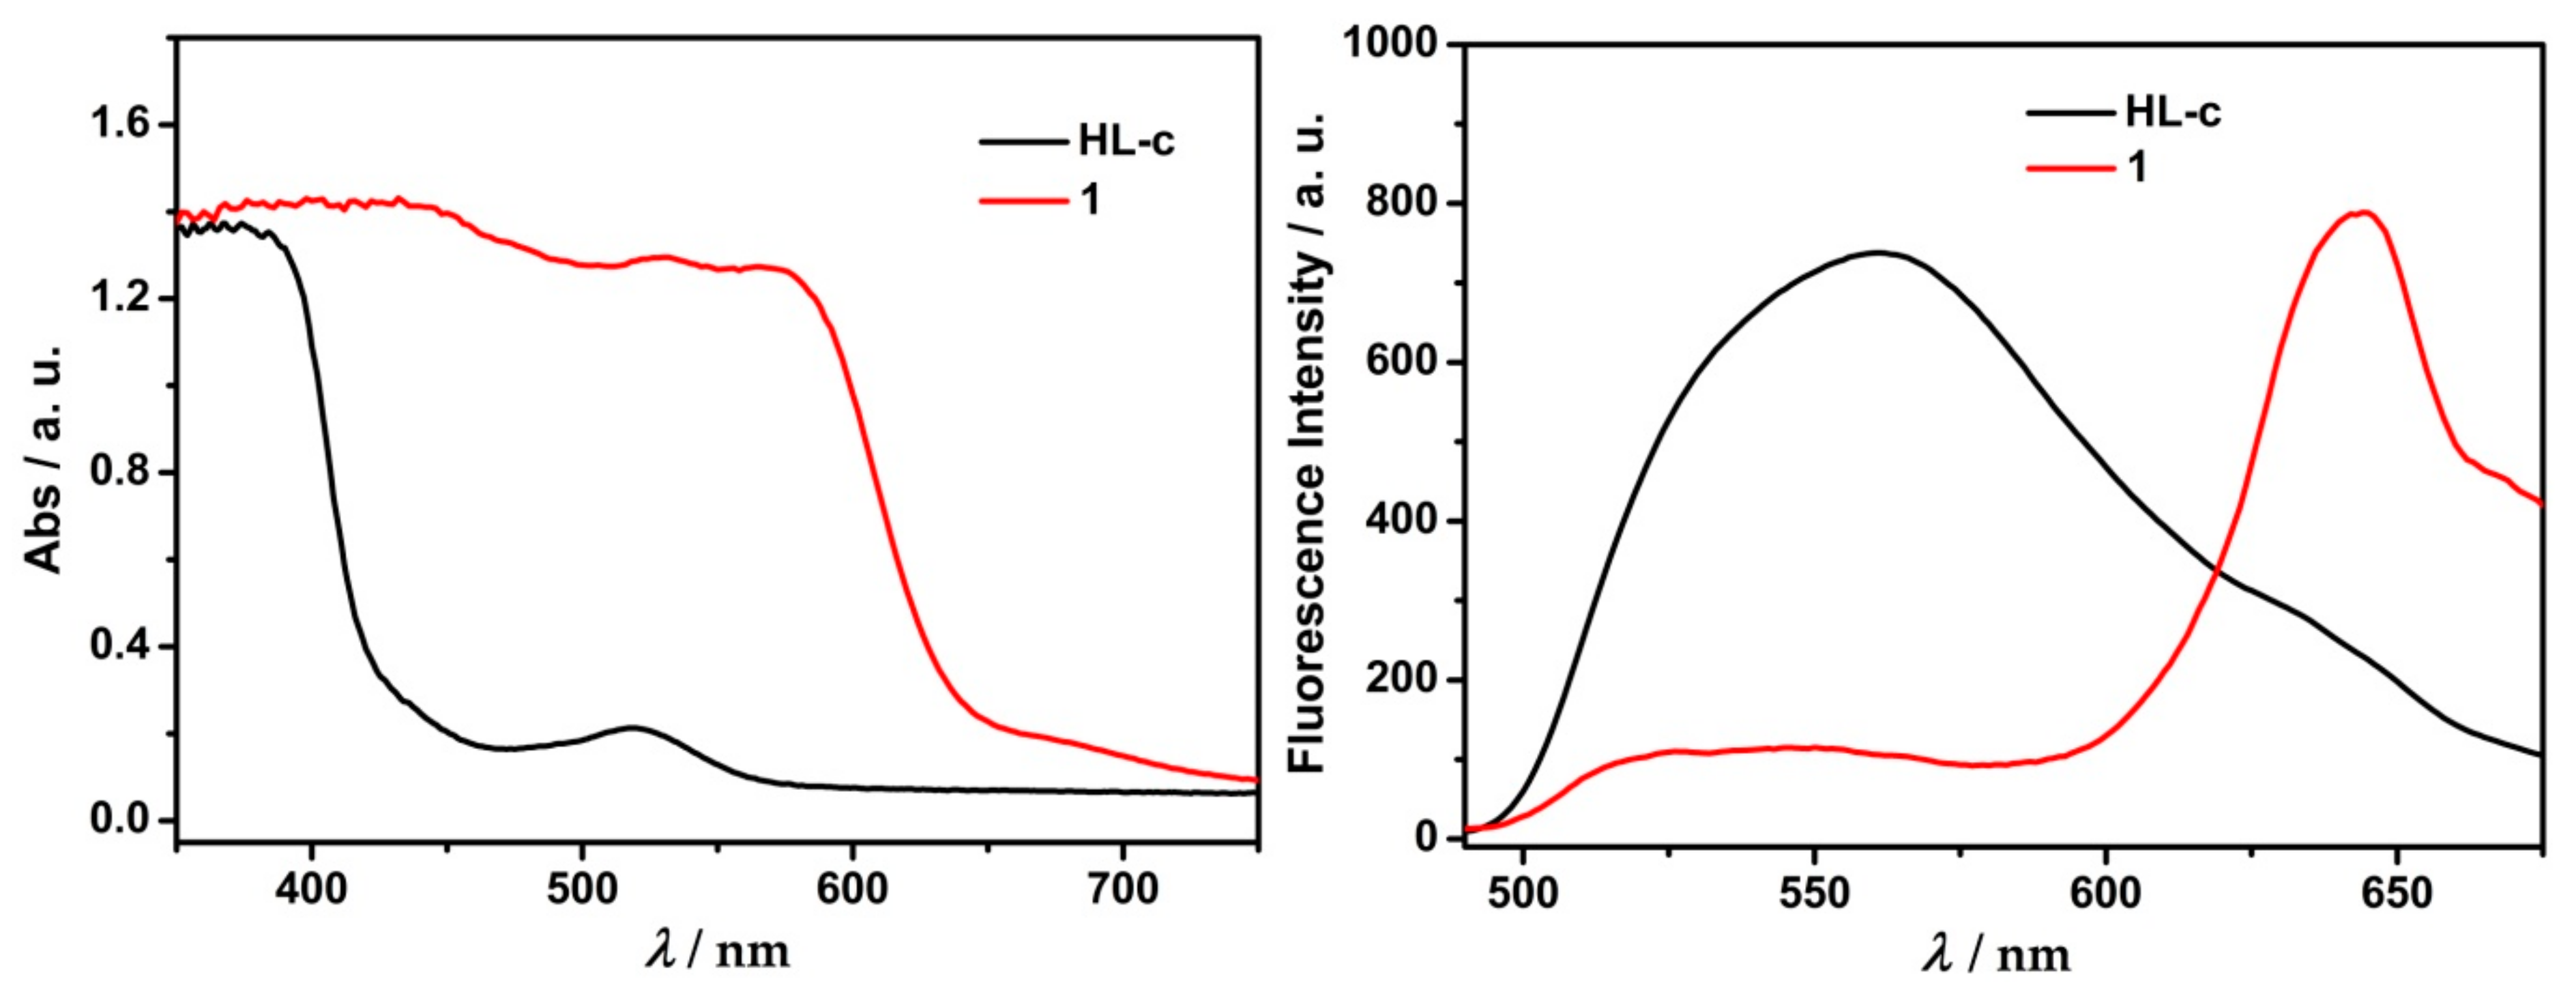
The ligand HL-c is white in color, and therefore it hardly absorbs visible light. The absorption at 520 nm for HL-c should be due to the trace HL-o in the solid. After the ring-opening Complex 1 formed, the visible absorption bands around 530 and 580 nm are significantly strong (Figure 2, left), responsible for the red color of the solid. The ring-closed [Dy(HL-o)(H2O)4(MeCN)](ClO4)3 analog [16] is yellow, and shows strong absorption at 450 nm with a weak absorption at 540 nm. The former absorption is due to the Schiff base part of the ligand HL-o or HL-c, and the latter can be assigned to the oxaanthracene group.
The fluorescence spectra of ligand HL-c and Complex 1 in the solid state were measured at 365 nm excitation wavelength (Figure 2, right). The ring-closed ligand HL-c shows a broad emission peak with the maximum at 560 nm and a shoulder peak at 530 nm. The spectra for Complex 1 show the ligand-centered emissions rather than the metal-centered. It can be seen that the broad emission peak of the ring-closed ligand HL-c at 560 nm red-shifts to about 645 nm in the spectrum of Complex 1, and the latter emission peak corresponds to the conjugated oxaanthracene group in Complex 1. The ring-opened [Dy(HL-o)(H2O)4(MeCN)](ClO4)3 analog [16] shows similar fluorescence peaks at 645 nm, while the emission peaks at 485 and 565 nm for [Dy(L-c)2(MeOH)2]ClO4 [22] correspond to the ring-closed ligand (L-c)−, and are consistent with that of the free ligand HL-c.
2.3. Magnetic Results
The direct current (DC) and alternating current (AC) magnetic susceptibilities of 1 were measured on a SQUID magnetometer. Figure S2 shows the temperature dependence of χMT for complex 1 at 2–280 K, which was measured under the external magnetic field of 2000 Oe. At 280 K, the χMT value is 13.79 cm3 K mol−1, which is close to the theoretical magnetic susceptibility of a Dy (III) ion (14.18 cm3 K mol−1). The χMT value first decreases slowly with the decrease of temperature, and then rapidly, reaching 10.64 cm3 K mol−1 at 2 K. The decrease of low temperature susceptibility may be related to weak intermolecular antiferromagnetic interaction, thermal depopulation caused by low-lying crystal field and magnetic anisotropy of Dy(III) ion. The blue solid line in Figure S2 represents the result of ab initio calculation. The calculated χMT values are consistent with the experimental data above 6 K. It is speculated that the reason why the theoretical χMT value decreases more slowly than the experimental value below 6 K is that the possible intermolecular antiferromagnetic coupling is not considered in the calculation or the limitation of the theoretical calculation itself.
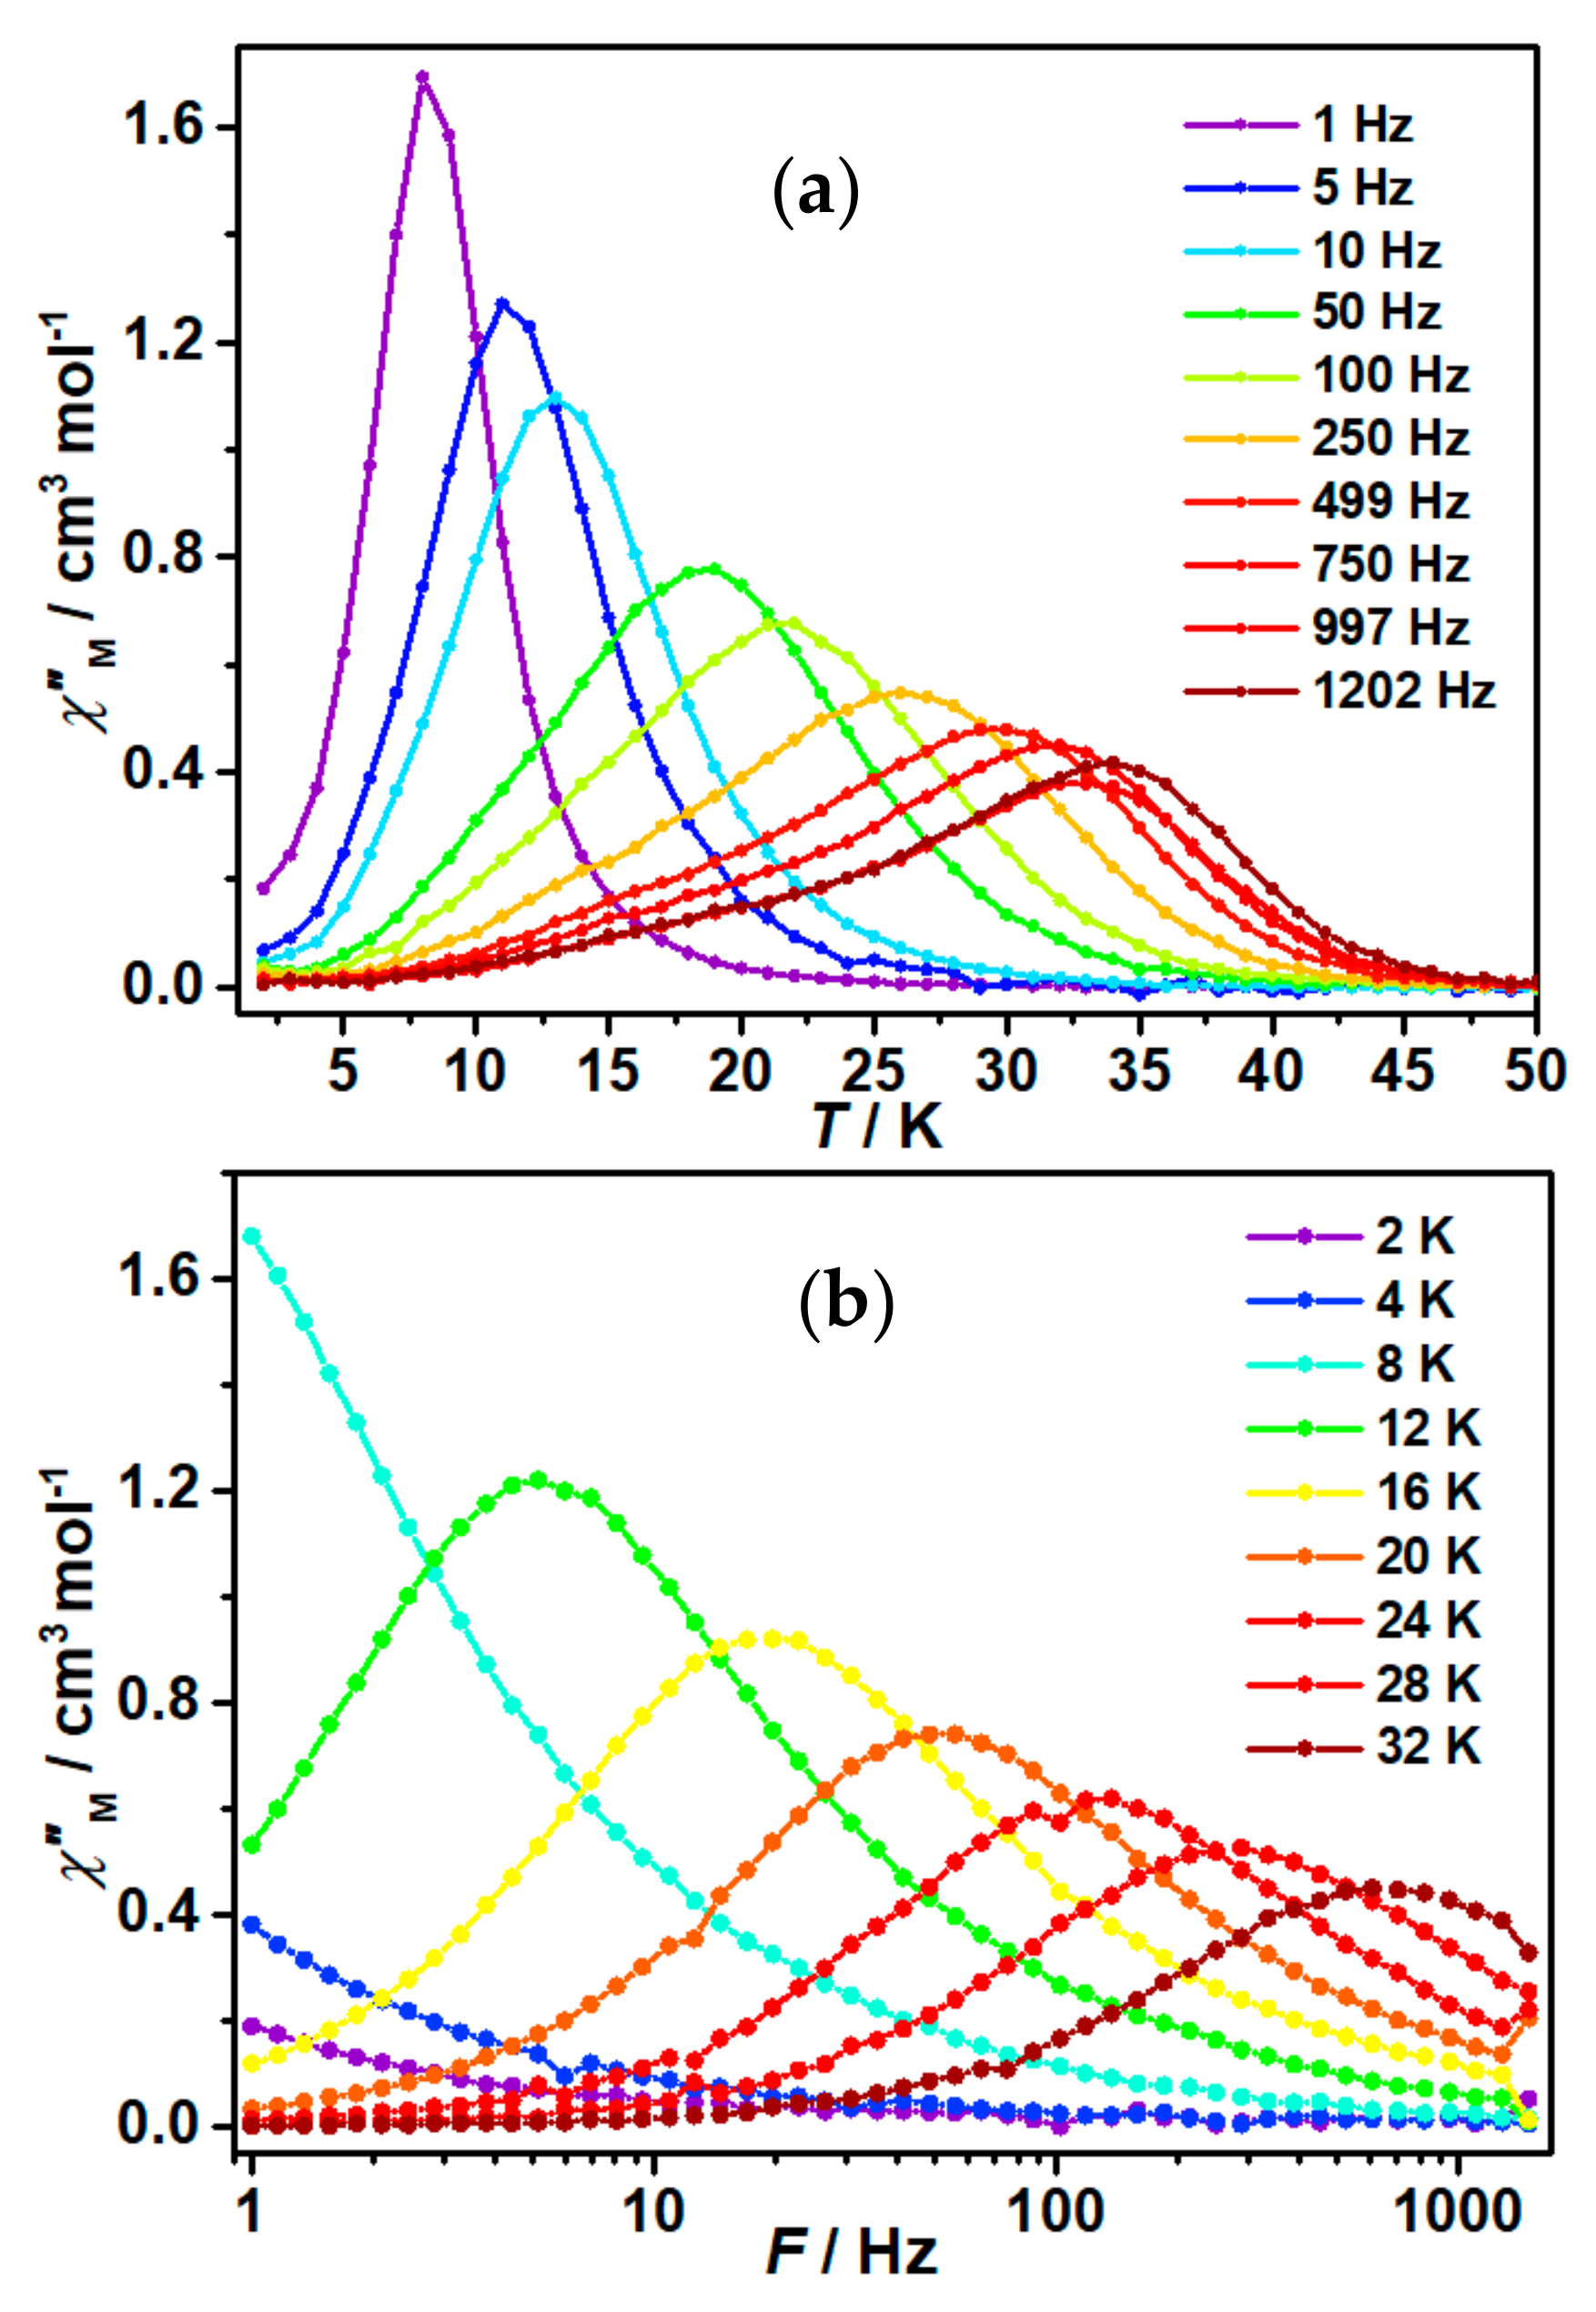
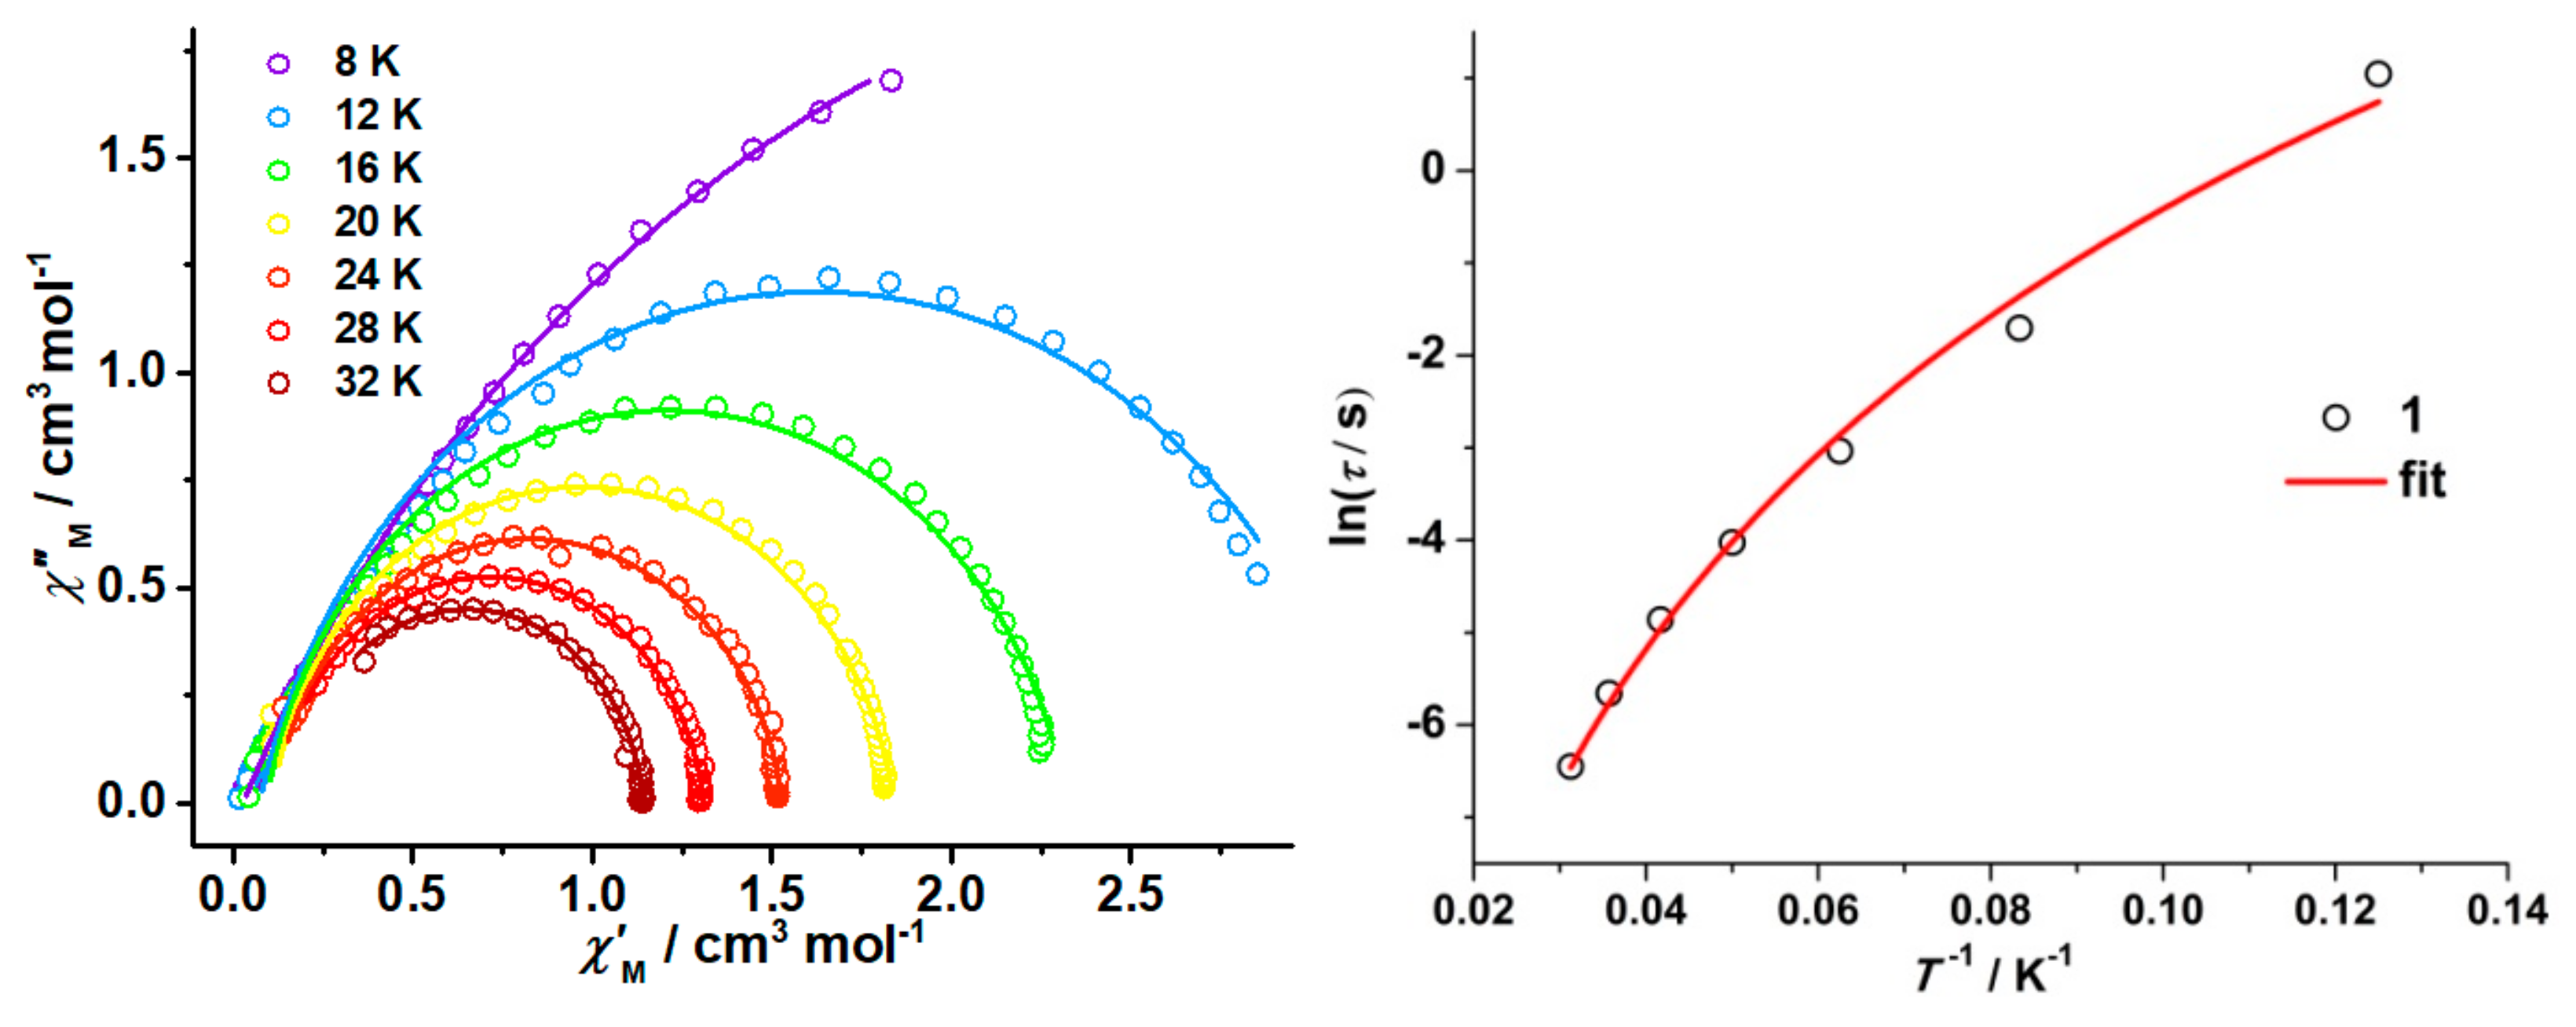
The AC magnetic susceptibility measurements were performed on 1 to study the slow magnetic relaxation (Figure 3 and Figures S3 and S4). Figure S3 shows temperature dependence of out-of-phase AC susceptibilities (χ″M) for 1 under 0 Oe and 2000 Oe dc field with the frequency of 997 Hz. Below 25 K, there is no obvious peak in the χ″M curve under 0 Oe, indicating that there is a strong QTM effect in the molecular relaxation process. After applying a 2000 Oe dc field, the peak at 32 K appears with frequency of 997 Hz, indicating that the 2000 Oe external field can effectively suppresses the low temperature QTM. Therefore, the temperature and frequency-dependent AC magnetic susceptibility data were collected under a DC field of 2000 Oe. As shown in Figure 3a, the peak of the χ″M curve moves to high temperature with the increase of the test frequency, which is typical of a single-molecule magnet. The Cole–Cole diagram in the range of 8–32 K is approximately a semicircle (Figure 4), and the generalized Debye model is used to fit the curve. The obtained curve is in good agreement with the experimental data. The fitting parameters are listed in Table S2, and the α values are all less than 0.30, indicating that the relaxation time distribution is relatively narrow and has good single relaxation. The lnτ versus T−1 data have a certain curvature, indicating that there are multiple relaxation paths. Therefore, the data with a linear relationship in the high temperature area were used for Arrhenius fitting to give the parameters of Ueff = 152(12) K and τ0 = 1.4 × 10⁻⁵ s (Figure S5). The τ0 value is too large and out of the maximum range for an SMM (10−6–10−12 s), indicating that the magnetic relaxation is not due to Orbach process. Therefore, the fit by including Raman relaxation was tried with the equation τ−1 = CTn, and the fitting results are satisfactory with the parameters of C = 9.2 × 10⁻⁶ s−1 K−5.2 and n = 5.2(2) (Figure 4, right). An attempt was made to fit the formula in the full temperature range including Orbach and Raman relaxation, but no reasonable fitting parameters were obtained. In addition, the presence of appreciable intermolecular Dy–Dy magnetic interactions should affect the magnetic relaxation, and therefore magnetic studies on magnetically diluted Dy@Y species are required to elucidate the magnetism of Complex 1.
To further investigate the magnetic anisotropy of Dy(III) ion, ab initio calculation for Complex 1 was performed. Complete-active-space self-consistent field (CASSCF) calculation on Complex 1 on the basis of single-crystal X-ray diffraction determined geometry (Figure S6) carried out with MOLCAS 8.4 [24] and SINGLE_ANISO [25,26,27] programs to investigate the slow relaxation mechanism and magnetic anisotropy of 1 from a theoretical viewpoint. The basis sets for all atoms are atomic natural orbitals from the MOLCAS ANO-RCC library: ANO-RCC-VTZP for Dy(III) ion; VTZ for close O and N; VDZ for distant atoms. The calculation employed the second order Douglas–Kroll–Hess Hamiltonian, where scalar relativistic contraction was taken into account in the basis set and the spin-orbit coupling was handled separately in the restricted active space state interaction (RASSI-SO) procedure. For Complex 1, active electrons in seven active orbitals include all electrons (CAS (9 in 7)) in the CASSCF calculation. To exclude all the doubts, we calculated all the roots in the active space. We mixed the maximum number of spin-free state, which was possible with our hardware (all from 21 sextets, 128 from 224 quadruplets, 130 from 490 doublets). SINGLE_ANISO program was used to obtain the energy levels, g tensors, mJ values, magnetic axes, magnetic susceptibilities et al., based on the above CASSCF/RASSI-SO calculations.
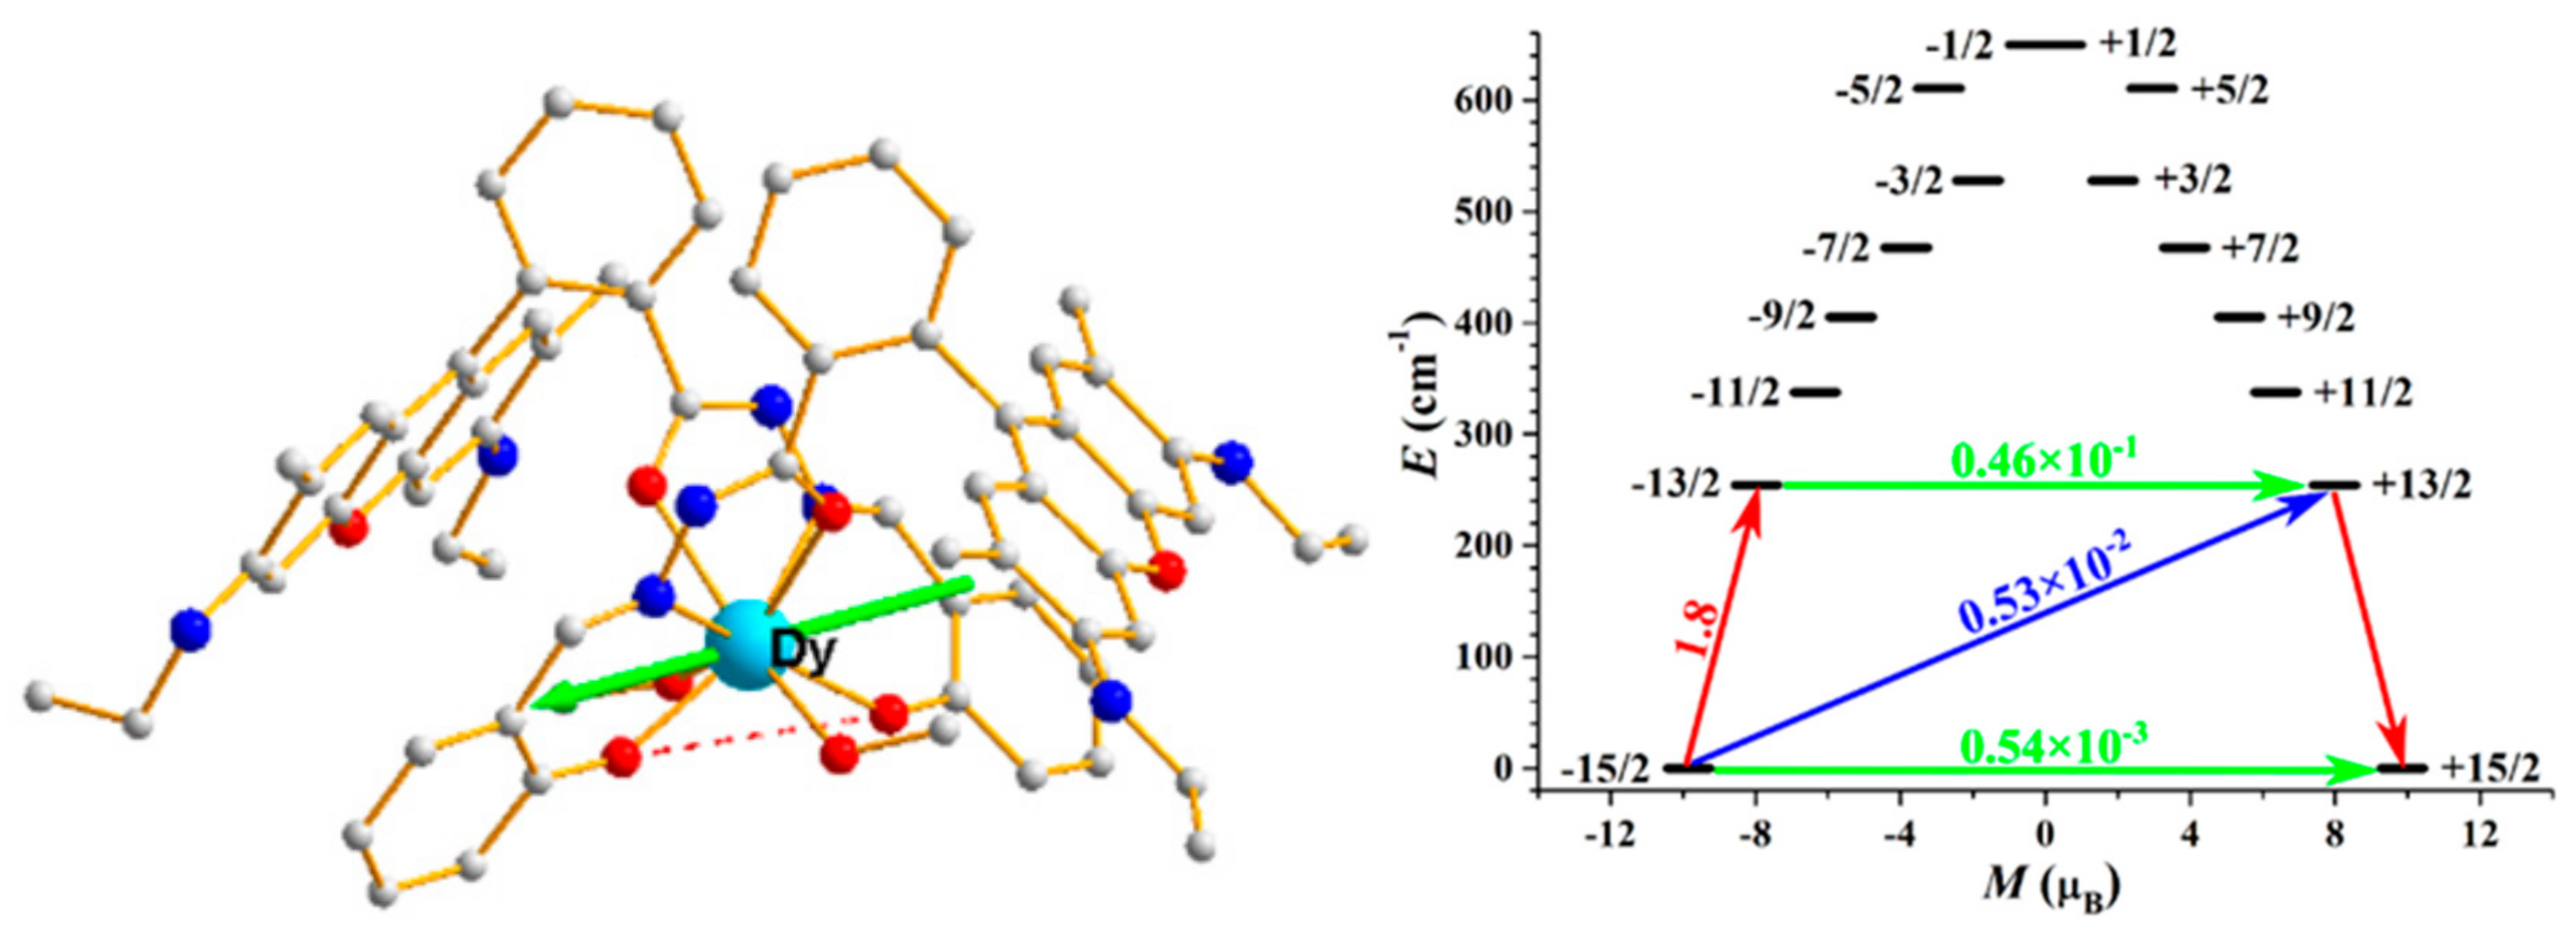
The calculated energy levels, g tensors, and predominant mJ values of the lowest eight Kramers doublets (KDs) are listed in Tables S3 and S4. The gx,y,z tensors of ground state are 0.001, 0.002, 19.711 for 1, suggesting a strong axial magnetic anisotropy. As shown in Figure 5, the principal magnetic anisotropy axis of the ground KD on Dy(III) ions in 1 is basically parallel to the connection of two phenoxy oxygen atoms. The transversal magnetic moment in the ground KD of 1 is 0.54 × 10⁻³ μB, and thus QTM process in the ground KD was suppressed at low temperature. The transversal magnetic moment in the first excited KD is 0.46 × 10⁻¹ μB, therefore allowing a fast QTM in the first excited KD [28]. The experimental energy barrier (152(12) K) of Complex 1 is nearly half of the calculated energy of first KD (365.7 K). Combining with magnetization blocking barriers in Figure 5, it can be inferred that Complex 1 should contain the Raman relaxation process. In order to learn deeply the relaxation mechanism, the ab initio calculations were also performed on the ring-closed analog, [Dy(L-c)2(MeOH)2]ClO4 [22], and the results are shown in Tables S5 and S6. The results indicate that the calculated energy of first KD (365.7 K) for 1 is larger than that of 160.8 K for [Dy(L-c)2(MeOH)2]ClO4 [22] (Figures S7 and S8).
Previous experimental results for the salicylaldehyde rhodamine Dy(III) species showed that two short Dy-Ophenoxy bonds and the corresponding Ophenoxy-Dy-Ophenoxy angle determine the direction of principal magnetic anisotropy axis as well as the SMM behavior. Table 3 collects the magnetic properties and the structural data for the salicylaldehyde Dy(III) analogs [16,17,22]. On the basis of the data, it can be concluded that the calculated energy of first KD (EKD1) is basically related to the Ophenoxy-Dy-Ophenoxy bond angle, i.e., the larger Ophenoxy-Dy-Ophenoxy bond angle corresponds to a larger EKD1. Complex 1 has larger Ophenoxy-Dy-Ophenoxy angle than that of [Dy(L-c)2(MeOH)2]ClO4, and shows better SMM properties under the circumstance of shorter Dy-Ophenoxy bond distances the latter has. The highest Ueff belongs to the ring-opened complex [Dy(HL-o)(H2O)4(MeCN)](ClO4)3 [16], and future work involves the synthesis of ring-closed [Dy(HL-c)(solvent)x]3+ species to further understand the magnetic relaxation mechanism and/or improve the magnetic performance of the SMMs.
3. Materials and Methods
3.1. Materials
3.2. Synthesis of the [Dy(HL-o)2(MeOH)2](ClO4)3·4.5MeOH (Complex 1)
The ligand HL-c (0.1 mmol, 53.2 mg) was suspended in MeOH (8 mL). Aqueous solution of [Dy(ClO4)3] 50 wt.% in H2O (0.05 mmol, 48 μL) was added with stirring at room temperature affording a red solution. After stirring for a few minutes, the filtrate was placed in the air condition evaporating solvents slowly. Red, strip-shaped crystals suitable for X-ray diffraction analysis were collected after about 3 days. Yield: about 52%. Elemental analysis calcd (%) for C72.50H90Cl3DyN8O24.50 (1734.37): C, 50.20; H, 5.23; N, 6.46. Found: C, 50.6; H, 4.8; N, 6.8.
3.3. Physical Measurements
Elemental analyses (C, H, and N) were performed on an Elementar Vario Cario Erballo analyzer, Elementar, Langenselbold, Germany. The solid UV-vis diffuse reflection spectra were measured with a U-3900 spectrophotometer (Hitachi, Tokyo, Japan) between 350 to 750 nm. Powder X-ray diffraction (PXRD) measurements were recorded on a Bruker D8 ADVANCE X-ray diffractometer (Bruker, Billerica, MA, USA) using CuKα radiation (λ = 1.54184 Å) at room temperature from 5° to 50° with sweeping speed of 10°/min. The fluorescence spectra were recorded on a F98 fluorescence spectrophotometer, Lengguang, Shanghai, China. Single-crystal X-ray data were collected on a Rigaku SuperNova, Dual, Cu at zero, AtlasS2, Rigaku Oxford Diffraction, Tokyo, Japan. The structure was solved by program SHELXS-97 (SHELXS97 and SHELXL97. University of Göttingen, Göttingen, Germany) and refined by a full matrix least-squares method based on F2 using SHELXL-2014/7 method [29]. Hydrogen atoms were added geometrically and refined using a riding model. Temperature- and field-dependent magnetic susceptibility measurements were carried out on a Quantum Design MPMS-XL5 SQUID magnetometer, Quantum Design, San Diego, CA, USA.
3.4. Theoretical Computations of Magnetism
To investigate the magnetic behaviors of Complex 1 in the theoretical perspective, complete-active-space self-consistent field (CASSCF) calculations on 1 on the basis of single-crystal X-ray determined geometries have been carried out with MOLCAS 8.4 and SINGLE_ANISO program package [24,25,26,27]. The details are displayed in the supporting information.
4. Conclusions
We report a Dy(III) mononuclear complex based on a rhodamine 6G ligand, which shows single-molecule magnetic properties. The slow magnetic relaxation for Complex 1 is due to the Raman relaxation process, and might be affected by the intermolecular magnetic exchange between neighboring Dy(III) centers. Complex 1 shows ligand-centered fluorescence at 645 nm under the excitation light of 365 nm wavelength. On the basis of the ab initio calculations, we come to a conclusion that the SMM performance can be improved by modulating the Ophenoxy-Dy-Ophenoxy bond angle. This photo-magnetic bifunctional molecular material will have broad application prospects in molecular information storage and other fields.
Supplementary Materials
The following are available online at https://0-www-mdpi-com.brum.beds.ac.uk/article/10.3390/inorganics9070051/s1, Figure S1: The powder XRD for complex 1, Figure S2: Variable-temperature magnetic susceptibilities for 1 under 2000 Oe applied field. The solid lines represent the calculated results, which was simulated by the program SINGLE_ANISO, Figure S3: Temperature-dependence of out-of-phase ac susceptibilities (χ″M) for 1 under 0 Oe and 2000 Oe outer field with frequency of 997 Hz, Figure S4: Frequency-dependence of in-phase ac susceptibilities (χ′M) (a); temperature-dependence of χ′M (b) for 1 under 2000 Oe field, Figure S5: Temperature dependence of magnetic relaxation time τ for 1 under 2000 Oe field. Solid line is the linear fit based on the high temperature data. Figure S6: Calculated complete molecular structures of Complex 1. H atoms are omitted, Figure S7: The calculated molecular structures (left) and principal magnetic axes (right) of the ground KDs on Dy(III) of complex [Dy(L-c)2(MeOH)2]ClO4, Figure S8: Magnetization blocking barriers in complex [Dy(L-c)2(MeOH)2]ClO4, Table S1: The results of coordination geometric configurations evaluated by SHAPE software for complex 1, Table S2: Fitting parameters obtained from Cole-Cole for 1 in 2000 Oe field, Table S3: Calculated energy levels (cm−1), g (gx, gy, gz) tensors and predominant mJ values of the lowest eight Kramers doublets (KDs) for Complex 1, Table S4: Wave functions with definite projection of the total moment|mJ > for the lowest two KDs of individual Dy(III) fragments for complex 1 using CASSCF/RASSI with MOLCAS 8.4, Table S5: Calculated energy levels (cm−1), g (gx, gy, gz) tensors and predominant mJ values of the lowest eight Kramers doublets (KDs) for [Dy(L-c)2(MeOH)2]ClO4, Table S6: Wave functions with definite projection of the total moment |mJ > for the lowest two KDs of individual Dy(III) fragments for [Dy(L-c)2(MeOH)2]ClO4 using CASSCF/RASSI with MOLCAS 8.4.
Author Contributions
Conceptualization and formal analysis, L.M. and M.-J.L.; ab initio calculations, M.-M.D.; writing—original draft preparation, L.M., M.-J.L., and M.-M.D.; writing—review and editing, supervision, project administration, and funding acquisition, H.-Z.K. and Y.-Q.Z. All authors have read and agreed to the published version of the manuscript.
Funding
This research was funded by the National Natural Science Foundation of China, grant numbers 21771115, 21971142 and 21973046.
Institutional Review Board Statement
Not applicable.
Informed Consent Statement
Not applicable.
Data Availability Statement
Not applicable.
Conflicts of Interest
The authors declare no conflict of interest.
References
- Leuenberger, M.N.; Loss, D.J.N. Quantum computing in molecular magnets. Nature 2001, 410, 789–793. [Google Scholar] [CrossRef] [PubMed] [Green Version]
- Ardavan, A.; Rival, O. Will spin-relaxation times in molecular magnets permit quantum information processing? Phys. Rev. Lett. 2007, 98, 057201. [Google Scholar] [CrossRef] [PubMed] [Green Version]
- Bogani, L.; Wernsdorfer, W. Molecular spintronics using single-molecule magnets. Nat. Mater. 2008, 7, 179–186. [Google Scholar] [CrossRef] [PubMed]
- Sessoli, R.; Gatteschi, D.; Caneschi, A.; Novak, M.A. Magnetic bistability in a metal-ion cluster. Nature 1993, 365, 141–143. [Google Scholar] [CrossRef]
- Aubin, S.M.J.; Wemple, M.W.; Adams, D.M.; Tsai, H.-L.; Christou, G.; Hendrickson, D.N. Distorted MnIVMnIII3 Cubane Complexes as Single-Molecule Magnets. J. Am. Chem. Soc. 1996, 118, 7746–7754. [Google Scholar] [CrossRef]
- Feng, M.; Tong, M.-L. Single Ion Magnets from 3d to 5f: Developments and Strategies. Chem. Eur. J. 2018, 24, 7574–7594. [Google Scholar] [CrossRef]
- Ishikawa, N.; Sugita, M.; Ishikawa, T.; Koshihara, S.-y.; Kaizu, Y. Lanthanide Double-Decker Complexes Functioning as Magnets at the Single-Molecular Level. J. Am. Chem. Soc. 2003, 125, 8694–8695. [Google Scholar] [CrossRef]
- Liu, J.-L.; Chen, Y.-C.; Tong, M.-L. Symmetry strategies for high performance lanthanide-based single-molecule magnets. Chem. Soc. Rev. 2018, 47, 2431–2453. [Google Scholar] [CrossRef]
- Goodwin, C.A.P.; Ortu, F.; Reta, D.; Chilton, N.F.; Mills, D.P. Molecular magnetic hysteresis at 60 kelvin in dysprosocenium. Nature 2017, 548, 439–442. [Google Scholar] [CrossRef]
- Guo, F.-S.; Day, B.M.; Chen, Y.-C.; Tong, M.-L.; Mansikkamäki, A.; Layfield, R.A. Magnetic hysteresis up to 80 kelvin in a dysprosium metallocene single-molecule magnet. Science 2018, 362, 1400–1403. [Google Scholar] [CrossRef] [Green Version]
- Guo, M.; Tang, J. Six-Coordinate Ln(III) Complexes with Various Coordination Geometries Showing Distinct Magnetic Properties. Inorganics 2018, 6, 16. [Google Scholar] [CrossRef] [Green Version]
- Perlepe, P.S.; Maniaki, D.; Pilichos, E.; Katsoulakou, E.; Perlepes, S.P. Smart Ligands for Efficient 3d-, 4d- and 5d-Metal Single-Molecule Magnets and Single-Ion Magnets. Inorganics 2020, 8, 39. [Google Scholar] [CrossRef]
- Lu, J.; Guo, M.; Tang, J. Recent Developments in Lanthanide Single-Molecule Magnets. Chem. Asian J. 2017, 12, 2772–2779. [Google Scholar] [CrossRef]
- Meng, Y.-S.; Xu, L.; Xiong, J.; Yuan, Q.; Liu, T.; Wang, B.-W.; Gao, S. Low-Coordinate Single-Ion Magnets by Intercalation of Lanthanides into a Phenol Matrix. Angew. Chem. Int. Ed. 2018, 57, 4673–4676. [Google Scholar] [CrossRef]
- Guo, F.-S.; Day, B.M.; Chen, Y.-C.; Tong, M.-L.; Mansikkamäki, A.; Layfield, R.A. A Dysprosium Metallocene Single-Molecule Magnet Functioning at the Axial Limit. Angew. Chem. Int. Ed. 2017, 56, 11445–11449. [Google Scholar] [CrossRef]
- Liu, M.-J.; Wu, S.-Q.; Li, J.-X.; Zhang, Y.-Q.; Sato, O.; Kou, H.-Z. Structural Modulation of Fluorescent Rhodamine-Based Dysprosium(III) Single-Molecule Magnets. Inorg. Chem. 2020, 59, 2308–2315. [Google Scholar] [CrossRef]
- Liu, M.-J.; Yuan, J.; Tao, J.; Zhang, Y.-Q.; Liu, C.-M.; Kou, H.-Z. Rhodamine Salicylaldehyde Hydrazone Dy(III) Complexes: Fluorescence and Magnetism. Inorg. Chem. 2018, 57, 4061–4069. [Google Scholar] [CrossRef]
- Yuan, J.; Liu, M.-J.; Wu, S.-Q.; Zhu, X.; Zhang, N.; Sato, O.; Kou, H.-Z. Substituent effects on the fluorescent spin-crossover Fe(ii) complexes of rhodamine 6G hydrazones. Inorg. Chem. Front. 2019, 6, 1170–1176. [Google Scholar] [CrossRef]
- Rinehart, J.D.; Long, J.R. Exploiting single-ion anisotropy in the design of f-element single-molecule magnets. Chem. Sci. 2011, 2, 2078–2085. [Google Scholar] [CrossRef]
- Luo, Z.-R.; Wang, H.-L.; Zhu, Z.-H.; Liu, T.; Ma, X.-F.; Wang, H.-F.; Zou, H.-H.; Liang, F.-P. Assembly of Dy60 and Dy30 cage-shaped nanoclusters. Commun. Chem. 2020, 3, 30. [Google Scholar] [CrossRef] [Green Version]
- Xiang, Y.; Tong, A.; Jin, P.; Ju, Y. New Fluorescent Rhodamine Hydrazone Chemosensor for Cu(II) with High Selectivity and Sensitivity. Org. Lett. 2006, 8, 2863–2866. [Google Scholar] [CrossRef] [PubMed]
- Liu, M.-J.; Fu, Z.-Y.; Sun, R.; Yuan, J.; Liu, C.-M.; Zou, B.; Wang, B.-W.; Kou, H.-Z. Mechanochromic and Single-Molecule Magnetic Properties of a Rhodamine 6G Dy(III) Complex. ACS Appl. Electron. Mater. 2021, 3, 1368–1374. [Google Scholar] [CrossRef]
- Nakanishi, T.; Hori, Y.; Sato, H.; Wu, S.-Q.; Okazawa, A.; Kojima, N.; Yamamoto, T.; Einaga, Y.; Hayami, S.; Horie, Y.; et al. Observation of Proton Transfer Coupled Spin Transition and Trapping of Photoinduced Metastable Proton Transfer State in an Fe(II) Complex. J. Am. Chem. Soc. 2019, 141, 14384–14393. [Google Scholar] [CrossRef] [PubMed]
- Aquilante, F.; Autschbach, J.; Carlson, R.K.; Chibotaru, L.F.; Delcey, M.G.; De Vico, L.; Galván, I.F.; Ferré, N.; Frutos, L.M.; Gagliardi, L.; et al. Molcas 8: New capabilities for multiconfigurational quantum chemical calculations across the periodic table. J. Comput. Chem. 2016, 37, 506–541. [Google Scholar] [CrossRef] [Green Version]
- Chibotaru, L.F.; Ungur, L.; Soncini, A. The Origin of Nonmagnetic Kramers Doublets in the Ground State of Dysprosium Triangles: Evidence for a Toroidal Magnetic Moment. Angew. Chem. Int. Ed. 2008, 47, 4126–4129. [Google Scholar] [CrossRef] [Green Version]
- Ungur, L.; Van den Heuvel, W.; Chibotaru, L.F. Ab initio investigation of the non-collinear magnetic structure and the lowest magnetic excitations in dysprosium triangles. New J. Chem. 2009, 33, 1224–1230. [Google Scholar] [CrossRef]
- Chibotaru, L.F.; Ungur, L.; Aronica, C.; Elmoll, H.; Pilet, G.; Luneau, D. Structure, Magnetism, and Theoretical Study of a Mixed-Valence CoII3CoIII4 Heptanuclear Wheel: Lack of SMM Behavior despite Negative Magnetic Anisotropy. J. Am. Chem. Soc. 2008, 130, 12445–12455. [Google Scholar] [CrossRef] [Green Version]
- Lu, F.; Ding, M.M.; Li, J.X.; Wang, B.L.; Zhang, Y.Q. Why lanthanide ErIII SIMs cannot possess huge energy barriers: A theoretical investigation. Dalton Trans. 2020, 49, 14576–14583. [Google Scholar] [CrossRef]
- Sheldrick, G.M. A short history of SHELX. Acta Crystallogr. Sect. A Found. Crystallogr. 2008, 64, 112–122. [Google Scholar] [CrossRef] [Green Version]
Scheme 1.
Transformation of ring-closed and ring-opened form of rhodamine 6G salicylaldehyde hydrazone and its reactions with Dy3+.
Scheme 1.
Transformation of ring-closed and ring-opened form of rhodamine 6G salicylaldehyde hydrazone and its reactions with Dy3+.

Figure 1.
Crystal structure of the [Dy(HL-o)2(MeOH)2]3+ cation of 1 (left). Hydrogen atoms, anion, and crystallization solvents are omitted for clarify. 1D supromolecular chain showing the intermolecular stacking (right).
Figure 1.
Crystal structure of the [Dy(HL-o)2(MeOH)2]3+ cation of 1 (left). Hydrogen atoms, anion, and crystallization solvents are omitted for clarify. 1D supromolecular chain showing the intermolecular stacking (right).

Figure 2.
The solid-state UV-vis spectra (left) and the solid-state fluorescence spectra (right, λex = 365 nm) for HL-c and Complex 1.
Figure 2.
The solid-state UV-vis spectra (left) and the solid-state fluorescence spectra (right, λex = 365 nm) for HL-c and Complex 1.

Figure 3.
Temperature dependence and frequency dependence of out-of-phase AC susceptibilities (χ″M) for 1 (a,b) under 2000 Oe.
Figure 3.
Temperature dependence and frequency dependence of out-of-phase AC susceptibilities (χ″M) for 1 (a,b) under 2000 Oe.

Figure 4.
Cole–Cole data for Complex 1. Solid curves are the fitting results from generalized Debye model (left); temperature dependence of magnetic relaxation time τ for 1 under 2000 Oe field. Solid line is the fit based on the Raman process (right).
Figure 4.
Cole–Cole data for Complex 1. Solid curves are the fitting results from generalized Debye model (left); temperature dependence of magnetic relaxation time τ for 1 under 2000 Oe field. Solid line is the fit based on the Raman process (right).

Figure 5.
The alignment of the anisotropic axis for the central Dy(III) ion in Complex 1 (left). Magnetization blocking barriers in 1 (right): the thick black lines represent the KDs as a function of their magnetic moment along the magnetic axis; green lines correspond to diagonal QTM; blue lines represent off-diagonal relaxation process; the numbers at each arrow stand for the mean absolute value of the corresponding matrix element of transition magnetic moment.


Table 1.
Crystal data and refinement parameters for Complex 1.
| Formula | C72.5H90Cl3DyN8O24.5 |
| Formula weight | 1734.37 |
| T/K | 100 |
| Crystal system | triclinic |
| Space group | P1− |
| a/Å | 14.2953(4) |
| b/Å | 14.6326(4) |
| c/Å | 19.3797(5) |
| α/° | 79.470(2) |
| β/° | 85.124(2) |
| γ/° | 76.571(2) |
| V/Å3 | 3872.73(18) |
| Z | 2 |
| ρcalc/g·cm−3 | 1.487 |
| µ/mm−1 | 6.808 |
| F(000) | 1788 |
| Radiation | CuKα (λ = 1.54184) |
| Data/restraints/parameters | 15,829/12/1012 |
| GOF on F2 | 1.010 |
| Rint, Rsigma | 0.0580, 0.0924 |
| R1,wR2 [I > 2σ(I)] | 0.0670, 0.1712 |
| R1,wR2 (all data) | 0.0824, 0.1849 |
| CCDC | 2,008,107 |
Table 2.
Selected bond distances (Å) and bond angles (°) for Complex 1.
| Dy-O1 | 2.181(4) | Dy-O2 | 2.258(3) |
| Dy-O3 | 2.386(4) | Dy-O4 | 2.384(4) |
| Dy-O5 | 2.398(4) | Dy-O6 | 2.372(4) |
| Dy-N1 | 2.570(5) | Dy-N2 | 2.566(5) |
| O1-Dy-O2 | 115.77(13) | O5-Dy1-O6 | 133.27(13) |
| C8-N3-N1 | 117.7(4) | C41-N4-N2 | 116.0(5) |
Table 3.
Comparison of structure and magnetic properties for the Dy(III) salicyldehyde-rhodamine complexes.
Table 3.
Comparison of structure and magnetic properties for the Dy(III) salicyldehyde-rhodamine complexes.
| Complexes | Dy-Ophenoxy/Å | Ophenoxy-Dy-Ophenoxy/° | EKD1 (Ueff)/K | Ref. |
|---|---|---|---|---|
| [Dy(L1)3] | 2.224(5) | 82.7(2) | 284.2 (104) | [17] |
| 2.263(5) | 89.45(19) | |||
| 2.244(5) | 148.64(17) | |||
| [Dy(L2)3] | 2.248(3) | 87.69(12) | 23.3 (0) | [17] |
| 2.223(3) | 89.63(13) | |||
| 2.222(4) | 88.12(13) | |||
| [Dy(L-c)2(MeOH)2]ClO4 | 2.170(3) | 96.96(12) | 160.8 (4.8) | [22] |
| 2.209(4) | ||||
| [Dy(HL-o)2(MeOH)2](ClO4)3 (1) | 2.181(4) | 115.77(13) | 365.8 (Raman relaxation) | This Work |
| 2.258(3) | ||||
| [Dy(HL-o)(H2O)4(MeCN)](ClO4)3 | 2.175(3) | No | 320.8 (320) | [16] |
HL1 = rhodamine B salicylaldehyde hydrazone, HL2 = rhodamine B 3-methylsalicylaldehyde hydrazone, HL-c = ring-closed form of rhodamine 6G salicylaldehyde hydrazone, HL-o = ring-opened form of rhodamine 6G salicylaldehyde hydrazone. EKD1 is the calculated energy of first Kramers Doublet.
Publisher’s Note: MDPI stays neutral with regard to jurisdictional claims in published maps and institutional affiliations. |
© 2021 by the authors. Licensee MDPI, Basel, Switzerland. This article is an open access article distributed under the terms and conditions of the Creative Commons Attribution (CC BY) license (https://creativecommons.org/licenses/by/4.0/).
Share and Cite
MDPI and ACS Style
Miao, L.; Liu, M.-J.; Ding, M.-M.; Zhang, Y.-Q.; Kou, H.-Z. A Dy(III) Fluorescent Single-Molecule Magnet Based on a Rhodamine 6G Ligand. Inorganics 2021, 9, 51. https://0-doi-org.brum.beds.ac.uk/10.3390/inorganics9070051
AMA Style
Miao L, Liu M-J, Ding M-M, Zhang Y-Q, Kou H-Z. A Dy(III) Fluorescent Single-Molecule Magnet Based on a Rhodamine 6G Ligand. Inorganics. 2021; 9(7):51. https://0-doi-org.brum.beds.ac.uk/10.3390/inorganics9070051
Chicago/Turabian StyleMiao, Lin, Mei-Jiao Liu, Man-Man Ding, Yi-Quan Zhang, and Hui-Zhong Kou. 2021. "A Dy(III) Fluorescent Single-Molecule Magnet Based on a Rhodamine 6G Ligand" Inorganics 9, no. 7: 51. https://0-doi-org.brum.beds.ac.uk/10.3390/inorganics9070051
Note that from the first issue of 2016, this journal uses article numbers instead of page numbers. See further details here.