1. Introduction
The purpose of orthodontic treatment is to achieve an aesthetic improvement and provide functional occlusion and balanced facial features [
1]. A precise diagnosis is essential for choosing the correct therapy and determining the prognosis adequately. Therefore, orthodontic treatment planning requires an accurate prediction of the amount and direction of craniofacial development [
2,
3,
4]. Since Broadbent [
5] introduced lateral cephalometric radiography in 1931, studies on craniofacial growth and development have increased in number and many researchers have suggested definitions and norms for the normal occlusion. Hence, radiographic cephalometry has become one of the most important instruments of clinical and research orthodontics [
6].
The appropriate interpretation of any cephalometric analysis requires norms that are calculated from populations and adjusted according to age, gender, and ethnic group [
5,
6]. The cephalometric value norms represent a valuable aid for clinicians to determine the measure of deviations from the population average, or what is considered “healthy”. Currently, orthodontic patients in clinical practice range from children to adults and they belong to a variety of ethnic groups; therefore, a wide range of representative standards would ideally be needed to perform an individualised orthodontic treatment plan [
7,
8].
Mandibular growth prediction is a factor of utmost importance in orthodontic/orthopaedic treatment planning [
9]. Indeed, it seems crucially important to identify the mandibular growth pattern before treatment, as patients with signs of posterior mandibular growth rotation (hyperdivergent growth pattern) are assumed to be more difficult to treat than those with an anterior mandibular rotation (hypodivergent growth pattern) [
10,
11,
12]. The most widely used method for establishing the jaw growth rotation is cephalometric analysis. Several different analyses have been introduced to evaluate a patient’s divergency, such as the Ricketts analysis or the Jarabak analysis [
13,
14].
The SN^GoGn is a very useful diagnostic parameter to consider before starting an orthodontic treatment because it evaluates the facial pattern of a subject and it reflects the variability of the mandibular plane in relation to the anterior cranial base [
15].
Another important morphological characteristic of the lower jaw related to the anterior/posterior rotational growth pattern is the angle formed by the condylar axis (CoGo) and the mandibular base (GoMe), i.e., the Condylion-Gonion-Menton angle (CoGoMe^) [
10,
11]. Although this angle has been proposed as a possible predictor of responsiveness during orthopaedic therapies [
16], there are no studies on the distribution of the CoGoMe^ and its relationship with classical cephalometric vertical (SN^GoGn) and sagittal measurements (ANPg^).
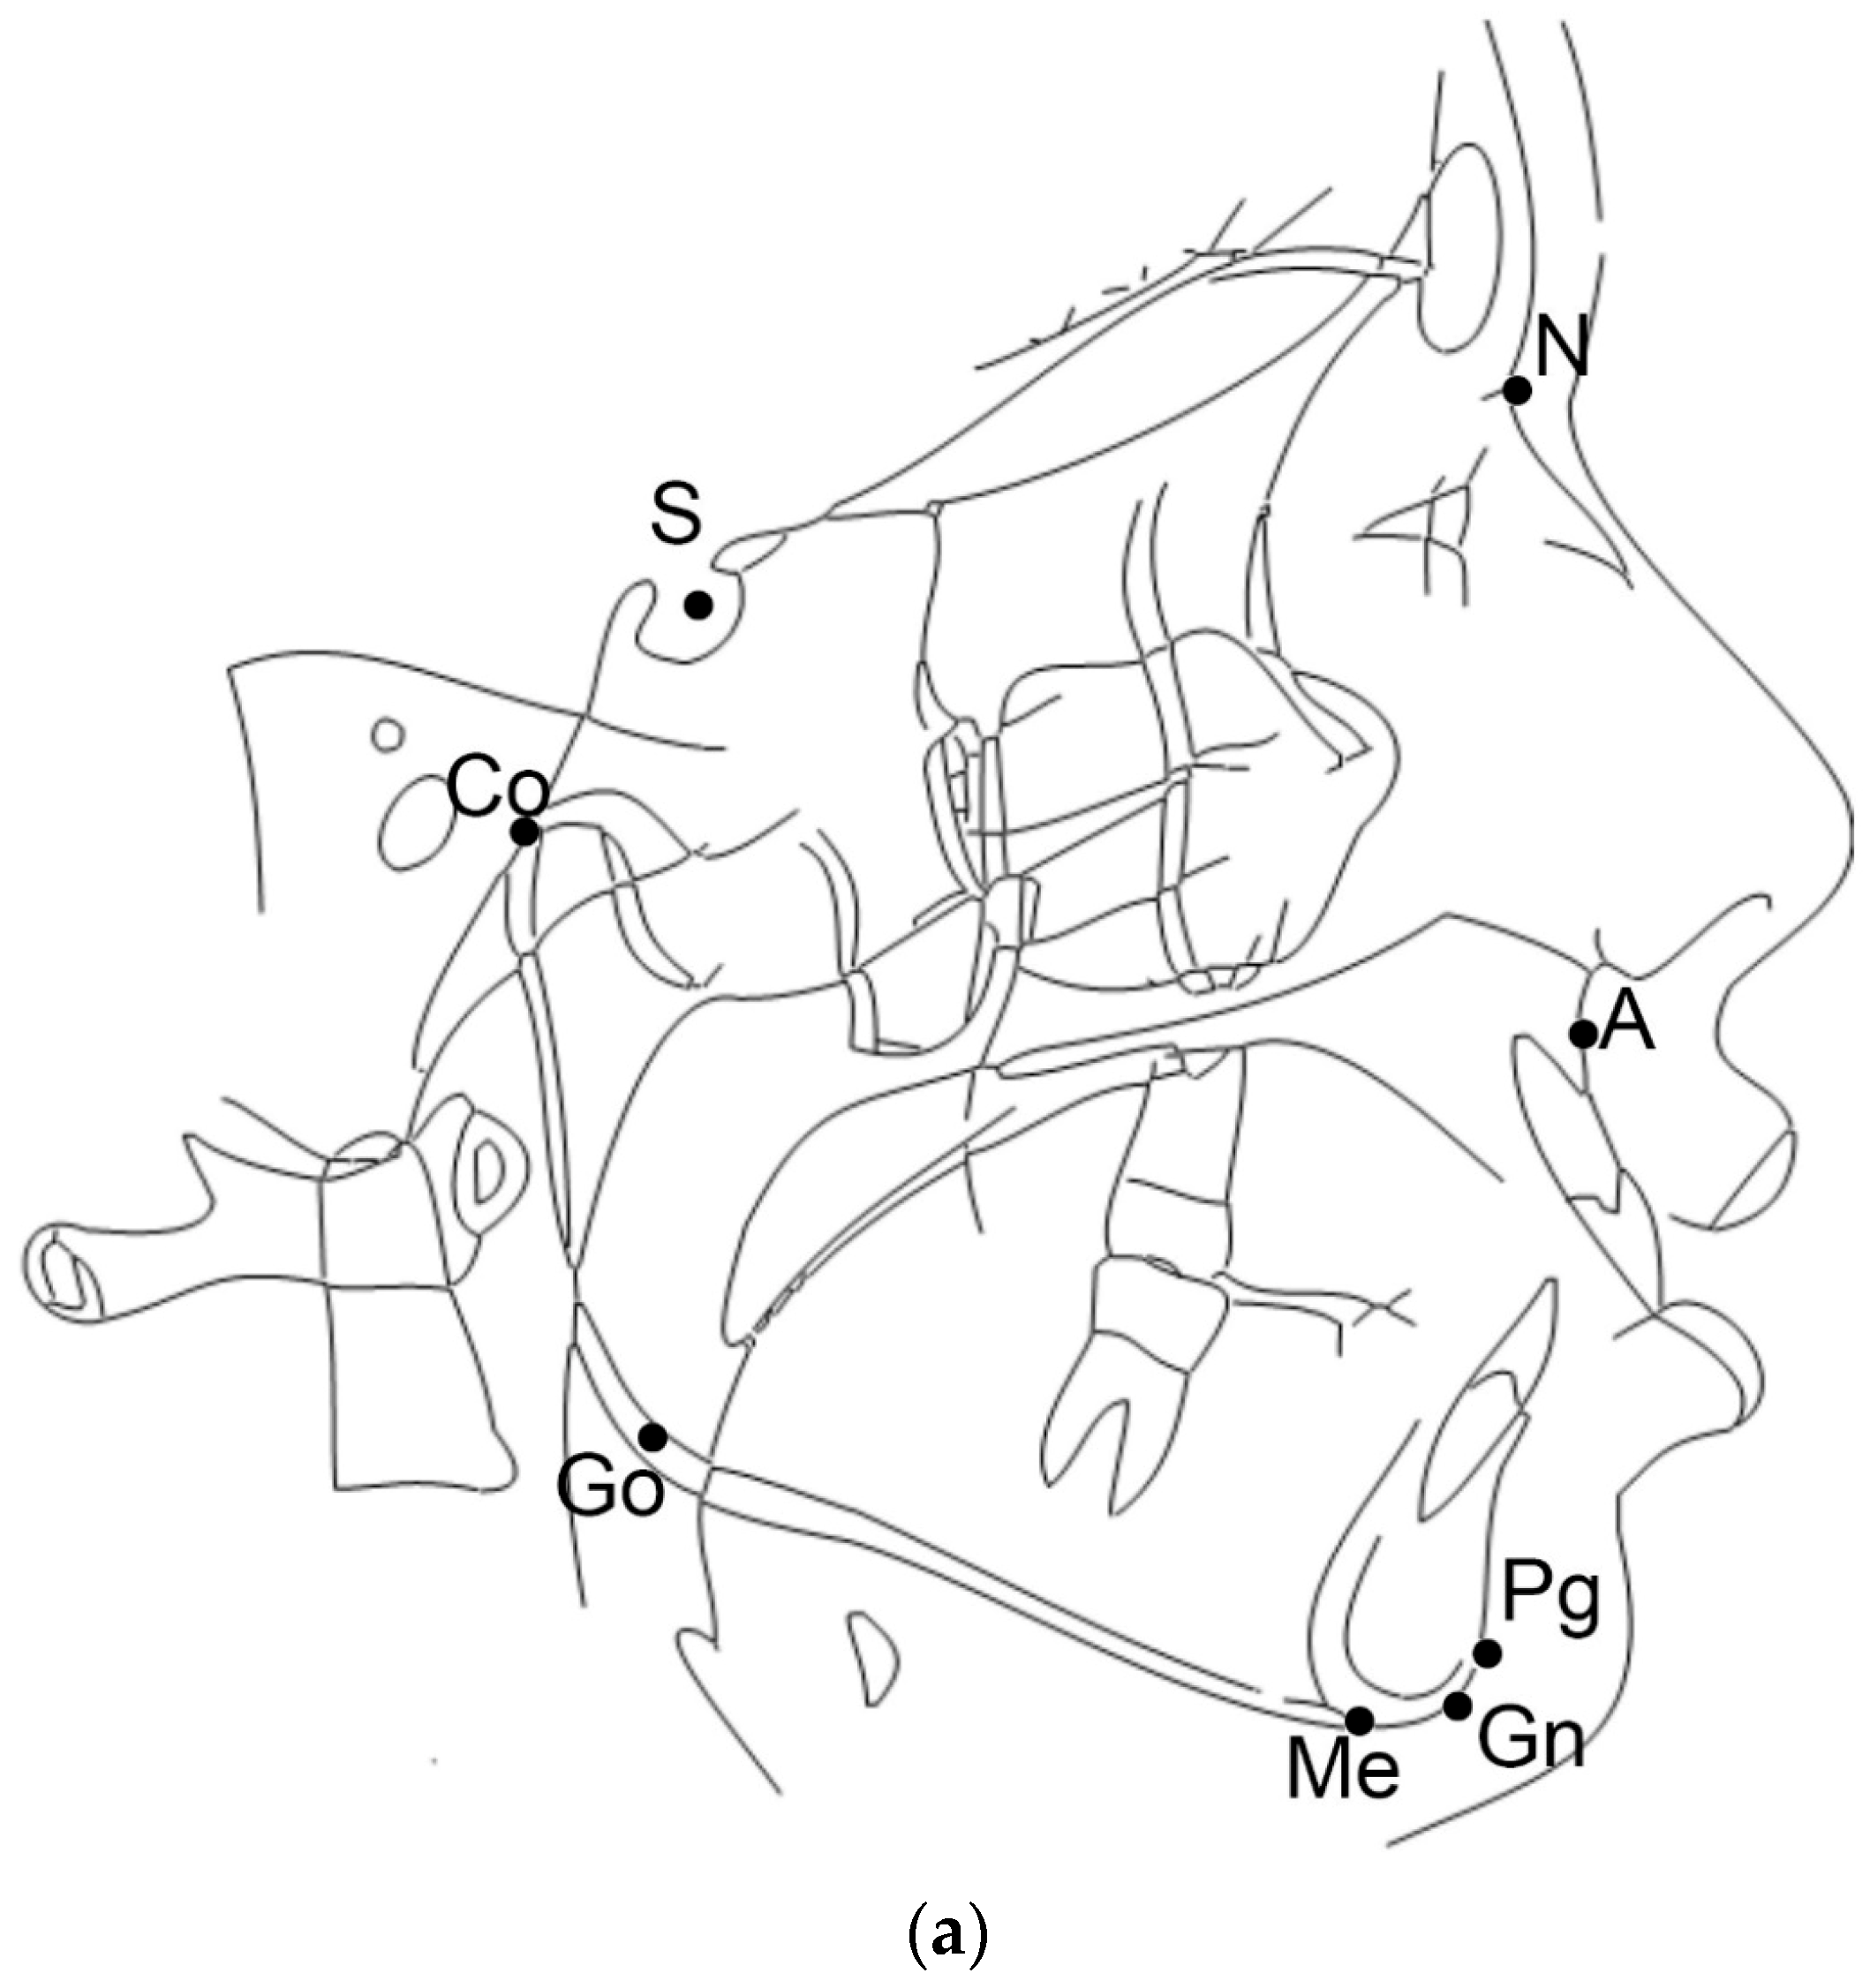
Finally, ANPg^ is an angle useful for the sagittal classification of the malocclusion, Class I, Class II, or Class III skeletal relationship, and it is formed by the NA (Nasion-point A line) line through N and A and the NPg (Nasion-Pogonion line) line through N and Pg.
Therefore, the aim of this study was to determine the distribution of the CoGoMe^ and its relationship with age, sagittal jaw relationship (ANPg^), and mandibular inclination (SN^GoGn) in a population of patients from Southern Italy. The null hypothesis was that there is no relationship between the CoGoMe^ and the SN^GoGn.
2. Materials and Methods
This research protocol was approved by the Ethics Committee of the University of Naples Federico II (121/19; 18 March 2019).
For this retrospective study, the lateral cephalograms of patients, treated at the Section of Orthodontics at the University of Naples Federico II, were screened. Due to the retrospective design of the study, it was not possible to obtain the informed consent from all the participants, however, before orthodontic treatment, all patients provided authorization to use their clinical records for research purposes.
The lateral cephalograms were selected based on the following inclusion criteria:
The following conditions were considered as exclusion criteria:
patients with systemic diseases
patients with genetic syndromes
previous orthodontic treatment
All the lateral radiographs were taken before the orthodontic treatment in natural head position [
17,
18]. One operator traced all lateral cephalograms with a cephalometric software program (Dolphin, Chatsworth, CA, USA).
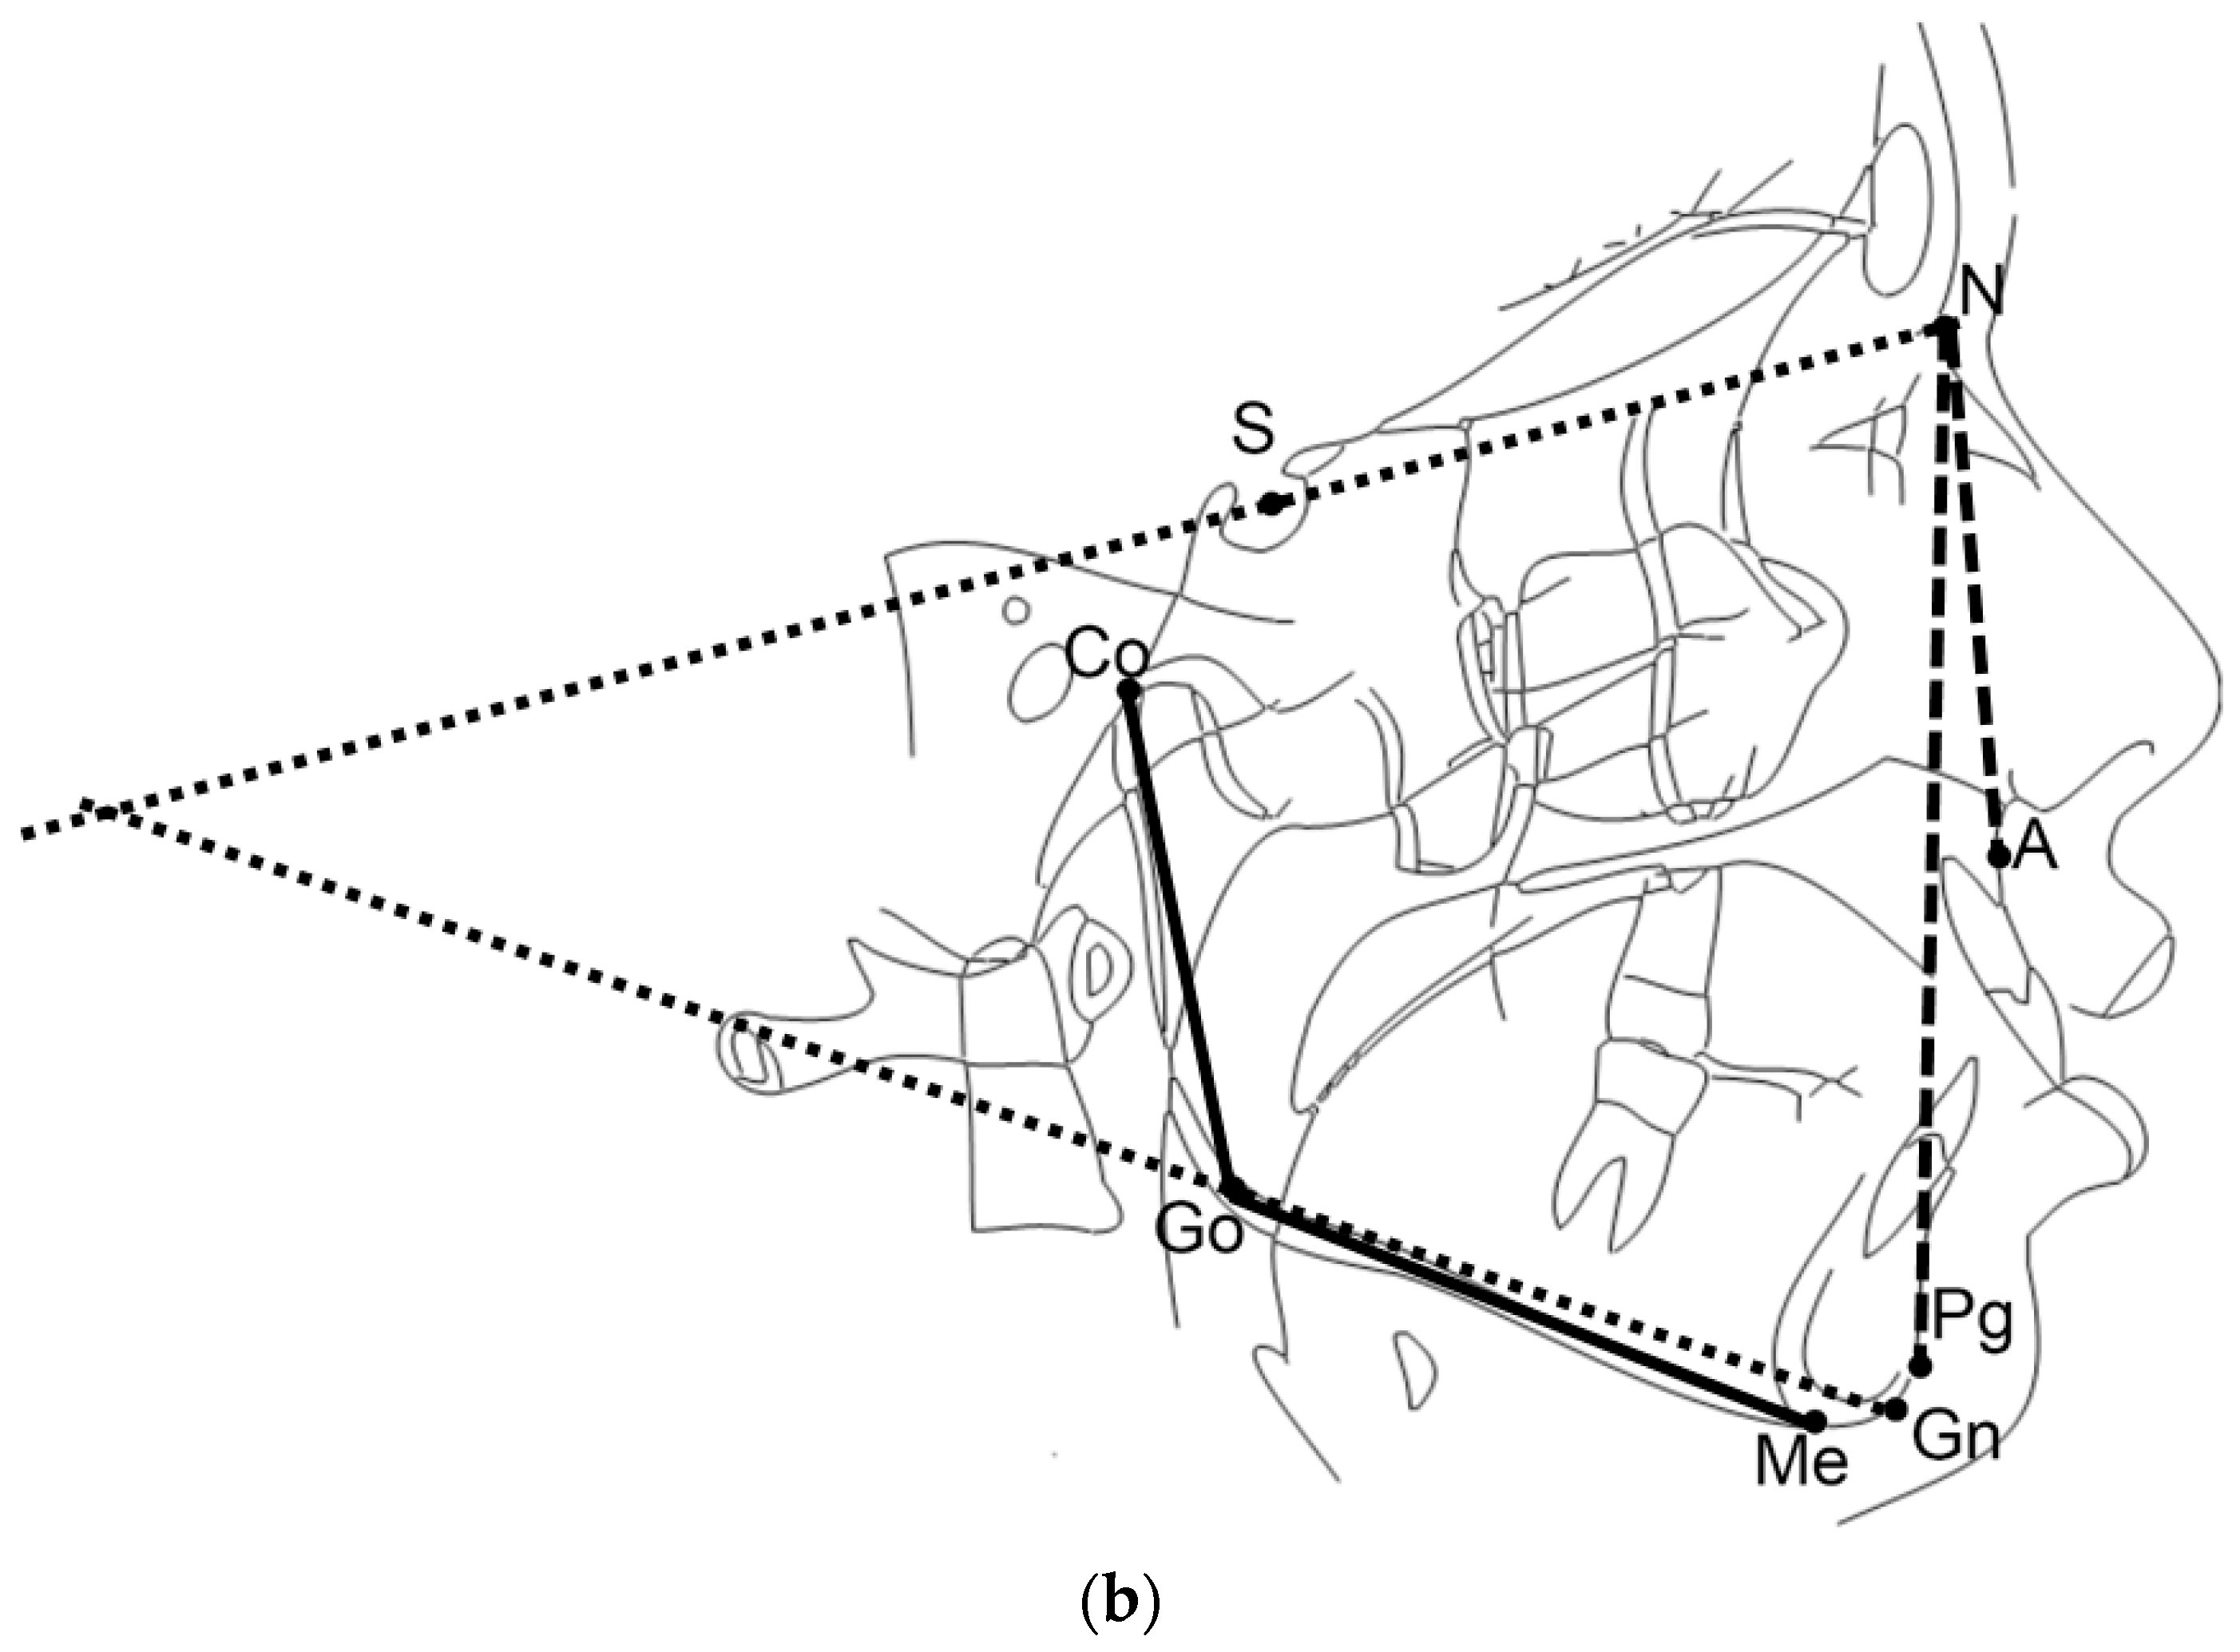
For this study, the cephalometric analysis was performed as shown in
Figure 1a,b. Briefly, three cephalometric variables were assessed: the CoGoMe^ measured the mandibular structure, which is the angle between the condylar axis (Condylion-Gonion) and the mandibular base (Gonion-Menton); the SN^GoGn determined jaw divergence, which is the angle between the anterior cranial base (Sella-Nasion) and the mandibular plane (Gonion-Gnathion); and the ANPg^ assessed sagittal jaw discrepancy, which is the angle between the Nasion-point A line and the Nasion-Pogonion line [
19].
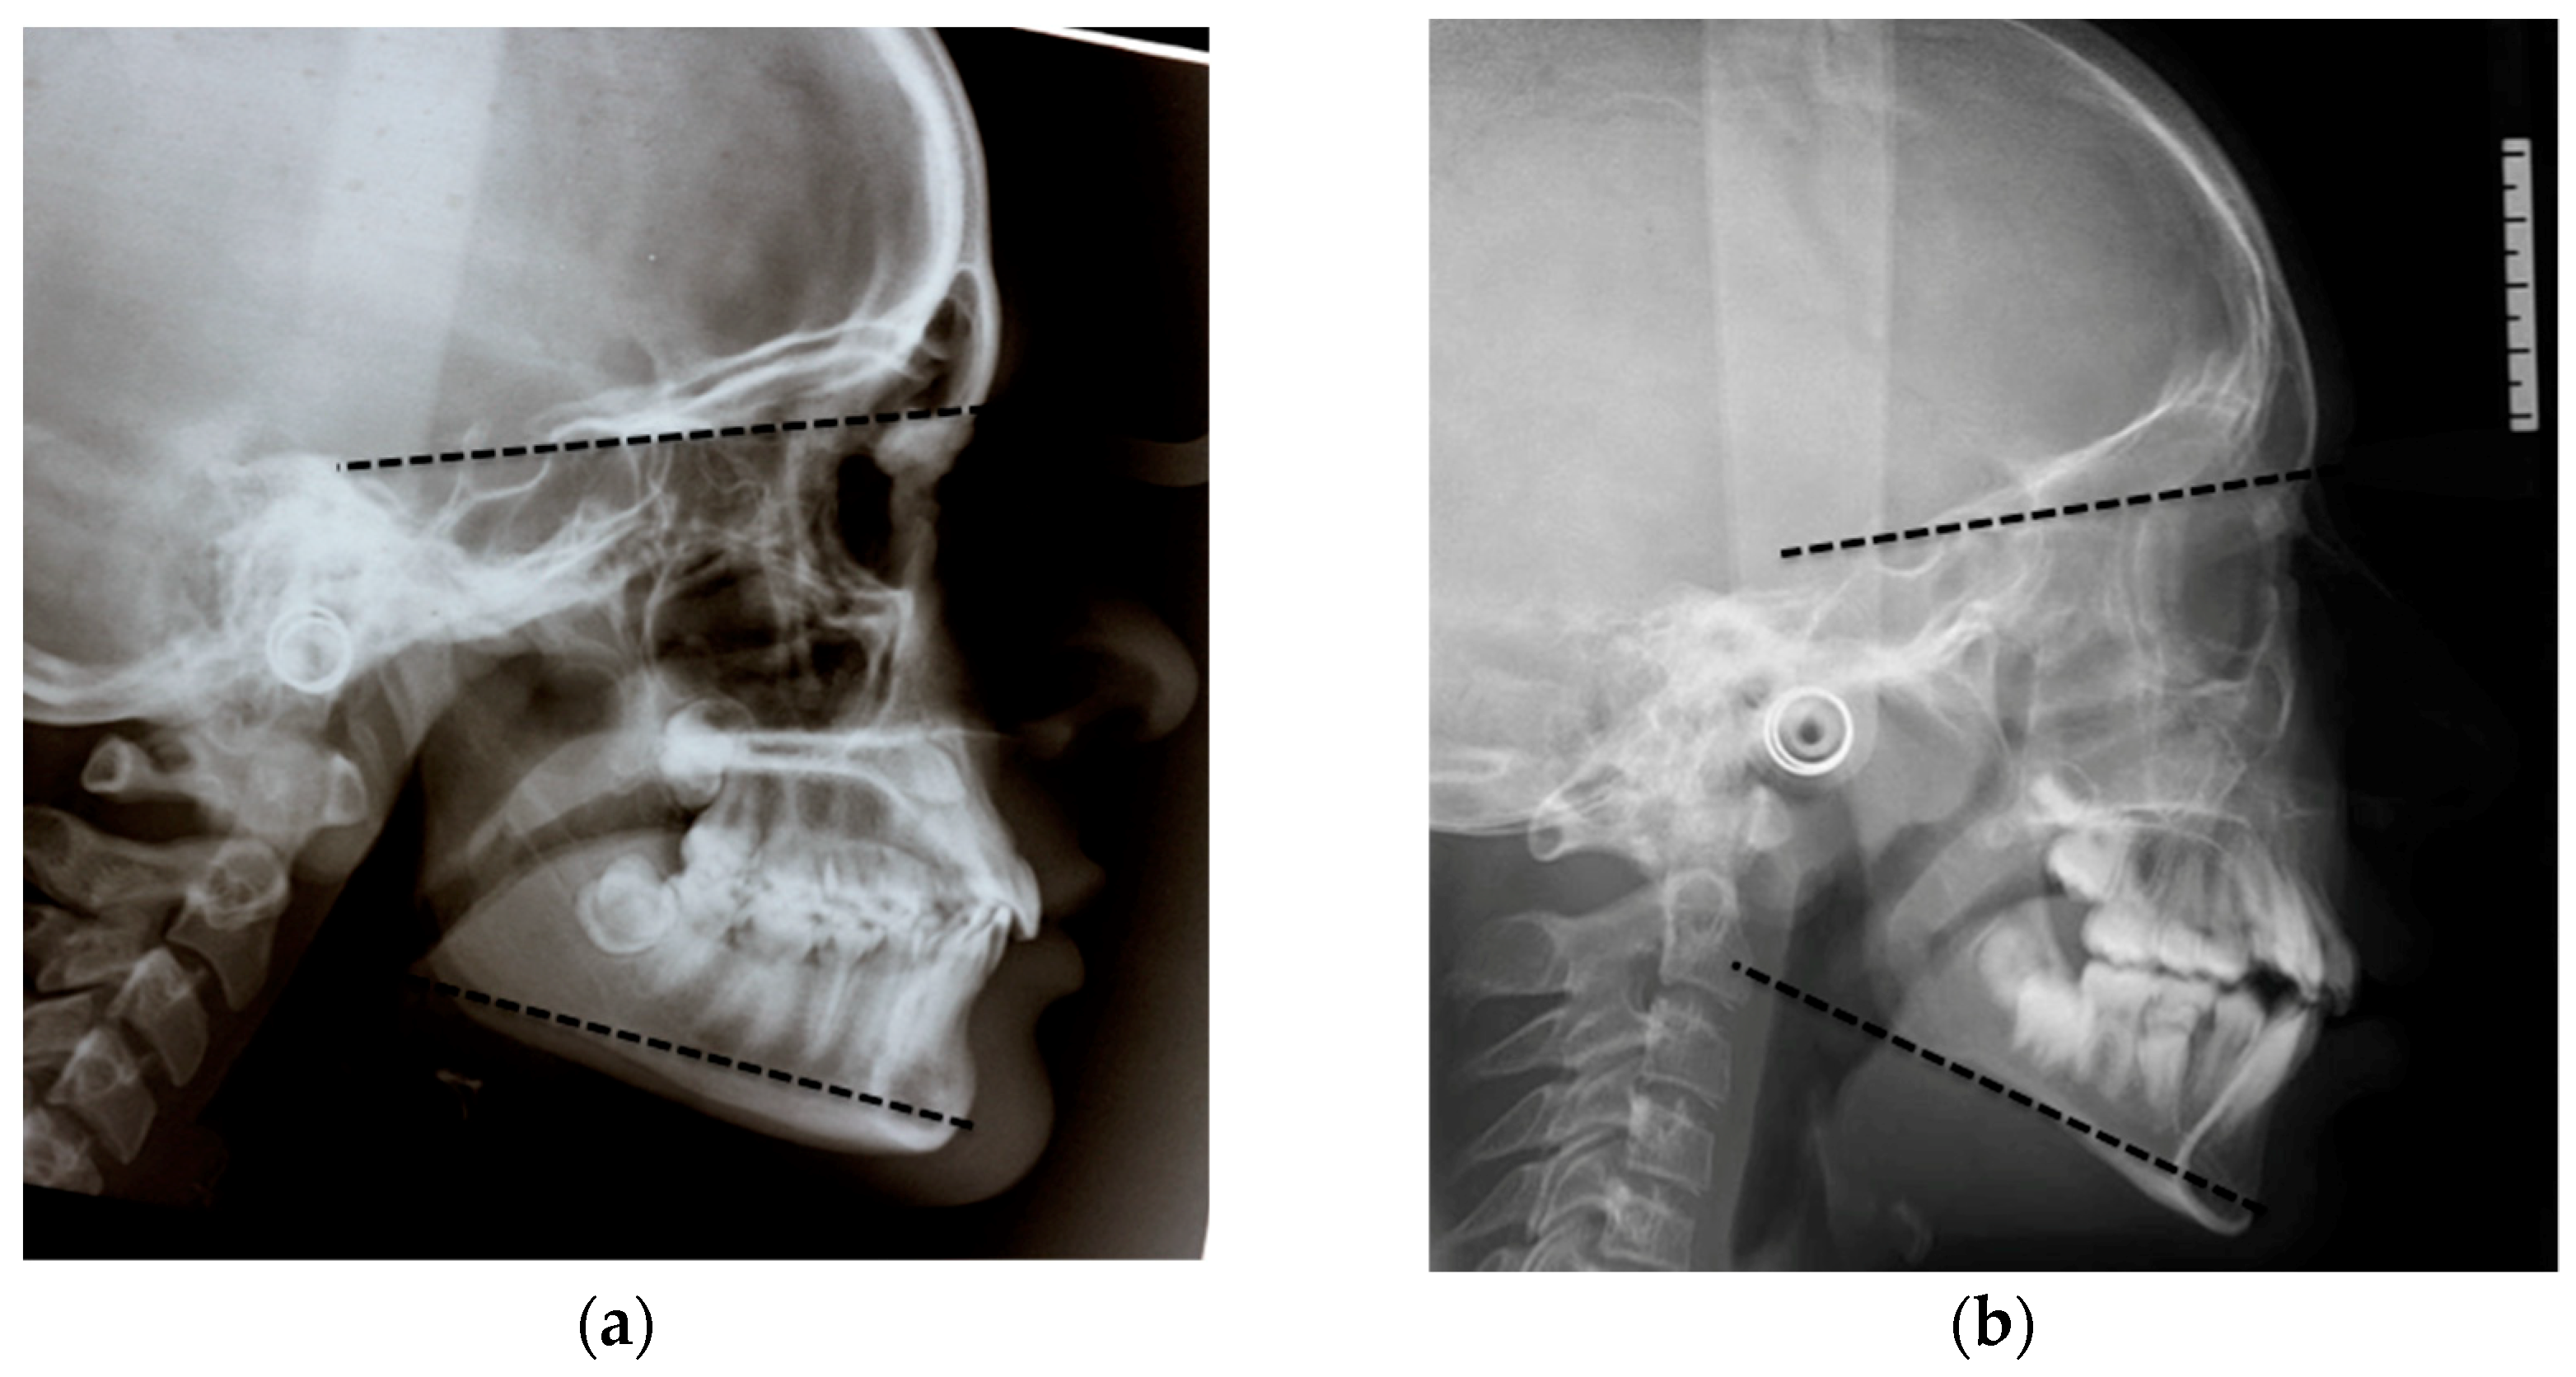
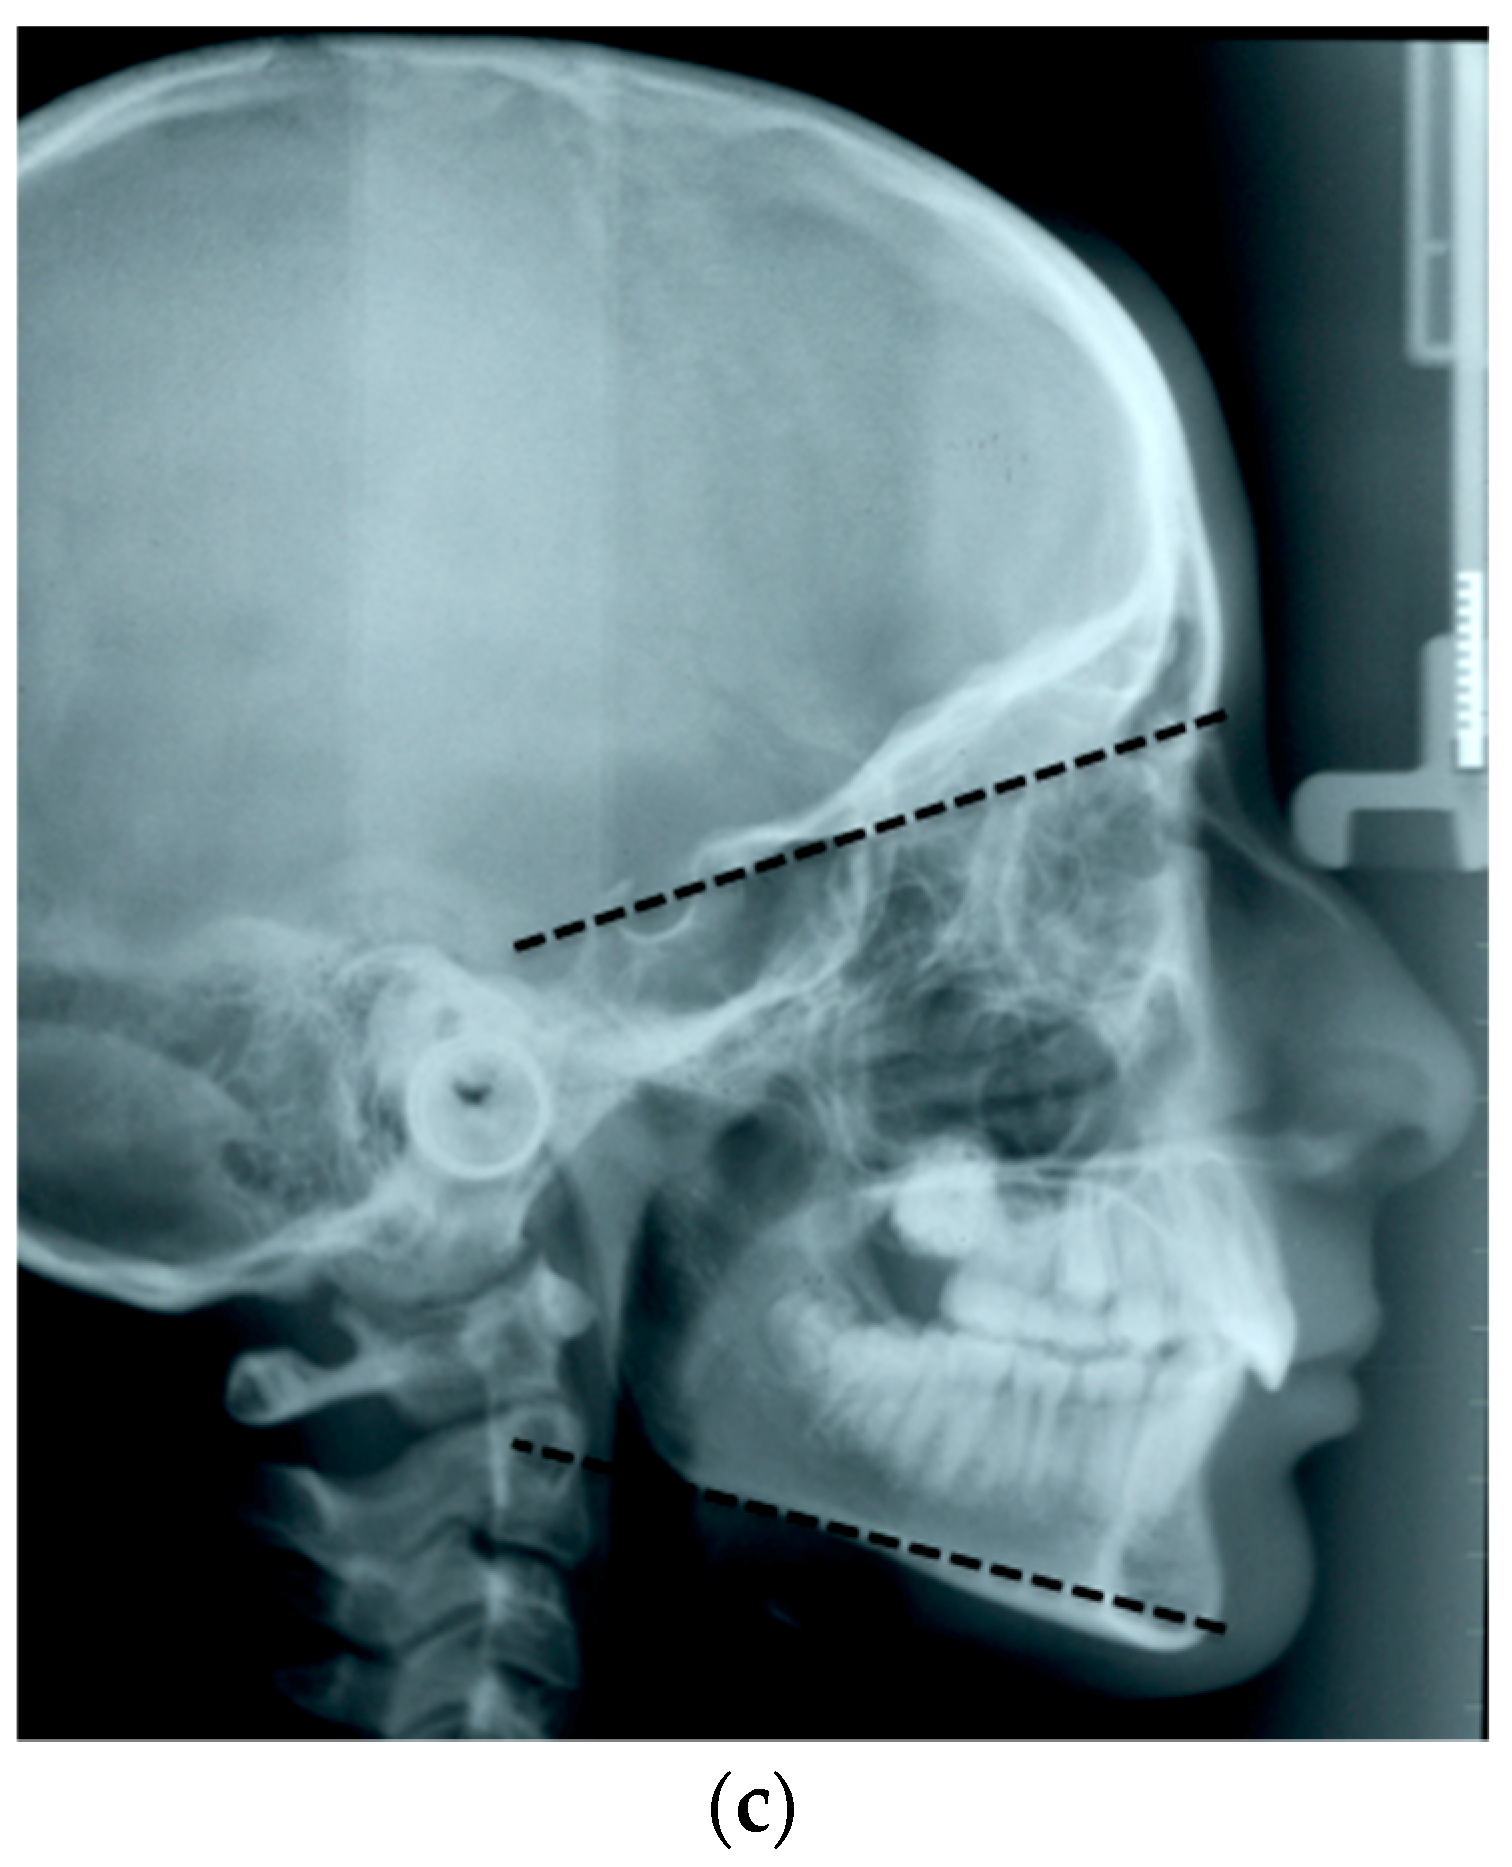
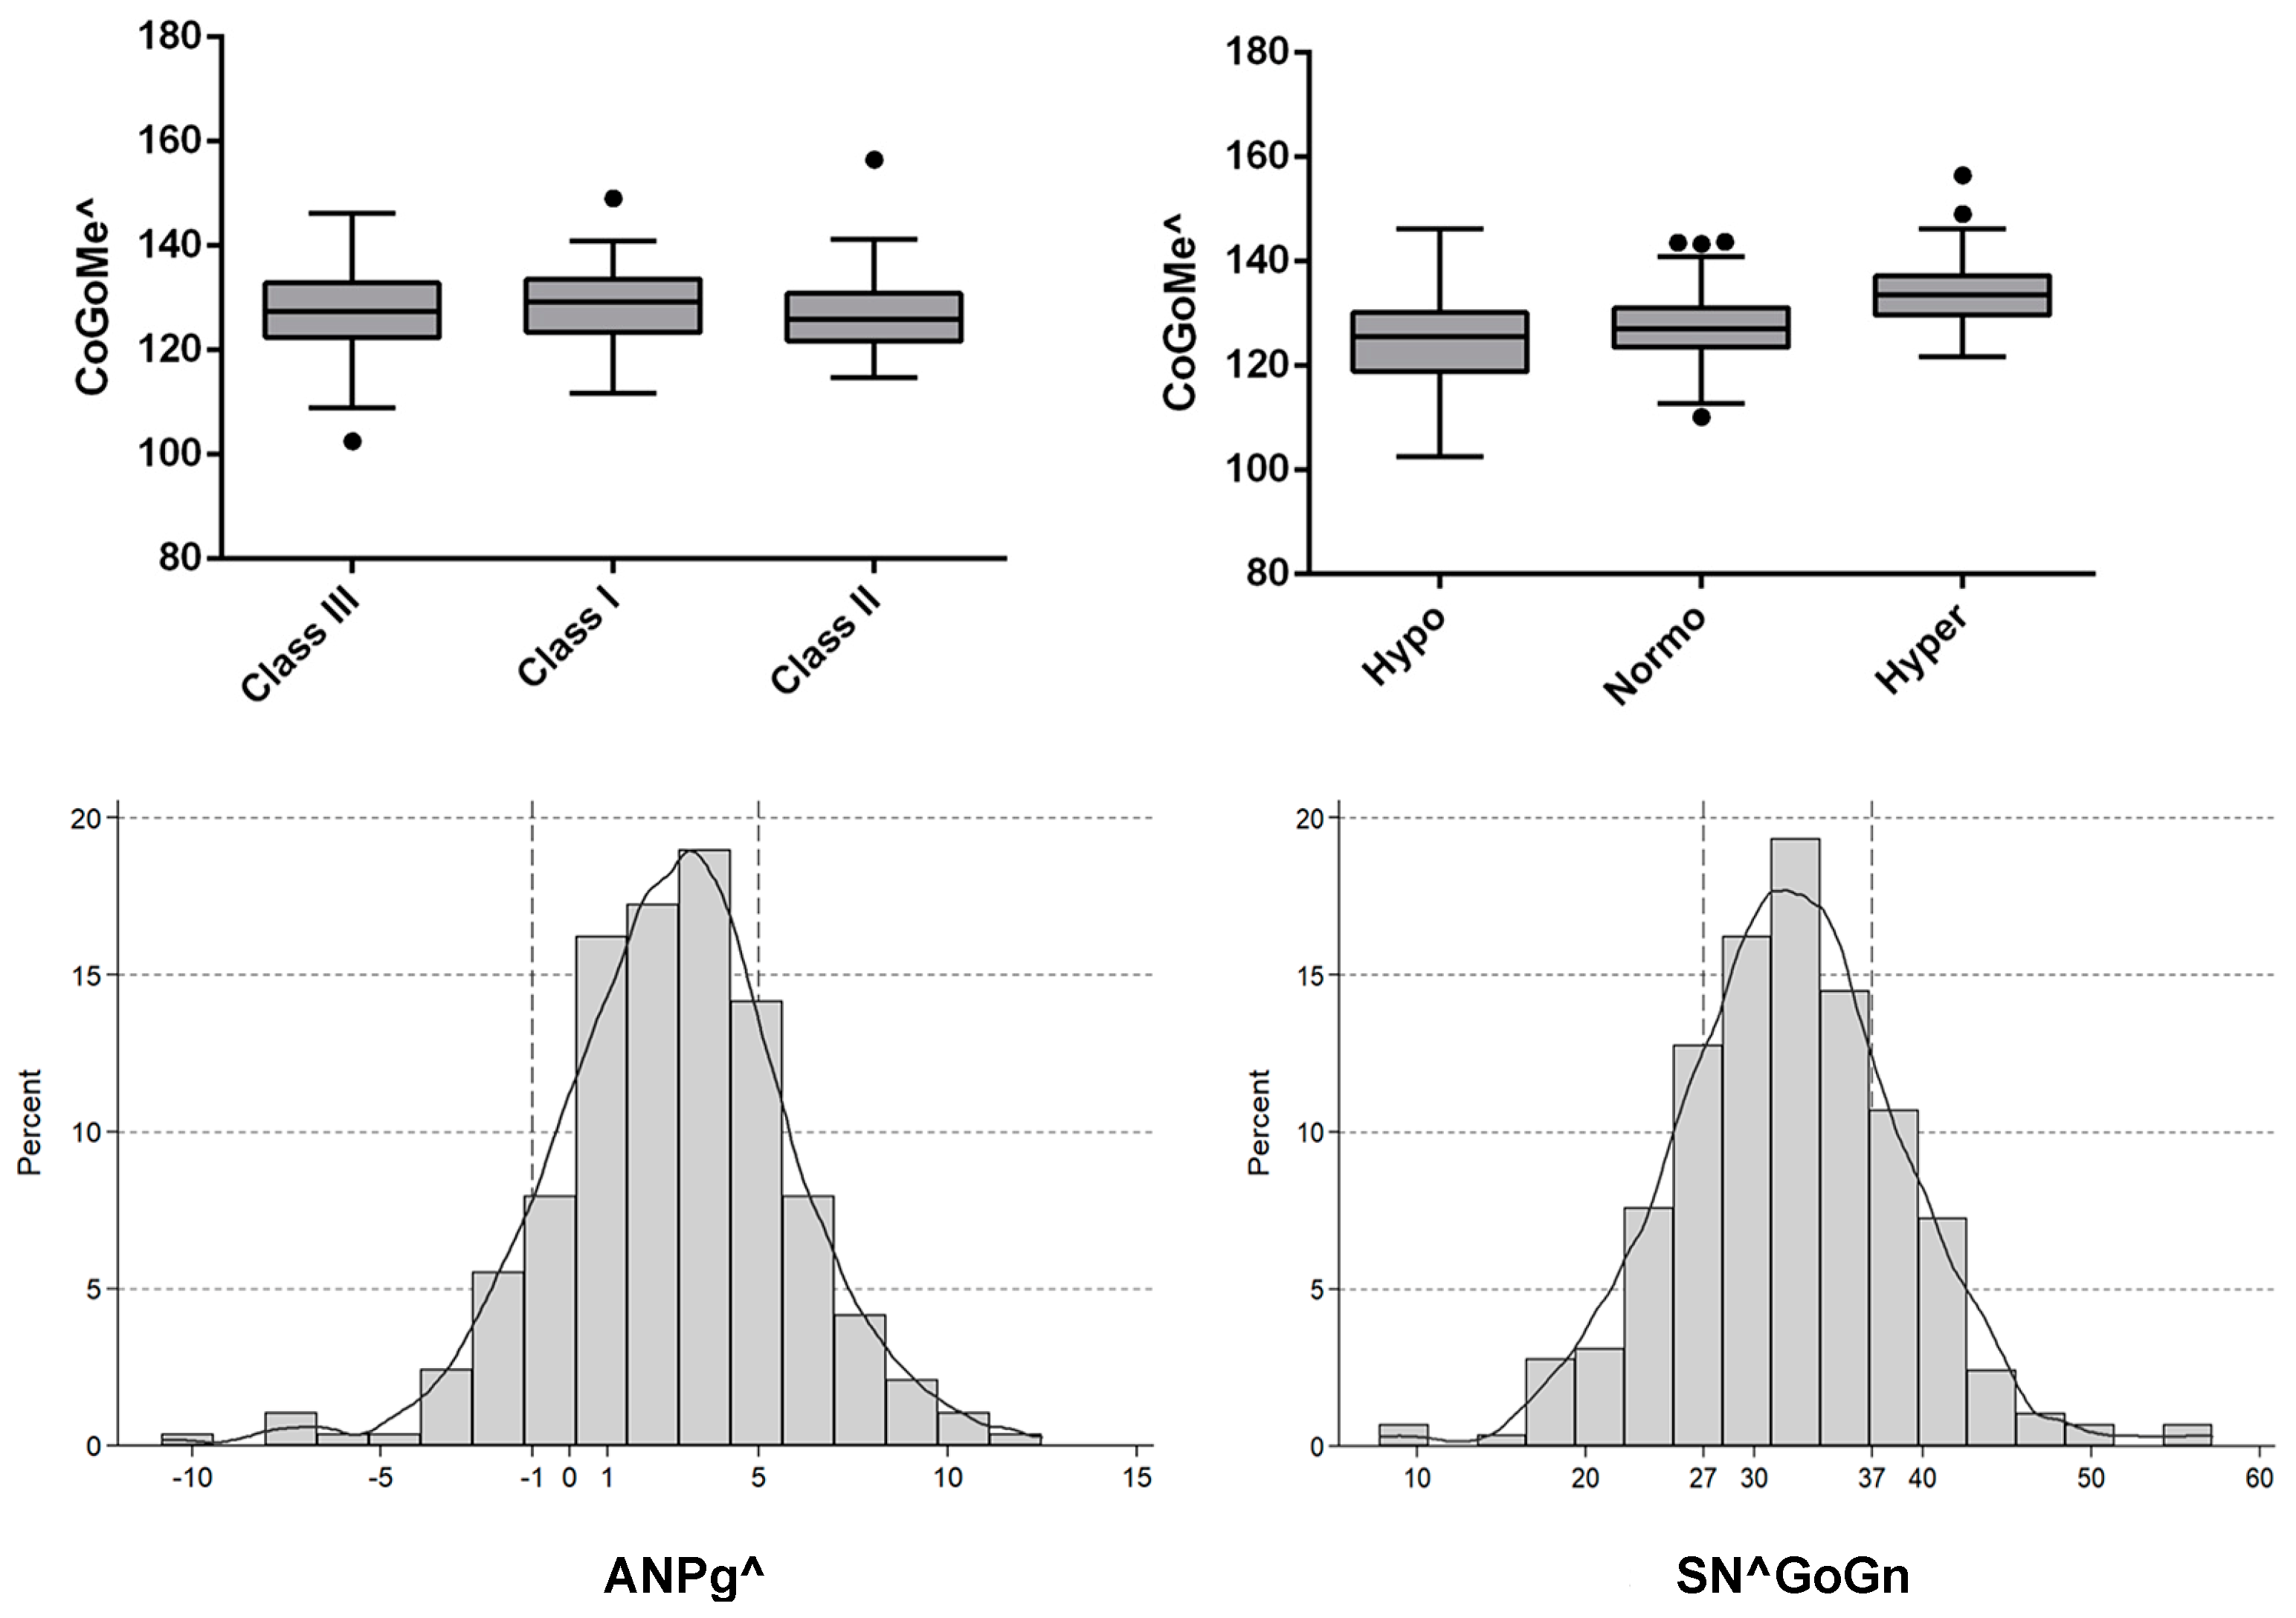
The sagittal malocclusion was classified into three groups according to the ANPg^: Class III with an ANPg^ equal to or less than −1°, Class I with an ANPg^ between −1° and 5°, and Class II with an ANPg^ equal to or greater than 5°. Similarly, the sample was divided into three groups according to their vertical malocclusion: hypodivergent with an SN^GoGn equal to or less than 27°, normodivergent with an SN^GoGn between 27° and 37°, and hyperdivergent with a SN^GoGn equal to or greater than 37°, as seen
Figure 2a–c.
Statistical Analysis
The Dahlberg’s formula [
20] and the paired Student’s t-test with the type I error set at 0.05 (P < 0.05) were used to assess the method of error. Hence, 101 randomly selected lateral cephalograms were reassessed by the same examiner after a memory washout period of at least 8 weeks.
Categorical variables were reported as frequencies and percentages, and continuous variables were reported as means and standard deviations if the data distribution was normal or as medians and interquartile range if the data showed a skewed distribution. The Shapiro–Wilk (SW) test was used to evaluate normality assumption.
The Pearson correlation analysis was used to assess the relationship between continuous variables, when requested.
Differences in the CoGoMe^ among individuals with different ANPg^ and SN^GoGn were estimated, as appropriate, by using one-way Analysis of Variance (ANOVA).
Linear regression analysis was performed to evaluate (1) how the CoGoMe^ (used as a dependent variable) changed according to age and (2) how the CoGoMe^ (used as an independent variable and adjusted for age) was able to predict the SN^GoGn. For the first issue, two models for linear regression analysis were performed. One model included growing patients younger than 17 years of age and the other included patients aged 17 years of age and older. Beta coefficients and 95% confidence intervals were calculated.
The level of statistical significance was set at P < 0.05. Statistical analysis was performed using STATA version 14.0 (StataCorp LP, Stata Statistical Software, College Station, TX, USA).
3. Results
The sample included 290 subjects: 122 males (42.1%) and 168 females (57.9%), aged 8 to 53 years (median 14; Interquartile range IQR 12–17).
The method error for the three angles assessed in the study was ANPg^ = 0.4°, SN^GoGn = 0.9°, and CoGoMe^ = 1.3°, and there were no systematic errors for any measurements (P > 0.05).
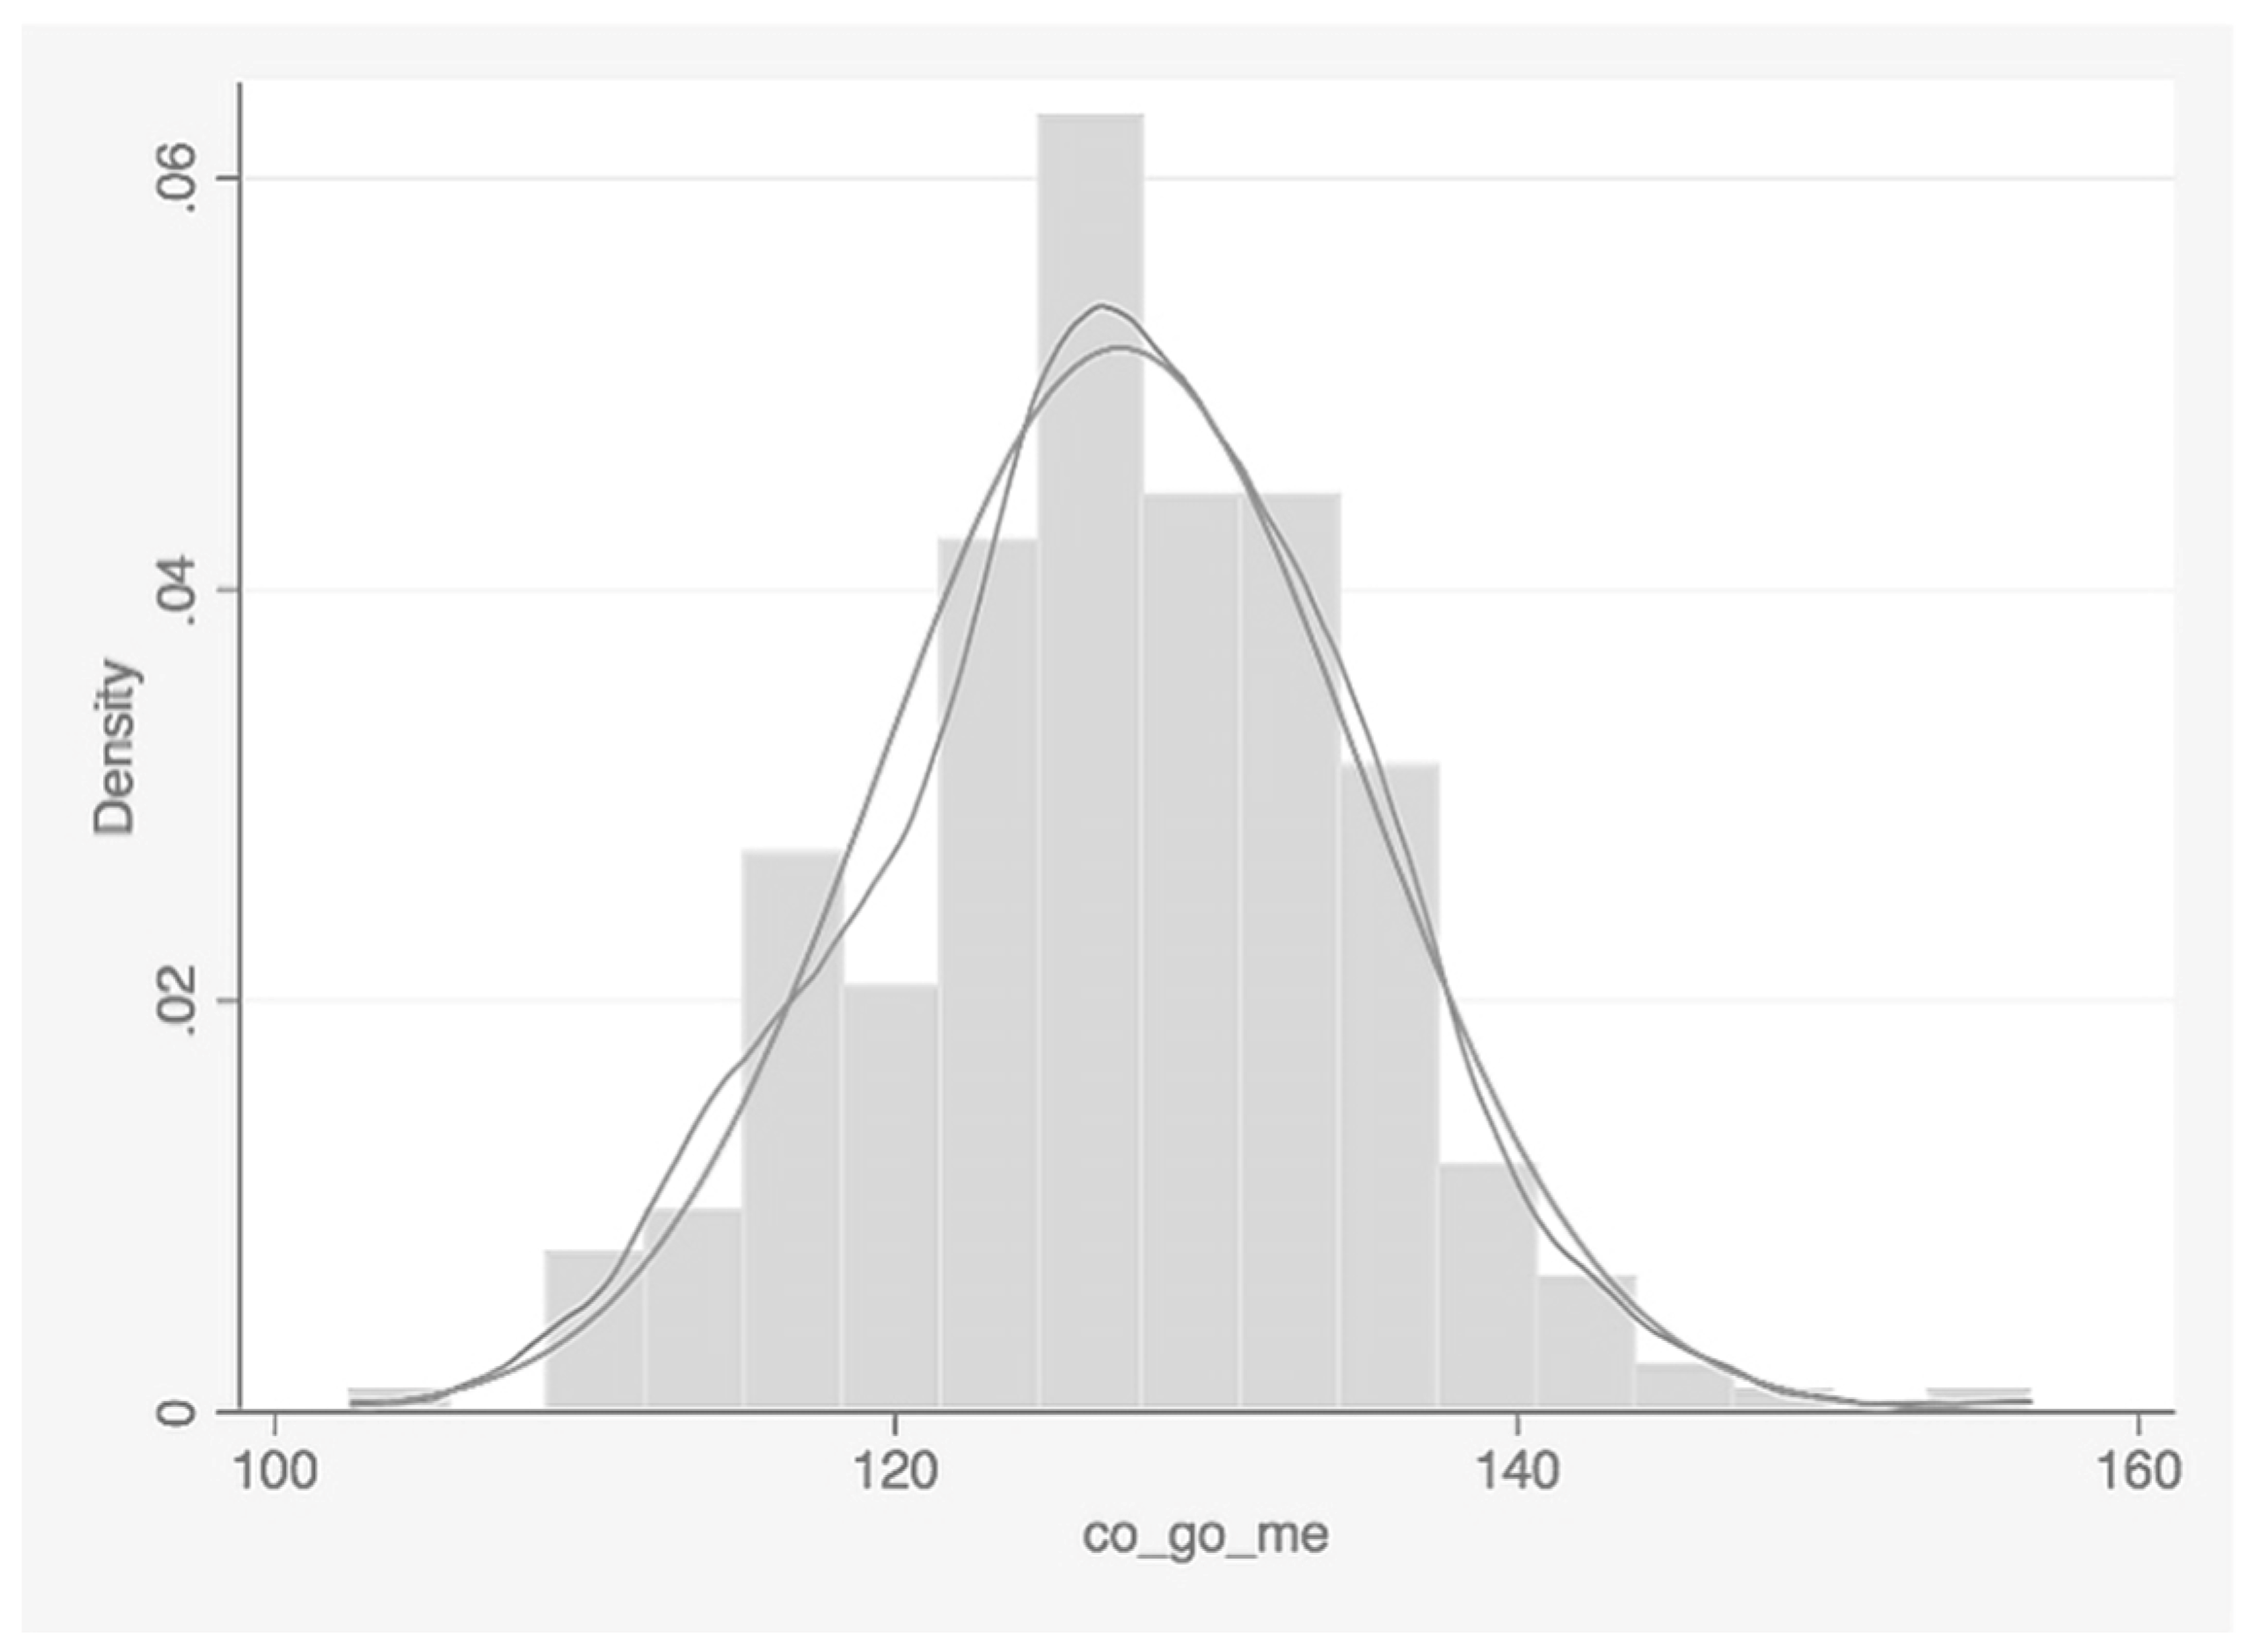
In the total sample of 290 patients, the CoGoMe^ was normally distributed (SW test, P = 0.290), with a mean value of 127.2° ± 7.7°, as seen in
Table 1 and
Figure 3. The ANPg^ and the SNGoGn^ presented a mean value of 2.6° ± 3.2° and 31.9° ± 6.8°, respectively (
Table 1).
After dividing the sample into three groups according to the ANPg^, the CoGoMe^ showed no statistically significant difference (P = 0.560). In particular, Class III (ANPg^ ≤−1°) included 32 patients and showed a mean CoGoMe^ of 128.59° ± 7.8°; Class I (−1°< ANPg^ <5°) included 196 patients and presented a mean CoGoMe^ of 127.09° ± 7.8°; and Class II (ANPg^ ≥5°) included 62 patients and showed a mean CoGoMe^ of 126.9° ± 7.2°, as seen in
Table 2.
When the sample was divided into three groups according to the SN^GoGn, a statistically significant difference in the CoGoMe^ was observed (P < 0.001). In particular, 60 patients were hypodivergent (SN^GoGn <27) and presented a mean CoGoMe^ of 120.1° ± 6.63°; 166 patients were normodivergent (27≤ SN^GoGn ≤37) and presented a mean CoGoMe^ of 127.1° ± 6.11°; and 64 patients were hyperdivergent (SN^GoGn >37) and presented a mean CoGoMe^ of 134.02° ± 6.18°, as shown in
Table 2 and
Figure 4.
The correlation between the CoGoMe^ and the SN^GoGn was moderate (Pearson’s r, r = 0.6, P < 0.0001). On the other hand, the correlation between the CoGoMe^ and the ANPg^ was absent (r = −0.02, P = 0.74), while a weak correlation was observed between the SN^GoGn and the ANPg^ (r = 0.21, P = 0.0003).
In the linear regression analysis performed on patients under 17 years of age (N = 210), a clear decrease of the CoGoMe^ during growth was observed (beta coefficient, B = −0.6; 95% CI: −1.05, −0.12; P = 0.014), as shown in
Table 3. However, in the liner regression performed on subjects older than 17 years of age (N = 80), this association disappeared and the angle remained stable over time (B = 0.004; 95% CI: −0.31, 0.32; P = 0.98), as seen in
Table 3.
Finally, the results of the regression model with the SN^GoGn as the dependent variable reported that each degree of increase in the CoGoMe^ resulted in an increase in the SN^GoGn by 0.6° (B = 0.6; 95% CI: 0.51, 0.67; P < 0.001,
Table 3).
4. Discussion
The aim of this study was to determine the distribution of the CoGoMe^ in a population of patients from Southern Italy and to assess the association of this mandibular angle with vertical and sagittal cephalometric parameters. The results showed that the CoGoMe^ was normally distributed in the studied population, and it was correlated to the vertical facial type (SN^GoGn). However, it was not influenced by the anteroposterior jaw relationship (ANPg^).
Our study is the first to report a strong association between the CoGoMe^ and the SN^GoGn, with these two angles positively correlated. Indeed, each degree of increase of the CoGoMe^ resulted in an increase of the SN^GoGn by 0.6°. Moreover, the mean value of the CoGoMe^ was statistically significantly different according to the identified subgroups of the SN^GoGn. Hence, the CoGoMe^ could help to identify mandibular growth patterns, and therefore clinicians are suggested to consider this variable carefully at the beginning of the orthodontic therapy. Indeed, CoGoMe^ might be useful to understand the mandibular rotational pattern, giving more accurate information than the SN^GoGn, that is influenced also by the inclination of the anterior cranial base [
15]. The CoGoMe^ is a variable related only to mandibular structure (condylar axis and mandibular base), hence its evaluation is not affected by any other external structures. This strong correlation between CoGoMe^ and SN^GoGn is related both to an anatomical consideration—both angles evaluate the mandibular base—and to functional consideration—usually hyperdivergent patients have a lower muscles thickness and a lower bite force—that might have less control on the vertical growth pattern [
21,
22].
In the current study, the CoGoMe^ decreased with growth up to 17 years of age. Björk and co-workers [
23,
24] studied mandibular rotation and distinguished 2 types of rotation, internal and external, by superficial remodelling. From the age of 4 years to adulthood, the internal rotation is about 15° forward, while the external rotation is about 11°/12° backward, producing a 3°/4° total decrease of the mandibular angle during growth [
23,
24]. Hence, the natural backward rotation of the mandible during growth might be responsible for the reduction of the CoGoMe^ observed in the current study. This study included patients equal to or older than 8 years old because it is the minimum age when a lateral cephalogram is usually indicated. The age of 17 years old was considered as an average age of growth end [
19,
25].
The clinical significance of this study is related to the importance of growth predictors for the orthodontic diagnosis and treatment planning, with possible implications on the success rate and the duration of the orthodontic treatment for each specific malocclusion [
26]. During orthodontic diagnosis and treatment planning, the possibility to correctly identify the mandibular rotational pattern during growth is a fundamental factor [
16]. It is well recognised that patients with a hyperdivergent mandibular growth pattern are more difficult cases [
9,
10,
17]. Not only the cephalometric analysis but also anatomical characteristics were used to identify the mandibular rotational patter. Already in the early 1970s, Björk and Skieller underlined the possibility of predicting the mandibular growth pattern by looking at some specific anatomic mandibular structures in longitudinal lateral cephalograms with the purpose of identifying facial morphology and the progression of mandibular rotation [
23,
24,
25]. They introduced seven mandibular morphological signs that identified hyperdivergent and hypodivergent mandibular patterns [
23]. Although, the CoGoMe^ is a cephalometric angle, it is strongly related to the mandibular anatomy and, due to its correlation with the SN^GoGn, it might improve the accuracy of the cephalometric diagnosis.
Class II malocclusion is one of the most prevalent orthodontic problems in the Caucasian population [
27,
28,
29]. It might cause detrimental aesthetic effects and social impairment in children’s daily lives as it affects their oral-health-related quality of life, and it is a risk factor for dental traumas [
30]. In growing subjects, one treatment option to correct skeletal Class II malocclusions uses functional/orthopaedic appliances, [
31] but, still, great variability in the achievable mandibular advancement has been observed across the literature due to numerous factors. One factor that might be responsible for different growth potentials is mandibular morphology. Petrovic pointed out that the individual mandibular growth potential and the responsiveness to the functional orthopaedic treatment were strongly influenced by the mandibular growth pattern [
10,
11]. The CoGoMe^ was proposed as a pre-treatment indicator of lower jaw responsiveness in Class II patients treated with functional appliances at the mandibular growth spurt [
16]. The cut-off degree of the CoGoMe^ greater or less than 125.5° was found by Franchi and Baccetti in their work of 2006 [
16]. These authors suggested that the CoGoMe^ could be used for an efficient discrimination between good (CoGoMe^ <125.5°) and bad (CoGoMe^ >125.5°) responders to functional treatment of skeletal Class II malocclusion due to mandibular retrusion. This is the first study that evaluated the distribution and the associations of the CoGoMe^ with the SN^GoGn and the ANPg^ in a large population from Southern Italy, providing cephalometric norms for Caucasian patients.
The limitation of this study was that, due to ethical issues, it was not possible to collect an untreated longitudinal sample.
5. Conclusions
In conclusion, this study showed the following:
In the studied sample, the CoGoMe^ presented a mean value of 127.2° ± 7.7°.
Skeletal sagittal jaw discrepancies did not influence the CoGoMe^.
From 8 to 17 years of age, the CoGoMe^ decreased 0.6° per year.
For each degree of increase of the CoGoMe^, the SN^GoGn increased by 0.6°.
The CoGoMe^ can be considered a useful cephalometric parameter for the diagnosis of the vertical facial growth pattern.
Author Contributions
Conceptualization, V.D., R.R., and R.V.; Methodology, A.C.P.M., R.R., V.S., L.F., and V.D.; Validation, A.C.P.M., R.B., V.D., and R.V.; Formal analysis, A.C.P.M., R.R., V.S., and V.D.; Investigation, A.C.P.M., and R.R.; Resources, V.D. and R.V.; Data Curation, A.C.P.M., R.B., and V.S.; Writing—Original draft preparation, A.C.P.M., R.R., and V.D.; Writing—Review & Editing, R.B., V.S., L.F., and R.V.; Visualization, A.C.P.M., R.B., and R.R.; Supervision, L.F., V.D., and R.V.; Project Administration, A.C.P.M., V.D., and R.R.
Funding
This research received no external funding.
Acknowledgments
The authors thank Giovanni Monti for his contribution in this research.
Conflicts of Interest
The authors declare no conflict of interest.
References
- Bae, E.J.; Kwon, H.J.; Kwon, O.W. Changes in longitudinal craniofacial growth in subjects with normal occlusions using the Ricketts analysis. Korean J. Orthod. 2014, 44, 77–87. [Google Scholar] [CrossRef] [PubMed] [Green Version]
- Sadowsky, P.L. Craniofacial growth and the timing of treatment. Am. J. Orthod. Dentofac. Orthop. 1998, 113, 19–23. [Google Scholar] [CrossRef]
- Rongo, R.; D’Antò, V.; Bucci, R.; Polito, I.; Martina, R.; Michelotti, A. Skeletal and dental effects of Class III orthopaedic treatment: A systematic review and meta-analysis. J. Oral Rehabil. 2017, 44, 545–562. [Google Scholar] [CrossRef] [PubMed]
- Rongo, R.; Valleta, R.; Bucci, R.; Bonetti, G.A.; Michelotti, A.; D’Antò, V. Does clinical experience affect the reproducibility of cervical vertebrae maturation method? Angle Orthod. 2015, 85, 841–847. [Google Scholar] [CrossRef] [PubMed] [Green Version]
- Broadbent, B.H. A new x-ray tecnique and its application to orthodontia. Angle Orthod. 1931, 1, 45–66. [Google Scholar]
- Athanasiou, A. Orthodontic Cephalometry; Mosby-wolf: London, UK, 1997. [Google Scholar]
- Koski, K. The norm concept in dental orthopedics. Angle Orthod. 1955, 25, 113–117. [Google Scholar]
- Obloj, B.; Fudalej, P.; Dudkiewicz, Z. Cephalometric standards for polish 10-year-olds with normal occlusion. Angle Orthod. 2008, 78, 262–269. [Google Scholar] [CrossRef]
- Fleming, P.S.; Qureshi, U.; Pandis, N.; Dibiase, A.; Lee, R.T. An investigation of cephalometric and morphological predictors of successful twin block therapy. Aust. Orthod. J. 2012, 28, 190–196. [Google Scholar]
- Petrovic, A.G.; Stutzmann, J. The concept of mandibular tissue-level growth potential and the responsiveness to a functional appliance. In Orthodontics: States of Art, Essence of the Science; Graber, W.L., Ed.; Mo:CV Mosby Co.: St. Louis, MO, USA, 1986. [Google Scholar]
- Petrovic, A.; Stutzmann, J.; Lavergne, J. Mechanism of craniofacial groowth and modus operandi of functional appliances: A cell.level and cybernetic approach to orthodontic decision making. In Craniofacial Growththeoryand Orthodontic Treatment; Carlson, D.S., Ed.; Center for Humang: Ann Arbor, MI, USA, 1990. [Google Scholar]
- Petrovic, A.G. A cybernetic approach to craniofacial growth control mechanisms. Nov. Acta Leopold. 1986, 58, 27–67. [Google Scholar]
- Ricketts, R.M. Cephalometric analysis and synthesis. Angle Orthod. 1961, 31, 141–156. [Google Scholar]
- Jarabak, J.R. Animal cephalometry. Angle Orthod. 1942, 12, 87–93. [Google Scholar]
- DeVincenzo, J.P. Changes in mandibular length before, during, and after successful orthopedic correction of Class II malocclusions, using a functional appliance. Am. J. Orthod. Dentofac. Orthop. 1991, 99, 241–257. [Google Scholar] [CrossRef]
- Franchi, L.; Baccetti, T. Prediction of Individual Mandibular Changes Induced by Functional Jaw Orthopedics Followed by Fixed Appliances in Class II Patients. Angle Orthod. 2006, 76, 950–954. [Google Scholar] [CrossRef] [PubMed]
- Solow, B.; Tallgren, A. Natural head position in standing subjects. Acta Odontol. Scand. 1971, 29, 591–607. [Google Scholar] [CrossRef] [PubMed]
- Siersbæk-Nielsen, S.; Solow, B. Intra-and interexaminer variability in head posture recorded by dental auxiliaries. Am. J. Orthod. 1982, 82, 50–57. [Google Scholar] [CrossRef]
- Riolo, W.; Moyers, R.; McNamara, J.A.; Hunter, W. An Atlas of Craniofacial Growth: Cephalometric Standards from University School Growth Study; The University of Michigan, Center for Human Growth and Development: Ann Arbor, MI, USA, 1974. [Google Scholar]
- Dahlberg, G. Statistical methods for medical and biological students. In Statistical Methods for Medical and Biological Students; George Alien and Unwin, Ltd.: London, UK, 1940. [Google Scholar]
- Raadsheer, M.C.; Kiliaridis, S.; Van Eijden, T.M.; Van Ginkel, F.C.; Prahl-Andersen, B. Masseter muscle thickness in growing individuals and its relation to facial morphology. Arch. Oral Biol. 1996, 41, 323–332. [Google Scholar] [CrossRef]
- Raadsheer, M.C.; van Eijden, T.M.; van Ginkel, F.C.; Prahl-Andersen, B. Contribution of jaw muscle size and craniofacial morphology to human bite force magnitude. J. Dent. Res. 1999, 78, 31–42. [Google Scholar] [CrossRef]
- Bjork, A.; Skieller, V. Facial development and tooth eruption. An implant study at the age of puberty. Am. J. Orthod. 1972, 62, 339–383. [Google Scholar] [CrossRef]
- Bjork, A. Facial growth rotation-reflections on definition and cause. Proc. Finn. Dent. Soc. 1991, 87, 51–58. [Google Scholar]
- Bjork, A.; Skieller, V. Normal and abnormal growth of the mandible. A synthesis of longitudinal cephalometric implant studies over a period of 25 years *. Eur. J. Orthod. 1983, 5, 1–46. [Google Scholar] [CrossRef]
- Popowich, K.; Nebbe, B.; Heo, G.; Glover, K.E.; Major, P.W. Predictors for Class II treatment duration. Am. J. Orthod. Dentofac. Orthop. 2005, 127, 293–300. [Google Scholar] [CrossRef] [PubMed]
- Paduano, S.; Bucci, R.; Rongo, R.; Silva, R.; Michelotti, A. Prevalence of temporomandibular disorders and oral parafunctions in adolescents from public schools in Southern Italy. CRANIO 2018, 1–6. [Google Scholar] [CrossRef] [PubMed]
- Paduano, S.; Rongo, R.; Bucci, R.; Aiello, D.; Carvelli, G.; Ingenito, A.; Cantile, T.; Ferrazzano, G.F. Is there an association between various aspects of oral health in Southern Italy children? An epidemiological study assessing dental decays, periodontal status, malocclusions and temporomandibular joint function. Eur. J. Paediatr. Dent. 2018, 19, 176–180. [Google Scholar] [PubMed]
- Perrotta, S.; Bucci, R.; Simeon, V.; Martina, S.; Michelotti, A.; Valletta, R. Prevalence of malocclusion, oral parafunctions and temporomandibular disorder-pain in Italian schoolchildren: An epidemiological study. J. Oral Rehabil. 2019, 46, 611–616. [Google Scholar] [CrossRef]
- Cunningham, S.J.; Hunt, N.P. Quality of life and its importance in orthodontics. J. Orthod. 2001, 28, 152–158. [Google Scholar] [CrossRef] [PubMed]
- D’Anto, V.; Bucci, R.; Franchi, L.; Rongo, R.; Michelotti, A.; Martina, R. Class II functional orthopaedic treatment: A systematic review of systematic reviews. J. Oral Rehabil. 2015, 42, 624–642. [Google Scholar] [CrossRef] [PubMed]
© 2019 by the authors. Licensee MDPI, Basel, Switzerland. This article is an open access article distributed under the terms and conditions of the Creative Commons Attribution (CC BY) license (http://creativecommons.org/licenses/by/4.0/).

 ,
, 
 SN^GoGn,
  CoGoMe^,
  ANPg^.


