Article

Enrichment Free qPCR for Rapid Identification and Quantification of Campylobacter jejuni, C. coli, C. lari, and C. upsaliensis in Chicken Meat Samples by a New Couple of Primers

1
Dipartimento di Scienze AgroAlimentari, Ambientali e Animali, Università di Udine, 33100 Udine, Italy
2
AgroParisTech, INRAE, Micalis Institute, Université Paris-Saclay, 78350 Jouy en Josas, France
*
Author to whom correspondence should be addressed.
Submission received: 6 September 2021 / Revised: 20 September 2021 / Accepted: 28 September 2021 / Published: 30 September 2021

Abstract

:
Campylobacter is the main cause of bacterial foodborne disease and poultry meat is the principal source of human infections. Rapid methods for Campylobacter detection are urgently needed to decrease high bacterial prevalence in poultry products. In this study, we developed new primers, CampyPFw and CampyPRv, that target the 16S-23S rRNA genes of Campylobacter jejuni, C. coli, C. lari and C. upsaliensis. The primers were tested on positive and negative reference strains in pure cultures and in inoculated poultry meat samples before their application in real-time PCR (qPCR) protocol for analyzing chicken meat samples. In parallel, the samples were tested by using the ISO 10272-1:2006 method. The qPCR protocol based on CampyPFw and CampyPRv showed good sensitivity, with the limit of detection of 4.6 × 10² cells/mL in chicken samples without enrichment steps.

1. Introduction

The thermotolerant Campylobacter species, especially C. jejuni and C. coli, are the leading cause of campylobacteriosis, the zoonotic enteric infection for which its incidence has increased in both developed and developing countries in the last 10 years [1]. Campylobacter spp., the major zoonotic disease agent since 2005 [2], may cause gastroenteritis, severe septicemia bloodstream infection, inflammatory bowel disease, reactive arthritis, and Guillain-Barreé syndrome [2]. The most important source of campylobacteriosis in humans is raw or insufficiently cooked chicken meat as well as cross-contamination while handling meat contaminated with Campylobacter spp.
Campylobacter shows more than 75% prevalence in the EU member states in broiler meat [3,4]. Currently, samples from broiler meat and skin are analyzed by using labor- consuming and time-consuming enumeration processes that are mostly based on viable plate count methods [1]. The official culture-based methods are not suitable for routine analysis, because they provide results in 5–7 days while most of the poultry-based products are consumed within a few days. In addition, Campylobacter is a fastidious organism that loses its cultivability when poultry meat is stored at 4 °C or under oxygen, and, thus, cannot be detected by a plate count method [5,6,7].
Methods including microscopy and assays for the detection of metabolic activities, such as membrane potential, are sensitive and rapid but expensive and time-consuming [1,8,9]. Molecular methods, such as real-time PCR (qPCR), provide advantages in Campylobacter quantification, especially in terms of the turnaround time, specificity, and sensitivity [10,11]. The implementation of molecular techniques will enable rapid and accurate routine analysis, thereby preventing and/or reducing outbreaks in humans and improving our knowledge on Campylobacter contamination. qPCR has already been used for different purposes related to the poultry industry, including quantification in poultry carcass rinses [12,13,14,15], chilled or frozen carcass [16], fecal and cecal samples [17,18], carcasses [19], neck-skin [20,21], and samples from slaughterhouses [19,22]. Nevertheless, different steps in qPCR still have to be optimized before it can be widely accepted for identification and quantification of Campylobacter in poultry samples with low contamination levels. These limitations are mainly related to the method used for the extraction of DNA in various food matrices, the elimination of matrix inhibitors, and the detection and quantification of low number of cells per gram of foods.
In this study, a new couple of primers targeting the 16S-23S rRNA gene of the most prevalent Campylobacter spp., i.e., C. jejuni, C. coli, C. lari, and C. upsaliensis, was designed, tested, and used in qPCR for Campylobacter quantification. The qPCR assay was applied on both artificially and naturally contaminated chicken meat samples before the enrichment step (DNA extracted from the homogenization bag) and after the 48 h enrichment in Bolton broth (selective medium for the Campylobacter species). The results were compared with those obtained by using the plate count method and the standard method.

2. Materials and Methods

2.1. Microorganisms

The bacterial strains used in this study are listed in Table S1. All Campylobacter spp., Helicobacter spp., and Arcobacter butzleri strains were cultivated under specific microaerophilic conditions (6% O2, 7% CO2, 7% H2, and 80% N2) generated by using an Oxoid™ CampyGen™ 2.5 L sachet (Thermo Fisher Scientific Inc., Milan, Italy). The revitalization procedure of cultures stored at −80 °C was conducted at 37 °C for 48 h in brain-heart infusion (BHI) broth (Thermo Fisher Scientific Inc., Milan, Italy). Furthermore, the Campylobacter isolates were incubated in Columbia blood agar base (Thermo Fisher Scientific Inc., Milan, Italy) supplemented with 5% v/v of sheep defibrinated blood. Pure colonies were isolated on BHI agar medium and subjected to Gram staining, oxidase and catalase tests, and cell-morphology analyses. Strains used as negative controls were cultivated on BHI agar medium at 30 or 37 °C for 24 or 48 h based on the optimum growth conditions of the microorganism, with the exception of Lactobacillus plantarum which required microaerophilic conditions. All bacteria were examined using Gram staining and cell-morphology analysis. Selective media PALCAM Agar Base, X.L.D. Agar, and Brilliance™ Bacillus Cereus Agar Base for Listeria, Salmonella, and Bacillus cereus, respectively, were purchased from Oxoid (Thermo Fisher Scientific Inc., Milan, Italy).

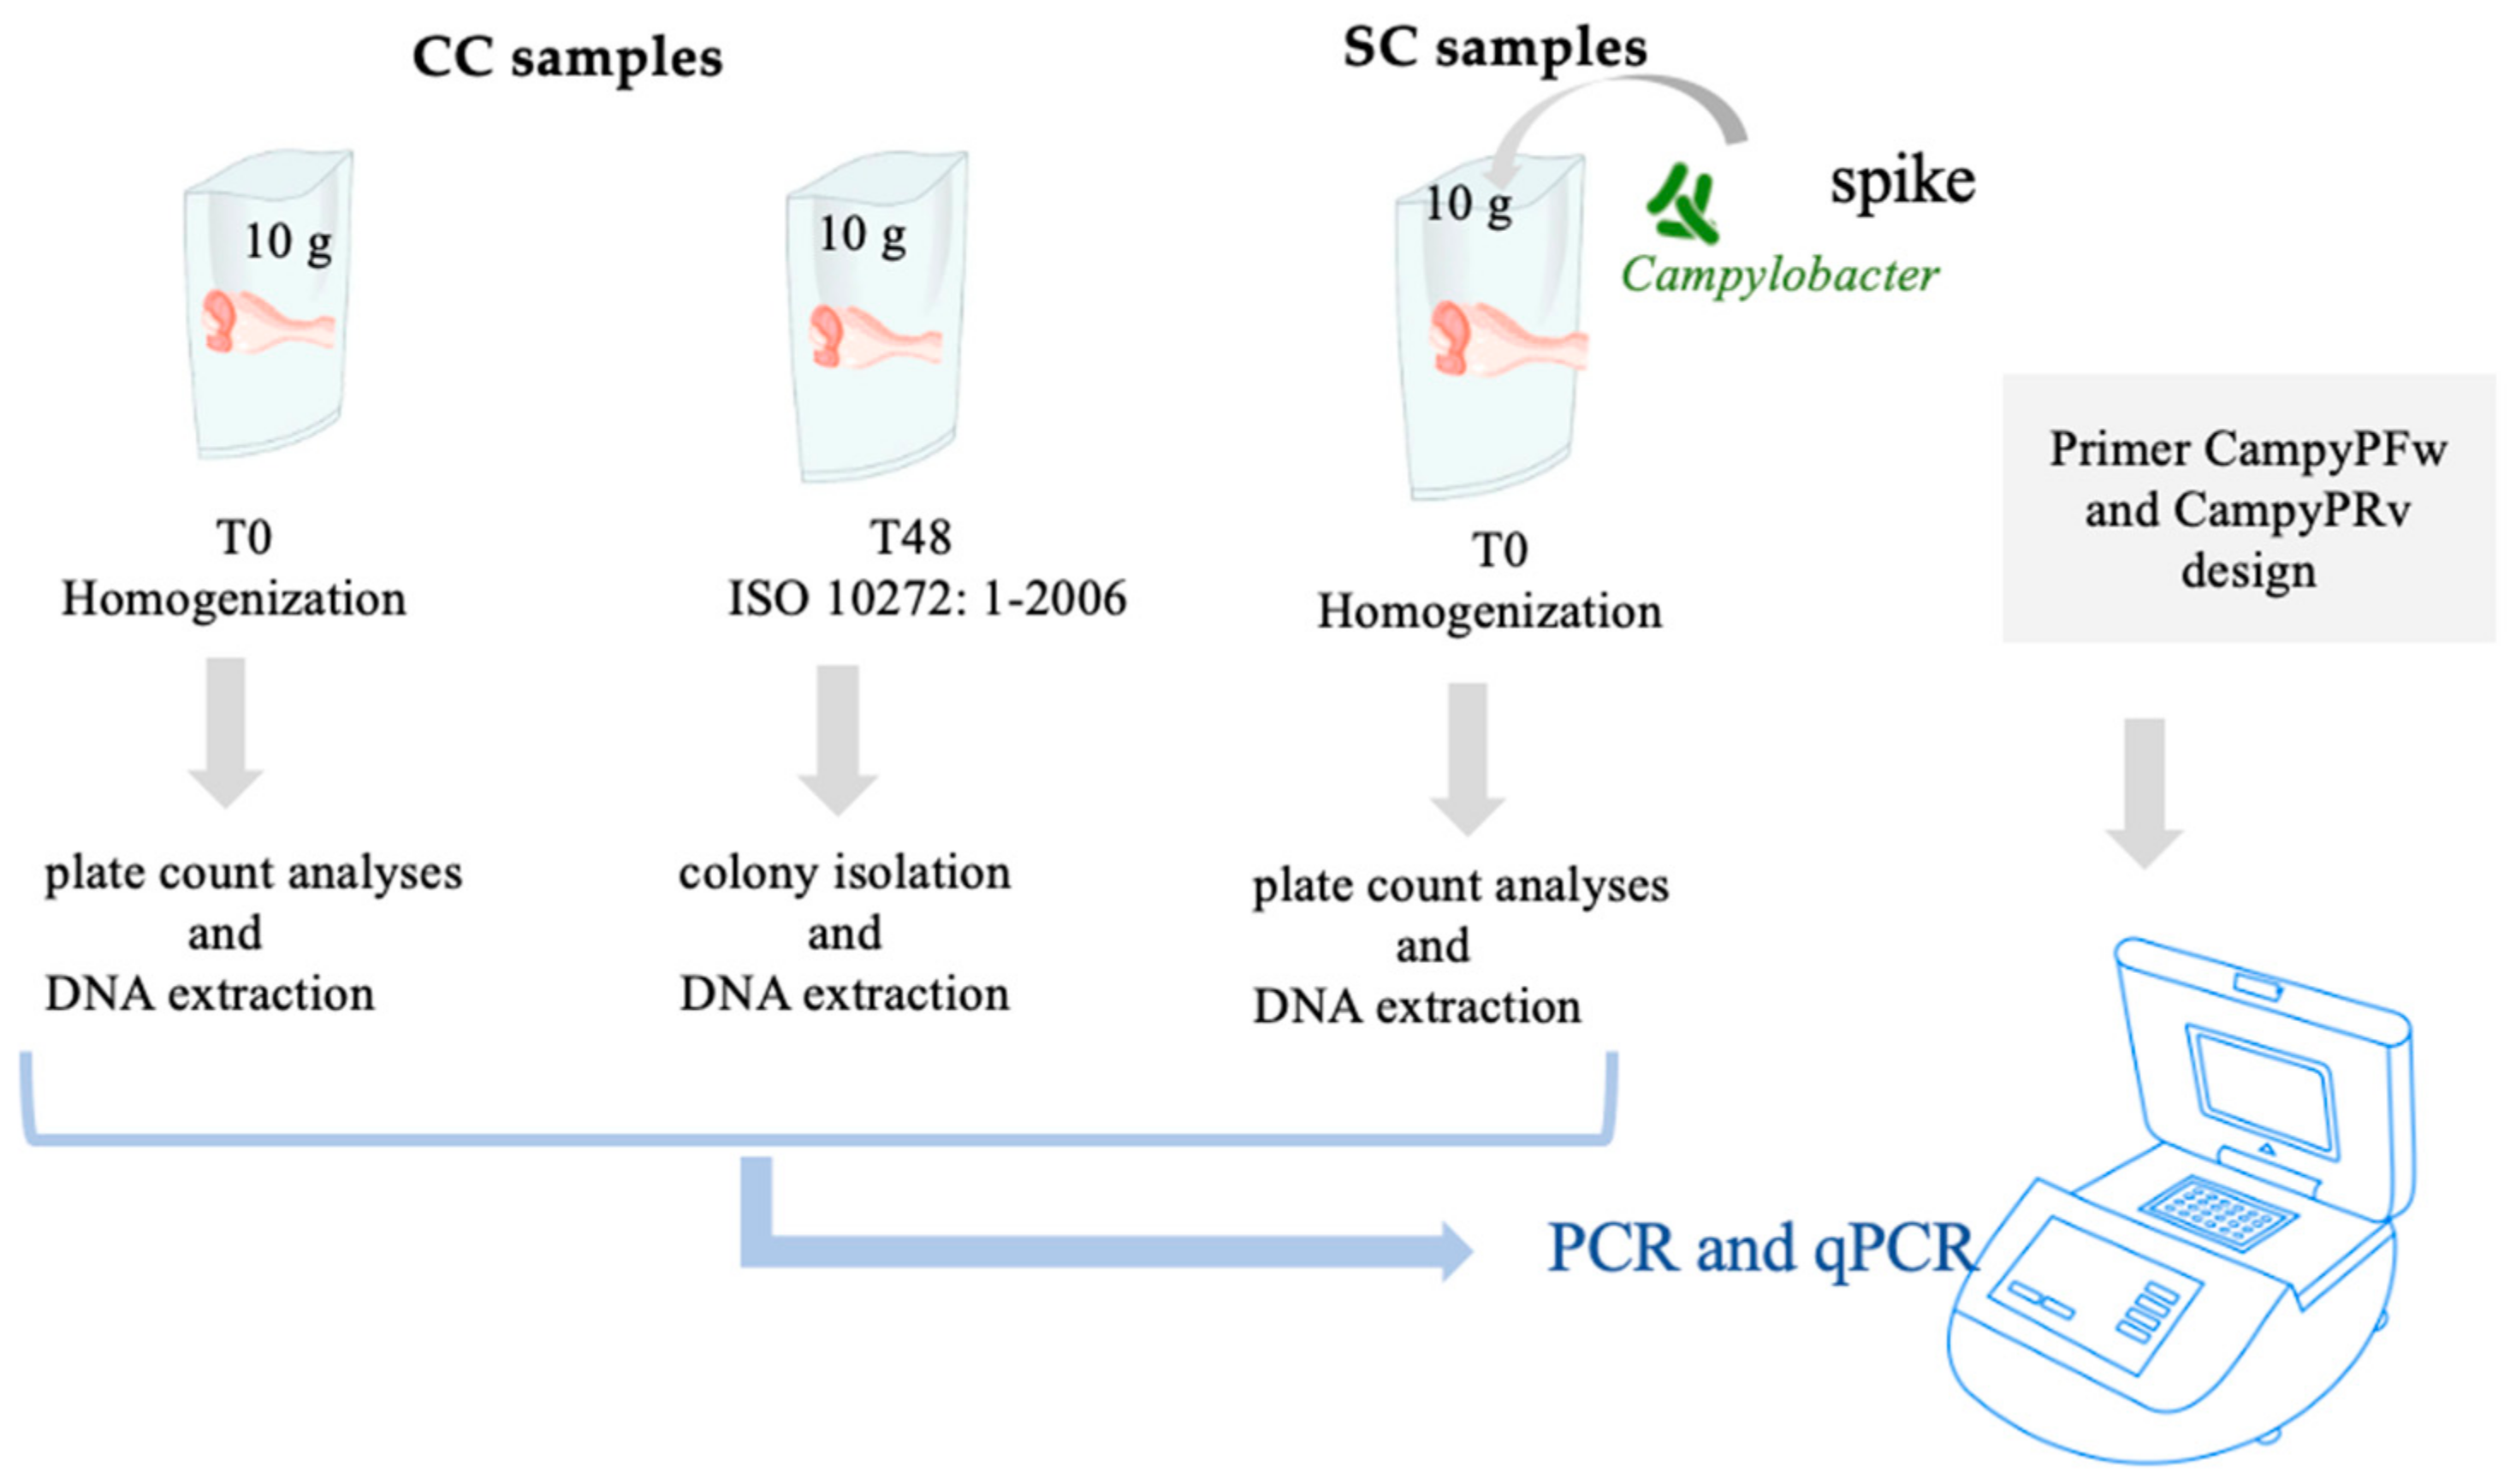
2.2. Chicken Samples and Plate Count Enumeration

Twenty chicken meat samples (named CC) purchased from local butcher shops in Italy in 2016 where they were conserved at 4 °C until purchase, were analyzed for bacterial enumeration by using the plate-count method and tryptone soya agar (TSA) at 30 °C for 48 h. Yeasts and molds were enumerated on malt extract agar supplemented with 10 μg/mL tetracycline (AMT) at 30 °C for 48 h; Enterobacteriaceae, were enumerated on violet red bile glucose agar (VRBGA) at 37 °C for 24 h; and E. coli and coliforms were enumerated on Coli-ID agar (Biomeriaux, Firenze, Italy) at 37 °C for 24 h.
Additionally, 10 g of each chicken sample (including skin and meat) was transferred to a Stomacher filter bag containing 90 mL of Bolton broth (Thermo Fisher Scientific Inc., Milan, Italy) and subjected to the ISO 10272-1:2006 method for Campylobacter spp. detection.
For the sake of confirmation, suspected colonies from each plate were streaked on blood agar base plates, half of each colony was incubated at 41.5 °C, and the other half was incubated at 25 °C for 48 h. Bacteria were subjected to oxidase tests and motility tests, that were carried out in Brucella broth (Thermo Fisher Scientific Inc., Milan, Italy) in order to verify the presence of the typical corkscrew-like movement used for Campylobacter spp. identification.
Serial decimal dilutions of C. jejuni overnight culture (BHI, microaerophilic conditions, 20 h) containing approximately 108 cells/mL were inoculated into meat samples (named SC) to reach final concentrations of 107, 105, 103, and 0 cell of C. jejuni per g of meat.
The spiked chicken samples were analyzed by colony count on mCCDA to confirm the inoculum, and DNA was extracted and used in a qPCR assay with the new primers.
The workflow of the procedure used in this work is reported in Figure 1.

2.3. DNA Extraction

DNA extractions from CC samples were carried at t0 (CCt0) and after enrichment at 48 h (CCt48), while DNA was extracted from SC samples (spiked samples) at t0 (SCt0). Both DNA extractions were performed following a previously published protocol [23]: Two mL was collected from the Stomacher bags containing SPW at t0 (SC and CC samples), and 2 mL was collected from the Bolton broth after 48 h (CCt48 samples). After centrifugation at 14,000× g for 10 min, the pellet was resuspended in 300 µL of breaking buffer (2% Triton X-100, 1% SDS, 100 mm NaCl, 10 mm Tris pH 8, and 1 mm EDTA pH 8) and 300 mL of phenol–chloroform–isoamyl alcohol 25:24:1 (Sigma, Milan, Italy) was added [24] with glass beads.
The cells were then homogenized in a bead beater (Mini-Bead Beater 8t, Biospec Products Inc., Bartlesville, OK, USA) three times, each for 30 s at maximum speed at room temperature. The amount of 300 mL of TE (10 mm Tris, 1 mm EDTA pH 7.6) was added, and the tubes were centrifuged at 12,000× g for 10 min at 4 °C. The aqueous phase was collected, and DNA was precipitated with 1 mL ice-cold absolute ethanol. After centrifugation at 14,000× g for 10 min at 4 °C, the pellet was dried under vacuum at room temperature and resuspended in 50 mL of sterile distilled water containing 2 IU DNase-free RNase (Roche Diagnostics, Milan, Italy). The samples were then incubated at 37 °C for 30 min before storage at −20 °C.
DNA concentration and purity were measured using a spectrophotometer (NanoDrop, ThermoFisher Scientific Inc, Milano, Italy). The extracted DNAs were used for qPCR.

2.4. Primer Design

New primers CampyPFw (5′-CTTTGCACGCAGGAGGTCA-3′) and CampyPRv (5′-ATGGTGGGCCTAACAAGACT-3′) were designed in the 16S-23S gene sequences GQ167702.1 of C. jejuni; GQ167720.1 of C. coli; AB644222.1 of C. lari; and DQ871249.1 of C. upsaliensis downloaded from GenBank (http://0-www-ncbi-nlm-nih-gov.brum.beds.ac.uk/genbank/). The software (http://multalin.toulouse.inra.fr/multalin/) for multiple sequence alignment with hierarchical clustering [25] AmplifX 1.7.0, OligoAnalyzer 3.1 (https://eu.idtdna.com/calc/analyzer) and FastPCR6.1 were used to verify the specificity of various bacteria belonging to both the same and different genera and animal gene sequences (Table S2), as previously described [26].

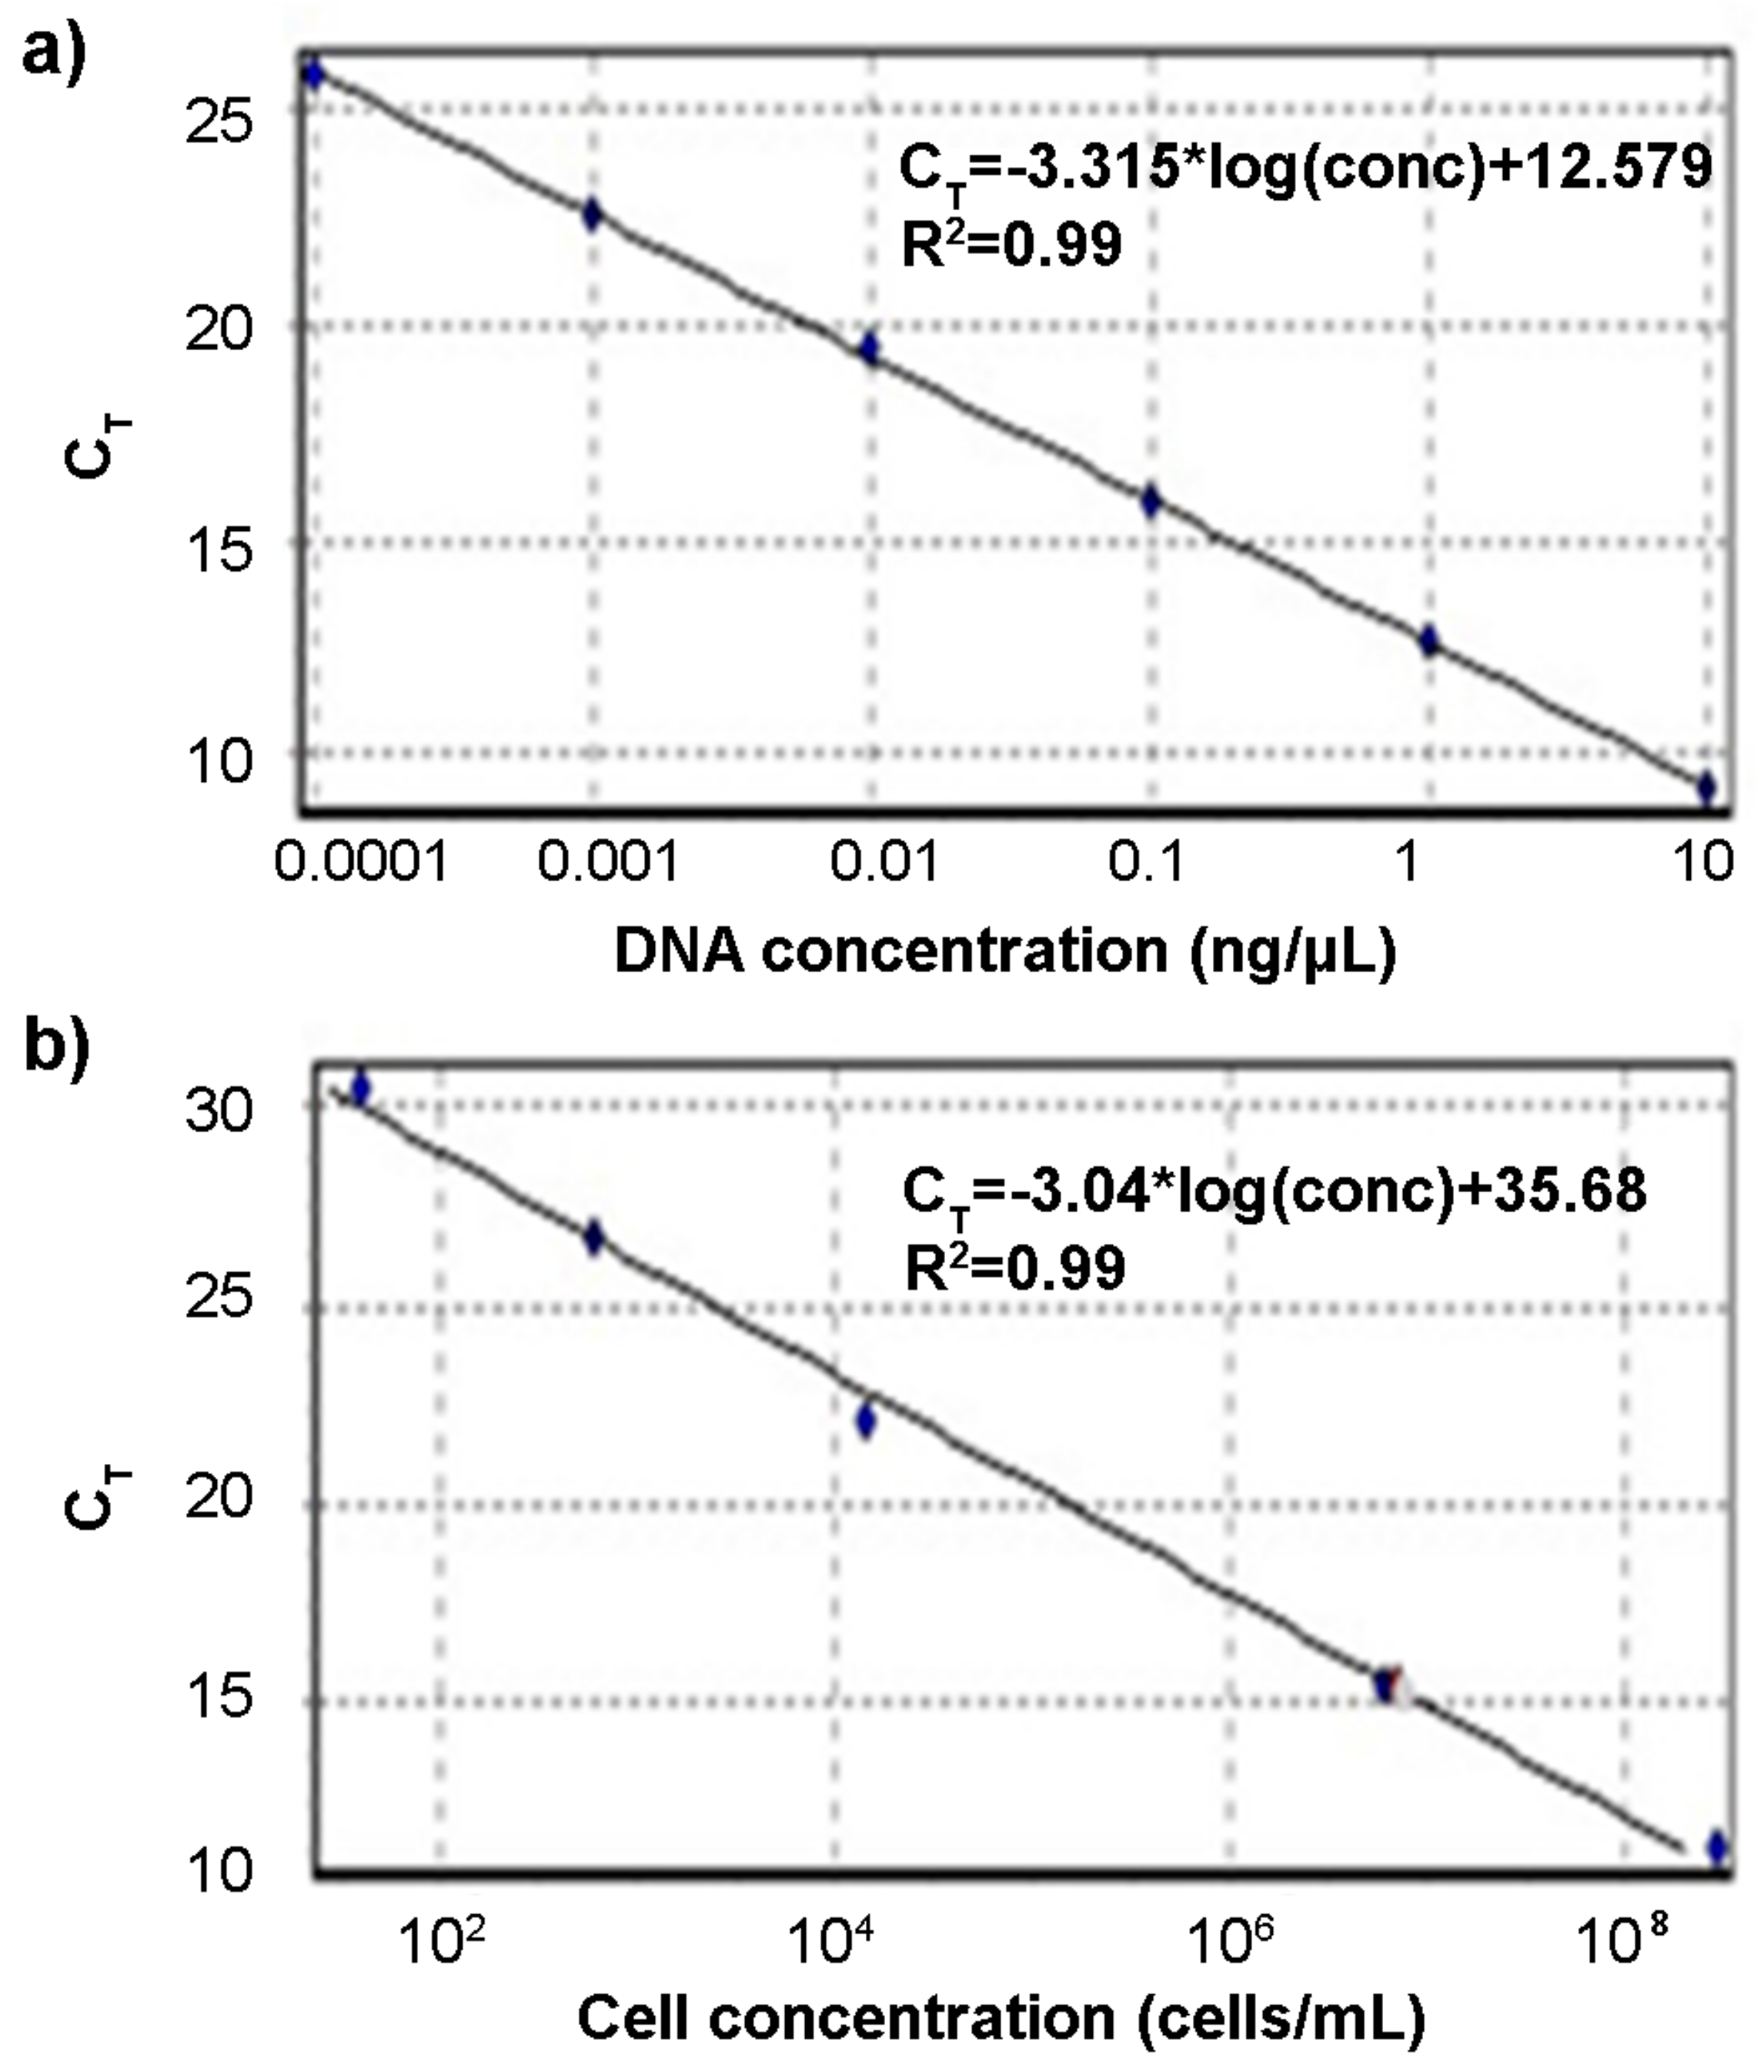
2.5. PCR and qPCR Protocols

CampyPFw and CampyPRv primers were tested for specificity by using end-point PCR. The reaction mixture contained the following reagents: 5 µL AmpliTaq buffer, 1.5 mM MgCl2, 1 µL dNTPs (10 mM of each dNTP), 1 µL of each primer (10 μM), 0.25 μL AmpliTaq DNA polymerase (5 units/µL), and 1 µL of DNA at 100 ng/µL. All reagents were purchased from Applied Biosystems (ThermoFisher Scientific Inc., Milan, Italy). In each assay, a negative control where the template DNA was replaced with an equal volume of nuclease-free water (NCT) was included. A thermal cycler C1000 TouchTM (Bio-Rad Laboratories Inc., Hercules, CA, USA) was used.
Amplification conditions were as follows: denaturation at 95 °C for 5 min; 30 cycles of denaturation at 95 °C for 1 min; annealing at 58 °C for 30 s; extension at 72 °C for 30 s; and a final extension at 72 °C for 7 min. The PCR products were electrophoresed on a 1.5% agarose gel and visualized using ethidium bromide (Sigma-Aldrich Inc., Milan, Italy) at a final concentration of 0.5 μg/mL in a GeneGenius BioImaging System (Syngene Ltd., Cambridge, UK). The electrophoretic run was carried out at 120 V for 40 min.
A qPCR protocol with CampyPFw and CampyPRv was optimized by using a Rotor-gene Q thermocycler (Qiagen Inc., Milan, Italy). Calibration curves were performed using both serial dilutions of DNA in the range 10 ng/μL–100 fg/μL and concentrations of C. jejuni DSM 4688 cells from 108 to 10 cell/mL. The PCR mixture contained the following reagents: 10 µL of SsoFast™ EvaGreen Supermix (2×) (Bio-Rad Laboratories Inc., Hercules, CA, USA), 1 µL of each primer (CampyPFw and CampyPRv) at 10 μM, and 1 µL of DNA template in a final volume of 20 µL. DNAs extracted from chicken samples SCt0, CCt0, and CCt48 were used; in each assay, a negative control was included.
The program consisted of hot-start activation at 98 °C for 2 min, 35 cycles of denaturation at 98 °C for 5 min, and annealing/extension at 60 °C for 20 s. Following a melting temperature analysis, a gradual increase in temperature from 60 to 95 °C (0.5 °C/5 s) was performed.
An end-point PCR was performed for samples 2CC and 3CC and C. jejuni DSM4688 (as reference) using primers P1V1 and P4V3 [27], purified using the QIAquick PCR Purification Kit (Qiagen Inc., Milan, Italy), and sent to Eurofins Genomics Co. (Ebersberg, Germany) for sequencing. The obtained sequences were processed in BLAST [28] to confirm Campylobacter identification.

3. Results and Discussion

3.1. Microbiological Analysis of Samples

The enumerations of the total viable counts of Enterobacteriaceae, coliforms, E. coli, yeasts, and molds obtained for 20 chicken samples, using the plate count method are reported in Table 1.
The total bacterial count in CC samples ranged from 1.3 × 10⁴ to 5.1 × 10⁹ CFU/g, with the exception of the 17 CC sample which showed values below 50 CFU/g (the limit of detection of the method used). Similarly, Enterobacteriaceae count ranged from 2.1 × 10² to 2.4 × 10⁴ CFU/g; coliform values ranged from 1.3 × 101 to 3.2 × 10⁴ CFU/g, except for samples 12 CC and 17 CC, which showed values below the limit of detection of the method used. E. coli values ranged from 2 × 101 to 5.3 × 10³ CFU/g, except for the 19 CC sample, which showed a value below the limit of detection. Yeasts ranged from 1.7 × 10² to 6.3 × 10⁵, except for the 17 CC sample, while showed that molds were below the limit of detection in all samples.
The total viable count for mesophilic microorganisms was acceptable for all chicken samples analyzed, except for 18 CC, 19 CC, and 20 CC, which were 2–3 log higher. Data obtained were in accordance with values reported in the guidelines of Piemonte Region, which are based on risk analysis in approved food microbiology. For fresh and refrigerated meat values of total viable count, mesophilic microorganisms from 106 to 107 CFU/g, Enterobacteriaceae from 104 to 106 CFU/g and E. coli from 103 to 104 CFU/g are considered acceptable.
Samples 2 CC, 3 CC, 8 CC, 10 CC, 16 CC, and 17 CC were positive for the presence of Campylobacter spp. based on the results obtained by the ISO 10272-1:2006 method after 4–6 h at 37 °C and 40–48 h incubation in Bolton broth (Table 2). No correlation was observed between total bacterial count and the presence of Campylobacter spp., which is in agreement with previously published results [29].

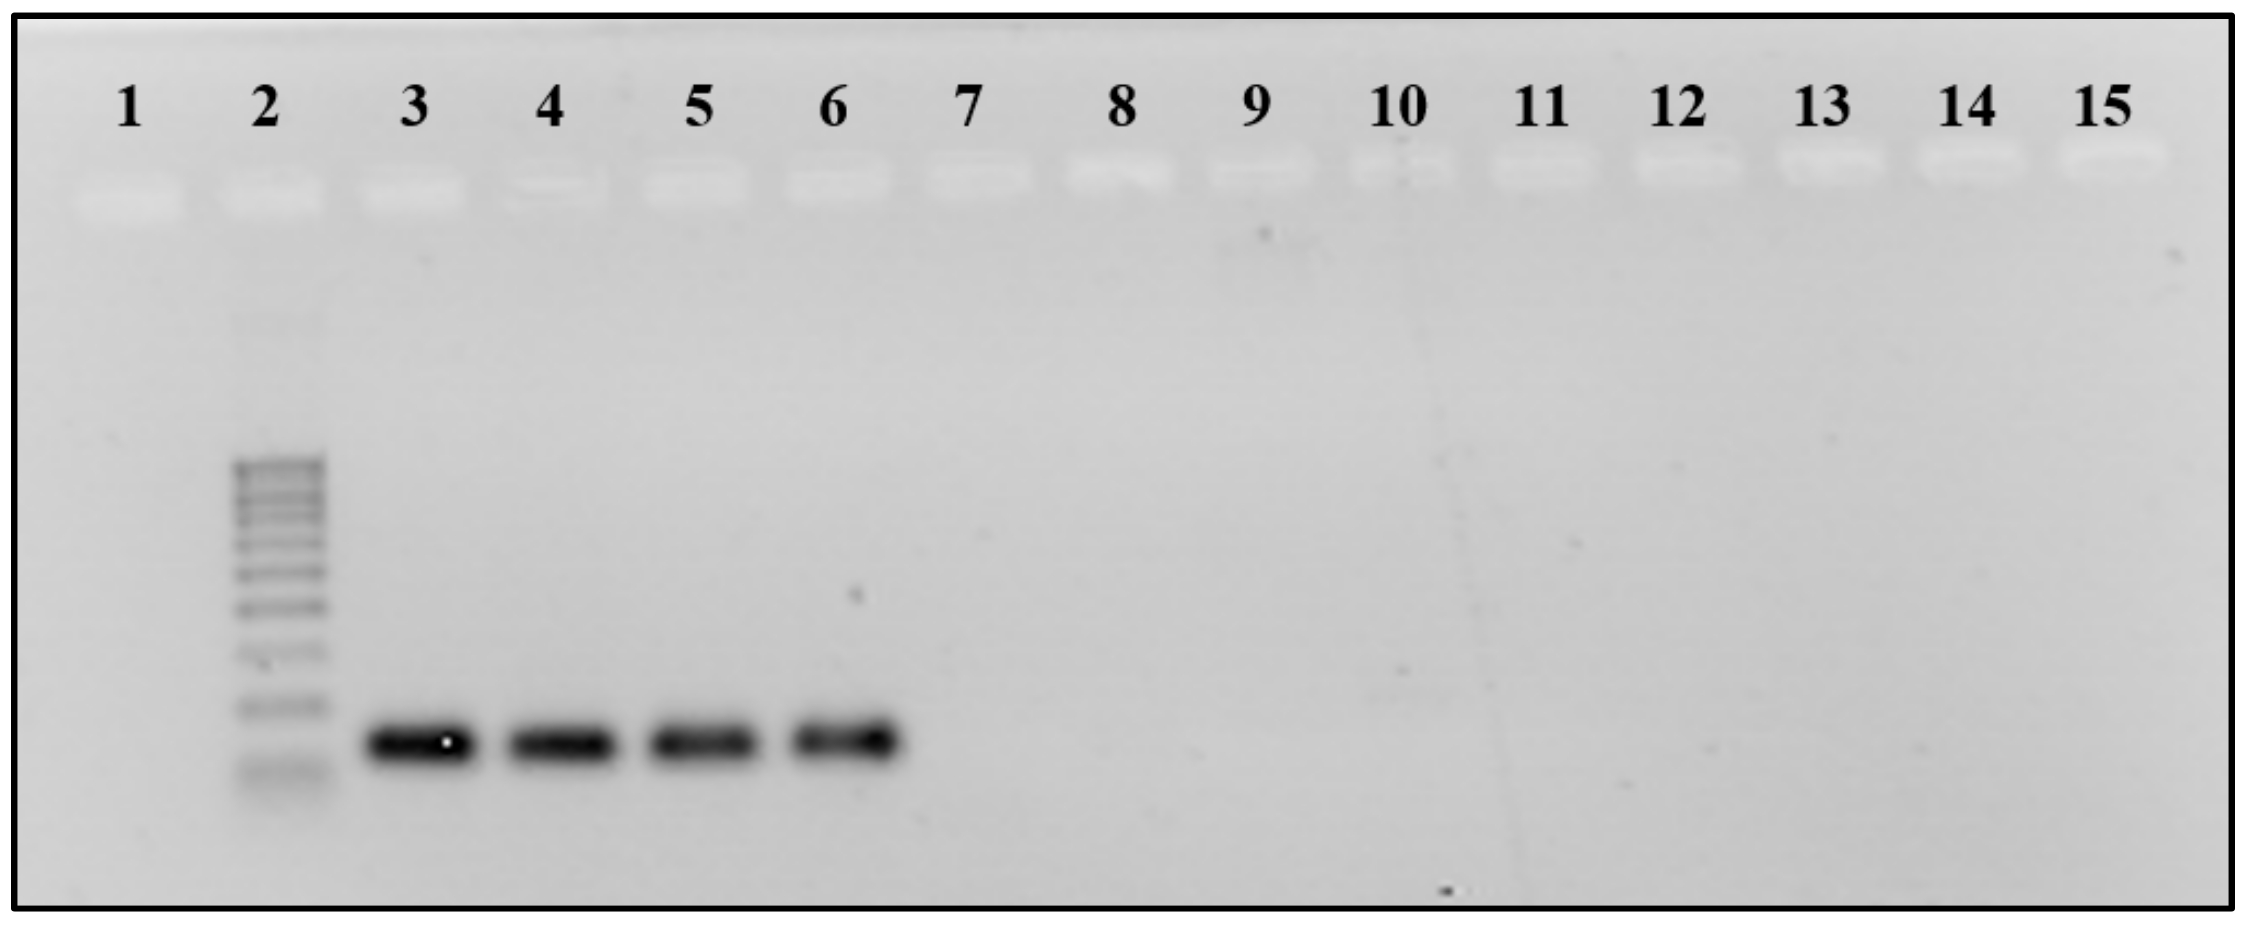
3.2. PCR and qPCR Analysis

New CampyPFw and CampyPRv primers were tested using the end point PCR on DNAs extracted from the bacteria listed in Table S1 before their utilization in qPCR. Only Campylobacter strains produced the expected amplicons of 132 bp, confirming the specificity of the primers. Moreover, as expected, the new primers were specific for C. jejuni, C. coli, C. lari, and C. upsaliensis strains. Figure 2 shows results obtained for some samples subjected to PCR.
Primers were then tested in qPCR by using DNA extracted from C. jejuni DSM 4688. The calibration curve obtained using DNA dilutions from 10 ng/μL to 100 fg/μL (Figure 3a) showed a R2 of 0.99, slope of −3.315, and efficiency of 100.28%, indicating the high quality of primers. A calibration curve was also performed by using DNA extracted from serial decimal dilutions of C. jejuni DSM 4688 cells in the range from 108 to 10 cell/mL (Figure 3b). The curve showed a R2 of 0.99, slope of −3.04, efficiency of 113%, and limit of detection of about 4.6 × 10² cells/mL.
Table S3 reports the number of cells per milliliter evaluated by using DNA diluted at 1:1000. The cell concentrations extracted from the curve were confirmed by plate count evaluation performed on the same samples.
The qPCR assay was then applied on CCt0 and CCt48 samples. The obtained results are reported in Table 3. Five chicken samples (2 CC, 3 CC, 8 CC, 10 CC, and 17 CC) were positive for Campylobacter at t0 (before enrichment), and seven (2 CC, 3 CC, 8 CC, 9 CC, 10 CC, 16 CC, and 17 CC) at t48 (after enrichment).
CampyPFw and CampyPRv used in the qPCR assay enabled the detectection of Campylobacter DNA at concentrations as low as 100 fg/µL, while previously designed primers needed 103 ng of DNA to provide results as reported by Alves [30]. Similarly, the limit of detection of 4.6 × 10² cells/mL obtained using cell dilutions was lower than those previously reported by Wolffs et al. [31], Papic et al. [20], Alves et al. [30], and Wolffs et al. [32], which were 1 × 10³ CFU/mL, 2.6 × 10³ CFU/mL, 3 × 10³ CFU/mL, and 1.2 × 10³ CFU/mL, respectively. Improved sensitivity obtained by the new primers can be explained by the selected sequence used for primer annealing. CampyPFw and CampyPRv hybridized up to three points in the Campylobacter spp. sequence, as tested with BLAST producing three amplicons of 131–132 bp from 40,908 to 41,039, 396,123 to 396,254, and 700,253 to 700,384 on the DNA sequence CP040608.1 of Campylobacter spp. Moreover, CampyPFw and CampyPRv primers can be used for both PCR and qPCR in contrast to some previously published primers. For instance, Khan et al., [33] designed an efficient couple of primers that can be used only for PCR because their amplicon was too long for qPCR analysis.
The number of Campylobacter cells present in the positive samples was calculated by considering that 100 fg of DNA corresponds to approximately 50 cells [34] and by considering the value obtained by relating the length of the genome of a cell, which is about 1.6 × 10⁶ bp, to the weight of a base pair of 650 Daltons [35]. By hypothesizing that one cell of Campylobacter spp. contains 2 fg of genomic DNA, we refer the DNA value of samples 2 CSt0, 3 CS t0, 8 CS t0, 10 CS t0, and 17 CS t0 to about 2.45 × 10³, 5.84 × 10³, 4.64 × 10³, 1.20 × 10³, and 1.17 × 10³ cells/mL, respectively. Campylobacter was present in low numbers in meat samples tested when compared to bacteria such as coliforms and Enterobacteriaceae (Table 1). The high sensitivity and selectivity of primers enabled Campylobacter DNA detection in the presence of meat background bacteria. The data obtained indicate the usefulness of the primer probe set to detect and quantify Campylobacter in naturally contaminated chicken meat (Table 3).
Implementation of qPCR methods for the detection of Campylobacter in poultry meat requires optimization regarding both identification and quantification aspects. Although more than 85% of human campylobacteriosis is caused by C. jejuni, other Campylobacter strains isolated from poultry can also induce infections. The prevalence of C. coli, C. lari, and C. upsaliensis strains was found to be as high as 40%, 6%, and 2.5%, respectively, in Campylobacter-positive poultry samples [21,36,37,38,39]. The occurrence of non-C. jejuni-C. coli strains is probably even higher because alternative Campylobacter species count for about 10% of positive isolates [17]. qPCR protocols using new primer probe set designed in this work can simultaneously target the 16S-23S rDNA sequences of C. jejuni, C. coli, C. lari, and C. upsaliensis i.e., the most prevalent Campylobacter strains. Another important improvement is the enhanced sensitivity of detection obtained using the new primers, which enabled bacterial quantification in naturally contaminated chicken meat without an enrichment step. Most of the diagnostics available for the detection of Campylobacter are time-consuming and require the enrichment step, which is not adapted taking into account that chicken meat is consumed within only a few days after preparation. Adding enrichment to a PCR protocol improves the detection rate but impedes bacterial quantification. In addition, the enrichment medium may contain DNA polymerase inhibitors, which can markedly impair Campylobacter detection and quantification.
The results of the present study suggest that the new primer probe set may improve qPCR protocols for sensitive Campylobacter identification in poultry samples. Its implementation in daily routine analyses still requires validation on a large number of samples. It will be interesting to combine new primers with other optimized qPCR steps that include maximal removal of inhibitors from the matrix, utilization of inhibitor-resistant DNA polymerases, and automated DNA extraction procedure. We believe that in that way a robust qPCR protocol will be obtained for the reliable quantification of Campylobacter needed for surveillance programs to reduce contamination on chicken samples.

3.3. Sequencing

The sequences of amplicons obtained with CampyPFw and CampyPRv confirmed the specificity of the primers that detected C. jejuni in the analyzed samples with an identity of 99% and E-Value of zero. Sequencing also confirmed the prevalence of C. jejuni in chicken meat, which is in agreement with the published data [40,41,42].

4. Conclusions

CampyPFw and CampyPRv primers used in this study are specific and sensitive and can be used for real-time quantification of Campylobacter in naturally contaminated chicken samples. The qPCR protocol proposed is simple and rapid and could be directly used to examine chicken meat samples containing low bacterial titers. Since food contamination with Campylobacter is an important food safety concern, this assay can be a useful tool for detecting and monitoring the most prevalent Campylobacter species in contaminated foods.
This couple of primers able to detect the four most widespread Campylobacter species responsible for campylobacteriosis at levels below 103 CFU/mL and in a amount of reduced time is a potential tool for improving food safety because samples contaminated al lower levels can be detected.
We believe that the sensitivity of the test can be further improved to lower numbers of CFU/g of Campylobacter spp. by using larger sample amounts (e.g., 25 g) in order to have a sufficient number of bacteria for detection despite their low absolute concentration, or it can be further improved by increasing the volume of DNA used as a template in PCR assays.

Supplementary Materials

The following are available online at https://0-www-mdpi-com.brum.beds.ac.uk/article/10.3390/foods10102341/s1, Table S1: Microorganisms used in the work; Table S2: Accession number of the sequences analyzed in silico to design primers CampyPFw and CampyPRv; Table S3: Data obtained with chicken meat samples artificially spiked with Campylobacter jejuni.

Author Contributions

Conceptualization, M.M.; methodology, M.M.; validation, P.V.; formal analysis, P.V.; investigation, P.V.; resources, M.M.; data curation, P.V. and M.M.; writing—original draft preparation, P.V. and J.V.; writing—review and editing, P.V., J.V., and M.M.; visualization, P.V. and J.V.; supervision, M.M.; project administration, M.M.; funding acquisition, J.V. and M.M. All authors have read and agreed to the published version of the manuscript.

Funding

This research was supported in part by the University Paris-Saclay through the Poc in labs 2019, grant agreement No. 00003469 (OSCAR), to J.V.

Institutional Review Board Statement

Not applicable.

Informed Consent Statement

Not applicable.

Data Availability Statement

Not applicable.

Acknowledgments

The authors would like to thank the students Andrea Anzil, Francesca Maran, Francesca Caon, and Giulia Cristin (University of Udine, Udine, Italy) for their help with data collection.

Conflicts of Interest

The authors declare no conflict of interest.

References

  1. Vizzini, P.; Braidot, M.; Vidic, J.; Manzano, M. Electrochemical and optical biosensors for the detection of campylobacter and listeria: An update look. Micromachines 2019, 10, 500. [Google Scholar] [CrossRef] [PubMed] [Green Version]
  2. Scallan Walter, E.J.; Crim, S.M.; Bruce, B.B.; Griffin, P.M. Incidence of Campylobacter-associated Guillain-Barre Syndrome estimated from health insurance data. Foodborne Pathog. Dis. 2020, 17, 23–28. [Google Scholar] [CrossRef] [PubMed]
  3. He, Y.; Yao, X.; Gunther, N.W.; Xie, Y.; Tu, S.-I.; Shi, X. Simultaneous detection and differentiation of Campylobacter jejuni, C. coli, and C. lari in chickens using a multiplex real-time PCR assay. Food Anal. Methods 2010, 3, 321–329. [Google Scholar] [CrossRef]
  4. Nastasijevic, I.; Proscia, F.; Boskovic, M.; Glisic, M.; Blagojevic, B.; Sorgentone, S.; Kirbis, A.; Ferri, M. The European Union control strategy for Campylobacter spp. in the broiler meat chain. J. Food Saf. 2020, 40, e12819. [Google Scholar] [CrossRef]
  5. El-Shibiny, A.; Scott, A.; Timms, A.; Metawea, Y.; Connerton, P.; Connerton, I. Application of a group II Campylobacter bacteriophage to reduce strains of Campylobacter jejuni and Campylobacter coli colonizing broiler chickens. J. Food Prot. 2009, 72, 733–740. [Google Scholar] [CrossRef]
  6. Stingl, K.; Knüver, M.-T.; Vogt, P.; Buhler, C.; Krüger, N.-J.; Alt, K.; Tenhagen, B.-A.; Hartung, M.; Schroeter, A.; Ellerbroek, L. Quo vadis?—Monitoring Campylobacter in Germany. Eur. J. Microbiol. Immunol. 2012, 2, 88–96. [Google Scholar] [CrossRef] [Green Version]
  7. Haddad, N.; Burns, C.M.; Bolla, J.M.; Prévost, H.; Fédérighi, M.; Drider, D.; Cappelier, J.M. Long-term survival of Campylobacter jejuni at low temperatures is dependent on polynucleotide phosphorylase activity. Appl. Environ. Microbiol. 2009, 75, 7310–7318. [Google Scholar] [CrossRef] [Green Version]
  8. Vidic, J.; Manzano, M.; Chang, C.-M.; Jaffrezic-Renault, N. Advanced biosensors for detection of pathogens related to livestock and poultry. Vet. Res. 2017, 48, 1–22. [Google Scholar] [CrossRef] [Green Version]
  9. Vizzini, P.; Manzano, M.; Farre, C.; Meylheuc, T.; Chaix, C.; Ramarao, N.; Vidic, J. Highly sensitive detection of Campylobacter spp. in chicken meat using a silica nanoparticle enhanced dot blot DNA biosensor. Biosens. Bioelectron. 2020, 171, 112689. [Google Scholar] [CrossRef]
  10. Vidic, J.; Vizzini, P.; Manzano, M.; Kavanaugh, D.; Ramarao, N.; Zivkovic, M.; Radonic, V.; Knezevic, N.; Giouroudi, I.; Gadjanski, I. Point-of-need DNA testing for detection of foodborne pathogenic bacteria. Sensors 2019, 19, 1100. [Google Scholar] [CrossRef] [Green Version]
  11. Ricke, S.C.; Feye, K.M.; Chaney, W.E.; Shi, Z.; Pavlidis, H.; Yang, Y. Developments in rapid detection methods for the detection of foodborne campylobacter in the United States. Front. Microbiol. 2019, 9, 3280. [Google Scholar] [CrossRef] [PubMed] [Green Version]
  12. Botteldoorn, N.; van Coillie, E.; Piessens, V.; Rasschaert, G.; Debruyne, L.; Heyndrickx, M.; Herman, L.; Messens, W. Quantification of Campylobacter spp. in chicken carcass rinse by real-time PCR. J. Appl. Microbiol. 2008, 105, 1909–1918. [Google Scholar] [CrossRef] [PubMed]
  13. Duarte, A.; Botteldoorn, N.; Coucke, W.; Denayer, S.; Dierick, K.; Uyttendaele, M. Effect of exposure to stress conditions on propidium monoazide (PMA)-qPCR based Campylobacter enumeration in broiler carcass rinses. Food Microbiol. 2015, 48, 182–190. [Google Scholar] [CrossRef]
  14. Josefsen, M.H.; Löfström, C.; Hansen, T.B.; Christensen, L.S.; Olsen, J.E.; Hoorfar, J. Rapid quantification of viable Campylobacter bacteria on chicken carcasses, using real-time PCR and propidium monoazide treatment, as a tool for quantitative risk assessment. Appl. Environ. Microbiol. 2010, 76, 5097–5104. [Google Scholar] [CrossRef] [Green Version]
  15. Englen, M.D.; Kelley, L.C. A rapid DNA isolation procedure for the identification of Campylobacter jejuni by the polymerase chain reaction. Lett. Appl. Microbiol. 2000, 31, 421–426. [Google Scholar] [CrossRef]
  16. Reis, L.P.; Menezes, L.D.M.; Lima, G.K.; Santos, E.L.D.S.; Dorneles, E.M.S.; Assis, D.C.S.D.; Lage, A.P.; Cançado, S.D.V.; Figueiredo, T.C.D. Detection of Campylobacter spp. in chilled and frozen broiler carcasses comparing immunoassay, PCR and real time PCR methods. Ciência Rural 2018, 48, e20161034. [Google Scholar] [CrossRef] [Green Version]
  17. De Boer, P.; Rahaoui, H.; Leer, R.; Montijn, R.; van der Vossen, J. Real-time PCR detection of Campylobacter spp.: A comparison to classic culturing and enrichment. Food Microbiol. 2015, 51, 96–100. [Google Scholar] [CrossRef]
  18. Lund, M.; Nordentoft, S.; Pedersen, K.; Madsen, M. Detection of Campylobacter spp. in chicken fecal samples by real-time PCR. J. Clin. Microbiol. 2004, 42, 5125–5132. [Google Scholar] [CrossRef] [Green Version]
  19. Ivanova, M.; Singh, R.; Dharmasena, M.; Gong, C.; Krastanov, A.; Jiang, X. Rapid identification of Campylobacter jejuni from poultry carcasses and slaughtering environment samples by real-time PCR. Poult. Sci. 2014, 93, 1587–1597. [Google Scholar] [CrossRef] [PubMed]
  20. Papić, B.; Pate, M.; Henigman, U.; Zajc, U.; Gruntar, I.; Biasizzo, M.; Ocepek, M.; Kušar, D. New approaches on quantification of Campylobacter jejuni in poultry samples: The use of digital PCR and real-time PCR against the ISO standard plate count method. Front. Microbiol. 2017, 8, 331. [Google Scholar] [CrossRef] [PubMed] [Green Version]
  21. Schnider, A.; Overesch, G.; Korczak, B.; Kuhnert, P. Comparison of real-time PCR assays for detection, quantification, and differentiation of Campylobacter jejuni and Campylobacter coli in broiler neck skin samples. J. Food Prot. 2010, 73, 1057–1063. [Google Scholar] [CrossRef] [PubMed]
  22. Borges, K.A.; Cisco, I.C.; Furian, T.Q.; Tedesco, D.C.; Rodrigues, L.B.; Do Nascimento, V.P.; dos Santos, L.R. Detection and quantification of Campylobacter spp. in Brazilian poultry processing plants. J. Infect. Dev. Ctries. 2020, 14, 109–113. [Google Scholar] [CrossRef] [PubMed]
  23. Cocolin, L.; Aggio, D.; Manzano, M.; Cantoni, C.; Comi, G. An application of PCR-DGGE analysis to profile the yeast populations in raw milk. Int. Dairy J. 2002, 12, 407–411. [Google Scholar] [CrossRef]
  24. Manzano, M.; Cocolin, L.; Cantoni, C.; Comi, G. Bacillus cereus, Bacillus thuringiensis and Bacillus mycoides differentiation using a PCR-RE technique. Int. J. Food Microbiol. 2003, 81, 249–254. [Google Scholar] [CrossRef]
  25. Corpet, F. Multiple sequence alignment with hierarchical clustering. Nucleic Acids Res. 1988, 16, 10881–10890. [Google Scholar] [CrossRef] [PubMed]
  26. Vizzini, P.; Beltrame, E.; Zanet, V.; Vidic, J.; Manzano, M. Development and Evaluation of qPCR Detection Method and Zn-MgO/Alginate Active Packaging for Controlling Listeria monocytogenes Contamination in Cold-Smoked Salmon. Foods 2020, 9, 1353. [Google Scholar] [CrossRef]
  27. Klijn, N.; Weerkamp, A.H.; de Vos, W.M. Identification of mesophilic lactic acid bacteria by using polymerase chain reaction-amplified variable regions of 16S rRNA and specific DNA probes. Appl. Environ. Microbiol. 1991, 57, 3390–3393. [Google Scholar] [CrossRef] [Green Version]
  28. Altschul, S.F.; Gish, W.; Miller, W.; Myers, E.W.; Lipman, D.J. Basic local alignment search tool. J. Mol. Biol. 1990, 215, 403–410. [Google Scholar] [CrossRef]
  29. Fontanot, M.; Iacumin, L.; Cecchini, F.; Comi, G.; Manzano, M. Rapid detection and differentiation of important Campylobacter spp. in poultry samples by dot blot and PCR. Food Microbiol. 2014, 43, 28–34. [Google Scholar] [CrossRef]
  30. Alves, J.; Hirooka, E.Y.; de Oliveira, T.C.R.M. Development of a multiplex real-time PCR assay with an internal amplification control for the detection of Campylobacter spp. and Salmonella spp. in chicken meat. LWT Food Sci. Technol. 2016, 72, 175–181. [Google Scholar] [CrossRef]
  31. Wolffs, P.; Norling, B.R.; Hoorfar, J.; Griffiths, M.; Rådström, P. Quantification of Campylobacter spp. in chicken rinse samples by using flotation prior to real-time PCR. Appl. Environ. Microbiol. 2005, 71, 5759–5764. [Google Scholar] [CrossRef] [Green Version]
  32. Wolffs, P.F.; Glencross, K.; Norling, B.; Griffiths, M.W. Simultaneous quantification of pathogenic Campylobacter and Salmonella in chicken rinse fluid by a flotation and real-time multiplex PCR procedure. Int. J. Food Microbiol. 2007, 117, 50–54. [Google Scholar] [CrossRef] [PubMed]
  33. Khan, I.; Edge, T. Development of a novel triplex PCR assay for the detection and differentiation of thermophilic species of Campylobacter using 16S-23S rDNA internal transcribed spacer (ITS) region. J. Appl. Microbiol. 2007, 103, 2561–2569. [Google Scholar] [CrossRef] [PubMed]
  34. Pacholewicz, E.; Swart, A.; Lipman, L.J.; Wagenaar, J.A.; Havelaar, A.H.; Duim, B. Propidium monoazide does not fully inhibit the detection of dead Campylobacter on broiler chicken carcasses by qPCR. J. Microbiol. Methods 2013, 95, 32–38. [Google Scholar] [CrossRef] [PubMed]
  35. Rédei, G.P. Genetics Manual: Current Theory, Concepts, Terms; World Scientific: Singapore, 1998. [Google Scholar]
  36. Osimani, A.; Aquilanti, L.; Pasquini, M.; Clementi, F. Prevalence and risk factors for thermotolerant species of Campylobacter in poultry meat at retail in Europe. Poult. Sci. 2017, 96, 3382–3391. [Google Scholar] [CrossRef] [PubMed]
  37. Rasschaert, G.; Houf, K.; van Hende, J.; De Zutter, L. Campylobacter contamination during poultry slaughter in Belgium. J. Food Prot. 2006, 69, 27–33. [Google Scholar] [CrossRef]
  38. Lynch, Ó.A.; Cagney, C.; McDowell, D.A.; Duffy, G. Occurrence of fastidious Campylobacter spp. in fresh meat and poultry using an adapted cultural protocol. Int. J. Food Microbiol. 2011, 150, 171–177. [Google Scholar] [CrossRef] [PubMed]
  39. Sinulingga, T.S.; Aziz, S.A.; Bitrus, A.A.; Zunita, Z.; Abu, J. Occurrence of Campylobacter species from broiler chickens and chicken meat in Malaysia. Trop. Anim. Health Prod. 2020, 52, 151–157. [Google Scholar] [CrossRef]
  40. Di Giannatale, E.; Calistri, P.; Di Donato, G.; Decastelli, L.; Goffredo, E.; Adriano, D.; Mancini, M.E.; Galleggiante, A.; Neri, D.; Antoci, S. Thermotolerant Campylobacter spp. in chicken and bovine meat in Italy: Prevalence, level of contamination and molecular characterization of isolates. PLoS ONE 2019, 14, e0225957. [Google Scholar] [CrossRef] [Green Version]
  41. Szosland-Fałtyn, A.; Bartodziejska, B.; Krolasik, J.; Paziak-Domańska, B.; Korsak, D.; Chmiela, M. The prevalence of Campylobacter spp. in Polish poultry meat. Pol. J. Microbiol. 2018, 67, 117–120. [Google Scholar] [CrossRef] [Green Version]
  42. Korsak, D.; Maćkiw, E.; Rożynek, E.; Żyłowska, M. Prevalence of Campylobacter spp. in retail chicken, turkey, pork, and beef meat in Poland between 2009 and 2013. J. Food Prot. 2015, 78, 1024–1028. [Google Scholar] [CrossRef] [PubMed]
Figure 1. Workflow of the work performed for the detection of Campylobacter spp. in chicken samples.
Foods 10 02341 g001
Figure 2. Specificity test with CampyPFW-CampyPRW at 58 °C annealing temperature. Line 1:-; Line 2: 100 bp DNA Ladder (Sigma. Inc., Milan, Italy); line 3: Campylobacter jejuni DSM 4688; line 4: C. coli DSM 24155; line 5: C. lari DSM 11375; line 6: C. upsaliensis DSM 5365; line 7: C. fetus DSM 5361; line 8: Helicobacter suis DSM 19735; line 9: H. pylori DSM 7492; line 10: H. pylori ICSS; line 11: Arcobacter butzleri DSM 8739; line 12: Bacillus cereus DI4A RC3; line 13: Escherichia coli DISTAM; line 14: Lactobacillus plantarum ATCC RAA 793; line 15: Saccharomyces cerevisiae ATCC 36024.
Foods 10 02341 g002
Figure 3. Calibration curves obtained using decimal dilution of DNA (a) and Campylobacter cells (b). (a) Standard curve of serial decimal dilutions of DNA of Campylobacter jejuni DSM 4688. The curve was obtained by plotting the threshold cycle (Ct) of each DNA dilution vs. the DNA concentration (ng/μL). (b) Standard curve of serial decimal dilutions of C. jejuni DSM 4688 cells. The curve was obtained by plotting the Ct of each cell dilution vs. the cell concentration of 2.09 × 10⁸, 7.38 × 10⁶, 2.66 × 10⁴, and 5.9 × 10² cell/mL.
Foods 10 02341 g003
Table 1. Microbial enumeration obtained for chicken samples of 10 g analyzed for total viable count, Enterobacteriaceae, coliforms, E. coli, yeasts, and molds expressed in Colony Forming Units (CFU)/g.
SamplesTotal Viable CountEnterobacteriaceaeColiformsE. coliYeastsMolds
1 CC9.9 × 1073.8 × 1032.0 × 1031.7 × 1032.3 × 104<50 *
2 CC5.1 × 1051.1 × 1039.8 × 1012.0 × 1021.9 × 103<50 *
3 CC1.9 × 1059.4 × 1021.3 × 1017.4 × 1027.8 × 102<50 *
4 CC4.8 × 1061.2 × 1043.0 × 1035.3 × 1039.4 × 104<50 *
5 CC9.5 × 1062.1 × 1047.0 × 1031.3 × 1036.3 × 105<50 *
6 CS7.3 × 1051.7 × 1032.3 × 1037.6 × 1026.6 × 104<50 *
7 CC9.6 × 1059.2 × 1036.4 × 1034.7 × 1023.3 × 104<50 *
8 CC9.8 × 1045.2 × 1035.2 × 1033.2 × 1021.5 × 103<50 *
9 CC1.8 × 1052.7 × 1031.4 × 1033.5 × 1022.2 × 103<50 *
10 CC1.3 × 1041.5 × 1037.7 × 1028.3 × 1011.7 × 102<50 *
11 CC2.1 × 1062.1 × 1024.2 × 1012.0 × 1016.1 × 103<50 *
12 CC7.0 × 1052.6 × 103<50 *8.0 × 1022.0 × 104<50 *
13 CC1.2 × 1079.6 × 1039.5 × 1012.7 × 1023.5 × 104<50 *
14 CC1.7 × 1072.4 × 1033.0 × 1020.6 × 1035.3 × 104<50 *
15 CC3.7 × 1076.9 × 1036.5 × 1012.2 × 1034.5 × 104<50 *
16 CC1.1 × 1071.6 × 1045.6 × 1022.6 × 1022.4 × 105<50 *
17 CC<50 *3.3 × 102<50 *3.1 × 102<50 *<50 *
18 CC3.3 × 1092.1 × 1043.2 × 1046.0 × 1024.9 × 105<50 *
19 CC3.8 × 1095.4 × 1031.3 × 104<50 *3.9 × 105<50 *
20 CC5.1 × 1092.4 × 1042.4 × 1041.5 × 1025.4 × 105<50 *
* Limit of detection of the method.
Table 2. Results of the ISO10272-1:2006 analyzing 10 g of chicken meat expressed as presence (+) or absence (−) of Campylobacter spp. by streaking on selective media mCCDA *, SKR °, and CAB § used after 4–6 h at 37 °C and 40–48 h at 41.5 °C and 25 °C. Oxidase and motility tests were performed on isolates.
SamplemCCDA *SKR °CAB §Confirmation Medium CAB OxidaseMotility
41.5 °C, Aerobic25 °C, Microaerophilic
1 CC++++
2 CC++++
3 CC++++
4 CC+++++
5 CC+++++
6 CC+++++
7 CC+++++
8 CC++++
9 CC++++++
10 CC++++
11 CC
12 CC
13 CC
14 CC
15 CC
16 CC+++++
17 CC+++++
18 CC++++++
19 CC++++++
20 CC++++++
* Modified Charcoal Cefoperazone Deoycholate Agar; ° Skirrow’s medium; § Columbia agar base.
Table 3. Chicken samples (CC) analysed by qPCR at t0 and at t48. Mean Ct values with standard deviation (SD); cell quantification expressed in cell/mL; and DNA quantification expressed in fg/µL.
CC
Samples
t0t48
Mean Ct ± DSCell/mLDNA fg/uLMean Ct ± DSDNA fg/uL
1 CC27.55 ± 0.25--26.99 ± 0.16-
2 CC24.87 ± 0.103.60 × 1031.96 × 10213.19 ± 0.196.54 × 105
3 CC23.62 ± 0.389.27 × 1034.67 × 10212.97 ± 0.037.62 × 105
4 CC27.45 ± 0.22--27.40 ± 0.23-
5 CC28.1 ± 0.25--28.15 ± 0.17
6 CC28.3 ± 0.19--29.91 ± 0.09
7 CC28.58 ± 0.42--28.46 ± 0.23
8 CC23.95 ± 0.057.22 × 1033.71 × 10218.89 ± 0.101.25 × 104
9 CC27.3 ± 0.19--22.81 ± 0.188.20 × 102
10 CC25.91 ± 0.141.78 × 1039.59 × 10119.25 ± 0.259.72 × 103
11 CC27.94 ± 0.18 27.72 ± 0. 28
12 CC27.58 ± 0.23--26.48 ± 0.09
13 CC27.06 ± 0.10--26.68 ± 0.32
14 CC27.07 ± 0.18--26.82 ± 0.12
15 CC27.34 ± 0.25--26.74 ± 0.10
16 CC28.05 ± 0.15--25.98 ± 0.089.07 × 101
17 CC25.94 ± 0.321.60 × 1039.32 × 10122.62 ± 0.329.29 × 102
18 CC30.83 ± 0.39--27.33 ± 0.34
19 CC28.7 ± 0.31--26.96 ± 0.33
20 CC28.41 ± 0.35--27.10 ± 0.32
Publisher’s Note: MDPI stays neutral with regard to jurisdictional claims in published maps and institutional affiliations.

