
Monitoring of Food Waste Anaerobic Digestion Performance: Conventional Co-Substrates vs. Unmarketable Biochar Additions


Abstract
:
1. Introduction
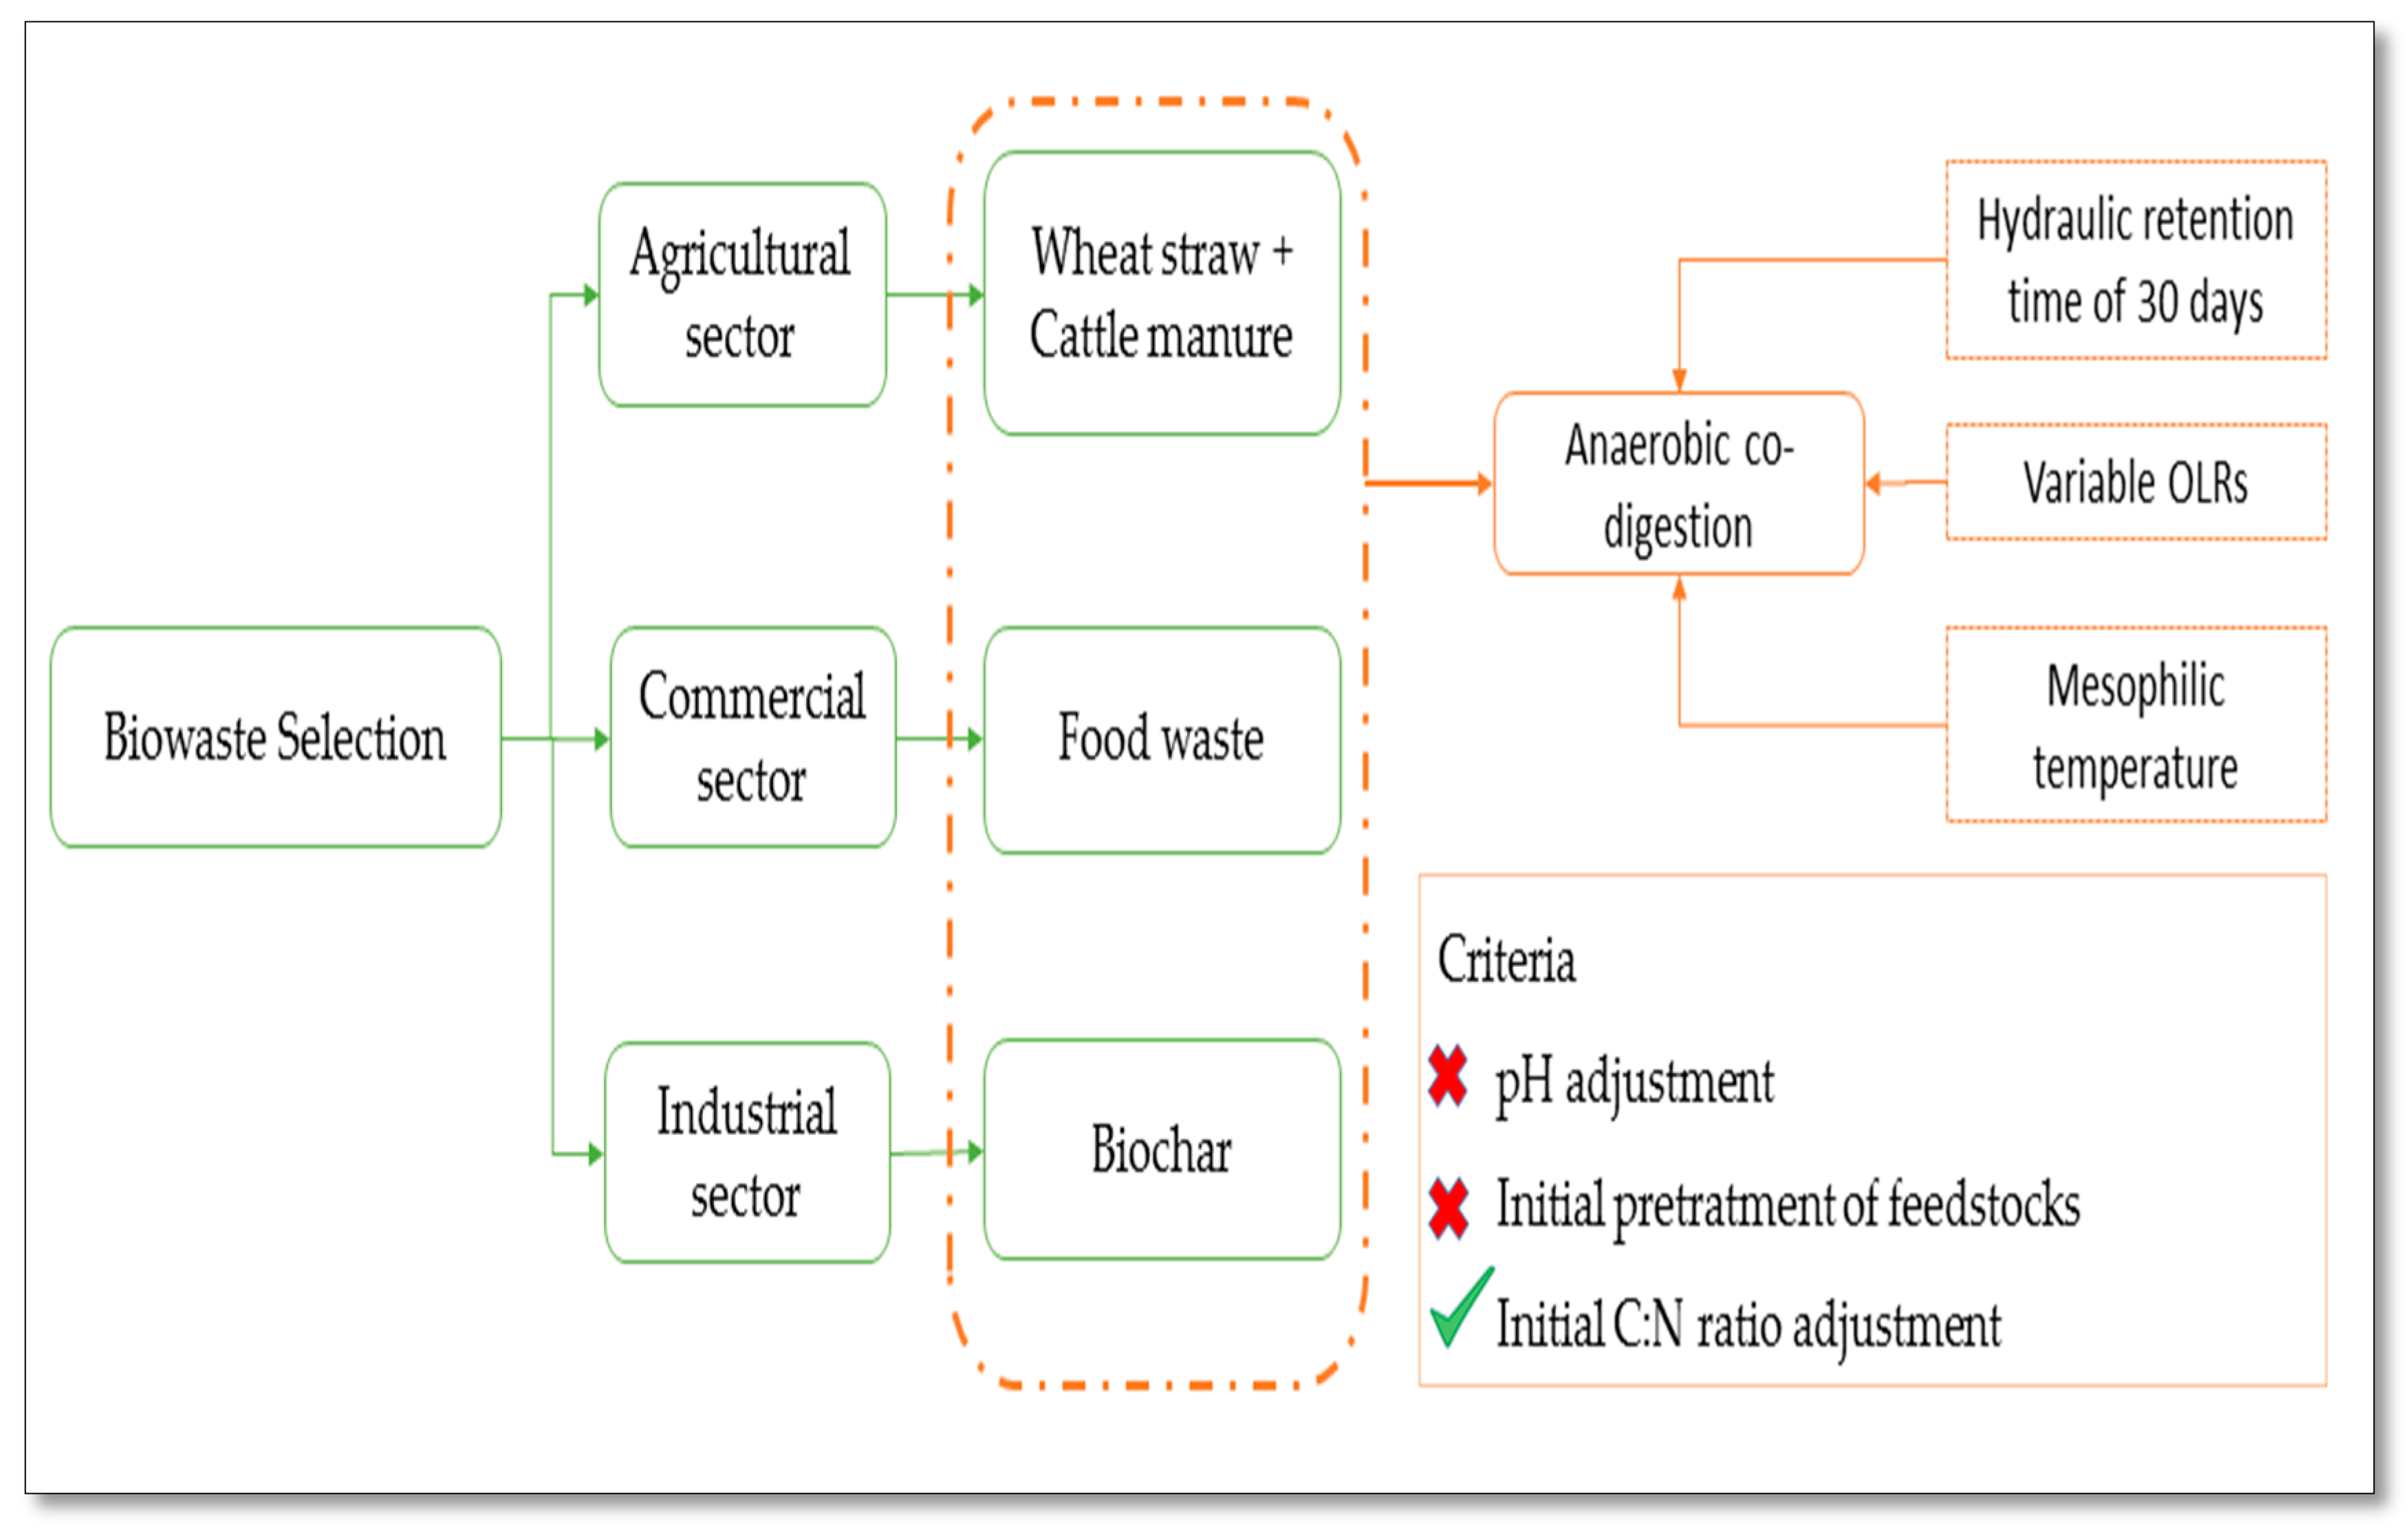
2. Overall Concept
3. Materials and Methods
3.1. Substrate Selection
3.2. Samples and Inoculum Preparation
3.3. Experimental Setup
- R1: 100% FW;
- R2: 60% FW+ 20% CM+ 20% WS (w/w);
- R3: 90% FW+ 10% UBc (w/w);
3.4. Analytical Methods
3.5. Statistical Analysis
4. Results and Discussion
4.1. Properties of the Raw Material
4.2. Effect of Co-Substrate Addition on Startup Conditions of FW-ACoD
4.3. Effect of Co-Substrate Addition on ACoD Performance under Variable OLRs
4.3.1. Early Warning Indicators for FW-ACoD Monitoring under Variable OLRs: Specific Biogas Yields vs. VFAs, Alkalinity, and VFAs: TAC Ratio
4.3.2. Early Warning Indicators for FW-ACoD Monitoring under Variable OLRs: Specific Methane Yields vs. pH Fluctuations
4.3.3. Co-Substrate Addition Effects on Digestate Characteristics
5. Conclusions and Perspectives
- A roadmap is definitely required to highlight the accessibility of the selected co-substrates;
- An in-depth review of various indicators such as socio-economic and environmental aspects is obligatory;
- Appropriate biogas and/or composting plant design (in terms of capacity, OLR, HRT, cost, etc.) is mandatory to optimize energy and compost use.
Author Contributions
Funding
Institutional Review Board Statement
Informed Consent Statement
Data Availability Statement
Acknowledgments
Conflicts of Interest
References
- Rennkamp, B.; Haunss, S.; Wongsa, K.; Ortega, A.; Casamadrid, E. Competing Coalitions: The Politics of Renewable Energy and Fossil Fuels in Mexico, South Africa and Thailand. Energy Res. Soc. Sci. 2017, 34, 214–223. [Google Scholar] [CrossRef]
- Bacenetti, J. Editorial Overview: Water–Energy–Food Nexus. Curr. Opin. Environ. Sci. Health 2020, 13, A1–A4. [Google Scholar] [CrossRef]
- Ben Mbarek, M.; Saidi, K.; Rahman, M.M. Renewable and Non-Renewable Energy Consumption, Environmental Degradation and Economic Growth in Tunisia. Qual. Quant. 2018, 52, 1105–1119. [Google Scholar] [CrossRef]
- Huiru, Z.; Yunjun, Y.; Liberti, F.; Pietro, B.; Fantozzi, F. Technical and Economic Feasibility Analysis of an Anaerobic Digestion Plant Fed with Canteen Food Waste. Energy Convers. Manag. 2019, 180, 938–948. [Google Scholar] [CrossRef]
- Bedoić, R.; Čuček, L.; Ćosić, B.; Krajnc, D.; Smoljanić, G.; Kravanja, Z.; Ljubas, D.; Pukšec, T.; Duić, N. Green Biomass to Biogas–A Study on Anaerobic Digestion of Residue Grass. J. Clean. Prod. 2019, 213, 700–709. [Google Scholar] [CrossRef]
- Al Seadi, T.; Rutz, D.; Prassl, H.; Köttner, M.; Finsterwalder, T.; Volk, S.; Janssen, R. Biogas Handbook; University of Southern Denmark Esbjerg: Esbjerg, Denmark, 2008; ISBN 978-87-992962-0-0. [Google Scholar]
- Caruso, M.C.; Braghieri, A.; Capece, A.; Napolitano, F.; Romano, P.; Galgano, F.; Altieri, G.; Genovese, F. Recent Updates on the Use of Agro-Food Waste for Biogas Production. Appl. Sci. 2019, 9, 1217. [Google Scholar] [CrossRef] [Green Version]
- Ritchie, H.; Roser, M. CO2 and Greenhouse Gas Emissions. Our World Data. 2020, 3, 640–652. [Google Scholar]
- Lyčková, B.; Mudruňka, J.; Kučerová, R. The Quality and Characteristics of Final Substrates from Different Composting Technologies. Key Eng. Mater. 2020, 838, 151–156. [Google Scholar] [CrossRef]
- Xu, F.; Li, Y.; Ge, X.; Yang, L.; Li, Y. Anaerobic Digestion of Food Waste–Challenges and Opportunities. Bioresour. Technol. 2018, 247, 1047–1058. [Google Scholar] [CrossRef] [PubMed]
- Mane, A.B.; Rao, B.; Rao, A.B. Characterisation of Fruit and Vegetable Waste for Maximizing The Biogas Yield. Int. J. Adv. Technol. Eng. Sci. 2015, 3, 489–500. [Google Scholar]
- Akturk, A.S.; Demirer, G.N. Improved Food Waste Stabilization and Valorization by Anaerobic Digestion Through Supplementation of Conductive Materials and Trace Elements. Sustainability 2020, 12, 5222. [Google Scholar] [CrossRef]
- Owamah, H.I.; Izinyon, O.C. The Effect of Organic Loading Rates (OLRs) on the Performances of Food Wastes and Maize Husks Anaerobic Co-Digestion in Continuous Mode. Sustain. Energy Technol. Assess. 2015, 11, 71–76. [Google Scholar] [CrossRef] [Green Version]
- Cattle, S.R.; Robinson, C.; Whatmuff, M. The Character and Distribution of Physical Contaminants Found in Soil Previously Treated with Mixed Waste Organic Outputs and Garden Waste Compost. Waste Manag. 2020, 101, 94–105. [Google Scholar] [CrossRef]
- Arelli, V.; Begum, S.; Anupoju, G.R.; Kuruti, K.; Shailaja, S. Dry Anaerobic Co-Digestion of Food Waste and Cattle Manure: Impact of Total Solids, Substrate Ratio and Thermal Pre Treatment on Methane Yield and Quality of Biomanure. Bioresour. Technol. 2018, 253, 273–280. [Google Scholar] [CrossRef]
- Kainthola, J.; Kalamdhad, A.S.; Goud, V.V. Optimization of Process Parameters for Accelerated Methane Yield from Anaerobic Co-Digestion of Rice Straw and Food Waste. Renew. Energy 2020, 149, 1352–1359. [Google Scholar] [CrossRef]
- Alwani, M.S.; Khalil, H.P.S.A.; Asniza, M.; Suhaily, S.S.; Amiranajwa, A.S.N.; Jawaid, M. Agricultural Biomass Raw Materials: The Current State and Future Potentialities. In Biomass and Bioenergy: Processing and Properties; Hakeem, K.R., Jawaid, M., Rashid, U., Eds.; Springer International Publishing: Cham, Germany, 2014; pp. 77–100. ISBN 978-3-319-07641-6. [Google Scholar]
- Bardi, M.J.; Aminirad, H. Synergistic Effects of Co-Trace Elements on Anaerobic Co-Digestion of Food Waste and Sewage Sludge at High Organic Load. Environ. Sci. Pollut. Res. 2020, 27, 18129–18144. [Google Scholar] [CrossRef]
- Zhang, C.; Xiao, G.; Peng, L.; Su, H.; Tan, T. The Anaerobic Co-Digestion of Food Waste and Cattle Manure. Bioresour. Technol. 2013, 129, 170–176. [Google Scholar] [CrossRef]
- Dioha, I.J.; Ikeme, C.H.; Nafi’u, T.; Soba, N.I. Effect of Carbon to Nitrogen Ratio on Biogas Production. Int. Res. J. Nat. Sci. 2013, 1, 10. [Google Scholar]
- Hassan, M.; Ding, W.; Umar, M.; Rasool, G. Batch and Semi-Continuous Anaerobic Co-Digestion of Goose Manure with Alkali Solubilized Wheat Straw: A Case of Carbon to Nitrogen Ratio and Organic Loading Rate Regression Optimization. Bioresour. Technol. 2017, 230, 24–32. [Google Scholar] [CrossRef]
- Kaldis, F.; Cysneiros, D.; Day, J.; Karatzas, K.-A.G.; Chatzifragkou, A. Anaerobic Digestion of Steam-Exploded Wheat Straw and Co-Digestion Strategies for Enhanced Biogas Production. Appl. Sci. 2020, 10, 8284. [Google Scholar] [CrossRef]
- Zahan, Z.; Georgiou, S.; Muster, T.H.; Othman, M.Z. Semi-Continuous Anaerobic Co-Digestion of Chicken Litter with Agricultural and Food Wastes: A Case Study on the Effect of Carbon/Nitrogen Ratio, Substrates Mixing Ratio and Organic Loading. Bioresour. Technol. 2018, 270, 245–254. [Google Scholar] [CrossRef]
- Chaher, N.E.H.; Hemidat, S.; Thabit, Q.; Chakchouk, M.; Nassour, A.; Hamdi, M.; Nelles, M. Potential of Sustainable Concept for Handling Organic Waste in Tunisia. Sustainability 2020, 12, 8167. [Google Scholar] [CrossRef]
- Shi, X.; Guo, X.; Zuo, J.; Wang, Y.; Zhang, M. A Comparative Study of Thermophilic and Mesophilic Anaerobic Co-Digestion of Food Waste and Wheat Straw: Process Stability and Microbial Community Structure Shifts. Waste Manag. 2018, 75, 261–269. [Google Scholar] [CrossRef]
- Agyarko-Mintah, E.; Cowie, A.; Van Zwieten, L.; Singh, B.P.; Smillie, R.; Harden, S.; Fornasier, F. Biochar Lowers Ammonia Emission and Improves Nitrogen Retention in Poultry Litter Composting. Waste Manag. 2017, 61, 129–137. [Google Scholar] [CrossRef] [PubMed]
- Calabrò, P.S.; Fazzino, F.; Folino, A.; Paone, E.; Komilis, D. Semi-Continuous Anaerobic Digestion of Orange Peel Waste: Effect of Activated Carbon Addition and Alkaline Pretreatment on the Process. Sustainability 2019, 11, 3386. [Google Scholar] [CrossRef] [Green Version]
- Calabrò, P.S.; Fazzino, F.; Folino, A.; Scibetta, S.; Sidari, R. Improvement of Semi-Continuous Anaerobic Digestion of Pre-Treated Orange Peel Waste by the Combined Use of Zero Valent Iron and Granular Activated Carbon. Biomass Bioenergy 2019, 129, 105337. [Google Scholar] [CrossRef]
- Chiappero, M.; Norouzi, O.; Hu, M.; Demichelis, F.; Berruti, F.; Di Maria, F.; Mašek, O.; Fiore, S. Review of Biochar Role as Additive in Anaerobic Digestion Processes. Renew. Sustain. Energy Rev. 2020, 131, 110037. [Google Scholar] [CrossRef]
- Rasapoor, M.; Young, B.; Asadov, A.; Brar, R.; Sarmah, A.K.; Zhuang, W.-Q.; Baroutian, S. Effects of Biochar and Activated Carbon on Biogas Generation: A Thermogravimetric and Chemical Analysis Approach. Energy Convers. Manag. 2020, 203, 112221. [Google Scholar] [CrossRef]
- Lim, E.Y.; Tian, H.; Chen, Y.; Ni, K.; Zhang, J.; Tong, Y.W. Methanogenic Pathway and Microbial Succession during Start-up and Stabilization of Thermophilic Food Waste Anaerobic Digestion with Biochar. Bioresour. Technol. 2020, 314, 123751. [Google Scholar] [CrossRef]
- De Jonge, N.; Davidsson, Å.; la Cour Jansen, J.; Nielsen, J.L. Characterisation of Microbial Communities for Improved Management of Anaerobic Digestion of Food Waste. Waste Manag. 2020, 117, 124–135. [Google Scholar] [CrossRef]
- Choudhury, A.; Lansing, S. Biochar Addition with Fe Impregnation to Reduce H2S Production from Anaerobic Digestion. Bioresour. Technol. 2020, 306, 123121. [Google Scholar] [CrossRef]
- Wang, G.; Gao, X.; Li, Q.; Zhao, H.; Liu, Y.; Wang, X.C.; Chen, R. Redox-Based Electron Exchange Capacity of Biowaste-Derived Biochar Accelerates Syntrophic Phenol Oxidation for Methanogenesis via Direct Interspecies Electron Transfer. J. Hazard. Mater. 2020, 390, 121726. [Google Scholar] [CrossRef]
- Wang, P.; Wang, H.; Qiu, Y.; Ren, L.; Jiang, B. Microbial Characteristics in Anaerobic Digestion Process of Food Waste for Methane Production–A Review. Bioresour. Technol. 2018, 248, 29–36. [Google Scholar] [CrossRef] [PubMed]
- Zhang, L.; Lim, E.Y.; Loh, K.-C.; Ok, Y.S.; Lee, J.T.E.; Shen, Y.; Wang, C.-H.; Dai, Y.; Tong, Y.W. Biochar Enhanced Thermophilic Anaerobic Digestion of Food Waste: Focusing on Biochar Particle Size, Microbial Community Analysis and Pilot-Scale Application. Energy Convers. Manag. 2020, 209, 112654. [Google Scholar] [CrossRef]
- Caillet, H.; Adelard, L. Start-Up Strategy and Process Performance of Semi-Continuous Anaerobic Digestion of Raw Sugarcane Vinasse. Waste Biomass Valor. 2020. [Google Scholar] [CrossRef]
- Parra-Orobio, B.A.; Donoso-Bravo, A.; Ruiz-Sánchez, J.C.; Valencia-Molina, K.J.; Torres-Lozada, P. Effect of Inoculum on the Anaerobic Digestion of Food Waste Accounting for the Concentration of Trace Elements. Waste Manag. 2018, 71, 342–349. [Google Scholar] [CrossRef]
- Rajput, A.A.; Sheikh, Z. Effect of Inoculum Type and Organic Loading on Biogas Production of Sunflower Meal and Wheat Straw. Sustain. Environ. Res. 2019, 29, 4. [Google Scholar] [CrossRef] [Green Version]
- Kuruti, K.; Begum, S.; Ahuja, S.; Anupoju, G.R.; Juntupally, S.; Gandu, B.; Ahuja, D.K. Exploitation of Rapid Acidification Phenomena of Food Waste in Reducing the Hydraulic Retention Time (HRT) of High Rate Anaerobic Digester without Conceding on Biogas Yield. Bioresour. Technol. 2017, 226, 65–72. [Google Scholar] [CrossRef]
- Bi, S.; Hong, X.; Yang, H.; Yu, X.; Fang, S.; Bai, Y.; Liu, J.; Gao, Y.; Yan, L.; Wang, W.; et al. Effect of Hydraulic Retention Time on Anaerobic Co-Digestion of Cattle Manure and Food Waste. Renew. Energy 2020, 150, 213–220. [Google Scholar] [CrossRef]
- Wang, K.; Yin, J.; Shen, D.; Li, N. Anaerobic Digestion of Food Waste for Volatile Fatty Acids (VFAs) Production with Different Types of Inoculum: Effect of PH. Bioresour. Technol. 2014, 161, 395–401. [Google Scholar] [CrossRef] [PubMed]
- Amri, F. Carbon Dioxide Emissions, Total Factor Productivity, ICT, Trade, Financial Development, and Energy Consumption: Testing Environmental Kuznets Curve Hypothesis for Tunisia. Environ. Sci. Pollut. Res. 2018, 25, 33691–33701. [Google Scholar] [CrossRef] [PubMed]
- Zhang, Y.; Fang, J.; Wang, S.; Yao, H. Energy-Water Nexus in Electricity Trade Network: A Case Study of Interprovincial Electricity Trade in China. Appl. Energy 2020, 257, 113685. [Google Scholar] [CrossRef]
- Zheng, Z.; Liu, J.; Yuan, X.; Wang, X.; Zhu, W.; Yang, F.; Cui, Z. Effect of Dairy Manure to Switchgrass Co-Digestion Ratio on Methane Production and the Bacterial Community in Batch Anaerobic Digestion. Appl. Energy 2015, 151, 249–257. [Google Scholar] [CrossRef]
- Chatterjee, B.; Mazumder, D. Role of Stage-Separation in the Ubiquitous Development of Anaerobic Digestion of Organic Fraction of Municipal Solid Waste: A Critical Review. Renew. Sustain. Energy Rev. 2019, 104, 439–469. [Google Scholar] [CrossRef]
- Zahan, Z.; Othman, M.Z. Effect of Pre-Treatment on Sequential Anaerobic Co-Digestion of Chicken Litter with Agricultural and Food Wastes under Semi-Solid Conditions and Comparison with Wet Anaerobic Digestion. Bioresour. Technol. 2019, 281, 286–295. [Google Scholar] [CrossRef]
- Choi, Y.; Ryu, J.; Lee, S.R. Influence of Carbon Type and Carbon to Nitrogen Ratio on the Biochemical Methane Potential, PH, and Ammonia Nitrogen in Anaerobic Digestion. J. Anim. Sci. Technol. 2020, 62, 74–83. [Google Scholar] [CrossRef] [PubMed] [Green Version]
- Viggi, C.C.; Simonetti, S.; Palma, E.; Pagliaccia, P.; Braguglia, C.; Fazi, S.; Baronti, S.; Navarra, M.A.; Pettiti, I.; Koch, C.; et al. Enhancing Methane Production from Food Waste Fermentate Using Biochar: The Added Value of Electrochemical Testing in Pre-Selecting the Most Effective Type of Biochar. Biotechnol. Biofuels 2017, 10, 303. [Google Scholar] [CrossRef]
- Shen, F.; Yuan, H.; Pang, Y.; Chen, S.; Zhu, B.; Zou, D.; Liu, Y.; Ma, J.; Yu, L.; Li, X. Performances of Anaerobic Co-Digestion of Fruit & Vegetable Waste (FVW) and Food Waste (FW): Single-Phase vs. Two-Phase. Bioresour. Technol. 2013, 144, 80–85. [Google Scholar] [CrossRef]
- Fermoso, F.G.; van Hullebusch, E.; Collins, G.; Roussel, J.; Mucha, A.P.; Esposito, G. (Eds.) Trace Elements in Anaerobic Biotechnologies; IWA Publishing: London, UK, 2019; ISBN 978-1-78906-022-5. [Google Scholar]
- Choong, Y.Y.; Norli, I.; Abdullah, A.Z.; Yhaya, M.F. Impacts of Trace Element Supplementation on the Performance of Anaerobic Digestion Process: A Critical Review. Bioresour. Technol. 2016, 209, 369–379. [Google Scholar] [CrossRef]
- Nordell, E.; Nilsson, B.; Påledal, S.N.; Karisalmi, K.; Moestedt, J. Co-Digestion of Manure and Industrial Waste–The Effects of Trace Element Addition. Waste Manag. 2016, 47, 21–27. [Google Scholar] [CrossRef]
- Jansson, A.T.; Patinvoh, R.J.; Horváth, I.S.; Taherzadeh, M.J. Dry Anaerobic Digestion of Food and Paper Industry Wastes at Different Solid Contents. Fermentation 2019, 5, 40. [Google Scholar] [CrossRef] [Green Version]
- Kumar, G.; Sivagurunathan, P.; Park, J.-H.; Kim, S.-H.; Kumar, G.; Sivagurunathan, P.; Park, J.-H.; Kim, S.-H. Anaerobic Digestion of Food Waste to Methane at Various Organic Loading Rates (OLRs) and Hydraulic Retention Times (HRTs): Thermophilic vs. Mesophilic Regimes. Environ. Eng. Res. 2015, 21, 69–73. [Google Scholar] [CrossRef] [Green Version]
- Logan, M.; Safi, M.; Lens, P.; Visvanathan, C. Investigating the Performance of Internet of Things Based Anaerobic Digestion of Food Waste. Process Saf. Environ. Prot. 2019, 127, 277–287. [Google Scholar] [CrossRef]
- Song, H.; Zhang, Y.; Kusch-Brandt, S.; Banks, C.J. Comparison of Variable and Constant Loading for Mesophilic Food Waste Digestion in a Long-Term Experiment. Energies 2020, 13, 1279. [Google Scholar] [CrossRef] [Green Version]
- Awasthi, M.K.; Duan, Y.; Awasthi, S.K.; Liu, T.; Zhang, Z. Effect of Biochar and Bacterial Inoculum Additions on Cow Dung Composting. Bioresour. Technol. 2019, 297, 122407. [Google Scholar] [CrossRef]
- Albert, H.A.; Li, X.; Jeyakumar, P.; Wei, L.; Huang, L.; Huang, Q.; Kamran, M.; Shaheen, S.M.; Hou, D.; Rinklebe, J.; et al. Influence of Biochar and Soil Properties on Soil and Plant Tissue Concentrations of Cd and Pb: A Meta-Analysis. Sci. Total. Environ. 2021, 755, 142582. [Google Scholar] [CrossRef]
- Giwa, A.S.; Heng, X.; Chang, F.; Wu, J.; Li, Y.; Ali, N.; Ding, S.; Wang, K. Effect of Biochar on Reactor Performance and Methane Generation during the Anaerobic Digestion of Food Waste Treatment at Long-Run Operations. J. Environ. Chem. Eng. 2019, 7, 103067. [Google Scholar] [CrossRef]
- Masih-Das, J.; Tao, W. Anaerobic Co-Digestion of Foodwaste with Liquid Dairy Manure or Manure Digestate: Co-Substrate Limitation and Inhibition. J. Environ. Manag. 2018, 223, 917–924. [Google Scholar] [CrossRef]
- Ma, H.; Hu, Y.; Kobayashi, T.; Xu, K.-Q. The Role of Rice Husk Biochar Addition in Anaerobic Digestion for Sweet Sorghum under High Loading Condition. Biotechnol. Rep. 2020, 27, e00515. [Google Scholar] [CrossRef]
- Ma, J.; Pan, J.; Qiu, L.; Wang, Q.; Zhang, Z. Biochar Triggering Multipath Methanogenesis and Subdued Propionic Acid Accumulation during Semi-Continuous Anaerobic Digestion. Bioresour. Technol. 2019, 293, 122026. [Google Scholar] [CrossRef]
- Ghinea, C.; Leahu, A. Monitoring of Fruit and Vegetable Waste Composting Process: Relationship between Microorganisms and Physico-Chemical Parameters. Processes 2020, 8, 302. [Google Scholar] [CrossRef] [Green Version]
- Cai, J.; He, P.; Wang, Y.; Shao, L.; Lü, F. Effects and Optimization of the Use of Biochar in Anaerobic Digestion of Food Wastes. Waste Manag. Res. 2016, 34, 409–416. [Google Scholar] [CrossRef] [PubMed]
- Sharma, B.; Suthar, S. Enriched Biogas and Biofertilizer Production from Eichhornia Weed Biomass in Cow Dung Biochar-Amended Anaerobic Digestion System. Environ. Technol. Innov. 2021, 21, 101201. [Google Scholar] [CrossRef]
- Lahori, A.H.; Guo, Z.; Zhang, Z.; Li, R.; Mahar, A.; Awasthi, M.K.; Shen, F.; Sial, T.A.; Kumbhar, F.; Wang, P.; et al. Use of Biochar as an Amendment for Remediation of Heavy Metal-Contaminated Soils: Prospects and Challenges. Pedosphere 2017, 27, 991–1014. [Google Scholar] [CrossRef]
- Shen, Y.; Linville, J.L.; Urgun-Demirtas, M.; Schoene, R.P.; Snyder, S.W. Producing Pipeline-Quality Biomethane via Anaerobic Digestion of Sludge Amended with Corn Stover Biochar with in-Situ CO2 Removal. Appl. Energy 2015, 158, 300–309. [Google Scholar] [CrossRef] [Green Version]
- Zakarya, I.A.; Khalib, S.N.B.; Ramzi, N.M. Effect of PH, Temperature and Moisture Content during Composting of Rice Straw Burning at Different Temperature with Food Waste and Effective Microorganisms. E3S Web Conf. 2018, 34, 02019. [Google Scholar] [CrossRef]
- Chaher, N.E.H.; Chakchouk, M.; Redjem, H.; Nassour, A.; Nelles, M.; Hamdi, M. Comparative Study of Cooked and Uncooked Food Waste Co-Composting with Green Waste and Sewage Sludge: A Case Study of Tunisia. In Recent Advances in Environmental Science from the Euro-Mediterranean and Surrounding Regions, 2nd ed.; Ksibi, M., Ghorbal, A., Chakraborty, S., Chaminé, H.I., Barbieri, M., Guerriero, G., Hentati, O., Negm, A., Lehmann, A., Römbke, J., Eds.; Springer International Publishing: Cham, Germany, 2021; pp. 777–781. [Google Scholar]


| Phase | Feeding of Digesters | Organic Loading Rate (kg VS/m3·d) | Period (Days) | ||
|---|---|---|---|---|---|
| R1: FW | R2: FW:CM:WS | R3: FW:UBc | |||
| Phase I | + | + | + | 2 | 1–61 |
| Phase II | + | + | + | 2.5 | 62–92 |
| − | + | + | 3 | 93–123 | |
| − | + | + | 3.5 | 124–154 | |
| − | + | + | 4 | 155–185 | |
| − | − | + | 4.5 | 186–216 | |
| Parameters | Units | Method of Analysis | Reference |
|---|---|---|---|
| pH | - | (1:10 w/v sample: water extract) | ISO 10390 (1994) |
| Moisture content (MC) | % of FM 1 | Using electronic oven by drying at 105 °C for 24 h | NF ISO 11465 (1994) |
| Total solids (TS) | % of FM 1 | ||
| Total carbon (TC) | % of FM 1 | TOC (%) = ((100 − Ash%) ÷ 1/8) | [44] |
| Total nitrogen (TN) | % of FM 1 | Titrimetric methods | NF ISO 11265 (1995) |
| Phosphorus (P) | % of TS 2 | Atomic absorption spectrometric methods | ISO 11885 (2007) |
| Potassium (K) | % of TS 2 | ||
| Magnesium (Mg) | % of TS 2 | Spectrometer, Thermo-Elemental ICP MS-X Series | ISO 11885 (2007) |
| Lead (Pb) | mg/kg TS | Spectrometer, Thermo-Elemental ICP MS-X Series | ISO 11885 (2007) |
| Copper (Cu) | mg/kg TS | Spectrometer, Thermo-Elemental ICP MS-X Series | ISO 11885 (2007) |
| Zinc (Zn) | mg/kg TS | Spectrometer, Thermo-Elemental ICP MS-X Series | ISO 11885 (2007) |
| Nickel (Ni) | mg/kg TS | Spectrometer, Thermo-Elemental ICP MS-X Series | ISO 11885 (2007) |
| Cadmium (Cd) | mg/kg TS | Spectrometer, Thermo-Elemental ICP MS-X Series | ISO 11885 (2007) |
| Arsenic (As) | mg/kg TS | Spectrometer, Thermo-Elemental ICP MS-X Series | ISO 11885 (2007) |
| Parameters | Units | FW | UBc | CM | WS |
|---|---|---|---|---|---|
| pH | - | 4.22 | 10.21 | 8.01 | - |
| Conductivity (EC) | (mS/cm) | 5.71 | 12.73 | - | - |
| Total solids | % of 1 FM | 26.00 | 97.60 | 7.10 | 91.10 |
| Volatile solids | % of 2 TS | 94.60 | 83.00 | 80.30 | 86.80 |
| Carbon (C) | % of FM | 20.52 | 52.47 | 42.61 | 47.63 |
| Nitrogen (N) | % of FM | 1.20 | - | 1.70 | 0.61 |
| C:N ratio | - | 17.10 | - | 25.64 | 78.08 |
| Phosphorous (P) | % of TS | 0.48 | 0.27 | 0.60 | 0.06 |
| Potassium (K) | % of TS | 0.91 | 5.21 | 2.95 | 1.74 |
| Magnesium (Mg) | % of TS | 0.09 | 2.92 | 2.82 | 0.25 |
| Calcium (Ca) | % of TS | 0.06 | 0.57 | 0.61 | 0.07 |
| Lead (Pb) | mg/kg TS | 0.91 | 1.10 | 0.85 | 0.21 |
| Copper (Cu) | mg/kg TS | 6.82 | 9.86 | 18.20 | 1.78 |
| Zinc (Zn) | mg/kg TS | 16.33 | 8.10 | 131.00 | 16.6 |
| Nickel (Ni) | mg/kg TS | 0.95 | 9.34 | 6.91 | 5.78 |
| Cadmium (Cd) | mg/kg TS | 0.07 | <0.01 | 0.19 | 0.08 |
| Chrome (Cr) | mg/kg TS | 2.31 | 67.80 | - | 10.50 |
| Arsenic (As) | mg/kg TS | 0.57 | 0.41 | 0.28 | 0.07 |
| Mercury (Hg) | mg/kg TS | <0.01 | 0.03 | <0.01 | <0.01 |
| Feedstock | OLR (kg VS/m3·d) | VFA (mg/L) | TAC (mg CaCO3/L) | VFA: TAC |
|---|---|---|---|---|
| R1: FW100 | 2.0 | a 1562.06 ± 212.01 | a 9466.06 ± 2769.74 | a 0.17 ± 0.04 |
| 2.5 | b 2461.63 ± 456.42 | b 4212.04 ± 618.71 | b 0.60 ± 0.18 | |
| 3.0 | b 3415.25 ± 529.02 | b 2167.75 ± 968.42 | b 1.89 ± 0.98 | |
| 3.5 | - | - | - | |
| 4.0 | - | - | - | |
| 4.5 | - | - | - | |
| R2: FW60CM20WS20 | 2.0 | a 1907.06 ± 264.84 | a 9950.13 ± 3322.24 | a 0.21 ± 0.07 |
| 2.5 | b 2151.88 ± 250.88 | b 5320.75 ± 769.86 | b 0.38 ± 0.03 | |
| 3.0 | b 2369.20 ± 118.72 | b 4995.45 ± 506.66 | b 0.47 ± 0.01 | |
| 3.5 | b 2761.30 ± 217.08 | b 4112.56 ± 277.58 | b 0.67 ± 0.04 | |
| 4.0 | b 2999.00 ± 320.04 | b 3575.63 ± 854.06 | b 0.89 ± 0.28 | |
| 4.5 | - | - | - | |
| R3: FW90UBc10 | 2.0 | a 1840.38 ± 230.67 | a 10207.44 ± 2531.58 | a 0.19 ± 0.03 |
| 2.5 | b 2050.50 ± 258.47 | b 7065.13 ± 228.16 | b 0.29 ± 0.04 | |
| 3.0 | b 2035.00 ± 55.92 | b 7191.50 ± 451.52 | b 0.28 ± 0.01 | |
| 3.5 | b 2028.75 ± 257.46 | b 6068.00 ± 348.09 | b 0.34 ± 0.04 | |
| 4.0 | b 3115.00 ± 932.08 | b 5842.50 ± 398.62 | b 0.53 ± 0.13 | |
| 4.5 | b 4051.25 ± 276.52 | b 3351.00 ± 437.15 | b 1.21 ± 0.26 |
| Feedstock | OLR (kg VS/m3·d) | pH | SMY (LN/kg VSin) | % CH4 |
|---|---|---|---|---|
| R1: FW100 | 2.0 | a 7.31 ± 0.61 | a 150.63 ± 31.39 | a 57.02 ± 5.54 |
| 2.5 | b 7.05 ± 0.75 | b 135.56 ± 25.31 | b 58.15 ± 5.41 | |
| 3.0 | b 6.22 ± 0.35 | b 57.42 ± 24.51 | b 34.66 ± 9.64 | |
| 3.5 | - | b 23.54 ± 4.21 | - | |
| 4.0 | - | - | - | |
| 4.5 | - | - | - | |
| R2: FW60 CM20WS20 | 2.0 | a 7.37 ± 0.41 | a 233.03 ± 15.61 | a 61.99 ± 2.18 |
| 2.5 | b 7.28 ± 0.49 | b 294.92 ± 24.96 | b 65.56 ± 1.64 | |
| 3.0 | b 7.04 ± 0.36 | b 282.22 ± 74.09 | b 64.67 ± 4.39 | |
| 3.5 | b 6.70 ± 0.12 | b 151.36 ± 21.93 | b 55.09 ± 2.27 | |
| 4.0 | b 6.05 ± 0.17 | b 47.95 ± 20.93 | b 29.27 ± 5.61 | |
| 4.5 | - | b 20.60 ± 3.85 | - | |
| R3: FW90UBc10 | 2.0 | a 7.91 ± 0.20 | a 208.28 ± 34.73 | a 66.49 ± 2.23 |
| 2.5 | b 7.86 ± 0.20 | b 279.93 ± 16.92 | b 71.08 ± 1.51 | |
| 3.0 | b 7.90 ± 0.29 | b 305.04 ± 12.02 | b 70.63 ± 4.04 | |
| 3.5 | b 7.49 ± 0.39 | b 352.02 ± 10.97 | b 72.37 ± 2.28 | |
| 4.0 | b 8.16 ± 0.28 | b 289.71 ± 41.51 | b 64.49 ± 2.64 | |
| 4.5 | b 7.14 ± 0.43 | b 137.52 ± 34.57 | b 48.42 ± 3.77 |
| Parameters | Units | D1 | D2 | D3 |
|---|---|---|---|---|
| pH | - | 7.67 | 7.79 | 8.53 |
| Conductivity (EC) | mS/cm | 5.23 | 6.12 | 11.72 |
| Moisture content (MC) | % of 1 FM | 97.50 | 97.60 | 97.30 |
| Crude ash | % of 2 TS | 32.30 | 36.40 | 44.10 |
| Carbon (C) | % of FM | 40.10 | 35.20 | 47.60 |
| Nitrogen (N) | % of FM | 4.70 | 3.70 | 3.20 |
| C:N ratio | - | 8.53 | 9.51 | 14.88 |
| Phosphorous (P) | % of TS | 3.87 | 4.17 | 4.91 |
| Potassium (K) | % of TS | 5.21 | 5.04 | 11.86 |
Publisher’s Note: MDPI stays neutral with regard to jurisdictional claims in published maps and institutional affiliations. |
© 2021 by the authors. Licensee MDPI, Basel, Switzerland. This article is an open access article distributed under the terms and conditions of the Creative Commons Attribution (CC BY) license (https://creativecommons.org/licenses/by/4.0/).
Share and Cite
Chaher, N.E.H.; Nassour, A.; Hamdi, M.; Nelles, M. Monitoring of Food Waste Anaerobic Digestion Performance: Conventional Co-Substrates vs. Unmarketable Biochar Additions. Foods 2021, 10, 2353. https://0-doi-org.brum.beds.ac.uk/10.3390/foods10102353
Chaher NEH, Nassour A, Hamdi M, Nelles M. Monitoring of Food Waste Anaerobic Digestion Performance: Conventional Co-Substrates vs. Unmarketable Biochar Additions. Foods. 2021; 10(10):2353. https://0-doi-org.brum.beds.ac.uk/10.3390/foods10102353
Chicago/Turabian StyleChaher, Nour El Houda, Abdallah Nassour, Moktar Hamdi, and Michael Nelles. 2021. "Monitoring of Food Waste Anaerobic Digestion Performance: Conventional Co-Substrates vs. Unmarketable Biochar Additions" Foods 10, no. 10: 2353. https://0-doi-org.brum.beds.ac.uk/10.3390/foods10102353